
Generative AI in the Enterprise Market By Technology (Deep Learning, Generative Adversarial Networks, Cloud Computing, and Others), By Deployment Mode (Cloud-Based and On-Premises), By Application (Content Generation, Design & Creativity), By Region and Companies - Industry Segment Outlook, Market Assessment, Competition Scenario, Trends, and Forecast 2024-2033
-
37867
-
April 2024
-
300
-


-
This report was compiled by Vishwa Gaul Vishwa is an experienced market research and consulting professional with over 8 years of expertise in the ICT industry, contributing to over 700 reports across telecommunications, software, hardware, and digital solutions. Correspondence Team Lead- ICT Linkedin | Detailed Market research Methodology Our methodology involves a mix of primary research, including interviews with leading mental health experts, and secondary research from reputable medical journals and databases. View Detailed Methodology Page
-
Quick Navigation
Report Overview
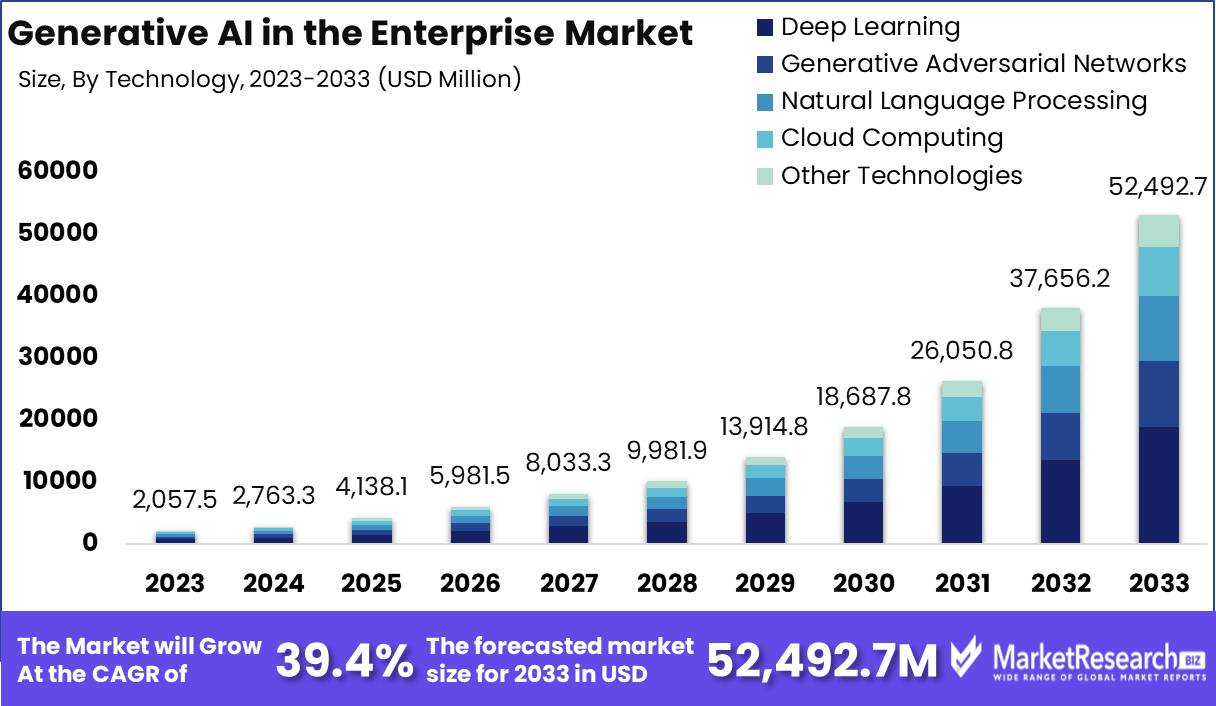
The Generative AI in the Enterprise Market size is expected to be worth around USD 52,492.7 Mn by 2033 from USD 2,057.5 Mn in 2023, growing at a CAGR of 39.4% during the forecast period from 2024 to 2033.
The surge in demand for advanced technologies and the rise in several market industries are some of the main key driving factors for generative AI in the enterprise. Generative AI in the enterprise refers to the applications of artificial intelligence technologies to automate and improve different business methods starting from customer services and sales to product development and decision making. It uses advanced algorithms and machine learning methods to produce new insights, content, and solutions.
In an enterprise context, the generative AI Model makes enterprise organizations simplify operations, enhance productivity, and propel new innovation by automating monotonous tasks, augmenting resource allocations, and identifying novel opportunities. By analyzing large datasets and learning from patterns, generative AI systems can develop customized experiences for customers, forecast market trends, and facilitate data-driven decision-making. It has the potential to extend all across diverse domains that comprise of natural language processing, computer vision, and forecasting analysis and offers a versatile accessory for solving difficult business challenges and getting a competitive edge in a rapidly growing market.
According to Study in October 2023, highlights that by 2026, more than 80% of enterprises will implement generative artificial intelligence application programming interfaces models, and deploy GenAI-enabled applications in production environments, up from less than 5% in 2023. By 2026, organizations that operationalize AI transparency, trust, and security will see their AI models achieve a 50% improvement in terms of adoption, business goals, and user acceptance.
Moreover, an article published by Oreilly in November 2023, highlights that 67% of those surveyed report that their companies are currently using generative AI, and over a third of this group (38%) report that their companies have been working with AI for less than a year. Data analysis (70%) and customer-facing applications (65%) round out the top three use cases for generative AI in the enterprise right now, with additional nods to the technology’s help in generating marketing (47%) and other forms of copy (56%).
Generative AI in enterprises enhances workflows, automates tasks, and improves decision-making methods. It nurtures new innovation by producing novel solutions and insights. Moreover, it customizes customer engagements, forecasts market trends, and enhances efficacy, ultimately propelling growth and competitiveness in vigorous business Models. The demand for generative AI in enterprises will increase due to its requirement in several verticals of industries that will help in market expansion in the coming years.
Key Takeaways
- Market Value: Generative AI in the Enterprise Market size is expected to be worth around USD 52,492.7 Mn by 2033 from USD 2,057.5 Mn in 2023, growing at a CAGR of 39.4% during the forecast period from 2024 to 2033.
- Based on Technology: Generative AI drives 30% enterprise market growth via adversarial networks
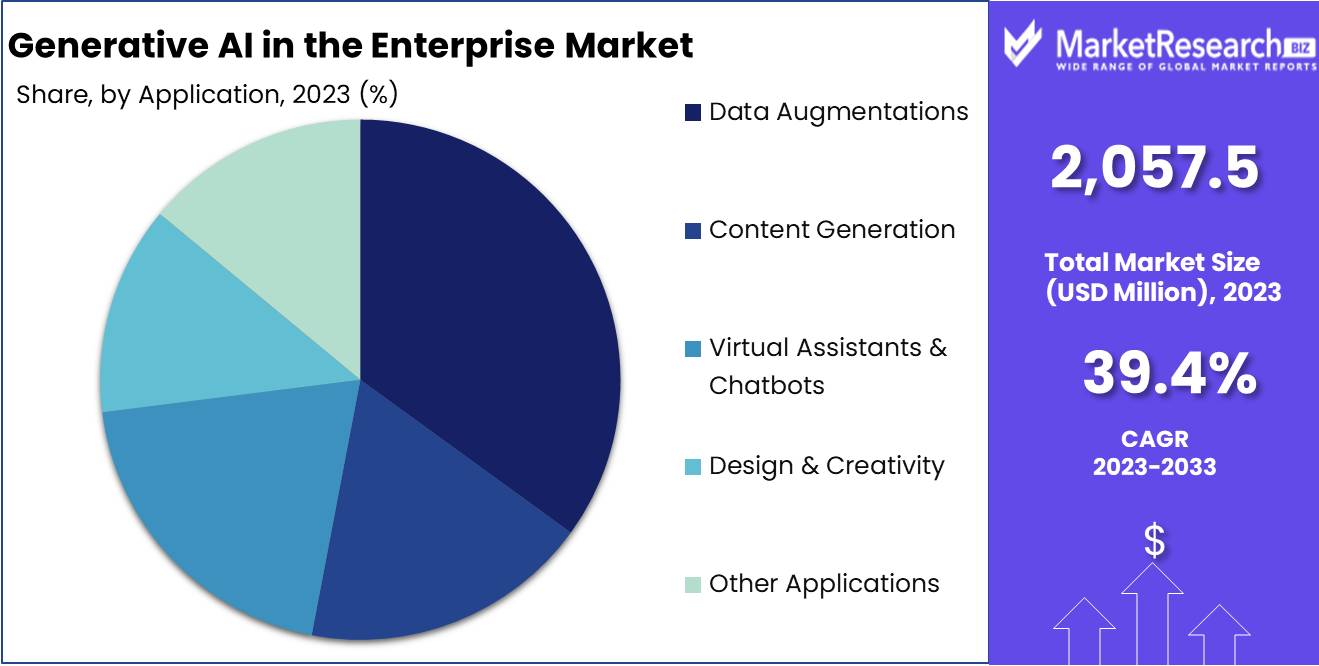
- Based on Application: Data augmentation applications lead, holding 35% of the generative AI market.
- Based on Deployment Mode: Cloud deployment dominates with 58% in the enterprise generative AI market.
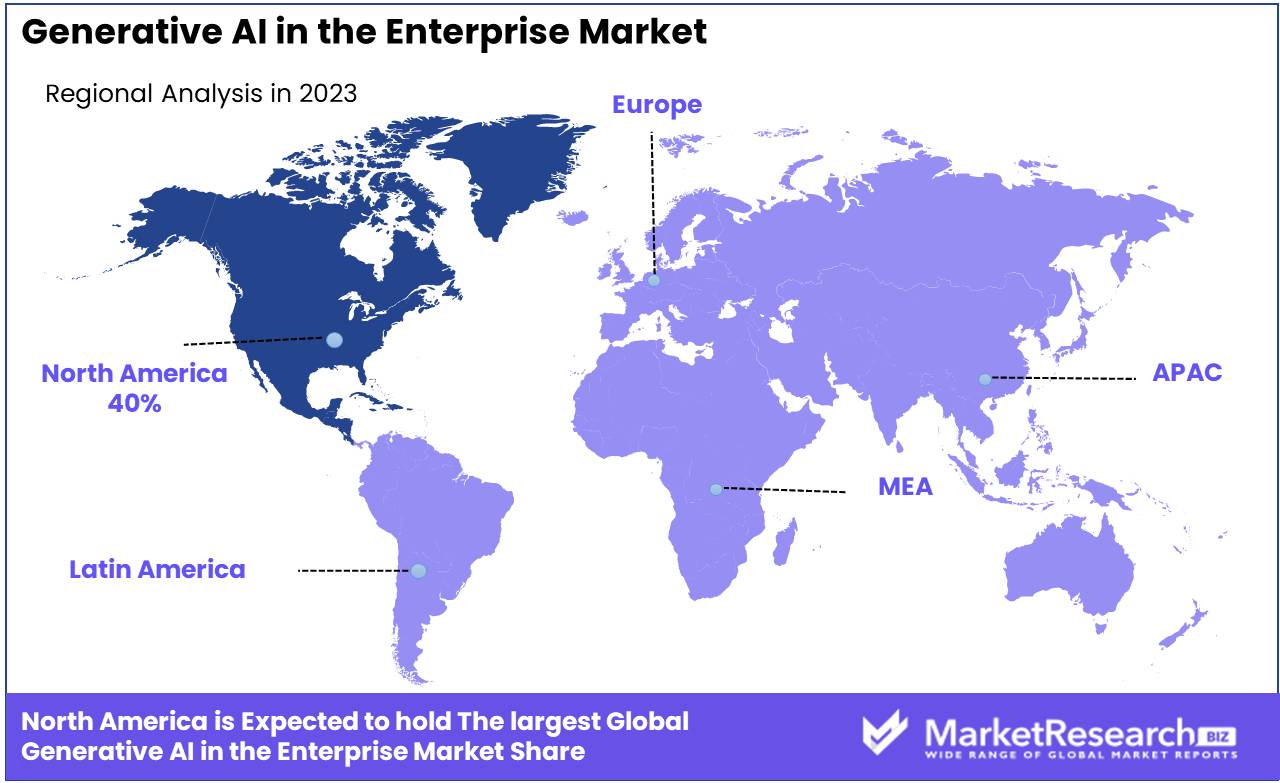
- Regional Analysis: North America holds 40% of the enterprise generative AI market.
- Growth Opportunity: In 2023, the global generative AI market is poised to revolutionize creative sectors by enhancing design and creativity, while also improving data analysis and decision-making, thereby enabling enterprises to optimize operations, innovate, and maintain a competitive edge.
Driving factors
Enhanced Customer Interaction through AI Integration
The deployment of AI-powered chatbots and virtual assistants is revolutionizing customer engagement across various sectors. These tools enable real-time, personalized interaction, significantly enhancing user experience and satisfaction. By automating routine inquiries, companies can allocate human resources to more complex issues, thus increasing efficiency and effectiveness. For instance, a chatbot capable of handling thousands of interactions simultaneously not only reduces operational costs but also improves customer response times. The impact on the market is substantial, as businesses that adopt these AI solutions often see increased customer loyalty and a boost in sales due to improved service quality.
Strengthening Fraud Detection Capabilities
AI-driven analytics are pivotal in the realm of fraud detection, offering companies a robust defense against financial and data breaches. By utilizing advanced machine learning algorithms, these systems can analyze patterns and anomalies that would be difficult for human auditors to detect. This capability is increasingly important as businesses expand digital operations and face more sophisticated threats. The adoption of these AI systems not only protects companies from potential financial losses but also safeguards their reputation, which is crucial in maintaining customer trust and confidence. The market growth driven by this need for enhanced security measures is significant, as enterprises invest heavily in AI to ensure regulatory compliance and risk management.
Automation in Content Generation
Generative AI's ability to automate content creation represents a transformative shift in how businesses produce and manage their digital content. This technology can generate written articles, marketing materials, and comprehensive reports with efficiency and scale, freeing human talent to focus on strategic and creative tasks. As generative AI tools continues to evolve, it promises not only to enhance the quality of content but also to reduce the time and resources spent on content production. This capability is especially valuable in marketing and communications, sectors where content is critical for engagement and brand positioning. Consequently, the demand for generative AI in the enterprise sector is growing as companies seek to leverage these efficiencies to gain a competitive edge.
Restraining Factors
Navigating the Challenges of Technical Complexity in Generative AI
Generative AI systems, particularly those designed for enterprise applications, often encompass complex architectures involving billions or even trillions of parameters. This complexity translates into significant challenges for enterprise organizations, not only in terms of the technical expertise required to develop and maintain such systems but also in the substantial financial investment necessary for their implementation.
The technical barriers include the need for advanced computing infrastructure and skilled personnel capable of managing and optimizing these sophisticated AI models. As a result, the growth of the generative AI market may be tempered by the readiness and capability of enterprises to handle these complexities. Small to mid-sized businesses, in particular, may find the cost-prohibitive nature of these technologies a major hurdle, thereby slowing market penetration and potentially widening the technology gap between large and smaller firms.
Ensuring Data Quality for Effective AI Deployment
The success of AI-driven solutions in the enterprise sector heavily relies on the quality and diversity of the datasets used to train these systems. High-quality, diverse data is essential for AI models to perform accurately and deliver reliable outputs. However, access to such data can be a significant constraint, particularly for industries where data may be fragmented, sensitive, or subject to stringent regulatory protections.
This issue not only affects the performance and reliability of AI applications but also restricts the scope of their deployment, particularly in critical areas such as healthcare, finance, and legal services. The lack of comprehensive, unbiased datasets can impede AI training processes, leading to models that are either ineffective or biased, which could potentially limit market growth and acceptance of generative AI technologies in sensitive sectors.
By Technology Analysis
Generative Adversarial Networks drive 30% growth in the Generative AI enterprise market, revolutionizing industry applications.
In 2023, Generative Adversarial Networks (GANs) held a dominant market position in the "Based on Technology" segment of the Generative AI in the Enterprise Market, capturing more than a 49.2% share. This prominence underscores the critical role GANs play in the broader ecosystem of AI technologies, which includes Deep Learning, Natural Language Processing (NLP), Cloud Computing, and other emerging technologies.
Generative Adversarial Networks are particularly valued for their ability to generate new, synthetic data instances that are virtually indistinguishable from real data. This capability is instrumental in various applications such as content generation, image processing, and more sophisticated simulation tasks, which are increasingly demanded across industries. The finance and healthcare sectors, for example, leverage GANs for fraud detection and drug discovery, respectively, highlighting the technology's versatility and broad market applicability.
Deep Learning, another significant technology in this segment, supports a variety of AI functions with its ability to process and learn from large data sets, thus enhancing the accuracy and efficiency of AI systems. NLP technologies facilitate human-computer interactions, and their integration into enterprise applications is expanding as businesses seek to improve customer experience and streamline operations.
Cloud Computing also plays a pivotal role by providing the necessary infrastructure and scalability for deploying these complex AI models, enabling enterprises to access AI tools and services efficiently and cost-effectively.
By Deployment Mode Analysis
Cloud deployment dominates, holding 58% of enterprise generative AI market adoption and scalability.
In 2023, Cloud held a dominant market position in the "Based on the Deployment Mode" segment of Generative AI in the Enterprise Market, capturing more than a 58% share. This significant market share underscores the pivotal role that cloud-based solutions play in facilitating the adoption and scalability of AI technologies across various industries.
The preference for cloud deployment can be attributed to several key advantages. Primarily, it offers enterprises the flexibility to scale their AI capabilities without the substantial upfront capital expenditure associated with on-premises installations. Furthermore, cloud environments provide seamless updates and maintenance of AI applications, ensuring that businesses can leverage the latest advancements without enduring downtime or additional costs.
The cloud's dominance is also driven by its capacity to democratize access to cutting-edge technologies. Small to medium-sized enterprises (SMEs), which may lack the resources to invest heavily in their own IT infrastructure, particularly benefit from cloud software. They can access sophisticated AI tools that were previously attainable only by large corporations, enabling them to compete more effectively in their respective markets.
On-premises deployment, while offering higher control over data and security, has seen slower growth due to its higher costs and complexity. However, certain sectors such as government and healthcare, where data sensitivity is paramount, continue to rely on on-premises solutions to meet stringent regulatory compliance standards.
By Application Analysis
Data augmentation applications lead, capturing 58% of the generative AI enterprise market segment.
In 2023, Data Augmentations held a dominant market position in the "Based on Application" segment of Generative AI in the Enterprise Market, capturing more than a 35% share. This substantial market share illustrates the critical importance of data augmentations in leveraging artificial intelligence to enhance the quality and effectiveness of data sets across various industries.
Data Augmentations primarily involve techniques used to expand or enhance data through methods that generate synthetic data or transform existing data. This capability is crucial for industries where large, comprehensive datasets are necessary but difficult to obtain due to constraints such as privacy issues, limited access to data, or the need for balanced datasets in training AI models. Industries such as healthcare, financial services, and automotive particularly benefit from these applications, using augmented data to improve predictive models and decision-making processes without compromising on data privacy and security.
The impact of Data augmentation extends beyond just enhancing data quality. It also enables more robust AI training processes and improved model accuracy, making AI deployments more effective and efficient. This is especially valuable in AI-driven fields like anomaly detection, risk management, and personalized customer experiences.
While Data Augmentations lead this application segment, other applications such as Content Generation, Design & Creativity, and Virtual Assistants & Chatbots also play significant roles. Content Generation, for instance, leverages generative AI to produce unique textual, visual, or audio content, whereas Design & Creativity uses AI to generate innovative design prototypes and creative materials.
Key Market Segments
Based on Technology
- Deep Learning
- Generative Adversarial Networks
- Natural Language Processing
- Cloud Computing
- Other Technologies
Based on the Deployment Mode
- Cloud
- On-premises
Based on Application
- Content Generation
- Design & Creativity
- Virtual Assistants & Chatbots
- Data Augmentations
- Other Applications
Growth Opportunity
Driving Innovation in Design and Creativity
The global generative AI market presents substantial opportunities for enterprises in 2023, particularly in enhancing creativity and design capabilities. AI-driven generative models are revolutionizing the creative sectors by assisting in complex tasks such as graphic design, generating innovative artwork, and formulating fresh ideas for product development. These capabilities enable businesses to drastically cut down on design time and explore new creative possibilities that were previously unattainable. Companies that harness these advanced tools can differentiate their products in the market, provide superior customer experiences, and maintain a competitive edge.
Enhancing Data Analysis and Decision-Making
Another significant opportunity for generative AI lies in its ability to process and analyze vast datasets to generate actionable insights. This aspect is particularly crucial as enterprises seek to leverage data-driven strategies to optimize operations and forecast market trends. By integrating generative AI technologies, companies can enhance their analytical capabilities, leading to more informed decision-making and innovative business strategies. The ability to quickly interpret complex data and provide strategic insights can significantly improve efficiency and effectiveness, driving business growth and sustainability.
Latest Trends
Revolutionizing Software Development: Code Generation, Documentation, and Quality Assurance
In 2023, one of the most impactful trends in the global generative AI market is its application in software development, specifically in code generation, documentation, and quality assurance. Generative AI technologies are becoming indispensable generative tools for developers, enabling them to write and complete sophisticated software codes more efficiently. These AI systems can also vet code for errors, handle bug fixes, automate test generation, and produce various types of technical documentation. This not only accelerates the development process but also enhances the quality and reliability of software products. Enterprises adopting these AI capabilities are likely to see significant improvements in productivity and a reduction in the time-to-market for new software solutions.
Enhancing Accuracy with Retrieval-Augmented Generation (RAG)
Another leading trend is the adoption of Retrieval-Augmented Generation (RAG). This advanced technique combines the capabilities of large language models (LLMs) with retrieval-augmented generation, enhancing the accuracy of generated outputs while minimizing errors known as "hallucinations." By integrating external information during the generation process, RAG enables LLMs to provide more precise and contextually relevant answers. This trend is particularly transformative for industries relying heavily on data accuracy and detail, such as legal, medical, and technical fields. As businesses increasingly rely on accurate and reliable data, RAG presents a compelling solution to improve the trustworthiness and utility of generative AI applications.
Regional Analysis
North America dominates 40% of the generative AI enterprise market, leading in adoption and innovation.
The enterprise market for generative AI is experiencing a dynamic expansion across various global regions, each displaying unique growth characteristics and adoption rates. North America is the dominant force, holding approximately 40% of the market. This leadership is attributed to robust technological infrastructure, significant investments in AI by major corporations, and a concentrated presence of pioneering AI firms. The U.S. leads in both the development and application of generative AI technologies, driving innovations primarily in sectors such as finance, healthcare, and retail.
In Europe, the market is driven by a strong emphasis on data privacy and ethical AI, supported by stringent regulations such as GDPR. Countries like Germany, the UK, and France are at the forefront, integrating AI into manufacturing and automotive industries. The European market is also witnessing a surge in AI startups, bolstered by favorable government policies and funding.
The Asia Pacific region is rapidly catching up, with China, Japan, and South Korea making significant advancements in AI technology. The region benefits from government backing in technology, a thriving tech startup ecosystem, and extensive manufacturing capabilities. AI adoption is particularly noticeable in consumer electronics, e-commerce, and automotive sectors.
Meanwhile, the Middle East & Africa, and Latin America are emerging as potential growth areas. The Middle East, with its strategic investments in smart cities and digital transformation, and Africa, with its untapped potential and increasing mobile penetration, are beginning to leverage AI for economic and social development. Latin America shows promise with its growing tech-savvy workforce and increasing digitalization across businesses, particularly in Brazil and Mexico.
Key Regions and Countries
North America
- US
- Canada
- Mexico
Western Europe
- Germany
- France
- The UK
- Spain
- Italy
- Portugal
- Ireland
- Austria
- Switzerland
- Benelux
- Nordic
- Rest of Western Europe
Eastern Europe
- Russia
- Poland
- The Czech Republic
- Greece
- Rest of Eastern Europe
APAC
- China
- Japan
- South Korea
- India
- Australia & New Zealand
- Indonesia
- Malaysia
- Philippines
- Singapore
- Thailand
- Vietnam
- Rest of APAC
Latin America
- Brazil
- Colombia
- Chile
- Argentina
- Costa Rica
- Rest of Latin America
Middle East & Africa
- Algeria
- Egypt
- Israel
- Kuwait
- Nigeria
- Saudi Arabia
- South Africa
- Turkey
- United Arab Emirates
- Rest of MEA
Key Players Analysis
In the rapidly evolving landscape of generative AI in the enterprise market, key players are shaping the trajectory through strategic innovations and expansive ecosystems. As of 2024, OpenAI stands out with its trailblazing language models, which have set the standard for generative AI capabilities. Their offerings not only enhance business efficiency but also foster new avenues for user interaction and content creation, placing them at the forefront of AI-driven transformation.
NVIDIA Corp. is instrumental in providing the hardware backbone necessary for running sophisticated AI algorithms. Their advanced GPU technologies and AI platforms not only power other enterprises’ AI applications but also democratize AI accessibility, enabling faster and more efficient AI deployments across various sectors.
IBM Corp. leverages its long-standing expertise in enterprise IT solutions by integrating generative AI into its portfolio, focusing on sectors such as healthcare and finance where data sensitivity and security are paramount. IBM’s emphasis on trust and transparency in AI aligns with the growing demand for ethical AI solutions.
Microsoft Corp. and Google LLC are pivotal in shaping the generative AI landscape through comprehensive cloud and AI solutions that cater to a wide range of business needs. Microsoft’s Azure AI and Google Cloud AI services provide robust, scalable platforms that support enterprise AI initiatives, driving innovation and operational agility.
Amazon Web Services, Inc. and Salesforce, Inc. enhance their cloud offerings with generative AI capabilities, focusing on personalizing customer experiences and optimizing business processes, which are crucial for competitive differentiation in today’s digital marketplace.
Adobe Inc. transforms creative industries by integrating AI into its software suites, thus streamlining content creation and enabling new forms of artistic expression, thereby reshaping creative workflows.
Top Key Players in Generative AI in the Enterprise Market
- OpenAI
- NVIDIA Corp.
- IBM Corp.
- Microsoft Corp.
- Google LLC
- Amazon Web Services, Inc.
- Adobe Inc.
- Salesforce, Inc.
- Other Key Players
Recent Development
- In April 2024, Nvidia reported a significant surge in net income for fiscal year 2024, driven by the demand for AI technologies like those enhancing ERP systems with generative AI capabilities, which are poised to transform enterprise resource planning by enabling more intuitive interactions and predictive analytics.
- In April 2024, Kore.ai, an enterprise conversational and generative AI platform, appointed Paul Rilstone as its new vice president for Australia and New Zealand to drive regional growth and expand its presence in the GenAI market, following a US$150 million funding round aimed at supporting its international expansion.
- In April 2024, Generative AI (GenAI) is revolutionizing enterprise operations by transforming tacit knowledge into actionable insights, thus enabling businesses to drive innovation, enhance decision-making, and achieve significant competitive advantages, as detailed in the report by McKinsey & Company and S&P Global Market Intelligence.
- In March 2024, Investor interest in Hewlett Packard Enterprise was reinvigorated due to a significant backlog in orders for AI servers using Nvidia GPUs, prompting a reassessment of the stock's value amidst its broader corporate transformation and upcoming acquisition of Juniper Networks, as reported by Barron’s.
Report Scope
Report Features Description Forecast Revenue (2033) USD 52,492.7 Mn CAGR (2024-2033) 39.4% Base Year for Estimation 2023 Historic Period 2016-2023 Forecast Period 2024-2033 Report Coverage Revenue Forecast, Market Dynamics, COVID-19 Impact, Competitive Landscape, Recent Developments Segments Covered By Technology (Deep Learning, Generative Adversarial Networks, Natural Language Processing, Cloud Computing, and Others), By Deployment Mode (Cloud-Based and On-Premises), By Application(Content Generation, Design & Creativity, Virtual Assistants & Chatbots, Data Augmentations, Others) Regional Analysis North America – The US, Canada, & Mexico; Western Europe – Germany, France, The UK, Spain, Italy, Portugal, Ireland, Austria, Switzerland, Benelux, Nordic, & Rest of Western Europe; Eastern Europe – Russia, Poland, The Czech Republic, Greece, & Rest of Eastern Europe; APAC – China, Japan, South Korea, India, Australia & New Zealand, Indonesia, Malaysia, Philippines, Singapore, Thailand, Vietnam, & Rest of APAC; Latin America – Brazil, Colombia, Chile, Argentina, Costa Rica, & Rest of Latin America; Middle East & Africa – Algeria, Egypt, Israel, Kuwait, Nigeria, Saudi Arabia, South Africa, Turkey, United Arab Emirates, & Rest of MEA Competitive Landscape OpenAI, NVIDIA Corp., IBM Corp., Microsoft Corp., Google LLC, Amazon Web Services, Inc., Adobe Inc., Salesforce, Inc., Other Key Players Customization Scope Customization for segments, region/country-level will be provided. Moreover, additional customization can be done based on the requirements. Purchase Options We have three licenses to opt for: Single User License, Multi-User License (Up to 5 Users), Corporate Use License (Unlimited User and Printable PDF) -
- 1. Executive Summary
- 1.1. Definition
- 1.2. Taxonomy
- 1.3. Research Scope
- 1.4. Key Analysis
- 1.5. Key Findings by Major Segments
- 1.6. Top strategies by Major Players
- 2. Global Generative AI in the Enterprise Market Overview
- 2.1. Generative AI in the Enterprise Market Dynamics
- 2.1.1. Drivers
- 2.1.2. Opportunities
- 2.1.3. Restraints
- 2.1.4. Challenges
- 2.2. Macro-economic Factors
- 2.3. Regulatory Framework
- 2.4. Market Investment Feasibility Index
- 2.5. PEST Analysis
- 2.6. PORTER’S Five Force Analysis
- 2.7. Drivers & Restraints Impact Analysis
- 2.8. Industry Chain Analysis
- 2.9. Cost Structure Analysis
- 2.10. Marketing Strategy
- 2.11. Russia-Ukraine War Impact Analysis
- 2.12. Opportunity Map Analysis
- 2.13. Market Competition Scenario Analysis
- 2.14. Product Life Cycle Analysis
- 2.15. Opportunity Orbits
- 2.16. Manufacturer Intensity Map
- 2.17. Major Companies sales by Value & Volume
- 2.1. Generative AI in the Enterprise Market Dynamics
- 3. Global Generative AI in the Enterprise Market Analysis, Opportunity and Forecast, 2016-2032
- 3.1. Global Generative AI in the Enterprise Market Analysis, 2016-2021
- 3.2. Global Generative AI in the Enterprise Market Opportunity and Forecast, 2023-2032
- 3.3. Global Generative AI in the Enterprise Market Analysis, Opportunity and Forecast, By Technology, 2016-2032
- 3.3.1. Global Generative AI in the Enterprise Market Analysis by By Technology: Introduction
- 3.3.2. Market Size Absolute $ Opportunity Analysis and Forecast, By Technology, 2016-2032
- 3.3.3. Deep Learning
- 3.3.4. Generative Adversarial Networks
- 3.3.5. Natural Language Processing
- 3.3.6. Cloud Computing
- 3.3.7. Other Technologies
- 3.4. Global Generative AI in the Enterprise Market Analysis, Opportunity and Forecast, By Deployment Mode, 2016-2032
- 3.4.1. Global Generative AI in the Enterprise Market Analysis by By Deployment Mode: Introduction
- 3.4.2. Market Size Absolute $ Opportunity Analysis and Forecast, By Deployment Mode, 2016-2032
- 3.4.3. On-premises
- 3.4.4. Cloud
- 3.5. Global Generative AI in the Enterprise Market Analysis, Opportunity and Forecast, By Application, 2016-2032
- 3.5.1. Global Generative AI in the Enterprise Market Analysis by By Application: Introduction
- 3.5.2. Market Size Absolute $ Opportunity Analysis and Forecast, By Application, 2016-2032
- 3.5.3. Content Generation
- 3.5.4. Design & Creativity
- 3.5.5. Virtual Assistants & Chatbots
- 3.5.6. Data Augmentations
- 3.5.7. Other Applications
- 4. North America Generative AI in the Enterprise Market Analysis, Opportunity and Forecast, 2016-2032
- 4.1. North America Generative AI in the Enterprise Market Analysis, 2016-2021
- 4.2. North America Generative AI in the Enterprise Market Opportunity and Forecast, 2023-2032
- 4.3. North America Generative AI in the Enterprise Market Analysis, Opportunity and Forecast, By Technology, 2016-2032
- 4.3.1. North America Generative AI in the Enterprise Market Analysis by By Technology: Introduction
- 4.3.2. Market Size Absolute $ Opportunity Analysis and Forecast, By Technology, 2016-2032
- 4.3.3. Deep Learning
- 4.3.4. Generative Adversarial Networks
- 4.3.5. Natural Language Processing
- 4.3.6. Cloud Computing
- 4.3.7. Other Technologies
- 4.4. North America Generative AI in the Enterprise Market Analysis, Opportunity and Forecast, By Deployment Mode, 2016-2032
- 4.4.1. North America Generative AI in the Enterprise Market Analysis by By Deployment Mode: Introduction
- 4.4.2. Market Size Absolute $ Opportunity Analysis and Forecast, By Deployment Mode, 2016-2032
- 4.4.3. On-premises
- 4.4.4. Cloud
- 4.5. North America Generative AI in the Enterprise Market Analysis, Opportunity and Forecast, By Application, 2016-2032
- 4.5.1. North America Generative AI in the Enterprise Market Analysis by By Application: Introduction
- 4.5.2. Market Size Absolute $ Opportunity Analysis and Forecast, By Application, 2016-2032
- 4.5.3. Content Generation
- 4.5.4. Design & Creativity
- 4.5.5. Virtual Assistants & Chatbots
- 4.5.6. Data Augmentations
- 4.5.7. Other Applications
- 4.6. North America Generative AI in the Enterprise Market Analysis, Opportunity and Forecast, By Country , 2016-2032
- 4.6.1. North America Generative AI in the Enterprise Market Analysis by Country : Introduction
- 4.6.2. Market Size Absolute $ Opportunity Analysis and Forecast, Country , 2016-2032
- 4.6.2.1. The US
- 4.6.2.2. Canada
- 4.6.2.3. Mexico
- 5. Western Europe Generative AI in the Enterprise Market Analysis, Opportunity and Forecast, 2016-2032
- 5.1. Western Europe Generative AI in the Enterprise Market Analysis, 2016-2021
- 5.2. Western Europe Generative AI in the Enterprise Market Opportunity and Forecast, 2023-2032
- 5.3. Western Europe Generative AI in the Enterprise Market Analysis, Opportunity and Forecast, By Technology, 2016-2032
- 5.3.1. Western Europe Generative AI in the Enterprise Market Analysis by By Technology: Introduction
- 5.3.2. Market Size Absolute $ Opportunity Analysis and Forecast, By Technology, 2016-2032
- 5.3.3. Deep Learning
- 5.3.4. Generative Adversarial Networks
- 5.3.5. Natural Language Processing
- 5.3.6. Cloud Computing
- 5.3.7. Other Technologies
- 5.4. Western Europe Generative AI in the Enterprise Market Analysis, Opportunity and Forecast, By Deployment Mode, 2016-2032
- 5.4.1. Western Europe Generative AI in the Enterprise Market Analysis by By Deployment Mode: Introduction
- 5.4.2. Market Size Absolute $ Opportunity Analysis and Forecast, By Deployment Mode, 2016-2032
- 5.4.3. On-premises
- 5.4.4. Cloud
- 5.5. Western Europe Generative AI in the Enterprise Market Analysis, Opportunity and Forecast, By Application, 2016-2032
- 5.5.1. Western Europe Generative AI in the Enterprise Market Analysis by By Application: Introduction
- 5.5.2. Market Size Absolute $ Opportunity Analysis and Forecast, By Application, 2016-2032
- 5.5.3. Content Generation
- 5.5.4. Design & Creativity
- 5.5.5. Virtual Assistants & Chatbots
- 5.5.6. Data Augmentations
- 5.5.7. Other Applications
- 5.6. Western Europe Generative AI in the Enterprise Market Analysis, Opportunity and Forecast, By Country , 2016-2032
- 5.6.1. Western Europe Generative AI in the Enterprise Market Analysis by Country : Introduction
- 5.6.2. Market Size Absolute $ Opportunity Analysis and Forecast, Country , 2016-2032
- 5.6.2.1. Germany
- 5.6.2.2. France
- 5.6.2.3. The UK
- 5.6.2.4. Spain
- 5.6.2.5. Italy
- 5.6.2.6. Portugal
- 5.6.2.7. Ireland
- 5.6.2.8. Austria
- 5.6.2.9. Switzerland
- 5.6.2.10. Benelux
- 5.6.2.11. Nordic
- 5.6.2.12. Rest of Western Europe
- 6. Eastern Europe Generative AI in the Enterprise Market Analysis, Opportunity and Forecast, 2016-2032
- 6.1. Eastern Europe Generative AI in the Enterprise Market Analysis, 2016-2021
- 6.2. Eastern Europe Generative AI in the Enterprise Market Opportunity and Forecast, 2023-2032
- 6.3. Eastern Europe Generative AI in the Enterprise Market Analysis, Opportunity and Forecast, By Technology, 2016-2032
- 6.3.1. Eastern Europe Generative AI in the Enterprise Market Analysis by By Technology: Introduction
- 6.3.2. Market Size Absolute $ Opportunity Analysis and Forecast, By Technology, 2016-2032
- 6.3.3. Deep Learning
- 6.3.4. Generative Adversarial Networks
- 6.3.5. Natural Language Processing
- 6.3.6. Cloud Computing
- 6.3.7. Other Technologies
- 6.4. Eastern Europe Generative AI in the Enterprise Market Analysis, Opportunity and Forecast, By Deployment Mode, 2016-2032
- 6.4.1. Eastern Europe Generative AI in the Enterprise Market Analysis by By Deployment Mode: Introduction
- 6.4.2. Market Size Absolute $ Opportunity Analysis and Forecast, By Deployment Mode, 2016-2032
- 6.4.3. On-premises
- 6.4.4. Cloud
- 6.5. Eastern Europe Generative AI in the Enterprise Market Analysis, Opportunity and Forecast, By Application, 2016-2032
- 6.5.1. Eastern Europe Generative AI in the Enterprise Market Analysis by By Application: Introduction
- 6.5.2. Market Size Absolute $ Opportunity Analysis and Forecast, By Application, 2016-2032
- 6.5.3. Content Generation
- 6.5.4. Design & Creativity
- 6.5.5. Virtual Assistants & Chatbots
- 6.5.6. Data Augmentations
- 6.5.7. Other Applications
- 6.6. Eastern Europe Generative AI in the Enterprise Market Analysis, Opportunity and Forecast, By Country , 2016-2032
- 6.6.1. Eastern Europe Generative AI in the Enterprise Market Analysis by Country : Introduction
- 6.6.2. Market Size Absolute $ Opportunity Analysis and Forecast, Country , 2016-2032
- 6.6.2.1. Russia
- 6.6.2.2. Poland
- 6.6.2.3. The Czech Republic
- 6.6.2.4. Greece
- 6.6.2.5. Rest of Eastern Europe
- 7. APAC Generative AI in the Enterprise Market Analysis, Opportunity and Forecast, 2016-2032
- 7.1. APAC Generative AI in the Enterprise Market Analysis, 2016-2021
- 7.2. APAC Generative AI in the Enterprise Market Opportunity and Forecast, 2023-2032
- 7.3. APAC Generative AI in the Enterprise Market Analysis, Opportunity and Forecast, By Technology, 2016-2032
- 7.3.1. APAC Generative AI in the Enterprise Market Analysis by By Technology: Introduction
- 7.3.2. Market Size Absolute $ Opportunity Analysis and Forecast, By Technology, 2016-2032
- 7.3.3. Deep Learning
- 7.3.4. Generative Adversarial Networks
- 7.3.5. Natural Language Processing
- 7.3.6. Cloud Computing
- 7.3.7. Other Technologies
- 7.4. APAC Generative AI in the Enterprise Market Analysis, Opportunity and Forecast, By Deployment Mode, 2016-2032
- 7.4.1. APAC Generative AI in the Enterprise Market Analysis by By Deployment Mode: Introduction
- 7.4.2. Market Size Absolute $ Opportunity Analysis and Forecast, By Deployment Mode, 2016-2032
- 7.4.3. On-premises
- 7.4.4. Cloud
- 7.5. APAC Generative AI in the Enterprise Market Analysis, Opportunity and Forecast, By Application, 2016-2032
- 7.5.1. APAC Generative AI in the Enterprise Market Analysis by By Application: Introduction
- 7.5.2. Market Size Absolute $ Opportunity Analysis and Forecast, By Application, 2016-2032
- 7.5.3. Content Generation
- 7.5.4. Design & Creativity
- 7.5.5. Virtual Assistants & Chatbots
- 7.5.6. Data Augmentations
- 7.5.7. Other Applications
- 7.6. APAC Generative AI in the Enterprise Market Analysis, Opportunity and Forecast, By Country , 2016-2032
- 7.6.1. APAC Generative AI in the Enterprise Market Analysis by Country : Introduction
- 7.6.2. Market Size Absolute $ Opportunity Analysis and Forecast, Country , 2016-2032
- 7.6.2.1. China
- 7.6.2.2. Japan
- 7.6.2.3. South Korea
- 7.6.2.4. India
- 7.6.2.5. Australia & New Zeland
- 7.6.2.6. Indonesia
- 7.6.2.7. Malaysia
- 7.6.2.8. Philippines
- 7.6.2.9. Singapore
- 7.6.2.10. Thailand
- 7.6.2.11. Vietnam
- 7.6.2.12. Rest of APAC
- 8. Latin America Generative AI in the Enterprise Market Analysis, Opportunity and Forecast, 2016-2032
- 8.1. Latin America Generative AI in the Enterprise Market Analysis, 2016-2021
- 8.2. Latin America Generative AI in the Enterprise Market Opportunity and Forecast, 2023-2032
- 8.3. Latin America Generative AI in the Enterprise Market Analysis, Opportunity and Forecast, By Technology, 2016-2032
- 8.3.1. Latin America Generative AI in the Enterprise Market Analysis by By Technology: Introduction
- 8.3.2. Market Size Absolute $ Opportunity Analysis and Forecast, By Technology, 2016-2032
- 8.3.3. Deep Learning
- 8.3.4. Generative Adversarial Networks
- 8.3.5. Natural Language Processing
- 8.3.6. Cloud Computing
- 8.3.7. Other Technologies
- 8.4. Latin America Generative AI in the Enterprise Market Analysis, Opportunity and Forecast, By Deployment Mode, 2016-2032
- 8.4.1. Latin America Generative AI in the Enterprise Market Analysis by By Deployment Mode: Introduction
- 8.4.2. Market Size Absolute $ Opportunity Analysis and Forecast, By Deployment Mode, 2016-2032
- 8.4.3. On-premises
- 8.4.4. Cloud
- 8.5. Latin America Generative AI in the Enterprise Market Analysis, Opportunity and Forecast, By Application, 2016-2032
- 8.5.1. Latin America Generative AI in the Enterprise Market Analysis by By Application: Introduction
- 8.5.2. Market Size Absolute $ Opportunity Analysis and Forecast, By Application, 2016-2032
- 8.5.3. Content Generation
- 8.5.4. Design & Creativity
- 8.5.5. Virtual Assistants & Chatbots
- 8.5.6. Data Augmentations
- 8.5.7. Other Applications
- 8.6. Latin America Generative AI in the Enterprise Market Analysis, Opportunity and Forecast, By Country , 2016-2032
- 8.6.1. Latin America Generative AI in the Enterprise Market Analysis by Country : Introduction
- 8.6.2. Market Size Absolute $ Opportunity Analysis and Forecast, Country , 2016-2032
- 8.6.2.1. Brazil
- 8.6.2.2. Colombia
- 8.6.2.3. Chile
- 8.6.2.4. Argentina
- 8.6.2.5. Costa Rica
- 8.6.2.6. Rest of Latin America
- 9. Middle East & Africa Generative AI in the Enterprise Market Analysis, Opportunity and Forecast, 2016-2032
- 9.1. Middle East & Africa Generative AI in the Enterprise Market Analysis, 2016-2021
- 9.2. Middle East & Africa Generative AI in the Enterprise Market Opportunity and Forecast, 2023-2032
- 9.3. Middle East & Africa Generative AI in the Enterprise Market Analysis, Opportunity and Forecast, By Technology, 2016-2032
- 9.3.1. Middle East & Africa Generative AI in the Enterprise Market Analysis by By Technology: Introduction
- 9.3.2. Market Size Absolute $ Opportunity Analysis and Forecast, By Technology, 2016-2032
- 9.3.3. Deep Learning
- 9.3.4. Generative Adversarial Networks
- 9.3.5. Natural Language Processing
- 9.3.6. Cloud Computing
- 9.3.7. Other Technologies
- 9.4. Middle East & Africa Generative AI in the Enterprise Market Analysis, Opportunity and Forecast, By Deployment Mode, 2016-2032
- 9.4.1. Middle East & Africa Generative AI in the Enterprise Market Analysis by By Deployment Mode: Introduction
- 9.4.2. Market Size Absolute $ Opportunity Analysis and Forecast, By Deployment Mode, 2016-2032
- 9.4.3. On-premises
- 9.4.4. Cloud
- 9.5. Middle East & Africa Generative AI in the Enterprise Market Analysis, Opportunity and Forecast, By Application, 2016-2032
- 9.5.1. Middle East & Africa Generative AI in the Enterprise Market Analysis by By Application: Introduction
- 9.5.2. Market Size Absolute $ Opportunity Analysis and Forecast, By Application, 2016-2032
- 9.5.3. Content Generation
- 9.5.4. Design & Creativity
- 9.5.5. Virtual Assistants & Chatbots
- 9.5.6. Data Augmentations
- 9.5.7. Other Applications
- 9.6. Middle East & Africa Generative AI in the Enterprise Market Analysis, Opportunity and Forecast, By Country , 2016-2032
- 9.6.1. Middle East & Africa Generative AI in the Enterprise Market Analysis by Country : Introduction
- 9.6.2. Market Size Absolute $ Opportunity Analysis and Forecast, Country , 2016-2032
- 9.6.2.1. Algeria
- 9.6.2.2. Egypt
- 9.6.2.3. Israel
- 9.6.2.4. Kuwait
- 9.6.2.5. Nigeria
- 9.6.2.6. Saudi Arabia
- 9.6.2.7. South Africa
- 9.6.2.8. Turkey
- 9.6.2.9. The UAE
- 9.6.2.10. Rest of MEA
- 10. Global Generative AI in the Enterprise Market Analysis, Opportunity and Forecast, By Region , 2016-2032
- 10.1. Global Generative AI in the Enterprise Market Analysis by Region : Introduction
- 10.2. Market Size Absolute $ Opportunity Analysis and Forecast, By Region , 2016-2032
- 10.2.1. North America
- 10.2.2. Western Europe
- 10.2.3. Eastern Europe
- 10.2.4. APAC
- 10.2.5. Latin America
- 10.2.6. Middle East & Africa
- 11. Global Generative AI in the Enterprise Market Competitive Landscape, Market Share Analysis, and Company Profiles
- 11.1. Market Share Analysis
- 11.2. Company Profiles
- 11.3. OpenAI
- 11.3.1. Company Overview
- 11.3.2. Financial Highlights
- 11.3.3. Product Portfolio
- 11.3.4. SWOT Analysis
- 11.3.5. Key Strategies and Developments
- 11.4. NVIDIA Corp.
- 11.4.1. Company Overview
- 11.4.2. Financial Highlights
- 11.4.3. Product Portfolio
- 11.4.4. SWOT Analysis
- 11.4.5. Key Strategies and Developments
- 11.5. IBM Corp.
- 11.5.1. Company Overview
- 11.5.2. Financial Highlights
- 11.5.3. Product Portfolio
- 11.5.4. SWOT Analysis
- 11.5.5. Key Strategies and Developments
- 11.6. Microsoft Corp.
- 11.6.1. Company Overview
- 11.6.2. Financial Highlights
- 11.6.3. Product Portfolio
- 11.6.4. SWOT Analysis
- 11.6.5. Key Strategies and Developments
- 11.7. Google LLC
- 11.7.1. Company Overview
- 11.7.2. Financial Highlights
- 11.7.3. Product Portfolio
- 11.7.4. SWOT Analysis
- 11.7.5. Key Strategies and Developments
- 11.8. Amazone Web Services, Inc.
- 11.8.1. Company Overview
- 11.8.2. Financial Highlights
- 11.8.3. Product Portfolio
- 11.8.4. SWOT Analysis
- 11.8.5. Key Strategies and Developments
- 11.9. Adobe Inc.
- 11.9.1. Company Overview
- 11.9.2. Financial Highlights
- 11.9.3. Product Portfolio
- 11.9.4. SWOT Analysis
- 11.9.5. Key Strategies and Developments
- 11.10. Salesforce, Inc.
- 11.10.1. Company Overview
- 11.10.2. Financial Highlights
- 11.10.3. Product Portfolio
- 11.10.4. SWOT Analysis
- 11.10.5. Key Strategies and Developments
- 11.11. Other Key Players
- 11.11.1. Company Overview
- 11.11.2. Financial Highlights
- 11.11.3. Product Portfolio
- 11.11.4. SWOT Analysis
- 11.11.5. Key Strategies and Developments
- 12. Assumptions and Acronyms
- 13. Research Methodology
- 14. Contact
- List of Figures
- Figure 1: Global Generative AI in the Enterprise Market Revenue (US$ Mn) Market Share by Technology in 2022
- Figure 2: Global Generative AI in the Enterprise Market Attractiveness Analysis by Technology, 2016-2032
- Figure 3: Global Generative AI in the Enterprise Market Revenue (US$ Mn) Market Share by Deployment Modein 2022
- Figure 4: Global Generative AI in the Enterprise Market Attractiveness Analysis by Deployment Mode, 2016-2032
- Figure 5: Global Generative AI in the Enterprise Market Revenue (US$ Mn) Market Share by Applicationin 2022
- Figure 6: Global Generative AI in the Enterprise Market Attractiveness Analysis by Application, 2016-2032
- Figure 7: Global Generative AI in the Enterprise Market Revenue (US$ Mn) Market Share by Region in 2022
- Figure 8: Global Generative AI in the Enterprise Market Attractiveness Analysis by Region, 2016-2032
- Figure 9: Global Generative AI in the Enterprise Market Revenue (US$ Mn) (2016-2032)
- Figure 10: Global Generative AI in the Enterprise Market Revenue (US$ Mn) Comparison by Region (2016-2032)
- Figure 11: Global Generative AI in the Enterprise Market Revenue (US$ Mn) Comparison by Technology (2016-2032)
- Figure 12: Global Generative AI in the Enterprise Market Revenue (US$ Mn) Comparison by Deployment Mode (2016-2032)
- Figure 13: Global Generative AI in the Enterprise Market Revenue (US$ Mn) Comparison by Application (2016-2032)
- Figure 14: Global Generative AI in the Enterprise Market Y-o-Y Growth Rate Comparison by Region (2016-2032)
- Figure 15: Global Generative AI in the Enterprise Market Y-o-Y Growth Rate Comparison by Technology (2016-2032)
- Figure 16: Global Generative AI in the Enterprise Market Y-o-Y Growth Rate Comparison by Deployment Mode (2016-2032)
- Figure 17: Global Generative AI in the Enterprise Market Y-o-Y Growth Rate Comparison by Application (2016-2032)
- Figure 18: Global Generative AI in the Enterprise Market Share Comparison by Region (2016-2032)
- Figure 19: Global Generative AI in the Enterprise Market Share Comparison by Technology (2016-2032)
- Figure 20: Global Generative AI in the Enterprise Market Share Comparison by Deployment Mode (2016-2032)
- Figure 21: Global Generative AI in the Enterprise Market Share Comparison by Application (2016-2032)
- Figure 22: North America Generative AI in the Enterprise Market Revenue (US$ Mn) Market Share by Technologyin 2022
- Figure 23: North America Generative AI in the Enterprise Market Attractiveness Analysis by Technology, 2016-2032
- Figure 24: North America Generative AI in the Enterprise Market Revenue (US$ Mn) Market Share by Deployment Modein 2022
- Figure 25: North America Generative AI in the Enterprise Market Attractiveness Analysis by Deployment Mode, 2016-2032
- Figure 26: North America Generative AI in the Enterprise Market Revenue (US$ Mn) Market Share by Applicationin 2022
- Figure 27: North America Generative AI in the Enterprise Market Attractiveness Analysis by Application, 2016-2032
- Figure 28: North America Generative AI in the Enterprise Market Revenue (US$ Mn) Market Share by Country in 2022
- Figure 29: North America Generative AI in the Enterprise Market Attractiveness Analysis by Country, 2016-2032
- Figure 30: North America Generative AI in the Enterprise Market Revenue (US$ Mn) (2016-2032)
- Figure 31: North America Generative AI in the Enterprise Market Revenue (US$ Mn) Comparison by Country (2016-2032)
- Figure 32: North America Generative AI in the Enterprise Market Revenue (US$ Mn) Comparison by Technology (2016-2032)
- Figure 33: North America Generative AI in the Enterprise Market Revenue (US$ Mn) Comparison by Deployment Mode (2016-2032)
- Figure 34: North America Generative AI in the Enterprise Market Revenue (US$ Mn) Comparison by Application (2016-2032)
- Figure 35: North America Generative AI in the Enterprise Market Y-o-Y Growth Rate Comparison by Country (2016-2032)
- Figure 36: North America Generative AI in the Enterprise Market Y-o-Y Growth Rate Comparison by Technology (2016-2032)
- Figure 37: North America Generative AI in the Enterprise Market Y-o-Y Growth Rate Comparison by Deployment Mode (2016-2032)
- Figure 38: North America Generative AI in the Enterprise Market Y-o-Y Growth Rate Comparison by Application (2016-2032)
- Figure 39: North America Generative AI in the Enterprise Market Share Comparison by Country (2016-2032)
- Figure 40: North America Generative AI in the Enterprise Market Share Comparison by Technology (2016-2032)
- Figure 41: North America Generative AI in the Enterprise Market Share Comparison by Deployment Mode (2016-2032)
- Figure 42: North America Generative AI in the Enterprise Market Share Comparison by Application (2016-2032)
- Figure 43: Western Europe Generative AI in the Enterprise Market Revenue (US$ Mn) Market Share by Technologyin 2022
- Figure 44: Western Europe Generative AI in the Enterprise Market Attractiveness Analysis by Technology, 2016-2032
- Figure 45: Western Europe Generative AI in the Enterprise Market Revenue (US$ Mn) Market Share by Deployment Modein 2022
- Figure 46: Western Europe Generative AI in the Enterprise Market Attractiveness Analysis by Deployment Mode, 2016-2032
- Figure 47: Western Europe Generative AI in the Enterprise Market Revenue (US$ Mn) Market Share by Applicationin 2022
- Figure 48: Western Europe Generative AI in the Enterprise Market Attractiveness Analysis by Application, 2016-2032
- Figure 49: Western Europe Generative AI in the Enterprise Market Revenue (US$ Mn) Market Share by Country in 2022
- Figure 50: Western Europe Generative AI in the Enterprise Market Attractiveness Analysis by Country, 2016-2032
- Figure 51: Western Europe Generative AI in the Enterprise Market Revenue (US$ Mn) (2016-2032)
- Figure 52: Western Europe Generative AI in the Enterprise Market Revenue (US$ Mn) Comparison by Country (2016-2032)
- Figure 53: Western Europe Generative AI in the Enterprise Market Revenue (US$ Mn) Comparison by Technology (2016-2032)
- Figure 54: Western Europe Generative AI in the Enterprise Market Revenue (US$ Mn) Comparison by Deployment Mode (2016-2032)
- Figure 55: Western Europe Generative AI in the Enterprise Market Revenue (US$ Mn) Comparison by Application (2016-2032)
- Figure 56: Western Europe Generative AI in the Enterprise Market Y-o-Y Growth Rate Comparison by Country (2016-2032)
- Figure 57: Western Europe Generative AI in the Enterprise Market Y-o-Y Growth Rate Comparison by Technology (2016-2032)
- Figure 58: Western Europe Generative AI in the Enterprise Market Y-o-Y Growth Rate Comparison by Deployment Mode (2016-2032)
- Figure 59: Western Europe Generative AI in the Enterprise Market Y-o-Y Growth Rate Comparison by Application (2016-2032)
- Figure 60: Western Europe Generative AI in the Enterprise Market Share Comparison by Country (2016-2032)
- Figure 61: Western Europe Generative AI in the Enterprise Market Share Comparison by Technology (2016-2032)
- Figure 62: Western Europe Generative AI in the Enterprise Market Share Comparison by Deployment Mode (2016-2032)
- Figure 63: Western Europe Generative AI in the Enterprise Market Share Comparison by Application (2016-2032)
- Figure 64: Eastern Europe Generative AI in the Enterprise Market Revenue (US$ Mn) Market Share by Technologyin 2022
- Figure 65: Eastern Europe Generative AI in the Enterprise Market Attractiveness Analysis by Technology, 2016-2032
- Figure 66: Eastern Europe Generative AI in the Enterprise Market Revenue (US$ Mn) Market Share by Deployment Modein 2022
- Figure 67: Eastern Europe Generative AI in the Enterprise Market Attractiveness Analysis by Deployment Mode, 2016-2032
- Figure 68: Eastern Europe Generative AI in the Enterprise Market Revenue (US$ Mn) Market Share by Applicationin 2022
- Figure 69: Eastern Europe Generative AI in the Enterprise Market Attractiveness Analysis by Application, 2016-2032
- Figure 70: Eastern Europe Generative AI in the Enterprise Market Revenue (US$ Mn) Market Share by Country in 2022
- Figure 71: Eastern Europe Generative AI in the Enterprise Market Attractiveness Analysis by Country, 2016-2032
- Figure 72: Eastern Europe Generative AI in the Enterprise Market Revenue (US$ Mn) (2016-2032)
- Figure 73: Eastern Europe Generative AI in the Enterprise Market Revenue (US$ Mn) Comparison by Country (2016-2032)
- Figure 74: Eastern Europe Generative AI in the Enterprise Market Revenue (US$ Mn) Comparison by Technology (2016-2032)
- Figure 75: Eastern Europe Generative AI in the Enterprise Market Revenue (US$ Mn) Comparison by Deployment Mode (2016-2032)
- Figure 76: Eastern Europe Generative AI in the Enterprise Market Revenue (US$ Mn) Comparison by Application (2016-2032)
- Figure 77: Eastern Europe Generative AI in the Enterprise Market Y-o-Y Growth Rate Comparison by Country (2016-2032)
- Figure 78: Eastern Europe Generative AI in the Enterprise Market Y-o-Y Growth Rate Comparison by Technology (2016-2032)
- Figure 79: Eastern Europe Generative AI in the Enterprise Market Y-o-Y Growth Rate Comparison by Deployment Mode (2016-2032)
- Figure 80: Eastern Europe Generative AI in the Enterprise Market Y-o-Y Growth Rate Comparison by Application (2016-2032)
- Figure 81: Eastern Europe Generative AI in the Enterprise Market Share Comparison by Country (2016-2032)
- Figure 82: Eastern Europe Generative AI in the Enterprise Market Share Comparison by Technology (2016-2032)
- Figure 83: Eastern Europe Generative AI in the Enterprise Market Share Comparison by Deployment Mode (2016-2032)
- Figure 84: Eastern Europe Generative AI in the Enterprise Market Share Comparison by Application (2016-2032)
- Figure 85: APAC Generative AI in the Enterprise Market Revenue (US$ Mn) Market Share by Technologyin 2022
- Figure 86: APAC Generative AI in the Enterprise Market Attractiveness Analysis by Technology, 2016-2032
- Figure 87: APAC Generative AI in the Enterprise Market Revenue (US$ Mn) Market Share by Deployment Modein 2022
- Figure 88: APAC Generative AI in the Enterprise Market Attractiveness Analysis by Deployment Mode, 2016-2032
- Figure 89: APAC Generative AI in the Enterprise Market Revenue (US$ Mn) Market Share by Applicationin 2022
- Figure 90: APAC Generative AI in the Enterprise Market Attractiveness Analysis by Application, 2016-2032
- Figure 91: APAC Generative AI in the Enterprise Market Revenue (US$ Mn) Market Share by Country in 2022
- Figure 92: APAC Generative AI in the Enterprise Market Attractiveness Analysis by Country, 2016-2032
- Figure 93: APAC Generative AI in the Enterprise Market Revenue (US$ Mn) (2016-2032)
- Figure 94: APAC Generative AI in the Enterprise Market Revenue (US$ Mn) Comparison by Country (2016-2032)
- Figure 95: APAC Generative AI in the Enterprise Market Revenue (US$ Mn) Comparison by Technology (2016-2032)
- Figure 96: APAC Generative AI in the Enterprise Market Revenue (US$ Mn) Comparison by Deployment Mode (2016-2032)
- Figure 97: APAC Generative AI in the Enterprise Market Revenue (US$ Mn) Comparison by Application (2016-2032)
- Figure 98: APAC Generative AI in the Enterprise Market Y-o-Y Growth Rate Comparison by Country (2016-2032)
- Figure 99: APAC Generative AI in the Enterprise Market Y-o-Y Growth Rate Comparison by Technology (2016-2032)
- Figure 100: APAC Generative AI in the Enterprise Market Y-o-Y Growth Rate Comparison by Deployment Mode (2016-2032)
- Figure 101: APAC Generative AI in the Enterprise Market Y-o-Y Growth Rate Comparison by Application (2016-2032)
- Figure 102: APAC Generative AI in the Enterprise Market Share Comparison by Country (2016-2032)
- Figure 103: APAC Generative AI in the Enterprise Market Share Comparison by Technology (2016-2032)
- Figure 104: APAC Generative AI in the Enterprise Market Share Comparison by Deployment Mode (2016-2032)
- Figure 105: APAC Generative AI in the Enterprise Market Share Comparison by Application (2016-2032)
- Figure 106: Latin America Generative AI in the Enterprise Market Revenue (US$ Mn) Market Share by Technologyin 2022
- Figure 107: Latin America Generative AI in the Enterprise Market Attractiveness Analysis by Technology, 2016-2032
- Figure 108: Latin America Generative AI in the Enterprise Market Revenue (US$ Mn) Market Share by Deployment Modein 2022
- Figure 109: Latin America Generative AI in the Enterprise Market Attractiveness Analysis by Deployment Mode, 2016-2032
- Figure 110: Latin America Generative AI in the Enterprise Market Revenue (US$ Mn) Market Share by Applicationin 2022
- Figure 111: Latin America Generative AI in the Enterprise Market Attractiveness Analysis by Application, 2016-2032
- Figure 112: Latin America Generative AI in the Enterprise Market Revenue (US$ Mn) Market Share by Country in 2022
- Figure 113: Latin America Generative AI in the Enterprise Market Attractiveness Analysis by Country, 2016-2032
- Figure 114: Latin America Generative AI in the Enterprise Market Revenue (US$ Mn) (2016-2032)
- Figure 115: Latin America Generative AI in the Enterprise Market Revenue (US$ Mn) Comparison by Country (2016-2032)
- Figure 116: Latin America Generative AI in the Enterprise Market Revenue (US$ Mn) Comparison by Technology (2016-2032)
- Figure 117: Latin America Generative AI in the Enterprise Market Revenue (US$ Mn) Comparison by Deployment Mode (2016-2032)
- Figure 118: Latin America Generative AI in the Enterprise Market Revenue (US$ Mn) Comparison by Application (2016-2032)
- Figure 119: Latin America Generative AI in the Enterprise Market Y-o-Y Growth Rate Comparison by Country (2016-2032)
- Figure 120: Latin America Generative AI in the Enterprise Market Y-o-Y Growth Rate Comparison by Technology (2016-2032)
- Figure 121: Latin America Generative AI in the Enterprise Market Y-o-Y Growth Rate Comparison by Deployment Mode (2016-2032)
- Figure 122: Latin America Generative AI in the Enterprise Market Y-o-Y Growth Rate Comparison by Application (2016-2032)
- Figure 123: Latin America Generative AI in the Enterprise Market Share Comparison by Country (2016-2032)
- Figure 124: Latin America Generative AI in the Enterprise Market Share Comparison by Technology (2016-2032)
- Figure 125: Latin America Generative AI in the Enterprise Market Share Comparison by Deployment Mode (2016-2032)
- Figure 126: Latin America Generative AI in the Enterprise Market Share Comparison by Application (2016-2032)
- Figure 127: Middle East & Africa Generative AI in the Enterprise Market Revenue (US$ Mn) Market Share by Technologyin 2022
- Figure 128: Middle East & Africa Generative AI in the Enterprise Market Attractiveness Analysis by Technology, 2016-2032
- Figure 129: Middle East & Africa Generative AI in the Enterprise Market Revenue (US$ Mn) Market Share by Deployment Modein 2022
- Figure 130: Middle East & Africa Generative AI in the Enterprise Market Attractiveness Analysis by Deployment Mode, 2016-2032
- Figure 131: Middle East & Africa Generative AI in the Enterprise Market Revenue (US$ Mn) Market Share by Applicationin 2022
- Figure 132: Middle East & Africa Generative AI in the Enterprise Market Attractiveness Analysis by Application, 2016-2032
- Figure 133: Middle East & Africa Generative AI in the Enterprise Market Revenue (US$ Mn) Market Share by Country in 2022
- Figure 134: Middle East & Africa Generative AI in the Enterprise Market Attractiveness Analysis by Country, 2016-2032
- Figure 135: Middle East & Africa Generative AI in the Enterprise Market Revenue (US$ Mn) (2016-2032)
- Figure 136: Middle East & Africa Generative AI in the Enterprise Market Revenue (US$ Mn) Comparison by Country (2016-2032)
- Figure 137: Middle East & Africa Generative AI in the Enterprise Market Revenue (US$ Mn) Comparison by Technology (2016-2032)
- Figure 138: Middle East & Africa Generative AI in the Enterprise Market Revenue (US$ Mn) Comparison by Deployment Mode (2016-2032)
- Figure 139: Middle East & Africa Generative AI in the Enterprise Market Revenue (US$ Mn) Comparison by Application (2016-2032)
- Figure 140: Middle East & Africa Generative AI in the Enterprise Market Y-o-Y Growth Rate Comparison by Country (2016-2032)
- Figure 141: Middle East & Africa Generative AI in the Enterprise Market Y-o-Y Growth Rate Comparison by Technology (2016-2032)
- Figure 142: Middle East & Africa Generative AI in the Enterprise Market Y-o-Y Growth Rate Comparison by Deployment Mode (2016-2032)
- Figure 143: Middle East & Africa Generative AI in the Enterprise Market Y-o-Y Growth Rate Comparison by Application (2016-2032)
- Figure 144: Middle East & Africa Generative AI in the Enterprise Market Share Comparison by Country (2016-2032)
- Figure 145: Middle East & Africa Generative AI in the Enterprise Market Share Comparison by Technology (2016-2032)
- Figure 146: Middle East & Africa Generative AI in the Enterprise Market Share Comparison by Deployment Mode (2016-2032)
- Figure 147: Middle East & Africa Generative AI in the Enterprise Market Share Comparison by Application (2016-2032)
- List of Tables
- Table 1: Global Generative AI in the Enterprise Market Comparison by Technology (2016-2032)
- Table 2: Global Generative AI in the Enterprise Market Comparison by Deployment Mode (2016-2032)
- Table 3: Global Generative AI in the Enterprise Market Comparison by Application (2016-2032)
- Table 4: Global Generative AI in the Enterprise Market Revenue (US$ Mn) Comparison by Region (2016-2032)
- Table 5: Global Generative AI in the Enterprise Market Revenue (US$ Mn) (2016-2032)
- Table 6: Global Generative AI in the Enterprise Market Revenue (US$ Mn) Comparison by Region (2016-2032)
- Table 7: Global Generative AI in the Enterprise Market Revenue (US$ Mn) Comparison by Technology (2016-2032)
- Table 8: Global Generative AI in the Enterprise Market Revenue (US$ Mn) Comparison by Deployment Mode (2016-2032)
- Table 9: Global Generative AI in the Enterprise Market Revenue (US$ Mn) Comparison by Application (2016-2032)
- Table 10: Global Generative AI in the Enterprise Market Y-o-Y Growth Rate Comparison by Region (2016-2032)
- Table 11: Global Generative AI in the Enterprise Market Y-o-Y Growth Rate Comparison by Technology (2016-2032)
- Table 12: Global Generative AI in the Enterprise Market Y-o-Y Growth Rate Comparison by Deployment Mode (2016-2032)
- Table 13: Global Generative AI in the Enterprise Market Y-o-Y Growth Rate Comparison by Application (2016-2032)
- Table 14: Global Generative AI in the Enterprise Market Share Comparison by Region (2016-2032)
- Table 15: Global Generative AI in the Enterprise Market Share Comparison by Technology (2016-2032)
- Table 16: Global Generative AI in the Enterprise Market Share Comparison by Deployment Mode (2016-2032)
- Table 17: Global Generative AI in the Enterprise Market Share Comparison by Application (2016-2032)
- Table 18: North America Generative AI in the Enterprise Market Comparison by Deployment Mode (2016-2032)
- Table 19: North America Generative AI in the Enterprise Market Comparison by Application (2016-2032)
- Table 20: North America Generative AI in the Enterprise Market Revenue (US$ Mn) Comparison by Country (2016-2032)
- Table 21: North America Generative AI in the Enterprise Market Revenue (US$ Mn) (2016-2032)
- Table 22: North America Generative AI in the Enterprise Market Revenue (US$ Mn) Comparison by Country (2016-2032)
- Table 23: North America Generative AI in the Enterprise Market Revenue (US$ Mn) Comparison by Technology (2016-2032)
- Table 24: North America Generative AI in the Enterprise Market Revenue (US$ Mn) Comparison by Deployment Mode (2016-2032)
- Table 25: North America Generative AI in the Enterprise Market Revenue (US$ Mn) Comparison by Application (2016-2032)
- Table 26: North America Generative AI in the Enterprise Market Y-o-Y Growth Rate Comparison by Country (2016-2032)
- Table 27: North America Generative AI in the Enterprise Market Y-o-Y Growth Rate Comparison by Technology (2016-2032)
- Table 28: North America Generative AI in the Enterprise Market Y-o-Y Growth Rate Comparison by Deployment Mode (2016-2032)
- Table 29: North America Generative AI in the Enterprise Market Y-o-Y Growth Rate Comparison by Application (2016-2032)
- Table 30: North America Generative AI in the Enterprise Market Share Comparison by Country (2016-2032)
- Table 31: North America Generative AI in the Enterprise Market Share Comparison by Technology (2016-2032)
- Table 32: North America Generative AI in the Enterprise Market Share Comparison by Deployment Mode (2016-2032)
- Table 33: North America Generative AI in the Enterprise Market Share Comparison by Application (2016-2032)
- Table 34: Western Europe Generative AI in the Enterprise Market Comparison by Technology (2016-2032)
- Table 35: Western Europe Generative AI in the Enterprise Market Comparison by Deployment Mode (2016-2032)
- Table 36: Western Europe Generative AI in the Enterprise Market Comparison by Application (2016-2032)
- Table 37: Western Europe Generative AI in the Enterprise Market Revenue (US$ Mn) Comparison by Country (2016-2032)
- Table 38: Western Europe Generative AI in the Enterprise Market Revenue (US$ Mn) (2016-2032)
- Table 39: Western Europe Generative AI in the Enterprise Market Revenue (US$ Mn) Comparison by Country (2016-2032)
- Table 40: Western Europe Generative AI in the Enterprise Market Revenue (US$ Mn) Comparison by Technology (2016-2032)
- Table 41: Western Europe Generative AI in the Enterprise Market Revenue (US$ Mn) Comparison by Deployment Mode (2016-2032)
- Table 42: Western Europe Generative AI in the Enterprise Market Revenue (US$ Mn) Comparison by Application (2016-2032)
- Table 43: Western Europe Generative AI in the Enterprise Market Y-o-Y Growth Rate Comparison by Country (2016-2032)
- Table 44: Western Europe Generative AI in the Enterprise Market Y-o-Y Growth Rate Comparison by Technology (2016-2032)
- Table 45: Western Europe Generative AI in the Enterprise Market Y-o-Y Growth Rate Comparison by Deployment Mode (2016-2032)
- Table 46: Western Europe Generative AI in the Enterprise Market Y-o-Y Growth Rate Comparison by Application (2016-2032)
- Table 47: Western Europe Generative AI in the Enterprise Market Share Comparison by Country (2016-2032)
- Table 48: Western Europe Generative AI in the Enterprise Market Share Comparison by Technology (2016-2032)
- Table 49: Western Europe Generative AI in the Enterprise Market Share Comparison by Deployment Mode (2016-2032)
- Table 50: Western Europe Generative AI in the Enterprise Market Share Comparison by Application (2016-2032)
- Table 51: Eastern Europe Generative AI in the Enterprise Market Comparison by Technology (2016-2032)
- Table 52: Eastern Europe Generative AI in the Enterprise Market Comparison by Deployment Mode (2016-2032)
- Table 53: Eastern Europe Generative AI in the Enterprise Market Comparison by Application (2016-2032)
- Table 54: Eastern Europe Generative AI in the Enterprise Market Revenue (US$ Mn) Comparison by Country (2016-2032)
- Table 55: Eastern Europe Generative AI in the Enterprise Market Revenue (US$ Mn) (2016-2032)
- Table 56: Eastern Europe Generative AI in the Enterprise Market Revenue (US$ Mn) Comparison by Country (2016-2032)
- Table 57: Eastern Europe Generative AI in the Enterprise Market Revenue (US$ Mn) Comparison by Technology (2016-2032)
- Table 58: Eastern Europe Generative AI in the Enterprise Market Revenue (US$ Mn) Comparison by Deployment Mode (2016-2032)
- Table 59: Eastern Europe Generative AI in the Enterprise Market Revenue (US$ Mn) Comparison by Application (2016-2032)
- Table 60: Eastern Europe Generative AI in the Enterprise Market Y-o-Y Growth Rate Comparison by Country (2016-2032)
- Table 61: Eastern Europe Generative AI in the Enterprise Market Y-o-Y Growth Rate Comparison by Technology (2016-2032)
- Table 62: Eastern Europe Generative AI in the Enterprise Market Y-o-Y Growth Rate Comparison by Deployment Mode (2016-2032)
- Table 63: Eastern Europe Generative AI in the Enterprise Market Y-o-Y Growth Rate Comparison by Application (2016-2032)
- Table 64: Eastern Europe Generative AI in the Enterprise Market Share Comparison by Country (2016-2032)
- Table 65: Eastern Europe Generative AI in the Enterprise Market Share Comparison by Technology (2016-2032)
- Table 66: Eastern Europe Generative AI in the Enterprise Market Share Comparison by Deployment Mode (2016-2032)
- Table 67: Eastern Europe Generative AI in the Enterprise Market Share Comparison by Application (2016-2032)
- Table 68: APAC Generative AI in the Enterprise Market Comparison by Technology (2016-2032)
- Table 69: APAC Generative AI in the Enterprise Market Comparison by Deployment Mode (2016-2032)
- Table 70: APAC Generative AI in the Enterprise Market Comparison by Application (2016-2032)
- Table 71: APAC Generative AI in the Enterprise Market Revenue (US$ Mn) Comparison by Country (2016-2032)
- Table 72: APAC Generative AI in the Enterprise Market Revenue (US$ Mn) (2016-2032)
- Table 73: APAC Generative AI in the Enterprise Market Revenue (US$ Mn) Comparison by Country (2016-2032)
- Table 74: APAC Generative AI in the Enterprise Market Revenue (US$ Mn) Comparison by Technology (2016-2032)
- Table 75: APAC Generative AI in the Enterprise Market Revenue (US$ Mn) Comparison by Deployment Mode (2016-2032)
- Table 76: APAC Generative AI in the Enterprise Market Revenue (US$ Mn) Comparison by Application (2016-2032)
- Table 77: APAC Generative AI in the Enterprise Market Y-o-Y Growth Rate Comparison by Country (2016-2032)
- Table 78: APAC Generative AI in the Enterprise Market Y-o-Y Growth Rate Comparison by Technology (2016-2032)
- Table 79: APAC Generative AI in the Enterprise Market Y-o-Y Growth Rate Comparison by Deployment Mode (2016-2032)
- Table 80: APAC Generative AI in the Enterprise Market Y-o-Y Growth Rate Comparison by Application (2016-2032)
- Table 81: APAC Generative AI in the Enterprise Market Share Comparison by Country (2016-2032)
- Table 82: APAC Generative AI in the Enterprise Market Share Comparison by Technology (2016-2032)
- Table 83: APAC Generative AI in the Enterprise Market Share Comparison by Deployment Mode (2016-2032)
- Table 84: APAC Generative AI in the Enterprise Market Share Comparison by Application (2016-2032)
- Table 85: Latin America Generative AI in the Enterprise Market Comparison by Technology (2016-2032)
- Table 86: Latin America Generative AI in the Enterprise Market Comparison by Deployment Mode (2016-2032)
- Table 87: Latin America Generative AI in the Enterprise Market Comparison by Application (2016-2032)
- Table 88: Latin America Generative AI in the Enterprise Market Revenue (US$ Mn) Comparison by Country (2016-2032)
- Table 89: Latin America Generative AI in the Enterprise Market Revenue (US$ Mn) (2016-2032)
- Table 90: Latin America Generative AI in the Enterprise Market Revenue (US$ Mn) Comparison by Country (2016-2032)
- Table 91: Latin America Generative AI in the Enterprise Market Revenue (US$ Mn) Comparison by Technology (2016-2032)
- Table 92: Latin America Generative AI in the Enterprise Market Revenue (US$ Mn) Comparison by Deployment Mode (2016-2032)
- Table 93: Latin America Generative AI in the Enterprise Market Revenue (US$ Mn) Comparison by Application (2016-2032)
- Table 94: Latin America Generative AI in the Enterprise Market Y-o-Y Growth Rate Comparison by Country (2016-2032)
- Table 95: Latin America Generative AI in the Enterprise Market Y-o-Y Growth Rate Comparison by Technology (2016-2032)
- Table 96: Latin America Generative AI in the Enterprise Market Y-o-Y Growth Rate Comparison by Deployment Mode (2016-2032)
- Table 97: Latin America Generative AI in the Enterprise Market Y-o-Y Growth Rate Comparison by Application (2016-2032)
- Table 98: Latin America Generative AI in the Enterprise Market Share Comparison by Country (2016-2032)
- Table 99: Latin America Generative AI in the Enterprise Market Share Comparison by Technology (2016-2032)
- Table 100: Latin America Generative AI in the Enterprise Market Share Comparison by Deployment Mode (2016-2032)
- Table 101: Latin America Generative AI in the Enterprise Market Share Comparison by Application (2016-2032)
- Table 102: Middle East & Africa Generative AI in the Enterprise Market Comparison by Technology (2016-2032)
- Table 103: Middle East & Africa Generative AI in the Enterprise Market Comparison by Deployment Mode (2016-2032)
- Table 104: Middle East & Africa Generative AI in the Enterprise Market Comparison by Application (2016-2032)
- Table 105: Middle East & Africa Generative AI in the Enterprise Market Revenue (US$ Mn) Comparison by Country (2016-2032)
- Table 106: Middle East & Africa Generative AI in the Enterprise Market Revenue (US$ Mn) (2016-2032)
- Table 107: Middle East & Africa Generative AI in the Enterprise Market Revenue (US$ Mn) Comparison by Country (2016-2032)
- Table 108: Middle East & Africa Generative AI in the Enterprise Market Revenue (US$ Mn) Comparison by Technology (2016-2032)
- Table 109: Middle East & Africa Generative AI in the Enterprise Market Revenue (US$ Mn) Comparison by Deployment Mode (2016-2032)
- Table 110: Middle East & Africa Generative AI in the Enterprise Market Revenue (US$ Mn) Comparison by Application (2016-2032)
- Table 111: Middle East & Africa Generative AI in the Enterprise Market Y-o-Y Growth Rate Comparison by Country (2016-2032)
- Table 112: Middle East & Africa Generative AI in the Enterprise Market Y-o-Y Growth Rate Comparison by Technology (2016-2032)
- Table 113: Middle East & Africa Generative AI in the Enterprise Market Y-o-Y Growth Rate Comparison by Deployment Mode (2016-2032)
- Table 114: Middle East & Africa Generative AI in the Enterprise Market Y-o-Y Growth Rate Comparison by Application (2016-2032)
- Table 115: Middle East & Africa Generative AI in the Enterprise Market Share Comparison by Country (2016-2032)
- Table 116: Middle East & Africa Generative AI in the Enterprise Market Share Comparison by Technology (2016-2032)
- Table 117: Middle East & Africa Generative AI in the Enterprise Market Share Comparison by Deployment Mode (2016-2032)
- Table 118: Middle East & Africa Generative AI in the Enterprise Market Share Comparison by Application (2016-2032)
- 1. Executive Summary
-
- OpenAI
- NVIDIA Corp.
- IBM Corp.
- Microsoft Corp.
- Google LLC
- Amazon Web Services, Inc.
- Adobe Inc.
- Salesforce, Inc.
- Other Key Players
Our Clients


View Our Licence Options
