
Generative AI in Finance Market, By Deployment Model (On-Premises Deployment, Cloud Deployment, and Hybrid Deployment), By Application (Fraud Detection, Investment Research, and Other ), By Technology (Natural Language Processing and Other ), By Region and Companies - Industry Segment Outlook, Market Assessment, Competition Scenario, Trends, and Forecast 2024-2033
-
37125
-
April 2024
-
300
-


-
This report was compiled by Vishwa Gaul Vishwa is an experienced market research and consulting professional with over 8 years of expertise in the ICT industry, contributing to over 700 reports across telecommunications, software, hardware, and digital solutions. Correspondence Team Lead- ICT Linkedin | Detailed Market research Methodology Our methodology involves a mix of primary research, including interviews with leading mental health experts, and secondary research from reputable medical journals and databases. View Detailed Methodology Page
-
Quick Navigation
Report Overview
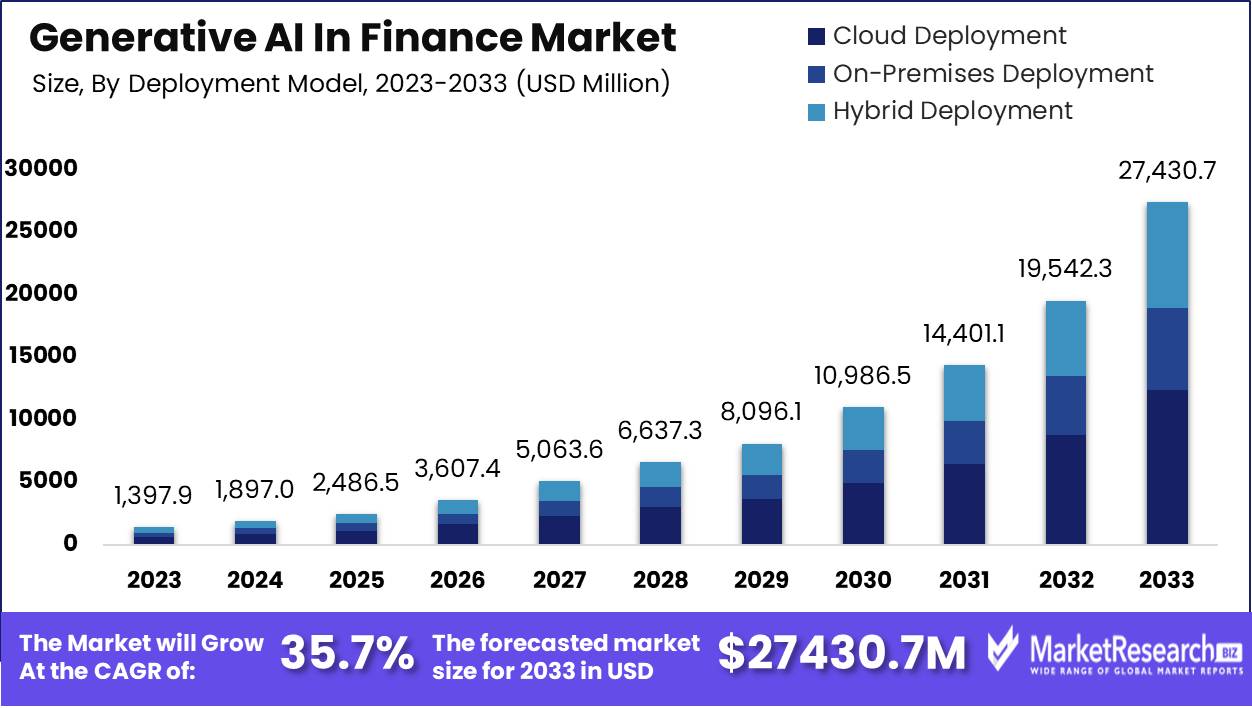
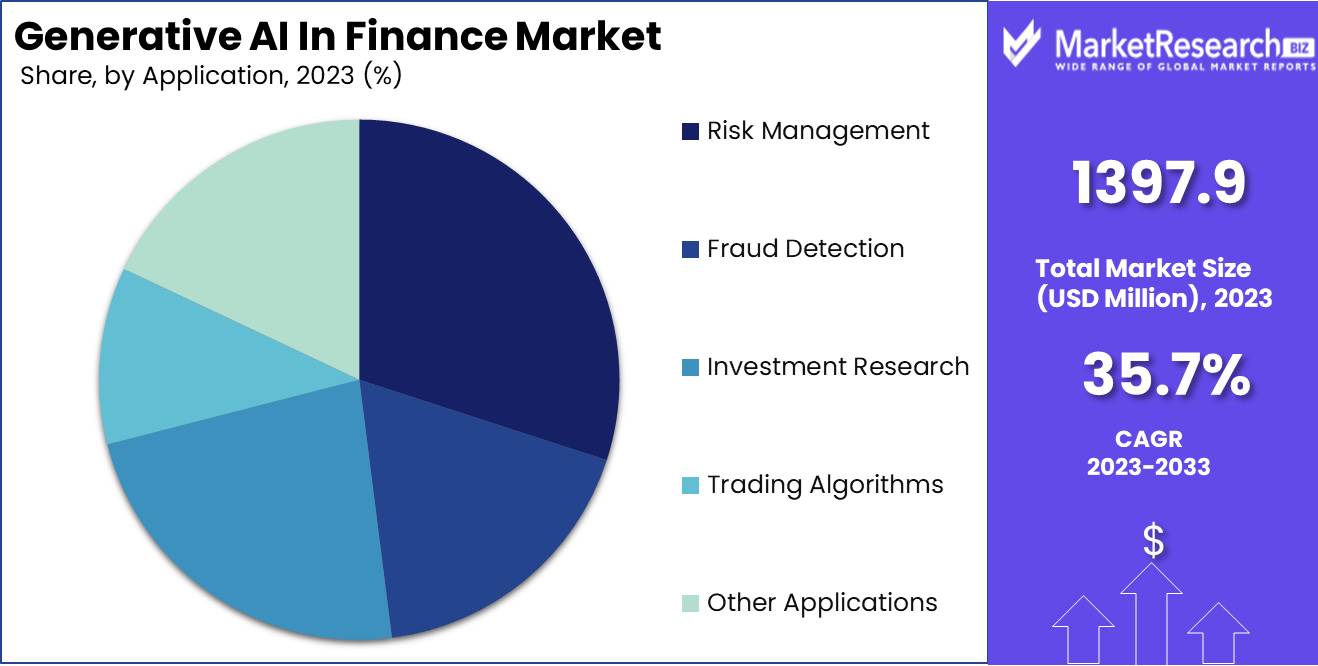
The Generative AI in Finance Market size is expected to be worth around USD 27,430.7 Mn by 2033 from USD 1,397.9 Mn in 2023, growing at a CAGR of 35.7% during the forecast period from 2024 to 2033.
The surge in demand for new advanced technologies and the adoption of digitalization are some of the main key driving factors for generative artificial intelligence in the finance market. GenAI and ML in finance comprise everything starting from virtual assistants like chatbots to fraud detection and task automation. An article published by Imagovation Insider in August 2023, highlights that GenAI has changed the system of the financial sector. Introducing AI in finance has led to cost reduction and increased productivity.
Generative AI for finance helps companies to fasten their path to high efficacy, precision, and adaptability. It helps in forecasting and budgets according to an report published by KPMG highlights that as per the survey conducted by them more than 83% of respondents utilized AI for financial planning which comprises predictive models, situational development, and budget insights. GenAI also helps in producing financial reports and consumes time. It helps in collecting market intelligence by using a large language model and also generates tactic insights from the information gathered. By using GenAI, many financial companies can get contracts that aim at non-standard terms and reporting accounting treatments. This technology also helps in identifying irregularities and fraud detection. There are several advantages of using GenAI in the finance market such as it helps to automate workflow and processes. It also helps in maintaining precision, efficacy, speed, new ideas, and availability to handle and regulate all types of finances.
The implementation of GenAI in finance will help the banking sector to grow tremendously. Many financial firms have digitalized their services and have implemented innovative ways to sell, add efficacy, and aim to generate more data. GenAI plays an important role by driving personalized customer responses that make more secure and accountable service suggestions. By use of GenAI and human engagement, financial institutes can develop seamless experiences that can address customers requirements. The demand for GenAI in finance will increase due to its requirement in various verticals of the finance sector that will help in market expansion in the coming years.
Key Takeaways
- Market Growth: The Generative AI in Finance Market size is expected to be worth around USD 27,430.7 Mn by 2033 from USD 1,397.9 Mn in 2023, growing at a CAGR of 35.7% during the forecast period from 2024 to 2033.
- By Deployment Model: In 2023, cloud deployment dominated the Generative AI in Finance Market due to its scalability and cost-efficiency.
- By Application: Generative AI dominates risk management in finance, enhancing predictive analytics and compliance efficiency in 2023.
- By Technology: Deep Learning Technology dominates Generative AI in Finance, shaping AI deployment with predictive analytics and risk management.
- Regional Dominance: North America leads the generative AI finance market, setting global benchmarks with a 40% share.
- Growth Opportunity: Generative AI in finance boosts productivity and market reach, revolutionizing the sector in 2024.
Driving factors
Fraud Detection and Prevention: Enhancing Security and Trust in Financial Services
The application of generative AI in fraud detection and prevention is pivotal for the growth of the finance market, primarily by enhancing the security of transactions and maintaining consumer trust. Generative AI technologies, such as deep learning and neural networks, have revolutionized the ability to analyze transaction patterns and identify anomalies that may indicate fraudulent activity. By learning from vast datasets of historical transactions, these systems can generate models that predict and detect suspicious behaviors with high accuracy.
The financial impact of fraud on institutions is significant, costing billions annually. The use of AI in combating this can not only reduce losses but also optimize the allocation of resources towards more productive activities rather than fraud management. A report suggested that AI-driven fraud detection systems could save businesses approximately $12 billion annually by 2023. This considerable saving underscores the vital role of generative AI in financial services, making it a key driver in the adoption and market expansion of AI technologies in finance.
Personalized Financial Advice: Tailoring Solutions to Enhance Customer Engagement
Generative AI contributes significantly to the personalization of financial advice, a factor that drives customer satisfaction and retention in financial services. By leveraging data on individual spending habits, investment history, and financial goals, AI models can generate personalized insights and recommendations. This tailored approach not only improves customer engagement but also empowers consumers with better financial decision-making tools, aligning with their specific financial contexts and aspirations.
The ability to provide customized advice at scale can transform customer interactions from generic to personal, thereby increasing the perceived value of financial services institutions. Institutions that adopt AI for personalized advice are likely to see higher engagement rates, as noted in the analysis, where banks employing advanced analytics and AI reported an increase in customer satisfaction scores by up to 10%. This shift not only drives growth in the generative AI market but also enhances the competitive edge of financial institutions that implement these solutions.
Portfolio Management Optimization: Increasing Efficiency and Returns
Generative AI plays a transformative role in optimizing portfolio management, another key growth driver in the finance market. AI technologies enable more sophisticated analysis of market data and trends, allowing for the generation of optimized investment strategies that can adapt to changing market conditions. This capability leads to better risk management and potentially higher returns on investments, which are critical value propositions for both individual investors and institutional clients.
AI-driven portfolio management systems can process complex scenarios and vast datasets far more efficiently than traditional models. This efficiency not only reduces operational costs but also enhances the scalability of financial services Firms. For example, advisors, which are largely driven by AI, are projected to manage significantly large assets under management (AUM) in the coming years. According to a report, the advisors are expected to manage $2.5 trillion by 2023. This statistic highlights the substantial impact of generative AI on market dynamics within the financial sector.
Restraining Factors
Data Privacy and Security Concerns: A Major Hindrance to Market Adoption and Trust
In the realm of generative AI in finance, data privacy and security concerns are paramount. Financial institutions handle sensitive personal and business data, making them prime targets for cyber-attacks. The deployment of generative AI technologies requires robust data protection measures to prevent breaches that could lead to significant financial losses and erosion of customer trust.
Regulatory bodies have been stringent, implementing frameworks like GDPR in Europe and CCPA in California, which mandate rigorous data handling and privacy protocols. Such regulations necessitate advanced compliance measures from AI solutions, often increasing the cost and complexity of AI projects. These barriers can deter financial institutions from fully embracing generative AI technologies, thus restraining market growth.
Technical Expertise: A Bottleneck in Realizing AI's Full Potential
The successful implementation of generative AI in finance not only requires cutting-edge technology but also demands a workforce with specialized knowledge. The complexity of AI systems necessitates skilled professionals who can develop, manage, and integrate these technologies effectively. However, there is a significant skills gap in the market; a survey highlighted that 60% of financial institutions consider the lack of necessary skills as a critical barrier to AI adoption. This shortage slows the pace at which financial organizations can innovate and integrate AI solutions, limiting the technology's potential impact on the market.
The dual challenges of cultivating technical expertise and managing intricate AI systems contribute to the slow adoption rates and dampened growth prospects in the generative AI finance sector. Together, these factors create a compounded restraint on the expansion of generative AI in the finance market.
By Deployment Model Analysis
In 2023, cloud deployment dominated the Generative AI in Finance Market due to its scalability and cost-efficiency.
In 2023, Cloud Deployment held a dominant market position in the "Based on the Deployment Model" segment of the Generative AI in the Finance Market. This supremacy is attributed to the scalability, flexibility, and cost-efficiency that cloud infrastructures offer financial institutions and FinTech companies. These attributes are particularly crucial in the deployment of generative AI applications, which require substantial computational resources and data-handling capacities.
Financial entities leverage cloud-based generative AI for various applications including personalized banking, risk assessment, fraud detection, and automated customer support. The cloud model enables these organizations to scale these solutions up or down based on demand, without the capital expenditure typically associated with on-premises setups. Additionally, cloud environments facilitate faster deployment of AI models and easier integration with existing digital ecosystems, which is vital for maintaining competitive advantage in the rapidly evolving finance sector.
Despite the popularity of cloud deployment, the market also observes significant traction in on-premises and hybrid models. On-premises deployment is often favored by institutions prioritizing data control and security, particularly in regions with stringent data residency regulations. Meanwhile, hybrid deployment models are gaining momentum as they combine the security benefits of on-premises systems with the scalability of cloud services.
By Application Analysis
Generative AI dominates risk management in finance, enhancing predictive analytics and compliance efficiency in 2023.
In 2023, Risk Management held a dominant market position in the application segment of Generative AI in the Finance Market. This prominence reflects the growing recognition among financial institutions of the critical need to enhance their risk assessment capabilities in an increasingly volatile environment. The integration of Generative AI into risk management processes has enabled these institutions to simulate a variety of financial scenarios and assess potential impacts with unprecedented precision and efficiency.
Financial risk management has traditionally been a complex area fraught with unpredictable elements, such as market volatility, credit risk, and operational uncertainties. The advent of Generative AI has introduced sophisticated predictive models that utilize vast datasets to forecast potential risks and recommend mitigation strategies. These AI models are trained on historical data, market trends, and real-time transactions to provide a holistic view of risk that supports proactive management strategies.
The adoption of Generative AI in this segment is driven by its ability to significantly reduce the time and human effort required for risk analysis, thereby allowing for faster and more accurate decision-making. For instance, AI can identify subtle patterns and correlations that human analysts might overlook, which can be crucial for anticipating and mitigating potential threats before they materialize.
Moreover, the ongoing developments in regulatory frameworks and the increasing complexity of financial products continue to push financial institutions toward these advanced technological solutions. Institutions that harness the capabilities of Generative AI not only bolster their risk management but also gain a competitive edge by adapting more swiftly to market changes and regulatory demands.
By Technology Analysis
Deep Learning Technology dominates Generative AI in Finance, shaping AI deployment with predictive analytics and risk management.
In 2023, Deep Learning Technology held a dominant market position in the Generative AI in the Finance Market, underpinning several critical advancements and applications. This technology segment, primarily driven by its robust capabilities in handling large volumes of data and its superior efficiency in pattern recognition, has significantly shaped the trajectory of AI deployment in financial services firms. Deep learning algorithms have been pivotal in enhancing predictive analytics, fraud detection, and customer service operations, offering financial institutions a competitive edge by improving accuracy and decision-making speed.
Moreover, the integration of deep learning technology in areas such as algorithmic trading and risk management illustrates its expansive influence. Financial entities leverage these sophisticated models to analyze market trends and make real-time trading decisions, thereby reducing risk tolerance and maximizing returns. The adaptability of deep learning to various financial scenarios, including complex regulatory environments, further solidifies its standing as the technology of choice for forward-thinking financial institutions seeking innovation through technology.
Looking ahead, the potential for deep learning technology to transform the financial landscape remains substantial. As financial data volumes grow and computational methods advance, deep learning's ability to learn from data and improve autonomously will likely lead to even more innovative applications. Financial institutions that continue to invest in and refine this technology will be better positioned to address emerging challenges and meet evolving customer expectations in an increasingly digital economy. The ongoing development and application of deep learning will undoubtedly play a crucial role in defining the future of finance.
Key Market Segments
Based on the Deployment Model
- Cloud Deployment
- On-Premises Deployment
- Hybrid Deployment
Based on the Application
- Risk Management
- Fraud Detection
- Investment Research
- Trading Algorithms
- Other Applications
Based on the Technology
- Deep Learning Technology
- Natural Language Processing Technology
- Computer Vision Technology
- Reinforcement Learning Technology
- Other Technologies
Growth Opportunity
Automation of Tasks and Increased Productivity
The global finance market stands to gain significantly from the integration of generative AI technologies. These sophisticated AI systems are poised to transform traditional finance operations by automating complex and time-consuming tasks. By leveraging generative AI, financial institutions can automate risk assessment processes, generate and evaluate financial reports, and streamline compliance management. This automation capability not only enhances operational efficiencies but also empowers human resources to focus on strategic initiatives rather than routine tasks. Consequently, this shift is expected to drive substantial productivity growth, thereby increasing the competitive advantage of firms that effectively integrate generative AI technologies.
Market Expansion
Generative AI also offers vast opportunities for market expansion within the finance sector. By harnessing the power of this technology, financial services can innovate and expand their product offerings. For instance, AI-driven financial advisory services, personalized banking solutions, and enhanced customer service interfaces are now feasible. These innovations attract a broader client base, including tech-savvy consumers and those seeking highly customized financial services companies. Additionally, generative AI enables the exploration of new market segments, such as offering real-time, AI-enhanced financial advice to small businesses and individual investors, further broadening the market scope and potential revenue streams.
Latest Trends
Automating Complex Financial Tasks Through Advanced Generative AI
The global finance sector is poised to substantially escalate its adoption of generative AI technologies, specifically in automating complex tasks. Financial institutions are leveraging these advanced tools to streamline operations and enhance accuracy in areas such as risk assessment, compliance monitoring, and fraud detection.
Generative AI models excel by processing vast datasets more efficiently than traditional methods, enabling real-time insights and decision-making. This shift not only optimizes operational efficiencies but also reduces costs and human error, paving the way for a more robust financial ecosystem. The integration of AI into these complex processes is transforming foundational industry practices, offering unprecedented scalability and agility in financial services.
Enhancing Customer Experience in Finance through Personalized Generative AI Applications
As we move into 2024, enhancing customer experience remains a paramount goal for the finance industry, heavily underpinned by generative AI innovations. Financial institutions are increasingly deploying AI-driven analysis solutions to provide personalized customer service, from tailored financial advice to customized product offerings.
Generative AI facilitates deeper interactions by analyzing customer data to anticipate needs and preferences, thereby fostering a more engaging and satisfying customer journey. This trend extends beyond mere interaction and is set to revolutionize how services are delivered, making them more accessible, faster, and user-friendly. As such, customer satisfaction and loyalty are expected to see a significant uplift, driven by these personalized and responsive AI-enhanced experiences.
These trends highlight a pivotal year for generative AI in the finance sector, with profound impacts on operational efficiency and customer engagement.
Regional Analysis
North America leads the generative AI finance market, setting global benchmarks with a 40% share.
North America is currently the dominating region in the generative AI finance market, holding approximately 40% of the global market share. This dominance is underpinned by substantial investments in AI technologies, a robust financial services sector, and a highly favorable regulatory environment that encourages innovation in financial technologies. The U.S., in particular, is home to leading AI research institutions and numerous fintech startups incorporating generative AI for personalized banking services, risk assessment, and automated financial advising.
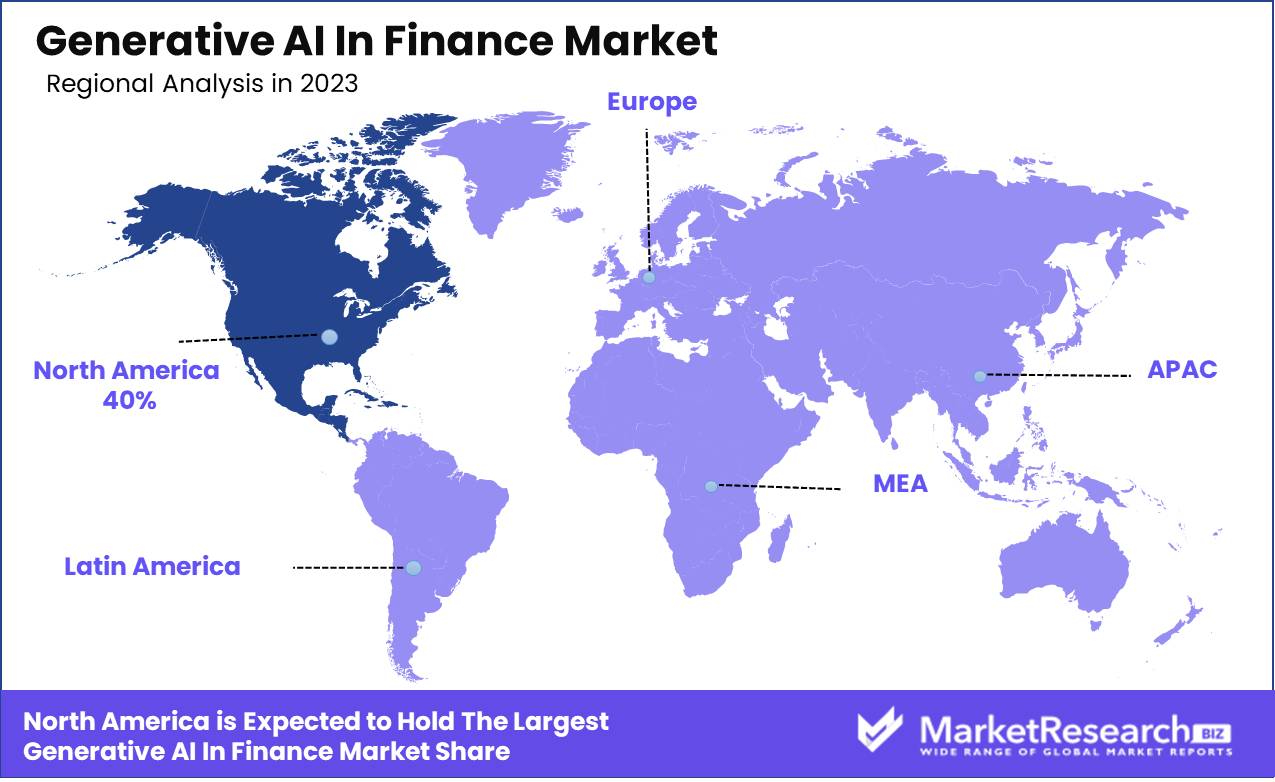
Europe follows, characterized by its stringent data protection regulations which influence the deployment strategies of AI technologies. Despite these regulations, there is significant growth in AI adoption due to the increasing demand for automation and efficient data management in finance, particularly in the UK and Germany.
Asia Pacific is identified as the fastest-growing region, driven by rapid digital transformation and increasing tech-savvy populations, especially in China and India. These countries are seeing a surge in AI-driven financial applications, primarily in mobile banking, fraud detection, and wealth management.
In the Middle East & Africa, the adoption is still in nascent stages but is spurred by the digital transformation initiatives in the Gulf Cooperation Council (GCC) countries, focusing on enhancing the fintech ecosystem and incorporating AI in the financial services industry.
Latin America shows a promising increase in AI adoption in finance, with Brazil and Mexico leading due to rising tech entrepreneurship and growing investment in fintech innovations that include generative AI to tackle financial inclusivity.
Key Regions and Countries
North America
- The US
- Canada
- Rest of North America
Europe
- Germany
- France
- The UK
- Spain
- Netherlands
- Russia
- Italy
- Rest of Europe
Asia-Pacific
- China
- Japan
- Singapore
- Thailand
- South Korea
- Vietnam
- India
- New Zealand
- Rest of Asia Pacific
Latin America
- Mexico
- Brazil
- Rest of Latin America
Middle East & Africa
- Saudi Arabia
- South Africa
- UAE
- Rest of the Middle East & Africa
Key Players Analysis
In the global Generative AI in Finance market, key players such as IBM Corporation, NVIDIA Corporation, DataRobot, Inc., Symphony Ayasdi, and others are poised to drive significant advancements. IBM Corporation, with its extensive experience in AI and finance, is expected to continue leading through its innovative solutions tailored for financial institutions. NVIDIA Corporation's prowess in GPU technology remains unparalleled, enabling cutting-edge AI applications that enhance financial decision-making processes.
DataRobot, Inc., recognized for its expertise in automated machine learning, is likely to play a pivotal role in democratizing AI within the finance sector, empowering organizations to leverage complex data for predictive analytics and risk management. Symphony Ayasdi, ai, known for its focus on explainable AI, brings transparency and interpretability to financial models, addressing regulatory compliance and risk mitigation requirements.
Kavout and AlphaSense are anticipated to contribute significantly as emerging players, leveraging AI to provide actionable insights and competitive intelligence to financial professionals. The competitive landscape also includes other key players actively shaping the market dynamics with their unique offerings and contributions.
The growth trajectory of the Generative AI in Finance market in 2024 is marked by intense competition and rapid innovation as companies strive to address evolving industry challenges and capitalize on emerging opportunities. As financial institutions increasingly recognize the value of AI-driven solutions in optimizing operations, managing risks, and uncovering new revenue streams, the role of these key players becomes even more crucial in shaping the future of finance through intelligent automation and data-driven decision-making.
Market Key Players
- IBM Corporation
- NVIDIA Corporation
- DataRobot, Inc.
- Symphony Ayasdi
- ai
- Kavout
- AlphaSense
- Other Key Players
Recent Development
- In March 2024, FN Media Group reported on the burgeoning influence of artificial intelligence (AI) across diverse industries, emphasizing its pivotal role in driving technological advancements such as big data analytics, robotics, and the Internet of Things (IoT). The report highlighted the exponential growth of the global AI market, valued at USD 150.2 billion in 2023 and projected to reach $1,345.2 billion by 2030, with a CAGR of 36.8%.
- In February 2024, C3.ai, Inc., reported an 18% increase in total revenue to $78.4 million for its fiscal third quarter ended January 31, 2024, along with significant customer engagement growth and expanded AI application agreements across various Banking sectors.
- In January 2024, EY's survey highlighted the transformative potential of Generation AI (Gen AI) in the retail industry, projecting retail investments in AI to surge to US$31 billion by 2028, potentially elevating sector profitability by 20% by 2025. However, challenges such as privacy concerns and skill gaps loom large, with 80% of organizations expressing low-to-moderate readiness for Gen AI adoption.
Report Scope
Report Features Description Market Value (2023) USD 1,397.9 Mn Forecast Revenue (2033) USD 27,430.7 Mn CAGR (2024-2032) 35.7% Base Year for Estimation 2023 Historic Period 2016-2023 Forecast Period 2024-2033 Report Coverage Revenue Forecast, Market Dynamics, COVID-19 Impact, Competitive Landscape, Recent Developments Segments Covered Based on the Deployment Model(Cloud Deployment, On-Premises Deployment, Hybrid Deployment), Based on the Application (Risk Management, Fraud Detection, Investment Research, Trading Algorithms, Other Applications), Based on the Technology (Deep Learning Technology, Natural Language Processing Technology, Computer Vision Technology, Reinforcement Learning Technology, Other Technologies) Regional Analysis North America - The US, Canada, Rest of North America, Europe - Germany, France, The UK, Spain, Italy, Russia, Netherlands, Rest of Europe, Asia-Pacific - China, Japan, South Korea, India, New Zealand, Singapore, Thailand, Vietnam, Rest of Asia Pacific, Latin America - Brazil, Mexico, Rest of Latin America, Middle East & Africa - South Africa, Saudi Arabia, UAE, Rest of Middle East & Africa Competitive Landscape IBM Corporation, NVIDIA Corporation, DataRobot, Inc., Symphony, Ayasdi, H20. Ai, Kavout, AlphaSense, Other Key Players Customization Scope Customization for segments, region/country-level will be provided. Moreover, additional customization can be done based on the requirements. Purchase Options We have three licenses to opt for Single User License, Multi-User License (Up to 5 Users), Corporate Use License (Unlimited User and Printable PDF) -
-
- IBM Corporation
- NVIDIA Corporation
- DataRobot, Inc.
- Symphony Ayasdi
- ai
- Kavout
- AlphaSense
- Other Key Players
Our Clients


View Our Licence Options
