Global Generative AI in Life Sciences Market by Technology (Novel molecule Generation, Protein Sequence Design, and Other ), By Application (Drug Discovery, Biotechnology, and other ), By Region and Companies - Industry Segment Outlook, Market Assessment, Competition Scenario, Trends, and Forecast 2024-2033
-
37679
-
April 2024
-
300
-


-
This report was compiled by Vishwa Gaul Vishwa is an experienced market research and consulting professional with over 8 years of expertise in the ICT industry, contributing to over 700 reports across telecommunications, software, hardware, and digital solutions. Correspondence Team Lead- ICT Linkedin | Detailed Market research Methodology Our methodology involves a mix of primary research, including interviews with leading mental health experts, and secondary research from reputable medical journals and databases. View Detailed Methodology Page
-
Quick Navigation
Report Overview
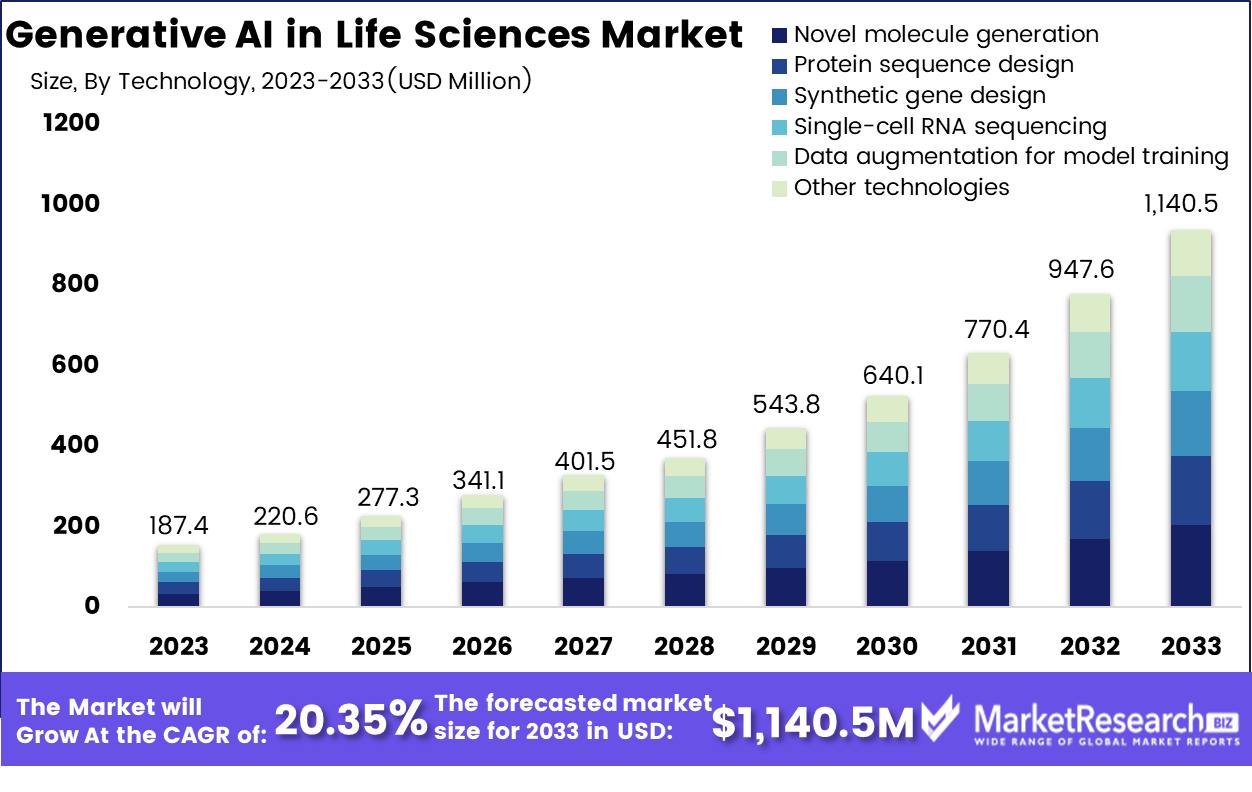
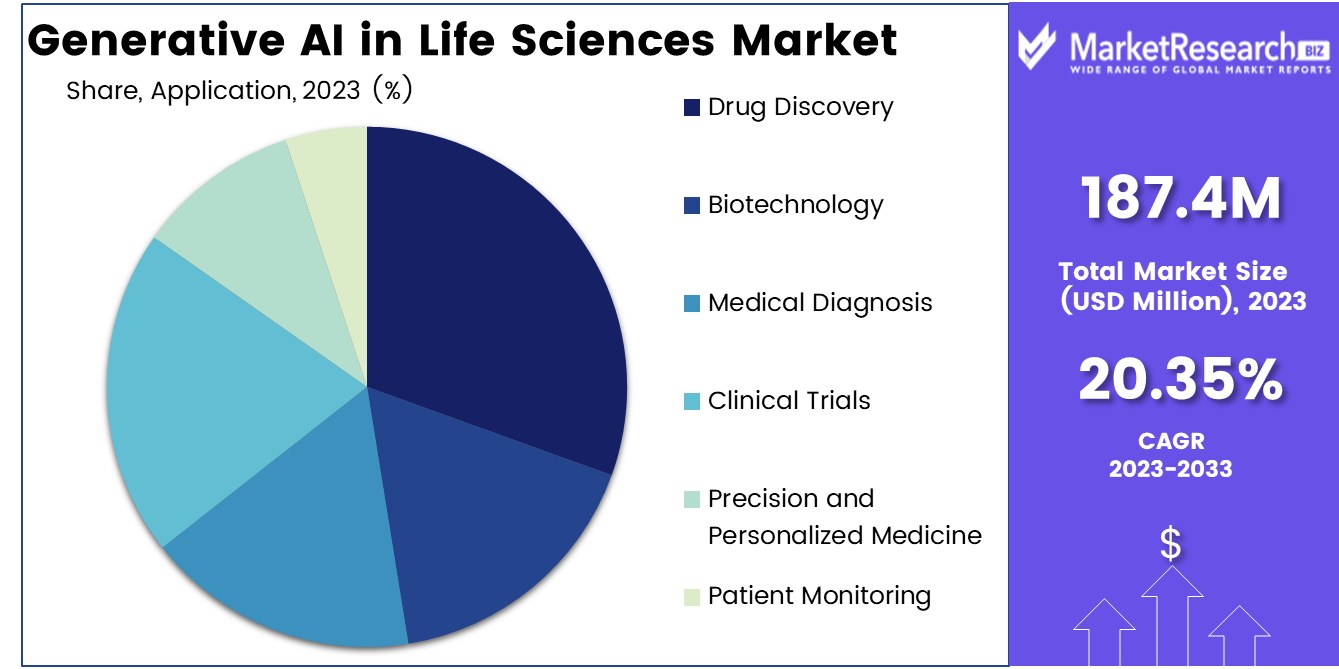
Global Generative AI in Life Sciences Market size is expected to be worth around USD 1,140.5 million by 2033 from USD 187.4 million in 2023, growing at a CAGR of 20.35%, during the forecast period from 2023 to 2033.
The surge in demand in various medical and pharmaceutical hubs, and new advanced technologies are some of the main key driving factors for generative artificial intelligence in the life science market. GenAI and the large language model have the potential to transform the life science market. Using GenAI and LLM models helps in analyzing the protein structures and features, and also using them in the healthcare sector. This permits the use of GenAI in life science, for example, to develop protein-based and small-molecule treatments.
According to AI Multiple in December 2023, highlights that as per CB insights, venture capitalists and stakeholders have invested USD 2.6 billion in 2022 into 110 Gen-AI-based startups in the US. Moreover, in March 2023, at the GTC conference, NVIDIA introduced BioNeMo cloud, a generative AI cloud service inside AI foundation suites. Similarly, Insilico Medicines a well-known and premium member of the NVIDIA foundation has been using BioNeMo to fasten the early drug discovery process, which in the old method takes more than four years and costs more than around USD 500 million. By adopting GenAI from end to end, Insilico was capable of recognizing a pre-clinical candidate drug for 1/3 of the time and for 1/10 of the cost.
There are several advantages of implementing GenAI in life science such as it helps in drug discovery by producing and boosting novel molecular structure in silico. It also helps in protein engineering and cellular modeling. This technology supports accurate medicines and medical imaging. GenAI also helps in optimizing biological data. For example, the GenAI model has been utilized to produce new protein structures that can arouse the behavior of cells and manufacture synthetic images of tissues and organs. This also helps in generating data, and helps in data compression and visualization.
Generative AI also aids in detecting irregularities and decreasing the dimensionality of large data sets by making it quite easy to recognize patterns. The demand for GenAI in life science will rapidly grow due to its requirement in drug discovery and various medical hubs that will help in market expansion in the coming years.
Key Takeaways
- Market Value: Global Generative AI in Life Sciences Market size is expected to be worth around USD 1,140.5 million by 2033 from USD 187.4 million in 2023, growing at a CAGR of 20.35%, during the forecast period from 2023 to 2033.
- Based on Technology: Generative AI revolutionizes novel molecule generation in the life sciences market.
- Based on Application: Generative AI accelerates drug discovery in the life sciences sector.
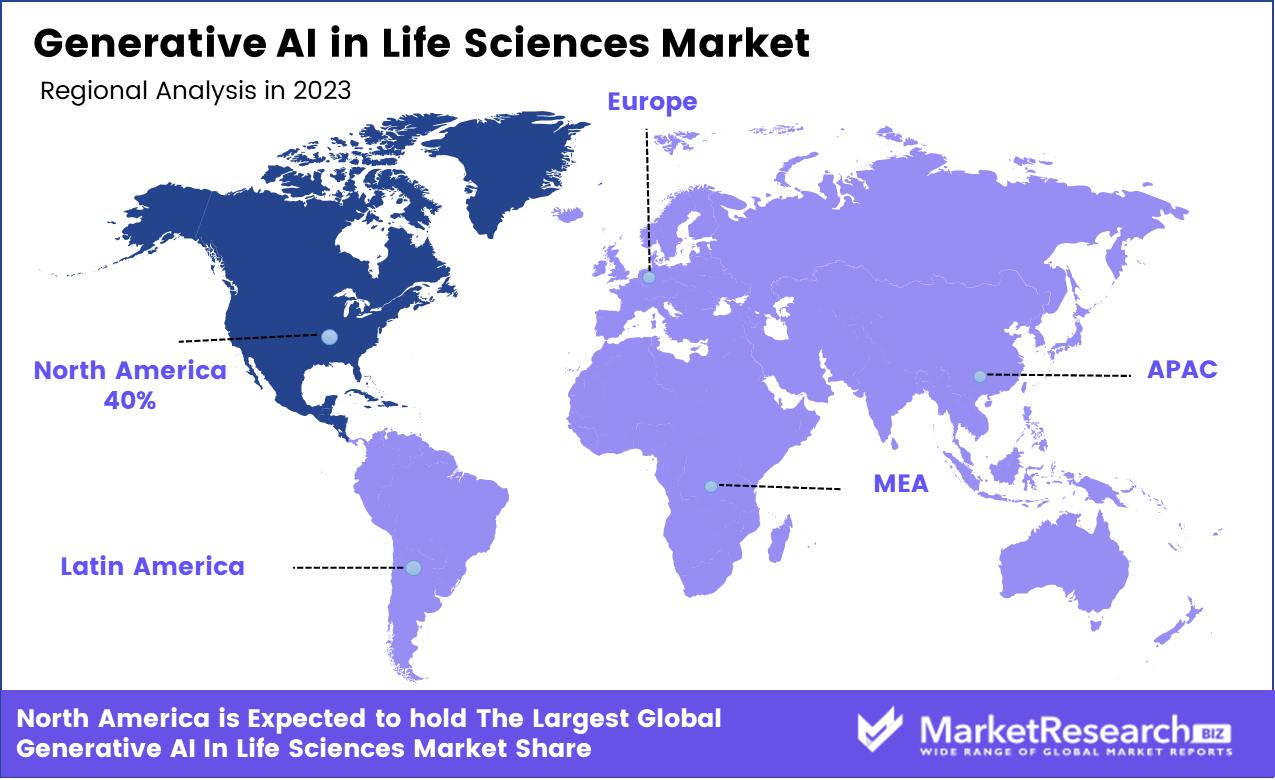
- Regional Analysis: North America holds 40% of the Generative AI Life Sciences market.
- Growth Opportunity: In 2024, Generative AI will enhance life sciences by enabling customized content for better engagement and precise patient identification for optimized care.
Driving Factors
Seamless Integration: Amplifying Outcomes in Biopharma
The integration of Generative AI with traditional AI, machine learning, and human expertise forms a robust framework that significantly enhances the biopharmaceutical industry's capacity for innovation. This fusion enables the processing of complex biological data and iterative learning, where human insight guides and refines AI outputs.
Such collaboration has been instrumental in accelerating drug discovery processes, optimizing clinical trials, and personalizing patient care. Successful case studies demonstrate how this integrated approach not only speeds up research but also increases the accuracy of predictive models, thereby reducing time-to-market for new therapies.
Ensuring Safety: Risk Management in AI Deployment
In biopharma, where the stakes involve human health, the introduction of Generative AI necessitates stringent risk management frameworks to safeguard patient safety. The industry focuses on developing protocols that address potential biases and errors in AI-generated outputs.
This proactive risk management ensures that the deployment of Generative AI adheres to regulatory standards and ethical guidelines, maintaining trust and integrity in the process. The ability to monitor and mitigate risks effectively not only protects patients but also enhances the credibility and acceptance of Generative AI technologies in sensitive healthcare applications.
Enhanced Data Utilization: Transforming Life Sciences with AI
Generative AI's ability to process and integrate vast amounts of unstructured data has revolutionized data utilization in the life sciences sector. This capability allows for the extraction of valuable insights from diverse data sets, including genetic information, clinical trial data, and real-world evidence, which were previously underutilized.
By enabling more comprehensive data analysis, Generative AI facilitates deeper scientific understanding and more informed decision-making in drug development and disease management. The enhancement in data processing capabilities driven by AI is setting new benchmarks for efficiency and effectiveness in research and development within the life sciences industry.
Restraining Factors
Communication Gaps: Stifling Efficiency in AI Integration
In the life sciences industry, the implementation of Generative AI holds vast potential for innovation and efficiency. However, the benefits of these technological advancements may not be fully realized if change management and communication within organizations are not effectively handled. Insufficient communication strategies can lead to misunderstandings, resistance to change, and a lack of alignment among stakeholders, which ultimately slow down the adoption process.
Effective change management is crucial to ensure that all levels of an organization understand the potential impacts, benefits, and changes brought about by Generative AI. This understanding helps to facilitate smoother transitions, quicker adoption, and better integration of AI technologies, thereby maximizing the intended efficiency gains and innovation potential.
The Challenge of Transparency: Navigating Data Privacy and Accuracy
Transparency in the workflows of Generative AI applications is crucial for maintaining data integrity and privacy—a critical concern in the life sciences sector. Lack of transparency can lead to errors in data handling and raise concerns about data privacy, which are significant barriers to the adoption and trust in AI technologies.
Organizations that fail to prioritize transparent processes may face regulatory and compliance challenges, potentially leading to setbacks in AI projects. By enhancing transparency, companies can not only comply with stringent regulatory requirements but also build trust among users and stakeholders, thus facilitating broader acceptance and integration of Generative AI in their operations.
By Technology Analysis
Generative AI is revolutionizing life sciences by enabling the rapid creation of innovative Novel molecule generation.
In 2023, Novel Molecule Generation held a dominant market position in the "By Technology" segment of the Generative AI in the Life Sciences Market. This technology has emerged as a cornerstone in pharmaceutical development and biotechnology, harnessing the power of AI to innovate and expedite the discovery of new molecular entities. The integration of generative AI into molecule generation not only reduces the time and cost associated with traditional drug discovery processes but also enhances the ability to predict molecule behavior, leading to more effective and targeted therapeutic solutions.
The superiority of novel molecule generation within the generative AI landscape is underscored by significant investments from leading pharmaceutical companies and the proliferation of strategic partnerships with AI tech firms. These collaborations aim to leverage cutting-edge AI algorithms to synthesize molecules with desired properties, thereby revolutionizing the approach to complex diseases and personalized medicine.
Market data indicates that the adoption of novel molecule generation technologies is driven by their potential to significantly streamline R&D pipelines and improve the success rates of preclinical drug candidates. The technology's capacity to generate viable molecular candidates with high precision underpins its pivotal role in the market, setting a precedent for future developments in the field.
Moreover, the regulatory landscape is evolving to keep pace with these technological advances, with agencies exploring frameworks to accommodate AI-driven drug discovery. This progression not only facilitates deeper market penetration but also fosters an environment ripe for innovation and growth in the pharmaceutical sector.
By Application Analysis
Generative AI accelerates drug discovery, transforming efficacy and speed in the life sciences market.
In 2023, Drug Discovery held a dominant market position in the "By Application" segment of the Generative AI in Life Sciences Market. This prominence reflects the transformative impact of AI technologies on the pharmaceutical industry, particularly in accelerating the identification and development of novel therapeutic compounds. Generative AI applications in drug discovery not only shorten the development timelines but also enhance the efficacy and safety profiles of potential drug candidates through more precise target identification and validation.
The extensive application of generative AI in drug discovery has been catalyzed by its ability to analyze vast datasets and simulate the interactions between molecules and biological systems. This capability has been pivotal in identifying potential drugs for complex diseases, such as cancer and neurodegenerative disorders, where traditional methods have faced significant challenges. The result is a substantial increase in the number of viable drug candidates entering clinical trials, thereby boosting the overall efficiency and productivity of the pharmaceutical R&D pipeline.
Financial investments in AI-driven drug discovery startups and initiatives have surged, driven by the technology’s promise to mitigate risks and reduce costs associated with drug development. This influx of capital is further supported by robust patent filings and regulatory bodies adapting guidelines to accommodate AI-specific methodologies in drug discovery processes.
The strategic importance of generative AI in drug discovery is underscored by its potential to be a game-changer in developing treatments for unmet medical needs. As AI technologies continue to evolve and integrate deeper into the drug discovery process, they are expected to drive substantial advancements in the development of novel therapeutics, thereby maintaining their predominant position in the market.
Key Market Segments
By Technology
- Novel molecule generation
- Protein sequence design
- Synthetic gene design
- Single-cell RNA sequencing
- Data augmentation for model training
- Other technologies
By Application
- Drug Discovery
- Biotechnology
- Medical Diagnosis
- Clinical Trials
- Precision and Personalized Medicine
- Patient Monitoring
Growth Opportunity
Enhanced Engagement Through Customized Content
One of the key opportunities for Generative AI in the life sciences sector in 2023 lies in its ability to generate customized promotional and medical texts. This capability allows companies to tailor their communication precisely, enhancing engagement with both healthcare professionals and patients.
By leveraging AI to produce relevant, personalized content, organizations can improve information dissemination and educational efforts, thereby increasing the effectiveness of their marketing strategies and patient outreach programs. This targeted approach not only boosts the visibility of new therapies and treatments but also supports compliance and patient understanding, which are crucial for successful health outcomes.
Precision in Patient Care with Targeted Identification
Another significant opportunity presented by Generative AI is its potential to revolutionize patient identification processes. By analyzing unstructured health record data, AI technologies can identify specific patient groups who are most likely to benefit from particular treatments. This targeted patient identification supports the development of personalized medicine and allows for more precise and effective treatment strategies.
In 2023, this capability will be increasingly critical as the life sciences sector continues to move towards more customized healthcare solutions. By enabling more accurate targeting, Generative AI not only enhances patient care but also optimizes resource allocation and treatment efficacy, leading to better health outcomes and increased efficiency in healthcare delivery.
Latest Trends
Personalization at the Forefront
A prominent trend in the 2023 Generative AI landscape within the life sciences sector is the enhancement of personalized treatments. By leveraging its capacity to analyze and derive insights from extensive datasets, Generative AI is becoming instrumental in the customization of healthcare. This technology enables the identification of unique patterns and insights from vast quantities of patient data, leading to highly personalized treatment plans. As a result, patients receive more precise therapies tailored to their specific health profiles, improving treatment outcomes and efficiency. This trend is expected to accelerate in 2023, as more life sciences organizations adopt AI-driven approaches to capitalize on the shift towards personalized medicine.
Revolutionizing Medical Imaging
Another significant trend is the application of Generative AI in medical imaging. AI technologies are increasingly being used to enhance the accuracy and efficiency of diagnosing diseases and monitoring patient progress. By processing and analyzing medical images at speeds and accuracies unattainable by human practitioners, Generative AI provides critical support in decision-making processes in clinical environments. This not only speeds up diagnosis but also enhances the capability to track disease progression or response to treatment in real time. The continued advancement and integration of AI in medical imaging represent a critical evolution in medical diagnostics, promising greater precision and faster patient throughput in 2023.
Regional Analysis
North America Dominates with 40% Market Share in Generative AI in Life Sciences Market
North America, holding a dominant 40% share of the global market, leads in the integration of Generative AI within life sciences. This region benefits from a robust technological infrastructure, substantial investments in AI and healthcare, and a strong presence of leading pharmaceutical and biotechnology companies. The U.S. and Canada are at the forefront of adopting advanced AI technologies for drug discovery, personalized medicine, and clinical research, driven by supportive regulatory frameworks and significant R&D expenditures.
Europe follows, characterized by its strong emphasis on innovation and substantial public and private funding in AI technologies. Countries like Germany, the UK, and France are pioneering in pharmaceutical research and biotechnology, leveraging AI to enhance efficiency and outcomes in these fields. The European market is further bolstered by initiatives such as the EU’s Horizon Europe program, which funds research in health and digital technologies.
Asia Pacific is identified as the fastest-growing region in the Generative AI in life sciences market. This growth is propelled by rapid economic development, increasing healthcare expenditure, and the rising adoption of digital technologies in countries such as China, Japan, and South Korea. The region benefits from government support in AI research and a growing pool of skilled professionals pushing forward innovations in genomics and epidemiology.
Latin America and the Middle East & Africa (MEA), while smaller in market size, are emerging as potential growth areas. In Latin America, countries like Brazil and Mexico are beginning to embrace AI within their life sciences sectors, driven by growing digital infrastructure and partnerships between local universities and global biotech firms. Similarly, the MEA region is witnessing gradual growth, supported by initiatives like Dubai’s AI strategy and Saudi Arabia’s Vision 2030, which emphasize the adoption of digital technologies in healthcare.
Key Regions and Countries
North America
- US
- Canada
- Mexico
Europe
- Germany
- UK
- France
- Italy
- Russia
- Spain
- Rest of Europe
APAC
- China
- Japan
- South Korea
- India
- Rest of Asia-Pacific
South America
- Brazil
- Argentina
- Rest of South America
MEA
- GCC
- South Africa
- Israel
- Rest of MEA
Key Players Analysis:
IBM Corporation continues to be a pivotal force, leveraging its extensive expertise in data analytics and machine learning. IBM's Watson Health, despite facing challenges, remains at the forefront of integrating AI into diverse life sciences applications, from drug discovery to clinical trial management. The company's robust R&D capabilities and longstanding industry partnerships position it well for sustained influence and innovation.
AiCure LLC is noted for its AI-driven platform that improves patient monitoring and adherence in clinical trials. By using AI to analyze patient interactions with medications, AiCure enhances data accuracy and outcomes in clinical research, positioning itself as a crucial player in operational facets of pharmaceutical development.
MosaicML is emerging as a significant contender by focusing on making machine learning models more efficient and cost-effective. Their work is pivotal in reducing the computational and financial barriers associated with deploying AI, which is critical for the scalability of AI applications in life sciences.
NVIDIA, traditionally dominant in the GPU market, has successfully pivoted its offerings to cater specifically to AI-driven applications, including those in life sciences. NVIDIA's hardware and software ecosystems are instrumental in supporting complex AI workloads involved in genomics and molecular modeling.
Insilico Medicine Inc. excels in using AI for drug discovery and aging research. Their innovative approach to using deep learning to identify novel targets and biomarkers rapidly accelerates the pace of development in therapeutics.
Writer, HealthArk, and other key players each contribute through specialized AI applications, ranging from content generation that aids in research documentation to bespoke solutions tailored for emerging healthcare markets.
Top Key Players in Market
- IBM Corporation
- AiCure LLC
- MosaicML
- NVIDIA
- Insilico Medicine Inc.
- Writer
- HealthArk
- Other Key Players
Recent Development
- In April 2024, According to various reports from global consulting firms like the Korea Health Industry Development Institute, KPMG, Deloitte, and Bain & Company, generative AI is increasingly recognized as a key investment priority among life sciences and healthcare CEOs, with anticipated significant impacts on profitability, operational efficiency, and healthcare delivery over the next decade.
- In April 2024, Cognizant is partnering with NVIDIA to utilize the NVIDIA BioNeMo generative AI platform to enhance drug discovery and development in the life sciences sector, aiming to improve productivity and accelerate the delivery of new treatments.
- In March 2024, Clarivate Plc announced the acquisition of key assets from MotionHall, aiming to bolster its Life Sciences & Healthcare offerings by integrating advanced AI technologies into its products and services.
- In March 2024, NVIDIA launched over two dozen new healthcare microservices, including NVIDIA NIM™ AI models and workflows, to enhance generative AI applications across drug discovery, medical imaging, and genomics analysis, available on various platforms and accessible globally.
Report Scope
Report Features Description Market Value (2023) USD 187.4 Mn Forecast Revenue (2033) USD 1,140.5 Mn CAGR (2024-2033) 20.35% Base Year for Estimation 2023 Historic Period 2016-2023 Forecast Period 2024-2033 Report Coverage Revenue Forecast, Market Dynamics, COVID-19 Impact, Competitive Landscape, Recent Developments Segments Covered By Technology (Novel molecule generation, Protein sequence design, Synthetic gene design, Single-cell RNA sequencing, Data augmentation for model training, and other technologies), By Application (Drug Discovery, Biotechnology, Medical Diagnosis, Clinical Trials, Precision, and Personalized Medicine, Patient Monitoring) Regional Analysis North America – The US, Canada, & Mexico; Western Europe – Germany, France, The UK, Spain, Italy, Portugal, Ireland, Austria, Switzerland, Benelux, Nordic, & Rest of Western Europe; Eastern Europe – Russia, Poland, The Czech Republic, Greece, & Rest of Eastern Europe; APAC – China, Japan, South Korea, India, Australia & New Zealand, Indonesia, Malaysia, Philippines, Singapore, Thailand, Vietnam, & Rest of APAC; Latin America – Brazil, Colombia, Chile, Argentina, Costa Rica, & Rest of Latin America; the Middle East & Africa – Algeria, Egypt, Israel, Kuwait, Nigeria, Saudi Arabia, South Africa, Turkey, United Arab Emirates, & Rest of MEA Competitive Landscape IBM Corporation, AiCure LLC, MosaicML, NVIDIA, Insilico Medicine Inc., Writer, HealthArk, and Other Key Players Customization Scope Customization for segments, region/country-level will be provided. Moreover, additional customization can be done based on the requirements. Purchase Options We have three licenses to opt for: Single User License, Multi-User License (Up to 5 Users), Corporate Use License (Unlimited User and Printable PDF) -
-
- IBM Corporation
- AiCure LLC
- MosaicML
- NVIDIA
- Insilico Medicine Inc.
- Writer
- HealthArk
- Other Key Players
Our Clients


View Our Licence Options
