
Generative AI In Real Estate Market Based on Component(Services, Software tools, Platforms), Based on the Deployment mode(Cloud-based, On-premises), Based on Applications(Property Valuation, Building Design, Predictive Maintenance, Energy Management, Other Applications), Based on End-User(Real Estate Agents, Property Managers, Architects, Engineers, Other End-Users), By Region And Companies - Industry Segment Outlook, Market Assessment, Competition Scenario, Trends, And Forecast 2024-2033
-
37323
-
April 2024
-
300
-


-
This report was compiled by Vishwa Gaul Vishwa is an experienced market research and consulting professional with over 8 years of expertise in the ICT industry, contributing to over 700 reports across telecommunications, software, hardware, and digital solutions. Correspondence Team Lead- ICT Linkedin | Detailed Market research Methodology Our methodology involves a mix of primary research, including interviews with leading mental health experts, and secondary research from reputable medical journals and databases. View Detailed Methodology Page
-
Quick Navigation
Report Overview
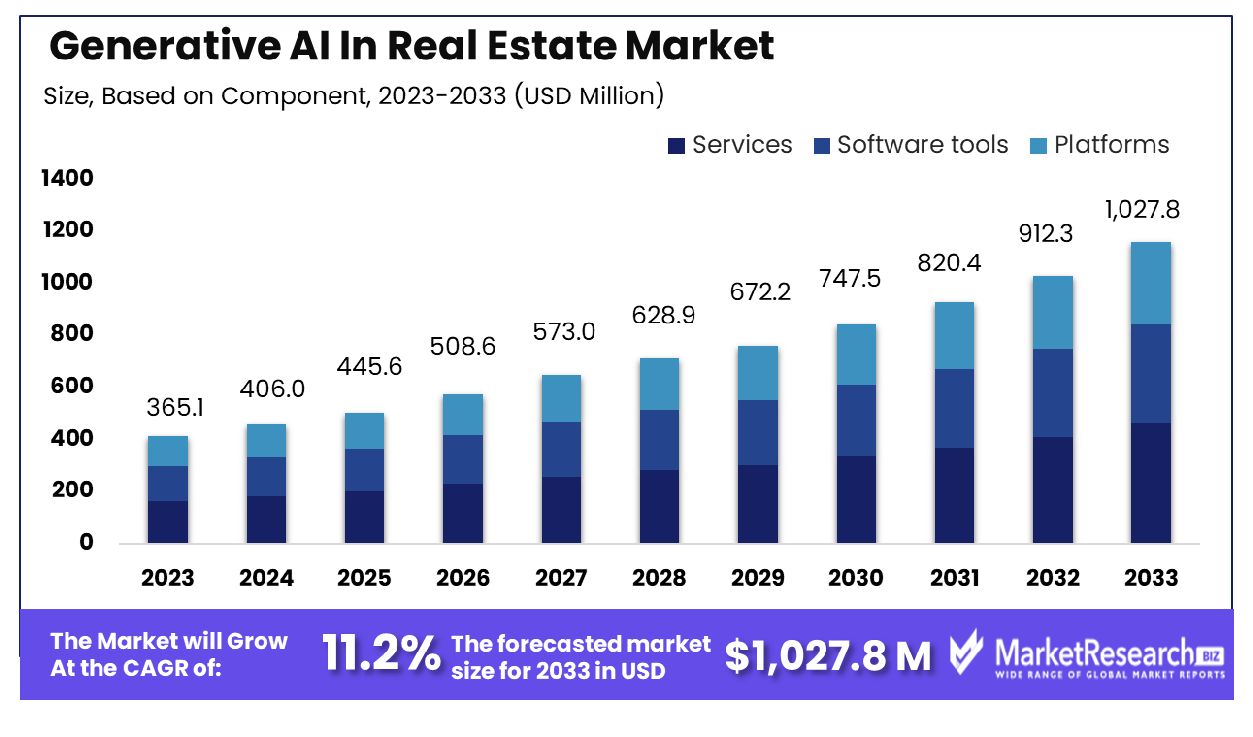
The Generative AI In Real Estate Market was valued at USD 365.1 Million in 2023. It is expected to reach USD 1,027.8 Million by 2033, with a CAGR of 11.2% during the forecast period from 2024 to 2033. The surge in demand for advanced technologies, rise in construction sectors and urbanization are some of the main key driving factors for generative AI in real estate.
Generative AI in real estate is defined as the application of artificial intelligence methods to enhance different aspects of party management, investment, funding analysis, and customer services within the real estate industry. Implementing advanced algorithms and machine learning models, generative AI helps in tasks like property valuation, market trend analysis, and customized property suggestions. It helps in the development of virtual staging, architectural designs, and forecasting modeling for property development and investment decision-making.
Moreover, generative AI improves customer experiences by providing customized property suggestions, automated virtual tours, and intelligent chatbots for inquiries and assistance. By analyzing huge quantities of real estate data, comprising market trends, property attributes, and customer choices, generative AI makes stakeholders make data-driven decisions, simplify operations, and enhance resources, ultimately driving efficacy, profitability, and customer satisfaction in the real estate sector.
A report published by McKinsey in November 2023, highlights that gen AI could generate USD 110 billion to USD 180 billion or more in value for the real estate sector. Real estate companies have gained more than 10% or in net operating income through more efficient operating models, stronger customer experience, tenant retention, new revenue streams, and smarter asset selection.
Moreover, Deloitte in 2024 highlights that a survey was conducted where it was found that 72% of participating real estate owners and investors around the globe are already committing, or plan to commit, hard dollars to some type of AI-enabled solutions within their organizations. Additionally, Deloitte Center for Financial Services analysis of real estate firms’ investment into broader AI and ML companies witnessed that since 2017, there have been considerable levels of venture capital investment, totaling USD 7.2 billion.
Since the rise of generative AI in 2021, corporate investment volumes totaled over USD 3.5 billion through October 2023, outdoing the total from 2018 to 2020 by nearly 50%, and the total of the 3 years before the pandemic by 95%. The areas of greatest interest to these real estate investors include AI and ML services for transaction-focused function areas like property listings (42%), investment and valuation (20%), and real estate data analytics (8%).
Generative AI in real estate simplifies property valuation, improves market analysis, and provides customized suggestions for buyers and sellers. It enhances marketing efforts through virtual staging and targeting advertising. Moreover, it optimizes customer engagement with automated virtual tours and intelligent chatbots, ultimately facilitating faster transactions and higher client satisfaction. The demand for gen AI in real estate will increase due to its requirement in the construction sector which will help in market expansion in the coming years.
Key Takeaways
- Market Growth: The Generative AI In Real Estate Market was valued at USD 365.1 Million in 2023. It is expected to reach USD 1,027.8 Million by 2033, with a CAGR of 11.2% during the forecast period from 2024 to 2033.
- Based on Component: Services dominated the component segment with a notable 43% share.
- Based on the Deployment mode: Cloud-based deployment was prevalent, capturing 59% of the market share.
- Based on Applications: Property valuation led applications, constituting 32% of the total usage.
- Based on End-User: Real estate agents were the primary end-users, dominating at 31%.
- Regional Dominance: North America dominates with 39.3% of the Generative AI in Real Estate Market.
- Growth Opportunity: In 2023, generative AI significantly transformed the real estate sector by enhancing personalized customer experiences and automating marketing efforts, thereby increasing efficiency and profitability.
Driving factors
Enhancing Real Estate Visuals and Staging with Generative AI
Generative AI is revolutionizing the real estate industry by enabling the production of highly realistic property images and virtual staging of void spaces. This technology allows real estate companies to create engaging and immersive visual content that can significantly enhance the appeal of listed properties.
By generating detailed and attractive visuals of properties, including furnished interiors and potential renovations, generative AI helps reduce the imagination gap for potential buyers, making it easier for them to visualize themselves in the space. This capability not only improves marketing strategies but also has the potential to increase property viewings and accelerate sales cycles, contributing to the overall growth of the real estate market.
Streamlining Urban Planning and Property Valuation through AI
Generative AI plays a crucial role in urban planning and property valuation by providing simulations and modeling that predict various urban development scenarios and their impacts. This technology assists in creating more accurate and dynamic property appraisals by considering a multitude of factors such as location, nearby amenities, and future urban planning developments.
The ability to simulate different scenarios and forecast their potential impacts on property values enhances decision-making for investors, planners, and developers, leading to more strategic investments and efficient use of resources. This not only improves the accuracy of property valuations but also supports smarter urban planning, driving growth in the real estate sector.
Enhancing Client Experiences with AI Assistants
Generative AI enhances client experiences significantly by employing AI assistants that provide instant, personalized responses to inquiries and support. These AI assistants can handle a range of tasks from scheduling property viewings to providing detailed information about listings, thus offering a higher level of service and engagement to potential buyers.
The use of AI for client interaction not only streamlines the communication process but also ensures that clients receive consistent, accurate information, enhancing their overall satisfaction and trust in the real estate service provider. Enhanced client experiences lead to increased customer retention and referrals, which are vital for the sustained growth of real estate businesses.
Restraining Factors
Financial Barriers Due to High Initial Investment Costs
The implementation of generative AI within the real estate sector is often hindered by significant initial investment costs. These costs encompass acquiring advanced hardware and software, as well as the expense of training personnel to proficiently use these technologies. The high upfront costs can be particularly prohibitive for smaller firms or startups, which may struggle to allocate sufficient capital for such technologies without guaranteeing a quick return on investment.
This financial barrier can slow the adoption rate of generative AI in real estate, limiting the growth potential of the market. However, as the technology matures and becomes more cost-effective, and as the benefits of AI-driven efficiencies become more apparent, more real estate companies are likely to make the necessary investments, eventually contributing to the broader adoption and growth of the market.
Growth Impediments Due to Data Limitations
The effectiveness and scalability of generative AI applications in real estate are highly contingent upon the availability of high-quality, diverse, and representative datasets. The industry often faces challenges related to the limited availability of such data, which can restrict the performance and accuracy of AI models. Data limitations can impede the ability of generative AI tools to produce reliable and actionable insights, which are crucial for tasks such as property valuation, market analysis, and customer service.
This not only affects the credibility and adoption of AI solutions but also stifles innovation within the sector. Overcoming these data challenges is essential for the advancement of generative AI in real estate, necessitating investment in data collection, processing, and management to ensure the development of robust AI applications that can drive market growth.
Based on Component Analysis
In the component breakdown, services commanded the largest share, holding a significant 43% of the market.
In 2023, Services held a dominant market position in the Based on Component segment of the Generative AI in Real Estate Market, capturing more than 3% of the market share. Software Tools and Platforms also represented significant components, contributing to the diversified application of Generative AI technologies within the sector.
The prominence of Services in this segment can be attributed to the critical need for customized solutions that cater to specific real estate operations such as property management, automated documentation, and client interactions. These services enhance the operational efficiency of real estate businesses by leveraging AI to automate routine tasks, thereby allowing companies to focus on strategic decision-making and customer engagement.
Software Tools accounted for a substantial portion of the market, driven by the adoption of AI-enabled analytics platforms that provide insights into market trends, buyer preferences, and investment opportunities. These tools enable real estate professionals to make data-driven decisions that optimize property portfolio performance and enhance competitive positioning.
Platforms form the backbone of the Generative AI integration, facilitating the deployment of various applications from virtual property tours to predictive maintenance models. The growth in this segment is propelled by the increasing demand for platforms that can integrate multiple AI functionalities into a cohesive system, offering scalability and flexibility in real estate operations.
Based on the Deployment mode Analysis
Within deployment modes, cloud-based solutions were prevalent, accounting for 59% of the market.
In 2023, Cloud-based solutions held a dominant market position in the Based on the Deployment mode segment of the Generative AI in Real Estate Market, capturing more than a 59% share. The On-premises solutions, while substantial, occupied a smaller fraction of the market, highlighting a clear preference for cloud-based architectures among industry participants.
The significant market share of Cloud-based platforms is primarily driven by their scalability, cost-effectiveness, and ease of integration with existing real estate systems. These platforms enable real estate businesses to leverage advanced AI capabilities without the need for extensive capital investment in hardware infrastructure. Moreover, cloud-based solutions offer enhanced flexibility and accessibility, allowing users to access sophisticated tools and analytics from anywhere, which is particularly beneficial in the geographically dispersed real estate industry.
On-premises deployment, although less prevalent, is preferred by organizations seeking enhanced control over their data and more stringent security measures. This deployment mode is typically favored by large enterprises with complex operations that require bespoke integrations and high levels of customization.
As the market continues to evolve, the demand for cloud-based Generative AI solutions in the real estate sector is anticipated to grow, driven by ongoing technological advancements and the increasing need for real-time, data-driven decision-making processes. The transition towards cloud environments is expected to accelerate, underscoring a shift in strategic priorities towards more agile and scalable AI implementations in the real estate domain.
Based on Applications Analysis
Focusing on applications, property valuation emerged as the dominant use case, capturing 32%.
In 2023, Property Valuation held a dominant market position in the Based on Applications segment of the Generative AI in Real Estate Market, capturing more than a 32% share. Other significant applications include Building Design, Predictive Maintenance, Energy Management, and various emerging applications.
The prominence of Property Valuation in this market segment underscores its critical role in modern real estate operations. Generative AI technologies enhance the accuracy and efficiency of property valuation processes by integrating vast datasets, including historical sales, current market conditions, and future trend predictions. This capability not only speeds up the valuation process but also improves its precision, helping real estate professionals make informed investment and pricing decisions.
Building Design follows as a notable application, with AI tools increasingly used to generate sustainable, efficient, and cost-effective architectural plans. These tools facilitate the creation of designs that optimize the use of space and materials while adhering to regulatory standards and environmental considerations.
Predictive Maintenance and Energy Management applications are also gaining traction, driven by the need for sustainable property management solutions. Generative AI helps in predicting maintenance needs and optimizing energy consumption, which not only reduces operational costs but also enhances the lifespan and performance of real estate assets.
Other applications are emerging as technology progresses, including automated tenant screening, virtual reality tours, and personalized marketing strategies, further demonstrating the expanding influence of Generative AI in the real estate sector. As adoption continues to grow, these applications are expected to play increasingly integral roles in shaping the future of real estate operations.
Based on End-User Analysis
Among end-users, real estate agents were the primary beneficiaries, representing 31% of the market segment.
In 2023, Real Estate Agents held a dominant market position in the Based on End-User segment of the Generative AI in Real Estate Market, capturing more than a 31% share. Other key end-users include Property Managers, Architects, Engineers, and a variety of other professionals within the sector.
The significant market share held by Real Estate Agents can be attributed to their increasing reliance on Generative AI to enhance various aspects of buying and selling properties. AI technologies are utilized to automate tasks such as property listings, customer inquiries, and transaction management, allowing agents to increase efficiency and focus more on client interaction and closing deals. Additionally, AI-driven analytics tools provide agents with enhanced market insights and buyer preference patterns, enabling more targeted marketing strategies and personalized customer service.
Property Managers also represent a substantial portion of the market. They employ Generative AI for functions like lease management, maintenance scheduling, and tenant relations, which streamline operations and improve the profitability of property portfolios.
Architects and Engineers use AI to optimize building designs and infrastructure projects, integrating sustainability and efficiency into their plans from the earliest stages. This not only helps in adhering to modern building standards but also in creating innovative solutions that meet the evolving demands of the real estate market.
Other end users, including developers and investment firms, leverage Generative AI for various applications ranging from investment analysis to risk assessment, underscoring the technology’s broad applicability. The ongoing expansion of Generative AI into diverse real estate practices illustrates its pivotal role in transforming the industry landscape.
Key Market Segments
Based on Component
- Services
- Software tools
- Platforms
Based on the Deployment mode
- Cloud-based
- On-premises
Based on Applications
- Property Valuation
- Building Design
- Predictive Maintenance
- Energy Management
- Other Applications
Based on End-User
- Real Estate Agents
- Property Managers
- Architects
- Engineers
- Other End-Users
Growth Opportunity
Personalized Customer Experiences with AI Assistants
In 2023, the deployment of generative AI in the real estate sector significantly enhanced personalized customer experiences. AI assistants, leveraging advanced machine learning algorithms, have been instrumental in transforming customer interactions. These technologies facilitate a more tailored approach by analyzing individual customer data and generating customized communication in real time.
This capability enables real estate companies to offer personalized property recommendations, virtual tours, and customer service, which significantly improves client engagement and satisfaction. The integration of AI assistants into customer relationship management systems is recognized as a pivotal factor in increasing customer retention and acquisition rates, thereby driving market growth.
Time and Cost Savings in Marketing and Sales Efforts
Generative AI technologies have revolutionized marketing and sales strategies within the real estate industry by introducing significant time and cost efficiencies. These AI systems automate routine tasks such as content creation for listings, email marketing, and social media management, which traditionally consume considerable human resources. By synthesizing data-driven content that resonates with targeted demographics, generative AI enhances the efficacy of marketing campaigns and increases conversion rates.
Moreover, AI-driven analytics provide real-time insights into market trends and customer behaviors, allowing for agile adjustments to marketing strategies. The adoption of these AI solutions translates into reduced operational costs and increased profitability, positioning generative AI as a critical investment for forward-thinking real estate businesses in 2023.
Latest Trends
Automated Document Processing and Contract Generation Using AI
The real estate industry in 2023 witnessed a transformative trend in the form of automated document processing and contract generation through generative AI. This technology streamlined the traditionally cumbersome processes associated with real estate transactions. By employing natural language processing and machine learning, generative AI systems can analyze, prepare, and manage vast quantities of documents with greater accuracy and significantly reduced turnaround times.
These AI solutions automate the generation of legally compliant contracts, lease agreements, and due diligence documents, mitigating the risk of human error and enhancing operational efficiencies. The adoption of these technologies not only accelerated transaction cycles but also offered substantial cost savings, making it a pivotal trend in the real estate sector’s digital transformation journey.
Integration of AI in Property Management for Predictive Maintenance
Another prominent trend in 2023 is the integration of AI in property management, particularly for predictive maintenance. Generative AI systems, equipped with predictive analytics, have become essential in forecasting maintenance needs and scheduling repairs proactively. This approach helps in preventing costly breakdowns and extending the lifespan of property assets.
AI-driven predictive maintenance programs analyze historical data and real-time inputs from IoT devices to predict potential issues before they occur. This technology enhances the efficiency of property management, reduces downtime, and improves tenant satisfaction. The strategic deployment of AI in this area not only optimizes maintenance operations but also contributes to sustainable property management practices, marking a significant trend in the industry’s evolution.
Regional Analysis
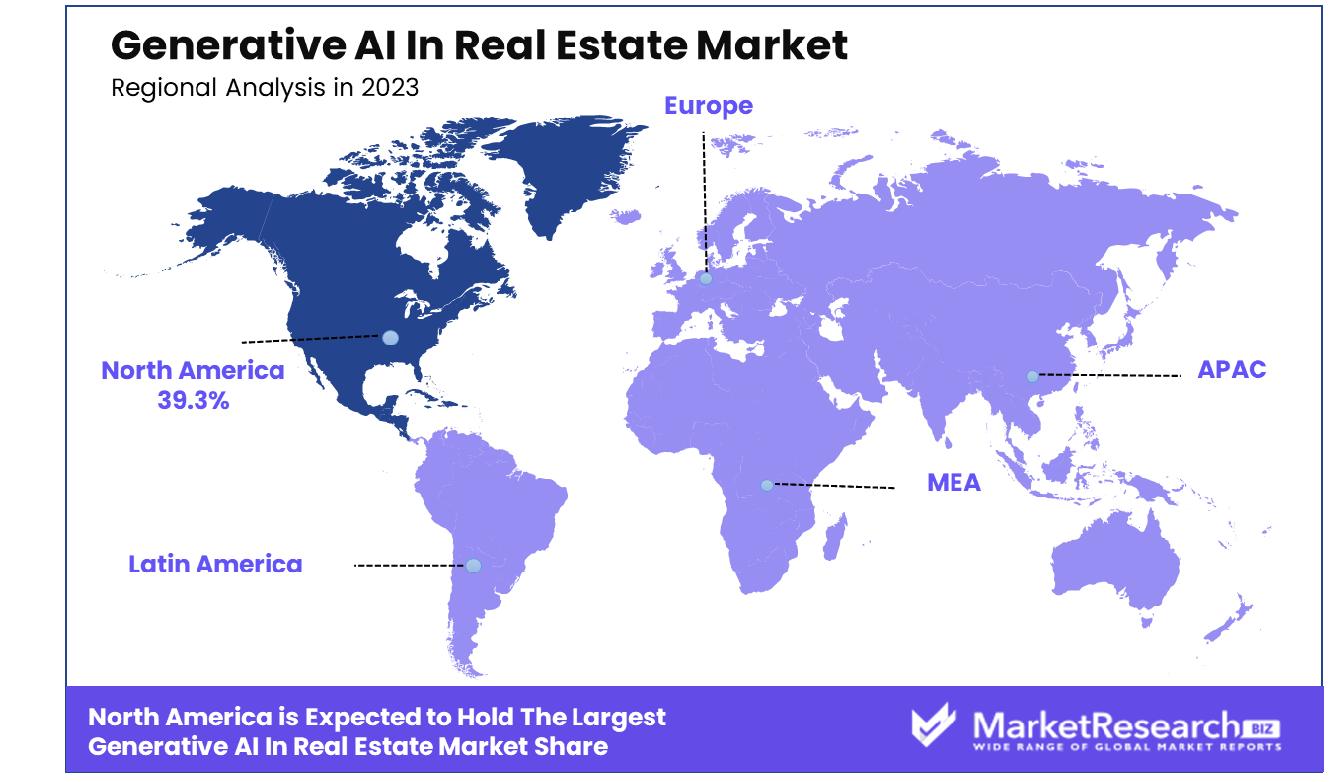
In North America, generative AI captured 39.3% of the real estate market in 2023.
The Generative AI in Real Estate Market is experiencing significant growth across various global regions, each demonstrating unique market dynamics and adoption rates.
North America holds a substantial share of the market, accounting for 39.3% of global sales. This region's strong performance is driven by rapid technological adoption and a robust real estate sector that is keen on integrating AI for competitive advantage. Europe follows closely, with a focus on enhancing real estate transactions and management through AI, bolstered by supportive regulations and digital transformation initiatives.
Asia-Pacific, however, emerges as the dominant region, commanding an impressive 53.8% of the market. This dominance is fueled by significant investments in AI technologies and the rapid expansion of real estate sectors in emerging economies such as China and India. The region benefits from a high rate of urbanization and a burgeoning middle class, which increases demand for sophisticated real estate solutions.
The Middle East & Africa and Latin America regions, while smaller in comparison, are experiencing gradual growth. In the Middle East & Africa, the market's expansion is supported by smart city projects and a growing emphasis on sustainable and technologically advanced infrastructure. Latin America is witnessing a rise in generative AI adoption as companies seek to enhance operational efficiencies and customer service in the real estate sector.
Key Regions and Countries
North America
- The US
- Canada
- Rest of North America
Europe
- Germany
- France
- The UK
- Spain
- Netherlands
- Russia
- Italy
- Rest of Europe
Asia-Pacific
- China
- Japan
- Singapore
- Thailand
- South Korea
- Vietnam
- India
- New Zealand
- Rest of Asia Pacific
Latin America
- Mexico
- Brazil
- Rest of Latin America
Middle East & Africa
- Saudi Arabia
- South Africa
- UAE
- Rest of Middle East & Africa
Key Players Analysis
In 2023, the global Generative AI in Real Estate market witnessed significant contributions from a select group of key players, each offering innovative solutions to transform various aspects of the real estate sector. Among these, Autodesk stands out for its integration of generative design technologies in architectural planning and construction management, enhancing efficiency and sustainability in building designs.
OpenAI, a pivotal force in generative AI, has continued to influence the real estate market through advanced AI models capable of automating property valuations and market analysis, thus providing stakeholders with enhanced decision-making tools.
Matterport has revolutionized property visualization and virtual tours by employing AI to create 3D models of real estate properties. This technology has significantly improved the remote viewing experience and accuracy of property presentations, thereby facilitating more informed investment and purchasing decisions.
Archistar and Gridics have carved niches in optimizing zoning and land use with AI-driven analytics, aiding developers and urban planners in maximizing land utilization while adhering to regulatory frameworks.
Cherry and HqO have emerged as notable players in enhancing tenant experiences and building management through AI. Cherry's focus on AI-driven leasing automation and HqO's expertise in tenant engagement platforms demonstrate the expanding role of AI in operational efficiencies and tenant satisfaction.
Companies like Ai and Io, though less specific in their market focus, contribute broadly to the real estate AI ecosystem through bespoke solutions that address various industry pain points.
Market Key Players
- Autodesk
- OpenAI
- Matterport
- Archistar
- Gridics
- Cherry
- HqO
- ai
- io
- Other Key Players
Recent Development
- In February 2024, FoxyAI utilizes AI-driven computer vision to transform property photos into actionable data, enhancing efficiency and margins for clients in real estate. Their solutions optimize valuations and streamline transactions.
- In February 2024, NAR's Strategic Business, Innovation, and Technology (SBIT) group drives real estate innovation by investing in startups, providing exclusive tech solutions, hosting tech events, and offering personalized domains for REALTORS®.
- In February 2024, Big Tech giants, including Amazon, Apple, Google, Meta, Microsoft, and Nvidia, are heavily investing in generative AI, shaping future technology trends with implications for real estate professionals.
Report Scope
Report Features Description Market Value (2023) USD 365.1 Million Forecast Revenue (2033) USD 1,027.8 Million CAGR (2024-2032) 11.2% Base Year for Estimation 2023 Historic Period 2016-2023 Forecast Period 2024-2033 Report Coverage Revenue Forecast, Market Dynamics, COVID-19 Impact, Competitive Landscape, Recent Developments Segments Covered Based on Component(Services, Software tools, Platforms), Based on the Deployment mode(Cloud-based, On-premises), Based on Applications(Property Valuation, Building Design, Predictive Maintenance, Energy Management, Other Applications), Based on End-User(Real Estate Agents, Property Managers, Architects, Engineers, Other End-Users) Regional Analysis North America - The US, Canada, Rest of North America, Europe - Germany, France, The UK, Spain, Italy, Russia, Netherlands, Rest of Europe, Asia-Pacific - China, Japan, South Korea, India, New Zealand, Singapore, Thailand, Vietnam, Rest of Asia Pacific, Latin America - Brazil, Mexico, Rest of Latin America, Middle East & Africa - South Africa, Saudi Arabia, UAE, Rest of Middle East & Africa Competitive Landscape Autodesk, OpenAI, Matterport, Archistar, Gridics, Cherry, HqO, ai, io, Other Key Players Customization Scope Customization for segments, region/country-level will be provided. Moreover, additional customization can be done based on the requirements. Purchase Options We have three licenses to opt for Single User License, Multi-User License (Up to 5 Users), Corporate Use License (Unlimited User and Printable PDF) -
-
- Autodesk
- OpenAI
- Matterport
- Archistar
- Gridics
- Cherry
- HqO
- ai
- io
- Other Key Players
Our Clients


View Our Licence Options
