
Generative AI in Government Market Report By Application (Data Generation and Augmentation, Policy Analysis, Cybersecurity, Natural Language Processing, Other Applications), By Deployment Mode (On-Premises, Cloud-Based), By End User, By Region and Companies - Industry Segment Outlook, Market Assessment, Competition Scenario, Trends and Forecast 2024-2033
-
37807
-
March 2024
-
137
-


-
This report was compiled by Vishwa Gaul Vishwa is an experienced market research and consulting professional with over 8 years of expertise in the ICT industry, contributing to over 700 reports across telecommunications, software, hardware, and digital solutions. Correspondence Team Lead- ICT Linkedin | Detailed Market research Methodology Our methodology involves a mix of primary research, including interviews with leading mental health experts, and secondary research from reputable medical journals and databases. View Detailed Methodology Page
-
Quick Navigation
Report Overview
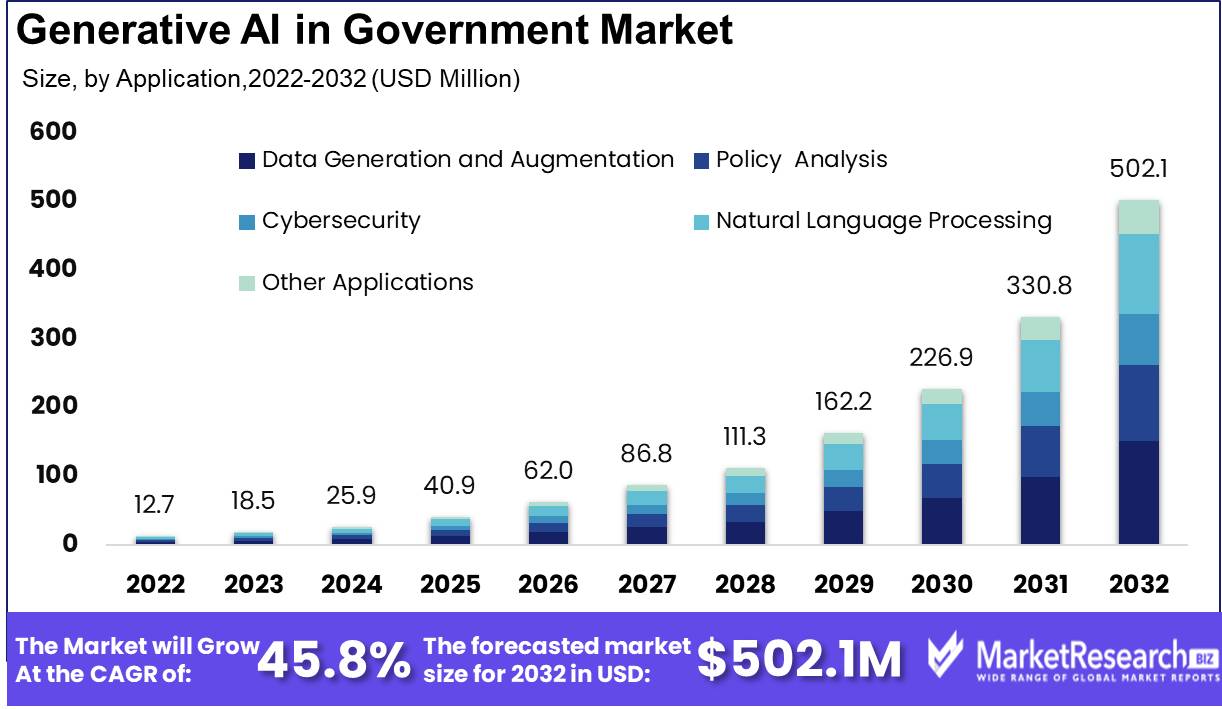
The Global Generative AI in Government Market size is expected to be worth around USD 502.1 Million by 2032, from USD 12.7 Million in 2022, growing at a CAGR of 45.80% during the forecast period from 2023 to 2032.
The surge in demand for the advanced technology and rise in government opportunities are some of the main key driving factors for the generative artificial intelligence in government market.
Generative AI in government defines to the usage of generative AI technologies within governmental systems and methods. This comprises of using AI algorithms which has the potentiality of developing new data, solutions and contents based on the present patterns and data sets. In governance, Gen AI can be used for several purposes like analysing large data sets to get insights, automating administrative tasks, producing reports and even formulating the policy suggestions.
Moreover, it can help in decision making process by simulating situations or forecasting results based on past data. However, the implementation of generative AI in government raises ethical, accountability and privacy issues, as decisions are made by artificial intelligence systems that may privation translucent and oversight. Thus, proper regulation and responsible execution are essential to make sure that the generative AI technologies helps the public interest while preserving principles of fairness, accountability and equity in the government operations.
According to an article published by BCG in November 2023, highlights that generative AI can make the public sector to enhance productivity and service quality. It is estimated that the production value of GenAI is USD 1.75 trillion yearly all across the state, provisional, national and governments.
The government market for the gen AI applications is estimated to rise more than the 50% per year. By implementing gen AI, it is unlocking many opportunities, governments are prioritizing more on the high value use cases, upholds initial leaning, create workforce skills and governance mechanism that can build responsible AI structure and encourage new innovations.
The surge in importance of generative AI in government is due to its potentiality to change the decision making methods that improves the efficacy and public services. By implementing AI algorithms, governments can analyse huge quantity of data to extract actionable insights, augment resource allocations and forecast trends.
Moreover, generative AI can support the development of new innovative solutions to complex societal risks, nurturing a quicker and adaptive government that fulfils the emerging requirement of its constituents while promoting translucent and accountability. The demand for the generative AI in government market will increase due to its advanced technologies that will help in market expansion in the coming years.
Key Takeaways
- Market Value: The Global Generative AI in Government Market is projected to reach approximately USD 502.1 Million by 2032, reflecting significant growth from USD 12.7 Million in 2022, with a remarkable CAGR of 45.80% during the forecast period from 2023 to 2032.
- Major Segments:
- Application Analysis: Data Generation and Augmentation emerges as the dominant sub-segment, driving significant market growth. It accounts for a substantial portion of market share, reflecting the pivotal role of generative AI in enhancing data sets for predictive analytics and decision-making processes.
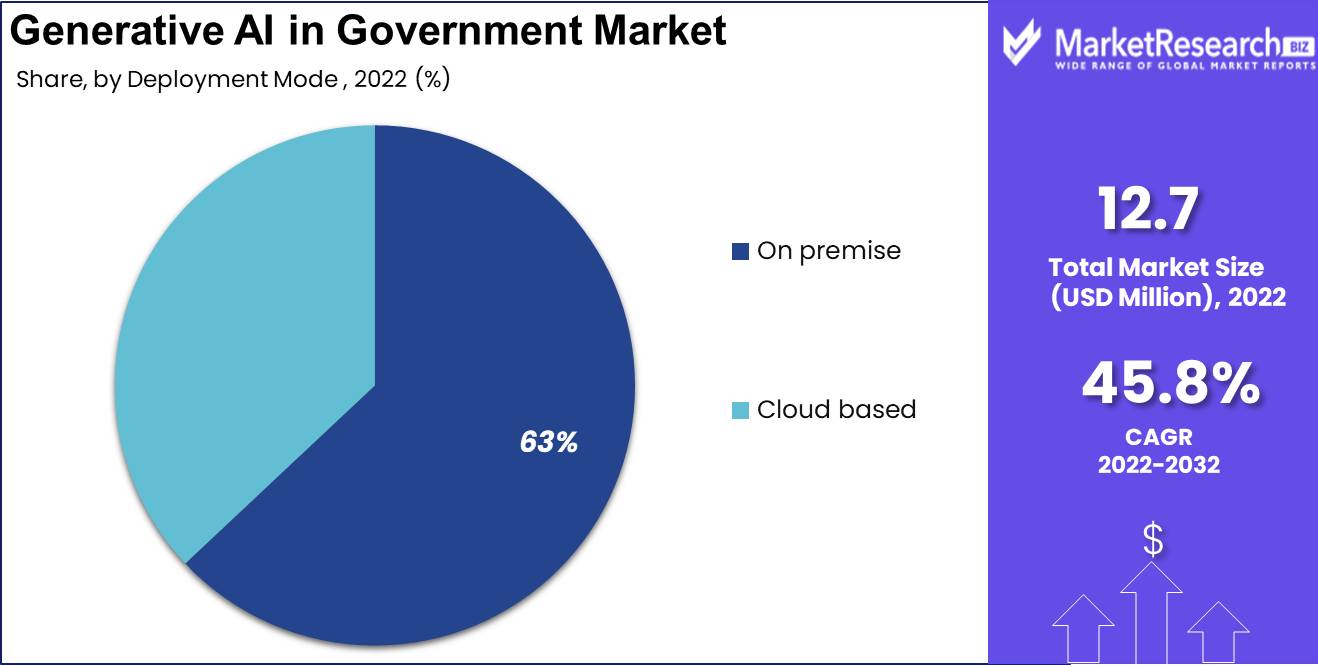
- Deployment Mode Analysis: On-Premises solutions lead the Deployment Mode segment, capturing 63% of the market, driven by heightened concerns over data security and sovereignty. Cloud-Based deployment, although growing, is tempered by ongoing security and governance concerns.
- End User Analysis: Government Agencies dominate the End User segment, reflecting the widespread adoption of AI technologies across various sectors to enhance public services, streamline administrative processes, and improve policy outcomes.
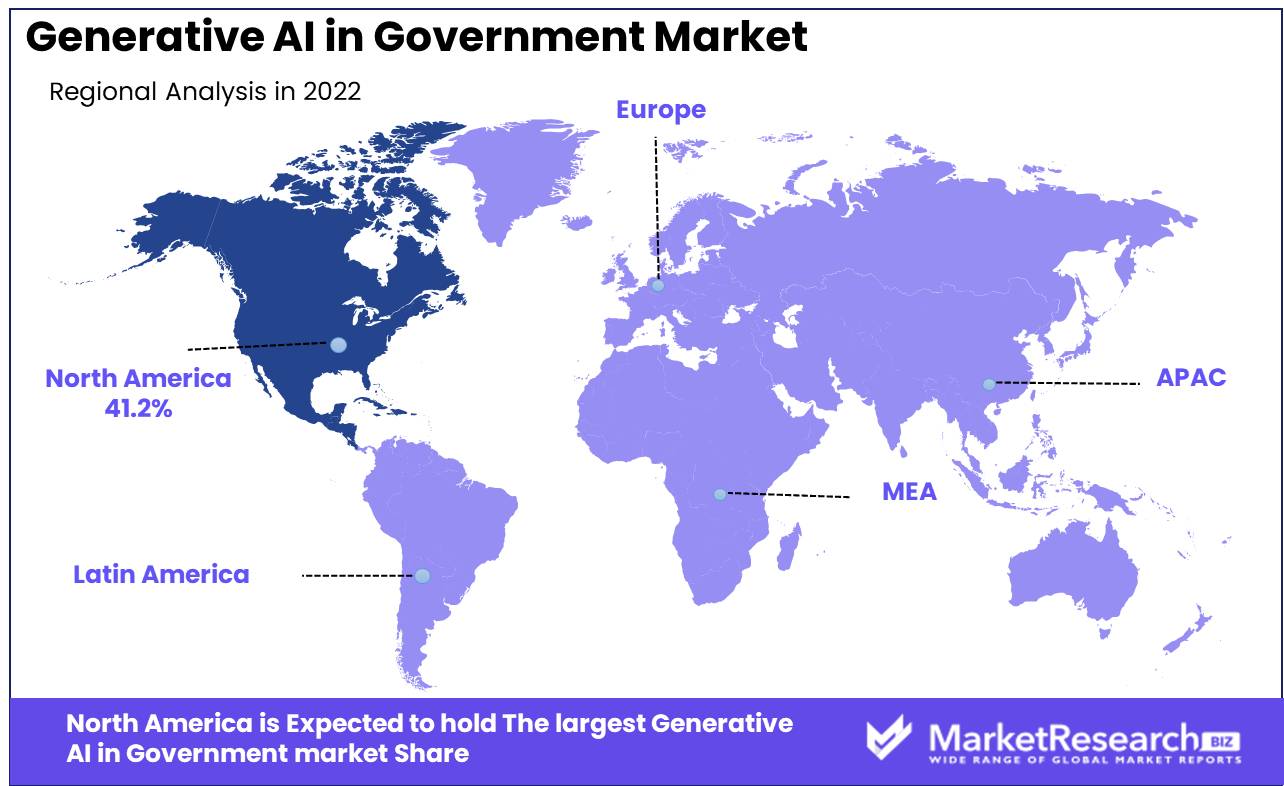
- Regional Analysis: North America dominates the market with a 42% market share, reflecting strong adoption and investment in generative AI technologies within government agencies.
- Analyst Viewpoint: The future of the Generative AI in Government Market will witness a transformative shift towards data-driven decision-making and enhanced service delivery, driven by advancements in AI algorithms and emerging technologies.
- Growth Opportunities: Opportunities for market growth lie in addressing security and governance concerns associated with cloud-based deployment, further enhancing AI capabilities for data generation and augmentation, and fostering collaboration across government agencies and stakeholders to optimize AI adoption and maximize its impact on public service delivery.
Driving Factors
Automation of Repetitive Tasks Drives Market Growth
The integration of Generative AI in automating repetitive tasks marks a pivotal advancement for the government sector. By streamlining operations such as data entry, document processing, and report generation, AI introduces significant efficiency gains and cost reductions. For instance, the U.S. Department of Veterans Affairs exemplifies this trend by utilizing AI to automate claims processing, thereby enhancing service delivery and reducing backlog.
This automation capability of Generative AI not only optimizes resource allocation but also reallocates human capital towards more strategic and complex tasks, leading to improved productivity and innovation within government agencies. The synergy between Generative AI and human creativity fosters a dynamic environment for tackling contemporary challenges, ultimately driving market growth.
Enhancing Citizen Services Catalyzes Market Expansion
Generative AI's role in enhancing citizen services through virtual assistants and chatbots revolutionizes public sector engagement. By providing round-the-clock support and streamlining access to government services and applications, AI-powered solutions significantly enhance citizen satisfaction and accessibility.
The City of Los Angeles demonstrates this impact with its deployment of an AI chatbot, offering residents a more intuitive and efficient means of accessing information. This improvement in citizen services not only strengthens public trust but also encourages broader adoption of digital platforms across government entities. The resultant demand for sophisticated AI tools that can deliver personalized and responsive citizen services propels the market forward, underlining the transformative potential of Generative AI in redefining public sector interactions.
Predictive Analytics and Decision Support Elevate Market Dynamics
Generative AI's capacity for predictive analytics and decision support stands as a cornerstone for its adoption in the government sector. By leveraging AI to sift through large datasets for pattern recognition, forecasting, and insight generation, agencies can enhance data-driven policy making, resource distribution, and risk management.
The U.S. Environmental Protection Agency's use of AI to anticipate air pollution levels showcases the profound implications for environmental policy and public health. This predictive prowess enables a proactive rather than reactive approach to governance, optimizing outcomes and resource efficiency. The interplay between Generative AI's analytical capabilities and strategic government decision-making processes signifies a leap towards more informed, efficient, and effective governance, fostering market growth.
Natural Language Processing for Document Analysis Spurs Market Innovation
Generative AI, through Natural Language Processing (NLP), transforms the analysis of government documents, legal texts, and citizen communications. The ability to parse, understand, and extract valuable insights from extensive document sets allows for a deeper and more nuanced understanding of public needs and regulatory frameworks.
The exploration of AI-based NLP tools by the U.S. Department of Justice for legal document analysis epitomizes this trend, paving the way for more informed decision-making and policy development. This application of Generative AI not only enhances operational efficiency but also contributes to the formulation of more responsive and effective government strategies. The integration of NLP in government operations catalyzes market innovation, highlighting Generative AI's role in advancing public administration and governance.
Restraining Factors
Data Privacy and Security Concerns Restrain Market Growth
The integration of AI into government operations brings to the forefront critical issues surrounding data privacy and security. The sensitivity and confidentiality of citizen data necessitate stringent data governance frameworks and robust security protocols.
The proposed EU regulations in 2021 underscore the global push for strict compliance measures in AI applications, emphasizing the need to safeguard personal data in high-risk areas. This regulatory landscape, while essential for protecting rights, can act as a significant barrier to the adoption and scalability of generative AI technologies in government services, as agencies must navigate complex compliance requirements, potentially slowing innovation and implementation.
Lack of Trust and Transparency Limits Market Expansion
The opaqueness in AI decision-making processes fosters a lack of trust and transparency, crucially impeding the market's growth. Citizens and policymakers' concerns over how AI systems reach conclusions, coupled with fears of inherent biases and accountability, present substantial hurdles.
The 2019 Dutch court ruling against an AI system for welfare fraud detection due to transparency and discrimination issues exemplifies the challenges AI faces in gaining widespread acceptance in government. Overcoming these barriers requires not just technological advancements but also significant efforts in demystifying AI processes, ensuring fairness, and building robust frameworks for accountability, without which the potential of generative AI in government remains constrained.
Application Analysis
In Generative AI in Government Market, Data Generation and Augmentation emerges as the dominant sub-segment, driving significant market growth. This technology's ability to create and enhance data sets is crucial for governments grappling with the challenges of big data, from predictive analytics in policy making to enhancing public service delivery. It allows for the simulation of scenarios, improving the robustness of decision-making processes.
This sub-segment's pivotal role is underscored by the growing need for high-quality, diverse datasets to train AI models, especially in areas such as healthcare, urban planning, and environmental management. The utilization of generative AI for data generation and augmentation addresses these needs, providing government agencies with the tools to simulate and predict outcomes, thereby making more informed decisions.
Other applications, including Policy Analysis, Cybersecurity, Natural Language Processing, and miscellaneous uses, also play integral roles in this market segment. Policy Analysis benefits from AI's ability to sift through vast amounts of data for insights, aiding in the formulation of effective policies. Cybersecurity utilizes AI for threat detection and response, an area of increasing concern for government entities.
Natural Language Processing enhances communication between governments and citizens, making information more accessible. While these applications are crucial, Data Generation and Augmentation stands out for its foundational impact on data-driven decision-making and operational efficiency across government functions.
Deployment Mode Analysis
The Deployment Mode segment of the Generative AI in Government Market is predominantly led by On-Premises solutions, accounting for 63% of the market. This preference is rooted in the heightened concerns over data security and sovereignty, especially when dealing with sensitive and confidential government data.
On-premises deployment allows government agencies to maintain direct control over their AI infrastructure, ensuring compliance with strict regulatory and security standards. It also offers customization and scalability suited to the specific needs of government operations.
Conversely, Cloud-Based deployment is gaining traction, driven by its cost-effectiveness, flexibility, and the ability to leverage advanced AI capabilities without significant upfront investment in infrastructure. This mode is particularly appealing for smaller agencies or projects with limited budgets.
Despite its benefits, the cloud-based approach's growth is tempered by ongoing concerns over data security and governance, illustrating the delicate balance governments must navigate between innovation and information assurance. Both deployment modes contribute to the market's dynamics, with on-premises solutions currently holding the lead but cloud-based alternatives poised for growth as security technologies evolve.
End User Analysis
Among the End User segment in the Generative AI in Government Market, Government Agencies are the dominant sub-segment. This dominance is attributed to the widespread application of AI technologies in enhancing public services, streamlining administrative processes, and improving policy outcomes.
Government agencies across various sectors, including healthcare, transportation, and security, are increasingly adopting AI solutions to leverage data for operational efficiency, citizen engagement, and decision support systems. This trend reflects a broader push towards digital transformation within the public sector, aiming to modernize government operations and deliver services more effectively to citizens.
Other end users, including Government Officials, Public Service Providers, Customer Service, and various other stakeholders, also benefit from generative AI's capabilities. These technologies assist in personalizing the interaction between governments and citizens, optimizing resource allocation, and improving the responsiveness of public services.
While Government Agencies stand out for their extensive use and investment in AI technologies, the contributions of other end users highlight the ecosystem's collaborative nature. Together, they underscore a comprehensive approach to integrating AI within government operations, enhancing service delivery, and fostering a more connected and data-driven public sector.
Key Market Segments
By Application
- Data Generation and Augmentation
- Policy Analysis
- Cybersecurity
- Natural Language Processing
- Other Applications
By Deployment Mode
- On-Premises
- Cloud-Based
By End User
- Government Agencies
- Government Officials
- Public Service Providers
- Government Customer Service
- Other End Users
Growth Opportunities
AI-Powered Public Policy Analysis and Simulation Offers Growth Opportunity
Generative AI models present a significant growth opportunity in the government market by transforming public policy analysis and simulation. By leveraging these models to digest extensive datasets and simulate complex scenarios, governments can make more informed, data-driven policy decisions. This capability addresses a critical pain point for policymakers: the challenge of understanding vast amounts of data and predicting the outcomes of their policies.
For example, the U.S. Department of Energy's use of AI to simulate the effects of energy policies demonstrates how generative AI can lead to smarter, more effective policymaking, particularly in crucial areas like healthcare, education, and urban planning. This move towards evidence-based policymaking marks a significant shift in how governments operate, making generative AI an invaluable tool in crafting policies that better serve the public.
AI-Assisted Government Procurement and Contract Management Offers Growth Opportunity
AI-assisted government procurement and contract management represent a key growth opportunity within the generative AI in government market. By applying AI to analyze historical procurement data, identify patterns, and make recommendations, government agencies can achieve cost savings, enhance transparency, and optimize resource allocation. This technology directly addresses common issues in government procurement processes, such as complexity, inefficiency, and the risk of error, by streamlining and improving decision-making.
The pilot by the U.S. General Services Administration (GSA) of an AI-powered platform for procurement tasks underscores the potential of AI to revolutionize government procurement and contract management. This development not only improves operational efficiency but also paves the way for a more accountable and transparent procurement system, showcasing the transformative impact of generative AI in government operations.
Trending Factors
AI Explainability and Interpretability Are Trending Factors
The demand for AI systems that offer clear explanations for their decisions is shaping up as a major trend in the Generative AI in Government Market. This trend is driven by the need for transparency, accountability, and trust in AI applications within sensitive government operations. The complexity of "black box" AI models, which obscure the decision-making process, presents a significant challenge in government contexts where decisions can have far-reaching implications.
Initiatives like the U.S. Department of Defense's investment in AI explainability research highlight the sector's commitment to overcoming these barriers. By developing techniques that make AI decisions more interpretable, governments are working to ensure that AI-driven processes are transparent and accountable, fostering greater acceptance and trust in these technologies.
AI Workforce Development and Upskilling Are Trending Factors
The push for AI workforce development and upskilling is becoming a critical trend in the Generative AI in Government Market. As governments increasingly integrate AI into their operations, the demand for professionals skilled in data science, machine learning, and AI ethics grows. The gap between the current state of workforce capabilities and the skills needed to leverage AI effectively is a significant challenge for many agencies.
Efforts like the U.S. General Services Administration's AI Center of Excellence, which aims to equip federal agencies with the necessary training and resources for AI adoption, underscore the importance of this trend. These initiatives are not just about filling current skill gaps but are also forward-looking, preparing the government workforce for the future demands of AI-driven governance, thus ensuring that government agencies can continue to innovate and improve public services with AI technologies.
Regional Analysis
North America Dominates with 41.2% Market Share
North America's commanding 41.2% share in the Generative AI in Government Market is driven by a confluence of advanced technological infrastructure, robust government investments in AI research and development, and a strong presence of leading AI companies. The region benefits from a highly skilled workforce and a culture of innovation, fostering rapid adoption and development of AI technologies. Initiatives by the U.S. government, such as federal funding for AI projects and the establishment of AI-specific agencies, underscore the strategic importance placed on AI in public sector modernization and efficiency.
The regional dynamics of North America are characterized by proactive government policies promoting AI adoption, collaboration between the public sector and tech giants, and a significant emphasis on ethical AI development and workforce upskilling. This environment not only facilitates the growth of AI in government services but also sets a benchmark for responsible and effective AI use. High levels of digital literacy among the population and the demand for improved public services through technology further drive the market.
Other Regions Market Share:
- Europe: Europe holds a significant position in the market, with a focus on ethical AI use and strong data protection laws guiding AI deployment in public services. The region's market share reflects a balanced approach to innovation and regulation.
- Asia Pacific: This region is experiencing rapid growth in AI adoption, driven by countries like China and Singapore. Investments in smart city projects and digital government initiatives are key drivers, with the market share expanding as a result.
- Middle East & Africa: Though starting from a smaller base, the Middle East & Africa is witnessing notable growth in AI implementation in government services, particularly in areas like smart cities and digital transformation projects. The market share is gradually increasing, supported by strategic investments in technology infrastructure.
- Latin America: Latin America's market share is growing, fueled by digital transformation efforts in the public sector and increasing awareness of AI's potential to enhance governance and public services. Investments in education and collaborations with tech companies are key to this growth.
Key Regions and Countries
- North America
- The US
- Canada
- Mexico
- Western Europe
- Germany
- France
- The UK
- Spain
- Italy
- Portugal
- Ireland
- Austria
- Switzerland
- Benelux
- Nordic
- Rest of Western Europe
- Eastern Europe
- Russia
- Poland
- The Czech Republic
- Greece
- Rest of Eastern Europe
- APAC
- China
- Japan
- South Korea
- India
- Australia & New Zealand
- Indonesia
- Malaysia
- Philippines
- Singapore
- Thailand
- Vietnam
- Rest of APAC
- Latin America
- Brazil
- Colombia
- Chile
- Argentina
- Costa Rica
- Rest of Latin America
- Middle East & Africa
- Algeria
- Egypt
- Israel
- Kuwait
- Nigeria
- Saudi Arabia
- South Africa
- Turkey
- United Arab Emirates
- Rest of MEA
Key Players Analysis
Generative artificial intelligence (AI) tools are increasingly pivotal in enhancing customer experience and optimizing operations within public sector organizations. Among the key players, OpenAI, IBM, Microsoft, Google, Amazon Web Services (AWS), Palantir Technologies, Booz Allen Hamilton, Accenture, NVIDIA, Intel, Baidu, and Alphabet Inc. dominate the landscape.
These companies offer language models that empower government leaders to streamline processes and decipher vast amounts of documents efficiently. Their strategic positioning lies in providing comprehensive solutions tailored to the unique needs of government procurement departments. By incorporating powerful tools like document scanning capabilities, they enable policy makers to navigate through policy documents with ease.
Moreover, their influence extends to fostering happier citizens by facilitating smoother interactions and improving the accessibility of government services. Through the integration of generative AI, they unlock a broad range of opportunities for governments to innovate and enhance service delivery.
The collaboration between these industry giants and entities like the Government Executive Media Group further amplifies their impact, facilitating knowledge sharing and thought leadership within the sector. Overall, their collective efforts signify a positive trajectory towards leveraging AI to drive efficiency, transparency, and citizen satisfaction in the public sector.
Market Key Players
- Open AI
- IBM
- Microsoft
- Amazon Web Services (AWS)
- Palantir Technologies
- Booz Allen Hamilton
- Accenture
- NVIDIA
- Intel
- Baidu
- Alphabet Inc.
Recent Developments
- During the 9th edition of Google for India, the company is emphasizing making authoritative information easily accessible. They are introducing AI-powered overviews for over 100 government schemes in English and Hindi, using generative AI to transform the organization of information in its Search Generative Experience, which was launched on August 31.
- India has introduced ASK GITA, a generative AI model based on the GPT-4 model, showcased at the G20 Summit. ASK GITA stands for Guidance, Inspiration, Transformation, and Action. It aims to answer life-related questions based on the Shrimad Bhagwad Gita. The government plans to make its generative AI tools, including BharatGPT, a digital public good, supporting multiple languages and modes of interaction.
- The Advanced Research Projects Agency for Health (ARPA-H) is incorporating generative artificial intelligence (AI) into its internal operations to enhance efficiency and decision-making. The agency, launched in March 2022, is utilizing generative AI to process large volumes of data, including personnel information and contracting data, to improve recruitment, retention, and program positioning.
- ClearGov has introduced a ChatGPT tool for municipal budgets, utilizing artificial intelligence to streamline the budgeting process by creating budget books and accompanying text narratives. The tool aims to enhance efficiency during the hectic budget creation, potentially saving significant time for government entities. Clients in beta testing reported varying levels of time savings, with up to 25% or hundreds of hours saved during budget creation.
- Zencity's ChatGPT tool leverages artificial intelligence to assist public information officers (PIOs) and city officials in creating drafts for press releases and social media posts, aiming to streamline the initial writing process and save time.
Report Scope
Report Features Description Market Value (2022) USD 12.7 Mn Forecast Revenue (2032) USD 502.1 Mn CAGR (2023-2032) 45.8% Base Year for Estimation 2022 Historic Period 2016-2022 Forecast Period 2023-2032 Report Coverage Revenue Forecast, Market Dynamics, COVID-19 Impact, Competitive Landscape, Recent Developments Segments Covered Based on Application (Data Generation and Augmentation, Policy Analysis, Cybersecurity, Natural Language Processing, Other Applications)
Based on the Deployment Mode (On-Premises, Cloud-Based)
Based on End User (Government Agencies, Government Officials, Public Service Providers, Government Customer Service, Other End Users)Regional Analysis North America – The US, Canada, & Mexico; Western Europe – Germany, France, The UK, Spain, Italy, Portugal, Ireland, Austria, Switzerland, Benelux, Nordic, & Rest of Western Europe; Eastern Europe – Russia, Poland, The Czech Republic, Greece, & Rest of Eastern Europe; APAC – China, Japan, South Korea, India, Australia & New Zealand, Indonesia, Malaysia, Philippines, Singapore, Thailand, Vietnam, & Rest of APAC; Latin America – Brazil, Colombia, Chile, Argentina, Costa Rica, & Rest of Latin America; Middle East & Africa – Algeria, Egypt, Israel, Kuwait, Nigeria, Saudi Arabia, South Africa, Turkey, United Arab Emirates, & Rest of MEA Competitive Landscape Open AI, IBM Watson, Microsoft, Google Cloud AI, Nvidia, Other Market Players Customization Scope Customization for segments, region/country-level will be provided. Moreover, additional customization can be done based on the requirements. Purchase Options We have three licenses to opt for: Single User License, Multi-User License (Up to 5 Users), Corporate Use License (Unlimited User and Printable PDF) -
-
- Open AI
- IBM Watson
- Microsoft
- Google Cloud AI
- Nvidia
- Other Market Players
Our Clients


View Our Licence Options
