
Generative AI in Utilities Market By Type (Electricity Generation, Transmission & Distribution, and Customer Engagement & Energy Efficiency), By Application (Create Personalized Customer Experiences, Improve Asset Management, and Others), By Deployment(On-Premises, Cloud-Based), By Region and Companies - Industry Segment Outlook, Market Assessment, Competition Scenario, Trends, and Forecast 2023-2032
-
37817
-
July 2023
-
136
-


-
This report was compiled by Vishwa Gaul Vishwa is an experienced market research and consulting professional with over 8 years of expertise in the ICT industry, contributing to over 700 reports across telecommunications, software, hardware, and digital solutions. Correspondence Team Lead- ICT Linkedin | Detailed Market research Methodology Our methodology involves a mix of primary research, including interviews with leading mental health experts, and secondary research from reputable medical journals and databases. View Detailed Methodology Page
-
Quick Navigation
Report Overview
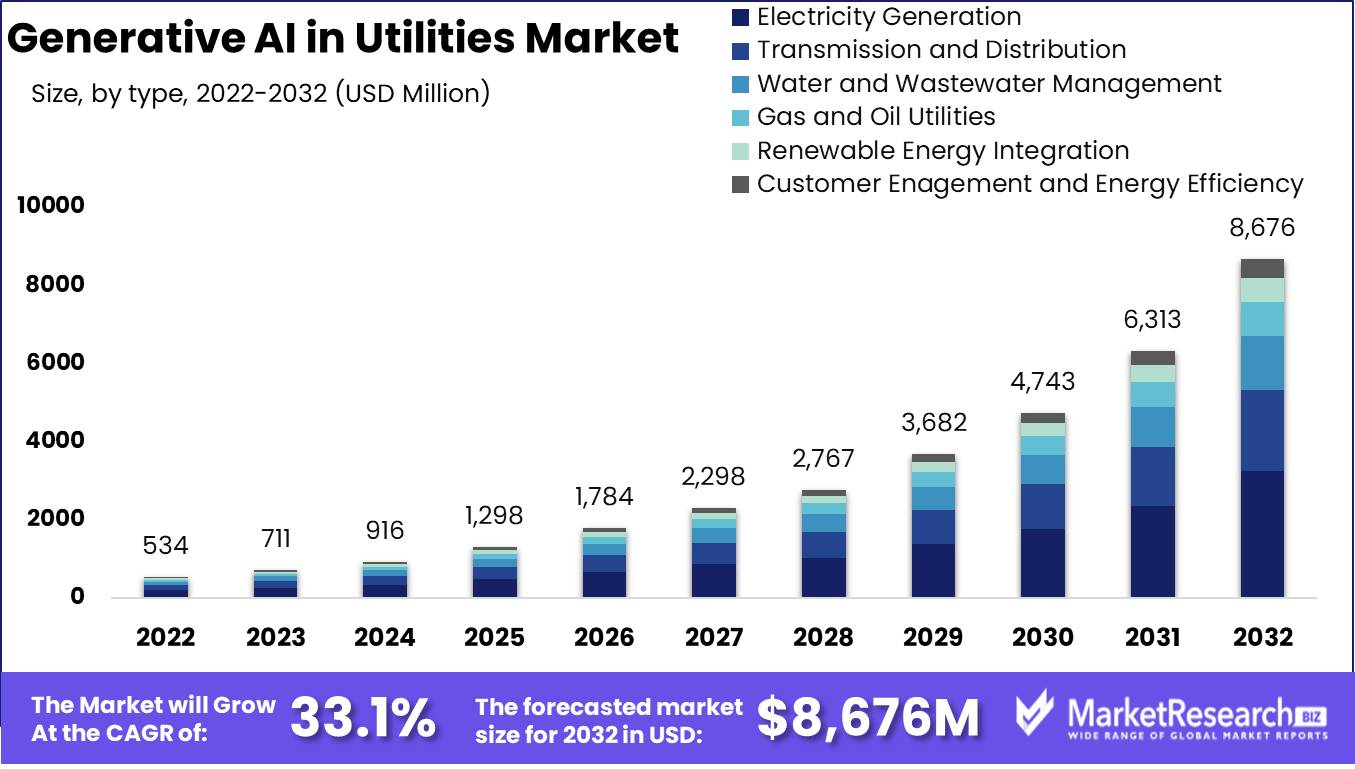
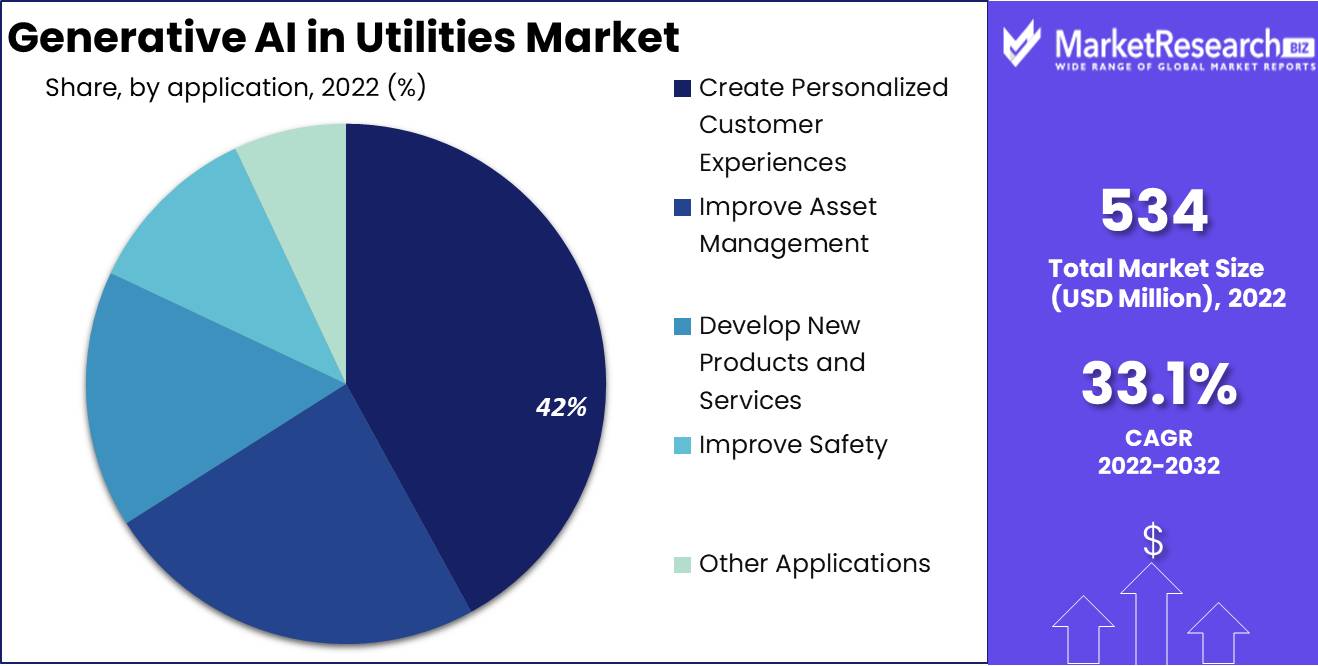
Generative AI in Utilities Market size is expected to be worth around USD 8676 Mn by 2032 from USD 534 Mn in 2022, growing at a CAGR of 33.1% during the forecast period from 2023 to 2032.
Generative AI can be utilized in utility services in multiple ways, including grid optimization, forecasting energy demand forecasting, asset management, renewable energy integration, customer engagement, predictive maintenance, and energy trading. Generative AI provides utilities with a powerful way to optimize power distribution and generation, anticipate equipment failures and integrate renewable sources seamlessly, and customize customer experiences while making data-driven decisions to enhance operational efficiencies.
Generative AI helps utilities meet sustainability objectives by encouraging efficient energy usage, lowering carbon emissions, and encouraging the use of renewable sources of power. As technology develops and utilities leverage Generative AI's transformative potential, market conditions should experience significant increases in reliability, cost-effectiveness, and sustainability - benefitting both utilities and their customers alike.
Driving factors
Asset Management and Predictive Maintenance, Grid Optimization, and Renewable Integration are Drives the Generative AI in the Utilities Market.
Utility companies manage vast quantities of data gathered from various sources - sensors, smart meters grid infrastructure, and customer interactions, among others - using Generative AI can efficiently process this vast trove of information, providing utilities with insight for decision-making and optimization purposes. Utilities must coordinate and optimize their business operations, such as transmission, power generation, distribution, and maintenance.
Generative AI provides utilities with tools that streamline repetitive processes by automating repetitive tasks, optimizing resource allocation, increase operational efficiencies to decrease costs and boost performance resulting in lower costs and improved performance. Generative AI is invaluable in optimizing grids, helping utilities balance demand and supply, reducing losses, and enhancing stability. Furthermore, with increasing renewable energy usage, Generative AI can forecast renewable generation, manage to intermit entity issues, and maximize its effectiveness within a grid environment.
Utility companies rely heavily on infrastructure assets such as substations, power plants, and transmission lines for their operation. Generative AI allows utilities to utilize data gathered from sensors, historical records, and external factors to forecast equipment failures, optimize maintenance schedules, and extend asset lifespan - leading to improved asset performance, reduced downtime, and lower maintenance costs.
Generational AI can assist utilities in improving customer experiences by providing customized suggestions, real-time usage data, and tailored pricing plans. Generative AI allows utilities to better connect with their customers more efficiently while advocating for energy conservation while meeting individual customer needs and preferences, leading to increased satisfaction and loyalty from their customer base.
Restraining Factors
Data Quality and Accessibility, Regulatory and Security Concerns, and Complexity and Integration Challenges are Restraining the Growth of the Market.
Generative AI relies heavily on high-quality, accessible data to train and create accurate models and data sets. Utility sector data tends to be scattered and insufficient or of variable quality, making it challenging to implement successful Generative AI strategies. Data collection, integration, and management processes must be robust in order to guarantee access to high-quality information.
Utility companies face stringent regulations and must navigate them in terms of security, privacy, and compliance issues. Regulations surrounding data sharing could impede Generative AI applications; utilities must negotiate these regulatory hurdles while safeguarding sensitive operational and customer information. Implementing Generative AI solutions in the utility sector can be difficult due to interdependent operations and integration requirements with existing systems.
Utilities often have an outdated infrastructure with multiple systems needing integration with Generative AI models causing interoperability issues, data compatibility, and timelines. Deploying, developing, and maintaining Generative AI solutions requires an experienced workforce equipped with knowledge of AI, data analytics, utility operations, and utility operations. Unfortunately, there is currently a dearth of professionals with these necessary skills within utilities - this lack could hinder the effective implementation and use of Generative AI in utilities.
Covid-19 Impact on Generative AI in Utilities Market
The pandemic has forced industries, including utilities, to speed up their digital transformation efforts, prompting many industries - particularly utilities - to experiment with artificial intelligence (AI). This may have created interest in AI technologies like generative AI for improving operations efficiency, anticipating demand, and more efficiently managing resources.
Lockdowns and restrictions during the COVID-19 epidemic required utility companies to use remote work methods. As a result, artificial intelligence methods might have been investigated for monitoring and maintaining infrastructure remotely, with predictive maintenance, simulations, and solutions created using Generative AI being greatly beneficial in optimizing grids.
The utility market was plagued with supply chain disruptions caused by restrictions and lockdowns. Yet, artificial intelligence (AI) would have proven invaluable in improving supply chains in such conditions by developing innovative supply chain models and finding alternate providers or sources for their supply needs. COVID-19 could have had an enormously positive effect on utilities' economies. By harnessing generative AI to automate processes and anticipate equipment failures and optimize resource allocation, utilities could have realized substantial cost reduction.
By Type Analysis
The Electricity Generation Segment Accounted for the Largest Revenue Share in Generative AI in the Utilities Market in 2022.
The market is segmented based on type: electricity generation, transmission and distribution, water and wastewater management, gas and oil utilities, renewable energy integration, customer engagement, and energy efficiency. Among these types, electricity generation is expected to be the most lucrative in the global generative AI in utilities market, with the largest revenue share of 37.4%. Generative AI use in utility markets, particularly electricity generation, aims to enhance and innovate current methods of electricity production.
Generative AI can be employed in various forms of power production. Fossil fuel-based power generation uses this strategy for the preplanned maintenance of power plants and optimizing fuel consumption. Generative AI is not a method for electricity generation; instead, it refers to techniques and algorithms designed to enhance existing methods by making them more reliable, efficient, or possibly sustainable.
The Transmission and Distribution Segment is Fastest Growing Type Segment in Generative AI in the Utilities Market.
The transmission and distribution segment is projected as the fastest growing type segment in generative AI in utilities market from 2023 to 2032. Generative AI can potentially disrupt the utility market, particularly distribution and transmission services. Predictive maintenance allows utilities to identify possible issues on power lines or equipment that might cause interruptions while eliminating potential interruptions altogether.
Generative AI improves electricity distribution by analyzing climate conditions, demand patterns, and weather. Real-time adjustments allow Generative AI to ensure optimal balance between supply and demand as well as grid efficiency. AI can improve grid resilience by rapidly detecting abnormalities and faults that require prompt responses, mitigating customer impact as quickly as possible.
By Application Analysis
To Create Personalized Customer Experiences Holds the Significant Share in Application Segment in Generative AI in Utilities Market.
Based on application, the market is divided into creating personalized customer experiences, improving asset management, developing new products and services, improving safety and other applications. Among these, the create personalized customer experiences segment is dominant in the application segment in generative AI in utilities market, with a market share of 42%. Generative AI allows utilities to customize customer experiences within their markets.
By drawing upon information provided by customers as well as advanced analytics, utilities will be able to offer customized energy consumption data, improve customer service with virtual assistants and forecast personalized energy alerts and forecasts - not only creating enhanced customer experiences and satisfaction levels but also contributing towards a more efficient and sustainable energy system.
Improve Asset Management is Identified as Fastest Growing Application Segment in Projected Period.
Improve asset management is also an important application segment in generative AI in utilities market, and it is expected to grow faster in the application segment. Generative AI offers utilities a powerful opportunity to improve asset management in their market. By applying advanced machine learning and data analytics techniques, utilities will be able to optimize their assets' performance better while making more informed investments and improving maintenance practices. Generative AI management of assets may lead to increased reliability and a longer lifespan of assets and optimize capital investments with enhanced operational efficiencies within utility sectors.
By Deployment Analysis
The On-Premises Segment Accounted for the Largest Revenue Share in Generative AI in the Utilities Market in 2022.
Based on deployment, the market is segmented into on-premises, cloud-based, hybrid, edge computing, collaborative and customized in-house. Among these types, the on-premises is expected to be the most lucrative in the global generative AI in utilities market, with the largest revenue share of 36.5%. On-premises deployment of AI solutions offers utilities numerous benefits. It ensures data security and privacy, allows access to real-time data in real-time, allows customization and control over AI models, reduces network dependency from outside sources, and decreases dependence on connectivity from external providers. By choosing to deploy on-premises AI capabilities, they can take full control over their infrastructure and data, leading to increased efficiency in operations and decision-making across their sector.
The Cloud-Based Segment is Fastest Growing Deployment Segment in Generative AI in the Utilities Market.
The cloud-based segment is projected as the fastest-growing deployment segment in generative AI in utilities market from 2023 to 2032. Cloud-based AI deployment offers utilities major advantages on the utility market. It enables scale, collaboration, knowledge sharing, recovery of lost data storage capacities, and integration with other cloud tools and services. By opting for this deployment model, utilities can take full advantage of AI to streamline business processes while offering innovative and productive services to their clients in an economical way.
Key Market Segments
Based on Type
- Electricity Generation
- Transmission & Distribution
- Water & Wastewater Management
- Gas & Oil Utilities
- Renewable Energy Integration
- Customer Engagement & Energy Efficiency
Based on Application
- Create Personalized Customer Experiences
- Improve Asset Management
- Develop New Products & Services
- Improve Safety
- Other Applications
Based on Deployment
- On-Premises
- Cloud-Based
- Hybrid
- Edge Computing
- Collaborative
- Customized In-House
Growth Opportunity
Predictive Maintenance and Energy Optimization Creates the Opportunity in the Market.
Generative AI can assist utilities in enhancing the efficiency of energy generation and distribution. By studying past data such as weather patterns, customer demands, and customer behavior patterns, Generative AI algorithms can produce precise forecasts that optimize schedules for energy production resulting in reduced energy consumption, enhanced grid stability, cost savings, and savings through reduced consumption costs.
Utilities depend on infrastructure such as transmission lines, power plants, and distribution networks for their services. Generative AI can analyze sensor data in real-time to detect patterns and irregularities to enable predictive maintenance - identifying malfunctioning equipment ahead of time can reduce downtime while increasing system reliability overall.
Generative AI algorithms can analyze energy usage patterns and customer behavior to enhance load management. By anticipating peak demand times, utilities are able to take proactive measures that reduce load and avoid interruptions. Generative AI may also facilitate demand response programs that encourage customers to alter their energy use during peak times through incentives or dynamic pricing programs. Generative AI is an effective way for utilities to enhance grid operation and distribution.
By studying data collected by sensors, smart meters, and other sources - including power losses, voltage fluctuations, or areas with high demand - intelligent AI algorithms can detect inefficiencies within the grid, such as power losses, voltage fluctuations, or areas with increased energy demands. Utility companies can then take steps to strengthen infrastructure, increase reliability, and boost energy supplies through corrective measures taken against this data-mining tool.
Latest Trends
Energy Usage Forecasting, Asset Optimization, and Anomaly Detection are the Latest Trends in the Market
An important development has been using artificial intelligence (AI), or Generative AI, to predict maintenance. AI can predict when equipment will break and allows companies in the utility industry to conduct maintenance in advance, which reduces downtime costs significantly. Generative models may also be employed to test various failure scenarios and help prevent failure altogether. Models that generate generative data can help accurately forecast energy usage - an issue in the utility market. They can create different scenarios of usage depending on varying elements such as weather conditions, time of day, and past consumption patterns.
Generative AI models can help create scenarios to determine the most cost-effective and efficient use of resources such as electric grids, power plants, and human capital. Utility utilities often experience anomalies that indicate theft of energy equipment malfunction, energy theft, and network weakness. Generative models make it easy to recognize anomalies as they arise by simulating normal behavior allowing us to recognize anomalies more quickly when they appear.
Regional Analysis
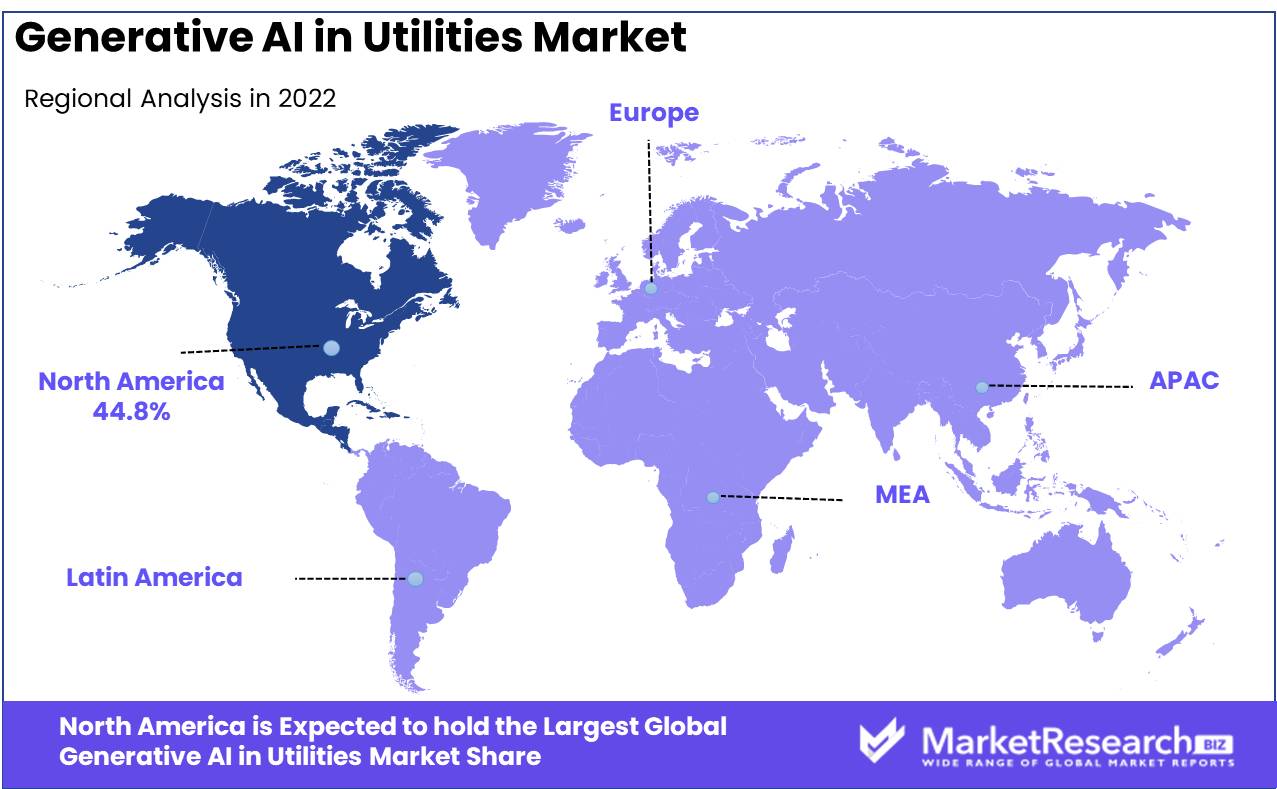
North America Accounted for the Largest Revenue Share in Generative AI in Utilities Market in 2022.
North America is estimated to be the most lucrative market in the global generative AI in utilities market, with the largest market share of 44.8%. The United States and Canada are implementing artificial intelligence and generative models into utility sectors, particularly within grid modernization programs, renewable energy integration, and improving operational efficiencies. Forecasting and predictive maintenance have become an integral component of grid management, with both established and new firms offering AI solutions specifically targeted to utilities promoting innovation.
Asia-Pacific is Expected as Fastest Growing Region in Projected Period in Generative AI in Utilities Market.
Asia-Pacific is expected to be as fastest growing region in the forecast period in the generative AI in utilities market. China is investing heavily in Artificial Intelligence technology. China uses AI for utilities for forecasting energy consumption, predictive maintenance, and optimizing grid operations using this AI tool. India has made strides forward in the utility sector with efforts to modernize energy grids and focus on renewable energies. Generative AI may prove helpful in meeting India's ever-increasing energy demands. Japan and South Korea have long been recognized for their pioneering approach to high-tech adoption, using AI solutions for managing demand response systems and smart grid technologies.
Key Regions and Countries
North America
- US
- Canada
- Mexico
Western Europe
- Germany
- France
- The UK
- Spain
- Italy
- Portugal
- Ireland
- Austria
- Switzerland
- Benelux
- Nordic
- Rest of Western Europe
Eastern Europe
- Russia
- Poland
- The Czech Republic
- Greece
- Rest of Eastern Europe
APAC
- China
- Japan
- South Korea
- India
- Australia & New Zealand
- Indonesia
- Malaysia
- Philippines
- Singapore
- Thailand
- Vietnam
- Rest of APAC
Latin America
- Brazil
- Colombia
- Chile
- Argentina
- Costa Rica
- Rest of Latin America
Middle East & Africa
- Algeria
- Egypt
- Israel
- Kuwait
- Nigeria
- Saudi Arabia
- South Africa
- Turkey
- United Arab Emirates
- Rest of MEA
IBM, Siemens, GE, Schneider Electric, and Oracle are among the key AI market players that have made an impressionable statement about their presence in the utilities' AI market and are likely to play an active role there. With its Watson platform, IBM has provided AI solutions for grid optimization and energy management.
Siemens has developed solutions for smart grids using artificial intelligence (AI). Meanwhile, General Electric invested in the Predix platform, which offers AI-powered asset performance management and predictive maintenance products.
Schneider Electric and Oracle specialize in AI solutions for automation and energy management, with Schneider providing AI-powered energy efficiency tools while Oracle offers customer engagement tools using AI.
Top Key Players in Generative AI in Utilities Market
- Siemens AG
- General Electric Company
- ABB Ltd.
- Schneider Electric SE
- IBM Corporation
- Microsoft Corporation
- Other Key Players
Recent Development
- In 2021, Google Cloud and Siemens Energy announced a partnership 2021 to use AI-driven solutions to control and monitor the energy grid, offering environmentally sustainable yet cost-effective energy supplies.
- In 2021, ABB recently unveiled its ABB Ability Genix Asset Performance Management (APM) Suite, which utilizes artificial intelligence to optimize efficiency in utility industry assets while improving operational efficiencies.
- In 2021, GE continued its focus on AI and utilities, with an eye toward modernizing grids, predictive maintenance, and incorporating renewable energy sources.
Report Scope:
Report Features Description Market Value (2022) USD 534 Mn Forecast Revenue (2032) USD 8676 Mn CAGR (2023-2032) 33.1% Base Year for Estimation 2022 Historic Period 2016-2022 Forecast Period 2023-2032 Report Coverage Revenue Forecast, Market Dynamics, COVID-19 Impact, Competitive Landscape, Recent Developments Segments Covered Based on Type (Electricity Generation, Transmission & Distribution, Water & Wastewater Management, Gas & Oil Utilities, Renewable Energy Integration, Customer Engagement & Energy Efficiency)
Based on Application (Create Personalized Customer Experiences, Improve Asset Management, Develop New Products & Services, Improve Safety, Other Applications)
Based on Deployment (On-Premises, Cloud-Based, Hybrid, Edge Computing, Collaborative, Customized In-House)Regional Analysis North America – The US, Canada, & Mexico; Western Europe – Germany, France, The UK, Spain, Italy, Portugal, Ireland, Austria, Switzerland, Benelux, Nordic, & Rest of Western Europe; Eastern Europe – Russia, Poland, The Czech Republic, Greece, & Rest of Eastern Europe; APAC – China, Japan, South Korea, India, Australia & New Zealand, Indonesia, Malaysia, Philippines, Singapore, Thailand, Vietnam, & Rest of APAC; Latin America – Brazil, Colombia, Chile, Argentina, Costa Rica, & Rest of Latin America; Middle East & Africa – Algeria, Egypt, Israel, Kuwait, Nigeria, Saudi Arabia, South Africa, Turkey, United Arab Emirates, & Rest of MEA Competitive Landscape Siemens AG, General Electric Company, ABB Ltd., Schneider Electric SE, IBM Corporation, Microsoft Corporation, Other Key Players Customization Scope Customization for segments, region/country-level will be provided. Moreover, additional customization can be done based on the requirements. Purchase Options We have three licenses to opt for: Single User License, Multi-User License (Up to 5 Users), Corporate Use License (Unlimited User and Printable PDF) -
- 1. Executive Summary
- 1.1. Definition
- 1.2. Taxonomy
- 1.3. Research Scope
- 1.4. Key Analysis
- 1.5. Key Findings by Major Segments
- 1.6. Top strategies by Major Players
- 2. Global Generative AI in Utilities Market Overview
- 2.1. Generative AI in Utilities Market Dynamics
- 2.1.1. Drivers
- 2.1.2. Opportunities
- 2.1.3. Restraints
- 2.1.4. Challenges
- 2.2. Macro-economic Factors
- 2.3. Regulatory Framework
- 2.4. Market Investment Feasibility Index
- 2.5. PEST Analysis
- 2.6. PORTER’S Five Force Analysis
- 2.7. Drivers & Restraints Impact Analysis
- 2.8. Industry Chain Analysis
- 2.9. Cost Structure Analysis
- 2.10. Marketing Strategy
- 2.11. Russia-Ukraine War Impact Analysis
- 2.12. Opportunity Map Analysis
- 2.13. Market Competition Scenario Analysis
- 2.14. Product Life Cycle Analysis
- 2.15. Opportunity Orbits
- 2.16. Manufacturer Intensity Map
- 2.17. Major Companies sales by Value & Volume
- 2.1. Generative AI in Utilities Market Dynamics
- 3. Global Generative AI in Utilities Market Analysis, Opportunity and Forecast, 2016-2032
- 3.1. Global Generative AI in Utilities Market Analysis, 2016-2021
- 3.2. Global Generative AI in Utilities Market Opportunity and Forecast, 2023-2032
- 3.3. Global Generative AI in Utilities Market Analysis, Opportunity and Forecast, By Based On Type, 2016-2032
- 3.3.1. Global Generative AI in Utilities Market Analysis by Based On Type: Introduction
- 3.3.2. Market Size Absolute $ Opportunity Analysis and Forecast, By Based On Type, 2016-2032
- 3.3.3. Electricity Generation
- 3.3.4. Transmission and Distribution
- 3.3.5. Water and Wastewater Management
- 3.3.6. Gas and Oil Utilities
- 3.3.7. Renewable Energy Integration
- 3.3.8. Customer Engagement and Energy Efficiency
- 3.4. Global Generative AI in Utilities Market Analysis, Opportunity and Forecast, By Based On Application, 2016-2032
- 3.4.1. Global Generative AI in Utilities Market Analysis by Based On Application: Introduction
- 3.4.2. Market Size Absolute $ Opportunity Analysis and Forecast, By Based On Application, 2016-2032
- 3.4.3. Create Personalized Customer Experiences
- 3.4.4. Improve Asset Management
- 3.4.5. Develop New Products and Services
- 3.4.6. Improve Safety
- 3.4.7. Other Applications
- 3.5. Global Generative AI in Utilities Market Analysis, Opportunity and Forecast, By Based On Deployment, 2016-2032
- 3.5.1. Global Generative AI in Utilities Market Analysis by Based On Deployment: Introduction
- 3.5.2. Market Size Absolute $ Opportunity Analysis and Forecast, By Based On Deployment, 2016-2032
- 3.5.3. On-Premises
- 3.5.4. Cloud-Based
- 3.5.5. Hybrid
- 3.5.6. Edge Computing
- 3.5.7. Collaborative
- 3.5.8. Customized In-House
- 4. North America Generative AI in Utilities Market Analysis, Opportunity and Forecast, 2016-2032
- 4.1. North America Generative AI in Utilities Market Analysis, 2016-2021
- 4.2. North America Generative AI in Utilities Market Opportunity and Forecast, 2023-2032
- 4.3. North America Generative AI in Utilities Market Analysis, Opportunity and Forecast, By Based On Type, 2016-2032
- 4.3.1. North America Generative AI in Utilities Market Analysis by Based On Type: Introduction
- 4.3.2. Market Size Absolute $ Opportunity Analysis and Forecast, By Based On Type, 2016-2032
- 4.3.3. Electricity Generation
- 4.3.4. Transmission and Distribution
- 4.3.5. Water and Wastewater Management
- 4.3.6. Gas and Oil Utilities
- 4.3.7. Renewable Energy Integration
- 4.3.8. Customer Engagement and Energy Efficiency
- 4.4. North America Generative AI in Utilities Market Analysis, Opportunity and Forecast, By Based On Application, 2016-2032
- 4.4.1. North America Generative AI in Utilities Market Analysis by Based On Application: Introduction
- 4.4.2. Market Size Absolute $ Opportunity Analysis and Forecast, By Based On Application, 2016-2032
- 4.4.3. Create Personalized Customer Experiences
- 4.4.4. Improve Asset Management
- 4.4.5. Develop New Products and Services
- 4.4.6. Improve Safety
- 4.4.7. Other Applications
- 4.5. North America Generative AI in Utilities Market Analysis, Opportunity and Forecast, By Based On Deployment, 2016-2032
- 4.5.1. North America Generative AI in Utilities Market Analysis by Based On Deployment: Introduction
- 4.5.2. Market Size Absolute $ Opportunity Analysis and Forecast, By Based On Deployment, 2016-2032
- 4.5.3. On-Premises
- 4.5.4. Cloud-Based
- 4.5.5. Hybrid
- 4.5.6. Edge Computing
- 4.5.7. Collaborative
- 4.5.8. Customized In-House
- 4.6. North America Generative AI in Utilities Market Analysis, Opportunity and Forecast, By Country , 2016-2032
- 4.6.1. North America Generative AI in Utilities Market Analysis by Country : Introduction
- 4.6.2. Market Size Absolute $ Opportunity Analysis and Forecast, Country , 2016-2032
- 4.6.2.1. The US
- 4.6.2.2. Canada
- 4.6.2.3. Mexico
- 5. Western Europe Generative AI in Utilities Market Analysis, Opportunity and Forecast, 2016-2032
- 5.1. Western Europe Generative AI in Utilities Market Analysis, 2016-2021
- 5.2. Western Europe Generative AI in Utilities Market Opportunity and Forecast, 2023-2032
- 5.3. Western Europe Generative AI in Utilities Market Analysis, Opportunity and Forecast, By Based On Type, 2016-2032
- 5.3.1. Western Europe Generative AI in Utilities Market Analysis by Based On Type: Introduction
- 5.3.2. Market Size Absolute $ Opportunity Analysis and Forecast, By Based On Type, 2016-2032
- 5.3.3. Electricity Generation
- 5.3.4. Transmission and Distribution
- 5.3.5. Water and Wastewater Management
- 5.3.6. Gas and Oil Utilities
- 5.3.7. Renewable Energy Integration
- 5.3.8. Customer Engagement and Energy Efficiency
- 5.4. Western Europe Generative AI in Utilities Market Analysis, Opportunity and Forecast, By Based On Application, 2016-2032
- 5.4.1. Western Europe Generative AI in Utilities Market Analysis by Based On Application: Introduction
- 5.4.2. Market Size Absolute $ Opportunity Analysis and Forecast, By Based On Application, 2016-2032
- 5.4.3. Create Personalized Customer Experiences
- 5.4.4. Improve Asset Management
- 5.4.5. Develop New Products and Services
- 5.4.6. Improve Safety
- 5.4.7. Other Applications
- 5.5. Western Europe Generative AI in Utilities Market Analysis, Opportunity and Forecast, By Based On Deployment, 2016-2032
- 5.5.1. Western Europe Generative AI in Utilities Market Analysis by Based On Deployment: Introduction
- 5.5.2. Market Size Absolute $ Opportunity Analysis and Forecast, By Based On Deployment, 2016-2032
- 5.5.3. On-Premises
- 5.5.4. Cloud-Based
- 5.5.5. Hybrid
- 5.5.6. Edge Computing
- 5.5.7. Collaborative
- 5.5.8. Customized In-House
- 5.6. Western Europe Generative AI in Utilities Market Analysis, Opportunity and Forecast, By Country , 2016-2032
- 5.6.1. Western Europe Generative AI in Utilities Market Analysis by Country : Introduction
- 5.6.2. Market Size Absolute $ Opportunity Analysis and Forecast, Country , 2016-2032
- 5.6.2.1. Germany
- 5.6.2.2. France
- 5.6.2.3. The UK
- 5.6.2.4. Spain
- 5.6.2.5. Italy
- 5.6.2.6. Portugal
- 5.6.2.7. Ireland
- 5.6.2.8. Austria
- 5.6.2.9. Switzerland
- 5.6.2.10. Benelux
- 5.6.2.11. Nordic
- 5.6.2.12. Rest of Western Europe
- 6. Eastern Europe Generative AI in Utilities Market Analysis, Opportunity and Forecast, 2016-2032
- 6.1. Eastern Europe Generative AI in Utilities Market Analysis, 2016-2021
- 6.2. Eastern Europe Generative AI in Utilities Market Opportunity and Forecast, 2023-2032
- 6.3. Eastern Europe Generative AI in Utilities Market Analysis, Opportunity and Forecast, By Based On Type, 2016-2032
- 6.3.1. Eastern Europe Generative AI in Utilities Market Analysis by Based On Type: Introduction
- 6.3.2. Market Size Absolute $ Opportunity Analysis and Forecast, By Based On Type, 2016-2032
- 6.3.3. Electricity Generation
- 6.3.4. Transmission and Distribution
- 6.3.5. Water and Wastewater Management
- 6.3.6. Gas and Oil Utilities
- 6.3.7. Renewable Energy Integration
- 6.3.8. Customer Engagement and Energy Efficiency
- 6.4. Eastern Europe Generative AI in Utilities Market Analysis, Opportunity and Forecast, By Based On Application, 2016-2032
- 6.4.1. Eastern Europe Generative AI in Utilities Market Analysis by Based On Application: Introduction
- 6.4.2. Market Size Absolute $ Opportunity Analysis and Forecast, By Based On Application, 2016-2032
- 6.4.3. Create Personalized Customer Experiences
- 6.4.4. Improve Asset Management
- 6.4.5. Develop New Products and Services
- 6.4.6. Improve Safety
- 6.4.7. Other Applications
- 6.5. Eastern Europe Generative AI in Utilities Market Analysis, Opportunity and Forecast, By Based On Deployment, 2016-2032
- 6.5.1. Eastern Europe Generative AI in Utilities Market Analysis by Based On Deployment: Introduction
- 6.5.2. Market Size Absolute $ Opportunity Analysis and Forecast, By Based On Deployment, 2016-2032
- 6.5.3. On-Premises
- 6.5.4. Cloud-Based
- 6.5.5. Hybrid
- 6.5.6. Edge Computing
- 6.5.7. Collaborative
- 6.5.8. Customized In-House
- 6.6. Eastern Europe Generative AI in Utilities Market Analysis, Opportunity and Forecast, By Country , 2016-2032
- 6.6.1. Eastern Europe Generative AI in Utilities Market Analysis by Country : Introduction
- 6.6.2. Market Size Absolute $ Opportunity Analysis and Forecast, Country , 2016-2032
- 6.6.2.1. Russia
- 6.6.2.2. Poland
- 6.6.2.3. The Czech Republic
- 6.6.2.4. Greece
- 6.6.2.5. Rest of Eastern Europe
- 7. APAC Generative AI in Utilities Market Analysis, Opportunity and Forecast, 2016-2032
- 7.1. APAC Generative AI in Utilities Market Analysis, 2016-2021
- 7.2. APAC Generative AI in Utilities Market Opportunity and Forecast, 2023-2032
- 7.3. APAC Generative AI in Utilities Market Analysis, Opportunity and Forecast, By Based On Type, 2016-2032
- 7.3.1. APAC Generative AI in Utilities Market Analysis by Based On Type: Introduction
- 7.3.2. Market Size Absolute $ Opportunity Analysis and Forecast, By Based On Type, 2016-2032
- 7.3.3. Electricity Generation
- 7.3.4. Transmission and Distribution
- 7.3.5. Water and Wastewater Management
- 7.3.6. Gas and Oil Utilities
- 7.3.7. Renewable Energy Integration
- 7.3.8. Customer Engagement and Energy Efficiency
- 7.4. APAC Generative AI in Utilities Market Analysis, Opportunity and Forecast, By Based On Application, 2016-2032
- 7.4.1. APAC Generative AI in Utilities Market Analysis by Based On Application: Introduction
- 7.4.2. Market Size Absolute $ Opportunity Analysis and Forecast, By Based On Application, 2016-2032
- 7.4.3. Create Personalized Customer Experiences
- 7.4.4. Improve Asset Management
- 7.4.5. Develop New Products and Services
- 7.4.6. Improve Safety
- 7.4.7. Other Applications
- 7.5. APAC Generative AI in Utilities Market Analysis, Opportunity and Forecast, By Based On Deployment, 2016-2032
- 7.5.1. APAC Generative AI in Utilities Market Analysis by Based On Deployment: Introduction
- 7.5.2. Market Size Absolute $ Opportunity Analysis and Forecast, By Based On Deployment, 2016-2032
- 7.5.3. On-Premises
- 7.5.4. Cloud-Based
- 7.5.5. Hybrid
- 7.5.6. Edge Computing
- 7.5.7. Collaborative
- 7.5.8. Customized In-House
- 7.6. APAC Generative AI in Utilities Market Analysis, Opportunity and Forecast, By Country , 2016-2032
- 7.6.1. APAC Generative AI in Utilities Market Analysis by Country : Introduction
- 7.6.2. Market Size Absolute $ Opportunity Analysis and Forecast, Country , 2016-2032
- 7.6.2.1. China
- 7.6.2.2. Japan
- 7.6.2.3. South Korea
- 7.6.2.4. India
- 7.6.2.5. Australia & New Zeland
- 7.6.2.6. Indonesia
- 7.6.2.7. Malaysia
- 7.6.2.8. Philippines
- 7.6.2.9. Singapore
- 7.6.2.10. Thailand
- 7.6.2.11. Vietnam
- 7.6.2.12. Rest of APAC
- 8. Latin America Generative AI in Utilities Market Analysis, Opportunity and Forecast, 2016-2032
- 8.1. Latin America Generative AI in Utilities Market Analysis, 2016-2021
- 8.2. Latin America Generative AI in Utilities Market Opportunity and Forecast, 2023-2032
- 8.3. Latin America Generative AI in Utilities Market Analysis, Opportunity and Forecast, By Based On Type, 2016-2032
- 8.3.1. Latin America Generative AI in Utilities Market Analysis by Based On Type: Introduction
- 8.3.2. Market Size Absolute $ Opportunity Analysis and Forecast, By Based On Type, 2016-2032
- 8.3.3. Electricity Generation
- 8.3.4. Transmission and Distribution
- 8.3.5. Water and Wastewater Management
- 8.3.6. Gas and Oil Utilities
- 8.3.7. Renewable Energy Integration
- 8.3.8. Customer Engagement and Energy Efficiency
- 8.4. Latin America Generative AI in Utilities Market Analysis, Opportunity and Forecast, By Based On Application, 2016-2032
- 8.4.1. Latin America Generative AI in Utilities Market Analysis by Based On Application: Introduction
- 8.4.2. Market Size Absolute $ Opportunity Analysis and Forecast, By Based On Application, 2016-2032
- 8.4.3. Create Personalized Customer Experiences
- 8.4.4. Improve Asset Management
- 8.4.5. Develop New Products and Services
- 8.4.6. Improve Safety
- 8.4.7. Other Applications
- 8.5. Latin America Generative AI in Utilities Market Analysis, Opportunity and Forecast, By Based On Deployment, 2016-2032
- 8.5.1. Latin America Generative AI in Utilities Market Analysis by Based On Deployment: Introduction
- 8.5.2. Market Size Absolute $ Opportunity Analysis and Forecast, By Based On Deployment, 2016-2032
- 8.5.3. On-Premises
- 8.5.4. Cloud-Based
- 8.5.5. Hybrid
- 8.5.6. Edge Computing
- 8.5.7. Collaborative
- 8.5.8. Customized In-House
- 8.6. Latin America Generative AI in Utilities Market Analysis, Opportunity and Forecast, By Country , 2016-2032
- 8.6.1. Latin America Generative AI in Utilities Market Analysis by Country : Introduction
- 8.6.2. Market Size Absolute $ Opportunity Analysis and Forecast, Country , 2016-2032
- 8.6.2.1. Brazil
- 8.6.2.2. Colombia
- 8.6.2.3. Chile
- 8.6.2.4. Argentina
- 8.6.2.5. Costa Rica
- 8.6.2.6. Rest of Latin America
- 9. Middle East & Africa Generative AI in Utilities Market Analysis, Opportunity and Forecast, 2016-2032
- 9.1. Middle East & Africa Generative AI in Utilities Market Analysis, 2016-2021
- 9.2. Middle East & Africa Generative AI in Utilities Market Opportunity and Forecast, 2023-2032
- 9.3. Middle East & Africa Generative AI in Utilities Market Analysis, Opportunity and Forecast, By Based On Type, 2016-2032
- 9.3.1. Middle East & Africa Generative AI in Utilities Market Analysis by Based On Type: Introduction
- 9.3.2. Market Size Absolute $ Opportunity Analysis and Forecast, By Based On Type, 2016-2032
- 9.3.3. Electricity Generation
- 9.3.4. Transmission and Distribution
- 9.3.5. Water and Wastewater Management
- 9.3.6. Gas and Oil Utilities
- 9.3.7. Renewable Energy Integration
- 9.3.8. Customer Engagement and Energy Efficiency
- 9.4. Middle East & Africa Generative AI in Utilities Market Analysis, Opportunity and Forecast, By Based On Application, 2016-2032
- 9.4.1. Middle East & Africa Generative AI in Utilities Market Analysis by Based On Application: Introduction
- 9.4.2. Market Size Absolute $ Opportunity Analysis and Forecast, By Based On Application, 2016-2032
- 9.4.3. Create Personalized Customer Experiences
- 9.4.4. Improve Asset Management
- 9.4.5. Develop New Products and Services
- 9.4.6. Improve Safety
- 9.4.7. Other Applications
- 9.5. Middle East & Africa Generative AI in Utilities Market Analysis, Opportunity and Forecast, By Based On Deployment, 2016-2032
- 9.5.1. Middle East & Africa Generative AI in Utilities Market Analysis by Based On Deployment: Introduction
- 9.5.2. Market Size Absolute $ Opportunity Analysis and Forecast, By Based On Deployment, 2016-2032
- 9.5.3. On-Premises
- 9.5.4. Cloud-Based
- 9.5.5. Hybrid
- 9.5.6. Edge Computing
- 9.5.7. Collaborative
- 9.5.8. Customized In-House
- 9.6. Middle East & Africa Generative AI in Utilities Market Analysis, Opportunity and Forecast, By Country , 2016-2032
- 9.6.1. Middle East & Africa Generative AI in Utilities Market Analysis by Country : Introduction
- 9.6.2. Market Size Absolute $ Opportunity Analysis and Forecast, Country , 2016-2032
- 9.6.2.1. Algeria
- 9.6.2.2. Egypt
- 9.6.2.3. Israel
- 9.6.2.4. Kuwait
- 9.6.2.5. Nigeria
- 9.6.2.6. Saudi Arabia
- 9.6.2.7. South Africa
- 9.6.2.8. Turkey
- 9.6.2.9. The UAE
- 9.6.2.10. Rest of MEA
- 10. Global Generative AI in Utilities Market Analysis, Opportunity and Forecast, By Region , 2016-2032
- 10.1. Global Generative AI in Utilities Market Analysis by Region : Introduction
- 10.2. Market Size Absolute $ Opportunity Analysis and Forecast, By Region , 2016-2032
- 10.2.1. North America
- 10.2.2. Western Europe
- 10.2.3. Eastern Europe
- 10.2.4. APAC
- 10.2.5. Latin America
- 10.2.6. Middle East & Africa
- 11. Global Generative AI in Utilities Market Competitive Landscape, Market Share Analysis, and Company Profiles
- 11.1. Market Share Analysis
- 11.2. Company Profiles
- 11.3. Siemens AG
- 11.3.1. Company Overview
- 11.3.2. Financial Highlights
- 11.3.3. Product Portfolio
- 11.3.4. SWOT Analysis
- 11.3.5. Key Strategies and Developments
- 11.4. General Electric Company
- 11.4.1. Company Overview
- 11.4.2. Financial Highlights
- 11.4.3. Product Portfolio
- 11.4.4. SWOT Analysis
- 11.4.5. Key Strategies and Developments
- 11.5. ABB Ltd.
- 11.5.1. Company Overview
- 11.5.2. Financial Highlights
- 11.5.3. Product Portfolio
- 11.5.4. SWOT Analysis
- 11.5.5. Key Strategies and Developments
- 11.6. Schneider Electric SE
- 11.6.1. Company Overview
- 11.6.2. Financial Highlights
- 11.6.3. Product Portfolio
- 11.6.4. SWOT Analysis
- 11.6.5. Key Strategies and Developments
- 11.7. IBM Corporation
- 11.7.1. Company Overview
- 11.7.2. Financial Highlights
- 11.7.3. Product Portfolio
- 11.7.4. SWOT Analysis
- 11.7.5. Key Strategies and Developments
- 11.8. Microsoft Corporation
- 11.8.1. Company Overview
- 11.8.2. Financial Highlights
- 11.8.3. Product Portfolio
- 11.8.4. SWOT Analysis
- 11.8.5. Key Strategies and Developments
- 11.9. Other Key Players
- 11.9.1. Company Overview
- 11.9.2. Financial Highlights
- 11.9.3. Product Portfolio
- 11.9.4. SWOT Analysis
- 11.9.5. Key Strategies and Developments
- 12. Assumptions and Acronyms
- 13. Research Methodology
- 14. Contact
- List of Figures
- Figure 1: Global Generative AI in Utilities Market Revenue (US$ Mn) Market Share by Based On Type in 2022
- Figure 2: Global Generative AI in Utilities Market Attractiveness Analysis by Based On Type, 2016-2032
- Figure 3: Global Generative AI in Utilities Market Revenue (US$ Mn) Market Share by Based On Applicationin 2022
- Figure 4: Global Generative AI in Utilities Market Attractiveness Analysis by Based On Application, 2016-2032
- Figure 5: Global Generative AI in Utilities Market Revenue (US$ Mn) Market Share by Based On Deploymentin 2022
- Figure 6: Global Generative AI in Utilities Market Attractiveness Analysis by Based On Deployment, 2016-2032
- Figure 7: Global Generative AI in Utilities Market Revenue (US$ Mn) Market Share by Region in 2022
- Figure 8: Global Generative AI in Utilities Market Attractiveness Analysis by Region, 2016-2032
- Figure 9: Global Generative AI in Utilities Market Revenue (US$ Mn) (2016-2032)
- Figure 10: Global Generative AI in Utilities Market Revenue (US$ Mn) Comparison by Region (2016-2032)
- Figure 11: Global Generative AI in Utilities Market Revenue (US$ Mn) Comparison by Based On Type (2016-2032)
- Figure 12: Global Generative AI in Utilities Market Revenue (US$ Mn) Comparison by Based On Application (2016-2032)
- Figure 13: Global Generative AI in Utilities Market Revenue (US$ Mn) Comparison by Based On Deployment (2016-2032)
- Figure 14: Global Generative AI in Utilities Market Y-o-Y Growth Rate Comparison by Region (2016-2032)
- Figure 15: Global Generative AI in Utilities Market Y-o-Y Growth Rate Comparison by Based On Type (2016-2032)
- Figure 16: Global Generative AI in Utilities Market Y-o-Y Growth Rate Comparison by Based On Application (2016-2032)
- Figure 17: Global Generative AI in Utilities Market Y-o-Y Growth Rate Comparison by Based On Deployment (2016-2032)
- Figure 18: Global Generative AI in Utilities Market Share Comparison by Region (2016-2032)
- Figure 19: Global Generative AI in Utilities Market Share Comparison by Based On Type (2016-2032)
- Figure 20: Global Generative AI in Utilities Market Share Comparison by Based On Application (2016-2032)
- Figure 21: Global Generative AI in Utilities Market Share Comparison by Based On Deployment (2016-2032)
- Figure 22: North America Generative AI in Utilities Market Revenue (US$ Mn) Market Share by Based On Typein 2022
- Figure 23: North America Generative AI in Utilities Market Attractiveness Analysis by Based On Type, 2016-2032
- Figure 24: North America Generative AI in Utilities Market Revenue (US$ Mn) Market Share by Based On Applicationin 2022
- Figure 25: North America Generative AI in Utilities Market Attractiveness Analysis by Based On Application, 2016-2032
- Figure 26: North America Generative AI in Utilities Market Revenue (US$ Mn) Market Share by Based On Deploymentin 2022
- Figure 27: North America Generative AI in Utilities Market Attractiveness Analysis by Based On Deployment, 2016-2032
- Figure 28: North America Generative AI in Utilities Market Revenue (US$ Mn) Market Share by Country in 2022
- Figure 29: North America Generative AI in Utilities Market Attractiveness Analysis by Country, 2016-2032
- Figure 30: North America Generative AI in Utilities Market Revenue (US$ Mn) (2016-2032)
- Figure 31: North America Generative AI in Utilities Market Revenue (US$ Mn) Comparison by Country (2016-2032)
- Figure 32: North America Generative AI in Utilities Market Revenue (US$ Mn) Comparison by Based On Type (2016-2032)
- Figure 33: North America Generative AI in Utilities Market Revenue (US$ Mn) Comparison by Based On Application (2016-2032)
- Figure 34: North America Generative AI in Utilities Market Revenue (US$ Mn) Comparison by Based On Deployment (2016-2032)
- Figure 35: North America Generative AI in Utilities Market Y-o-Y Growth Rate Comparison by Country (2016-2032)
- Figure 36: North America Generative AI in Utilities Market Y-o-Y Growth Rate Comparison by Based On Type (2016-2032)
- Figure 37: North America Generative AI in Utilities Market Y-o-Y Growth Rate Comparison by Based On Application (2016-2032)
- Figure 38: North America Generative AI in Utilities Market Y-o-Y Growth Rate Comparison by Based On Deployment (2016-2032)
- Figure 39: North America Generative AI in Utilities Market Share Comparison by Country (2016-2032)
- Figure 40: North America Generative AI in Utilities Market Share Comparison by Based On Type (2016-2032)
- Figure 41: North America Generative AI in Utilities Market Share Comparison by Based On Application (2016-2032)
- Figure 42: North America Generative AI in Utilities Market Share Comparison by Based On Deployment (2016-2032)
- Figure 43: Western Europe Generative AI in Utilities Market Revenue (US$ Mn) Market Share by Based On Typein 2022
- Figure 44: Western Europe Generative AI in Utilities Market Attractiveness Analysis by Based On Type, 2016-2032
- Figure 45: Western Europe Generative AI in Utilities Market Revenue (US$ Mn) Market Share by Based On Applicationin 2022
- Figure 46: Western Europe Generative AI in Utilities Market Attractiveness Analysis by Based On Application, 2016-2032
- Figure 47: Western Europe Generative AI in Utilities Market Revenue (US$ Mn) Market Share by Based On Deploymentin 2022
- Figure 48: Western Europe Generative AI in Utilities Market Attractiveness Analysis by Based On Deployment, 2016-2032
- Figure 49: Western Europe Generative AI in Utilities Market Revenue (US$ Mn) Market Share by Country in 2022
- Figure 50: Western Europe Generative AI in Utilities Market Attractiveness Analysis by Country, 2016-2032
- Figure 51: Western Europe Generative AI in Utilities Market Revenue (US$ Mn) (2016-2032)
- Figure 52: Western Europe Generative AI in Utilities Market Revenue (US$ Mn) Comparison by Country (2016-2032)
- Figure 53: Western Europe Generative AI in Utilities Market Revenue (US$ Mn) Comparison by Based On Type (2016-2032)
- Figure 54: Western Europe Generative AI in Utilities Market Revenue (US$ Mn) Comparison by Based On Application (2016-2032)
- Figure 55: Western Europe Generative AI in Utilities Market Revenue (US$ Mn) Comparison by Based On Deployment (2016-2032)
- Figure 56: Western Europe Generative AI in Utilities Market Y-o-Y Growth Rate Comparison by Country (2016-2032)
- Figure 57: Western Europe Generative AI in Utilities Market Y-o-Y Growth Rate Comparison by Based On Type (2016-2032)
- Figure 58: Western Europe Generative AI in Utilities Market Y-o-Y Growth Rate Comparison by Based On Application (2016-2032)
- Figure 59: Western Europe Generative AI in Utilities Market Y-o-Y Growth Rate Comparison by Based On Deployment (2016-2032)
- Figure 60: Western Europe Generative AI in Utilities Market Share Comparison by Country (2016-2032)
- Figure 61: Western Europe Generative AI in Utilities Market Share Comparison by Based On Type (2016-2032)
- Figure 62: Western Europe Generative AI in Utilities Market Share Comparison by Based On Application (2016-2032)
- Figure 63: Western Europe Generative AI in Utilities Market Share Comparison by Based On Deployment (2016-2032)
- Figure 64: Eastern Europe Generative AI in Utilities Market Revenue (US$ Mn) Market Share by Based On Typein 2022
- Figure 65: Eastern Europe Generative AI in Utilities Market Attractiveness Analysis by Based On Type, 2016-2032
- Figure 66: Eastern Europe Generative AI in Utilities Market Revenue (US$ Mn) Market Share by Based On Applicationin 2022
- Figure 67: Eastern Europe Generative AI in Utilities Market Attractiveness Analysis by Based On Application, 2016-2032
- Figure 68: Eastern Europe Generative AI in Utilities Market Revenue (US$ Mn) Market Share by Based On Deploymentin 2022
- Figure 69: Eastern Europe Generative AI in Utilities Market Attractiveness Analysis by Based On Deployment, 2016-2032
- Figure 70: Eastern Europe Generative AI in Utilities Market Revenue (US$ Mn) Market Share by Country in 2022
- Figure 71: Eastern Europe Generative AI in Utilities Market Attractiveness Analysis by Country, 2016-2032
- Figure 72: Eastern Europe Generative AI in Utilities Market Revenue (US$ Mn) (2016-2032)
- Figure 73: Eastern Europe Generative AI in Utilities Market Revenue (US$ Mn) Comparison by Country (2016-2032)
- Figure 74: Eastern Europe Generative AI in Utilities Market Revenue (US$ Mn) Comparison by Based On Type (2016-2032)
- Figure 75: Eastern Europe Generative AI in Utilities Market Revenue (US$ Mn) Comparison by Based On Application (2016-2032)
- Figure 76: Eastern Europe Generative AI in Utilities Market Revenue (US$ Mn) Comparison by Based On Deployment (2016-2032)
- Figure 77: Eastern Europe Generative AI in Utilities Market Y-o-Y Growth Rate Comparison by Country (2016-2032)
- Figure 78: Eastern Europe Generative AI in Utilities Market Y-o-Y Growth Rate Comparison by Based On Type (2016-2032)
- Figure 79: Eastern Europe Generative AI in Utilities Market Y-o-Y Growth Rate Comparison by Based On Application (2016-2032)
- Figure 80: Eastern Europe Generative AI in Utilities Market Y-o-Y Growth Rate Comparison by Based On Deployment (2016-2032)
- Figure 81: Eastern Europe Generative AI in Utilities Market Share Comparison by Country (2016-2032)
- Figure 82: Eastern Europe Generative AI in Utilities Market Share Comparison by Based On Type (2016-2032)
- Figure 83: Eastern Europe Generative AI in Utilities Market Share Comparison by Based On Application (2016-2032)
- Figure 84: Eastern Europe Generative AI in Utilities Market Share Comparison by Based On Deployment (2016-2032)
- Figure 85: APAC Generative AI in Utilities Market Revenue (US$ Mn) Market Share by Based On Typein 2022
- Figure 86: APAC Generative AI in Utilities Market Attractiveness Analysis by Based On Type, 2016-2032
- Figure 87: APAC Generative AI in Utilities Market Revenue (US$ Mn) Market Share by Based On Applicationin 2022
- Figure 88: APAC Generative AI in Utilities Market Attractiveness Analysis by Based On Application, 2016-2032
- Figure 89: APAC Generative AI in Utilities Market Revenue (US$ Mn) Market Share by Based On Deploymentin 2022
- Figure 90: APAC Generative AI in Utilities Market Attractiveness Analysis by Based On Deployment, 2016-2032
- Figure 91: APAC Generative AI in Utilities Market Revenue (US$ Mn) Market Share by Country in 2022
- Figure 92: APAC Generative AI in Utilities Market Attractiveness Analysis by Country, 2016-2032
- Figure 93: APAC Generative AI in Utilities Market Revenue (US$ Mn) (2016-2032)
- Figure 94: APAC Generative AI in Utilities Market Revenue (US$ Mn) Comparison by Country (2016-2032)
- Figure 95: APAC Generative AI in Utilities Market Revenue (US$ Mn) Comparison by Based On Type (2016-2032)
- Figure 96: APAC Generative AI in Utilities Market Revenue (US$ Mn) Comparison by Based On Application (2016-2032)
- Figure 97: APAC Generative AI in Utilities Market Revenue (US$ Mn) Comparison by Based On Deployment (2016-2032)
- Figure 98: APAC Generative AI in Utilities Market Y-o-Y Growth Rate Comparison by Country (2016-2032)
- Figure 99: APAC Generative AI in Utilities Market Y-o-Y Growth Rate Comparison by Based On Type (2016-2032)
- Figure 100: APAC Generative AI in Utilities Market Y-o-Y Growth Rate Comparison by Based On Application (2016-2032)
- Figure 101: APAC Generative AI in Utilities Market Y-o-Y Growth Rate Comparison by Based On Deployment (2016-2032)
- Figure 102: APAC Generative AI in Utilities Market Share Comparison by Country (2016-2032)
- Figure 103: APAC Generative AI in Utilities Market Share Comparison by Based On Type (2016-2032)
- Figure 104: APAC Generative AI in Utilities Market Share Comparison by Based On Application (2016-2032)
- Figure 105: APAC Generative AI in Utilities Market Share Comparison by Based On Deployment (2016-2032)
- Figure 106: Latin America Generative AI in Utilities Market Revenue (US$ Mn) Market Share by Based On Typein 2022
- Figure 107: Latin America Generative AI in Utilities Market Attractiveness Analysis by Based On Type, 2016-2032
- Figure 108: Latin America Generative AI in Utilities Market Revenue (US$ Mn) Market Share by Based On Applicationin 2022
- Figure 109: Latin America Generative AI in Utilities Market Attractiveness Analysis by Based On Application, 2016-2032
- Figure 110: Latin America Generative AI in Utilities Market Revenue (US$ Mn) Market Share by Based On Deploymentin 2022
- Figure 111: Latin America Generative AI in Utilities Market Attractiveness Analysis by Based On Deployment, 2016-2032
- Figure 112: Latin America Generative AI in Utilities Market Revenue (US$ Mn) Market Share by Country in 2022
- Figure 113: Latin America Generative AI in Utilities Market Attractiveness Analysis by Country, 2016-2032
- Figure 114: Latin America Generative AI in Utilities Market Revenue (US$ Mn) (2016-2032)
- Figure 115: Latin America Generative AI in Utilities Market Revenue (US$ Mn) Comparison by Country (2016-2032)
- Figure 116: Latin America Generative AI in Utilities Market Revenue (US$ Mn) Comparison by Based On Type (2016-2032)
- Figure 117: Latin America Generative AI in Utilities Market Revenue (US$ Mn) Comparison by Based On Application (2016-2032)
- Figure 118: Latin America Generative AI in Utilities Market Revenue (US$ Mn) Comparison by Based On Deployment (2016-2032)
- Figure 119: Latin America Generative AI in Utilities Market Y-o-Y Growth Rate Comparison by Country (2016-2032)
- Figure 120: Latin America Generative AI in Utilities Market Y-o-Y Growth Rate Comparison by Based On Type (2016-2032)
- Figure 121: Latin America Generative AI in Utilities Market Y-o-Y Growth Rate Comparison by Based On Application (2016-2032)
- Figure 122: Latin America Generative AI in Utilities Market Y-o-Y Growth Rate Comparison by Based On Deployment (2016-2032)
- Figure 123: Latin America Generative AI in Utilities Market Share Comparison by Country (2016-2032)
- Figure 124: Latin America Generative AI in Utilities Market Share Comparison by Based On Type (2016-2032)
- Figure 125: Latin America Generative AI in Utilities Market Share Comparison by Based On Application (2016-2032)
- Figure 126: Latin America Generative AI in Utilities Market Share Comparison by Based On Deployment (2016-2032)
- Figure 127: Middle East & Africa Generative AI in Utilities Market Revenue (US$ Mn) Market Share by Based On Typein 2022
- Figure 128: Middle East & Africa Generative AI in Utilities Market Attractiveness Analysis by Based On Type, 2016-2032
- Figure 129: Middle East & Africa Generative AI in Utilities Market Revenue (US$ Mn) Market Share by Based On Applicationin 2022
- Figure 130: Middle East & Africa Generative AI in Utilities Market Attractiveness Analysis by Based On Application, 2016-2032
- Figure 131: Middle East & Africa Generative AI in Utilities Market Revenue (US$ Mn) Market Share by Based On Deploymentin 2022
- Figure 132: Middle East & Africa Generative AI in Utilities Market Attractiveness Analysis by Based On Deployment, 2016-2032
- Figure 133: Middle East & Africa Generative AI in Utilities Market Revenue (US$ Mn) Market Share by Country in 2022
- Figure 134: Middle East & Africa Generative AI in Utilities Market Attractiveness Analysis by Country, 2016-2032
- Figure 135: Middle East & Africa Generative AI in Utilities Market Revenue (US$ Mn) (2016-2032)
- Figure 136: Middle East & Africa Generative AI in Utilities Market Revenue (US$ Mn) Comparison by Country (2016-2032)
- Figure 137: Middle East & Africa Generative AI in Utilities Market Revenue (US$ Mn) Comparison by Based On Type (2016-2032)
- Figure 138: Middle East & Africa Generative AI in Utilities Market Revenue (US$ Mn) Comparison by Based On Application (2016-2032)
- Figure 139: Middle East & Africa Generative AI in Utilities Market Revenue (US$ Mn) Comparison by Based On Deployment (2016-2032)
- Figure 140: Middle East & Africa Generative AI in Utilities Market Y-o-Y Growth Rate Comparison by Country (2016-2032)
- Figure 141: Middle East & Africa Generative AI in Utilities Market Y-o-Y Growth Rate Comparison by Based On Type (2016-2032)
- Figure 142: Middle East & Africa Generative AI in Utilities Market Y-o-Y Growth Rate Comparison by Based On Application (2016-2032)
- Figure 143: Middle East & Africa Generative AI in Utilities Market Y-o-Y Growth Rate Comparison by Based On Deployment (2016-2032)
- Figure 144: Middle East & Africa Generative AI in Utilities Market Share Comparison by Country (2016-2032)
- Figure 145: Middle East & Africa Generative AI in Utilities Market Share Comparison by Based On Type (2016-2032)
- Figure 146: Middle East & Africa Generative AI in Utilities Market Share Comparison by Based On Application (2016-2032)
- Figure 147: Middle East & Africa Generative AI in Utilities Market Share Comparison by Based On Deployment (2016-2032)
- List of Tables
- Table 1: Global Generative AI in Utilities Market Comparison by Based On Type (2016-2032)
- Table 2: Global Generative AI in Utilities Market Comparison by Based On Application (2016-2032)
- Table 3: Global Generative AI in Utilities Market Comparison by Based On Deployment (2016-2032)
- Table 4: Global Generative AI in Utilities Market Revenue (US$ Mn) Comparison by Region (2016-2032)
- Table 5: Global Generative AI in Utilities Market Revenue (US$ Mn) (2016-2032)
- Table 6: Global Generative AI in Utilities Market Revenue (US$ Mn) Comparison by Region (2016-2032)
- Table 7: Global Generative AI in Utilities Market Revenue (US$ Mn) Comparison by Based On Type (2016-2032)
- Table 8: Global Generative AI in Utilities Market Revenue (US$ Mn) Comparison by Based On Application (2016-2032)
- Table 9: Global Generative AI in Utilities Market Revenue (US$ Mn) Comparison by Based On Deployment (2016-2032)
- Table 10: Global Generative AI in Utilities Market Y-o-Y Growth Rate Comparison by Region (2016-2032)
- Table 11: Global Generative AI in Utilities Market Y-o-Y Growth Rate Comparison by Based On Type (2016-2032)
- Table 12: Global Generative AI in Utilities Market Y-o-Y Growth Rate Comparison by Based On Application (2016-2032)
- Table 13: Global Generative AI in Utilities Market Y-o-Y Growth Rate Comparison by Based On Deployment (2016-2032)
- Table 14: Global Generative AI in Utilities Market Share Comparison by Region (2016-2032)
- Table 15: Global Generative AI in Utilities Market Share Comparison by Based On Type (2016-2032)
- Table 16: Global Generative AI in Utilities Market Share Comparison by Based On Application (2016-2032)
- Table 17: Global Generative AI in Utilities Market Share Comparison by Based On Deployment (2016-2032)
- Table 18: North America Generative AI in Utilities Market Comparison by Based On Application (2016-2032)
- Table 19: North America Generative AI in Utilities Market Comparison by Based On Deployment (2016-2032)
- Table 20: North America Generative AI in Utilities Market Revenue (US$ Mn) Comparison by Country (2016-2032)
- Table 21: North America Generative AI in Utilities Market Revenue (US$ Mn) (2016-2032)
- Table 22: North America Generative AI in Utilities Market Revenue (US$ Mn) Comparison by Country (2016-2032)
- Table 23: North America Generative AI in Utilities Market Revenue (US$ Mn) Comparison by Based On Type (2016-2032)
- Table 24: North America Generative AI in Utilities Market Revenue (US$ Mn) Comparison by Based On Application (2016-2032)
- Table 25: North America Generative AI in Utilities Market Revenue (US$ Mn) Comparison by Based On Deployment (2016-2032)
- Table 26: North America Generative AI in Utilities Market Y-o-Y Growth Rate Comparison by Country (2016-2032)
- Table 27: North America Generative AI in Utilities Market Y-o-Y Growth Rate Comparison by Based On Type (2016-2032)
- Table 28: North America Generative AI in Utilities Market Y-o-Y Growth Rate Comparison by Based On Application (2016-2032)
- Table 29: North America Generative AI in Utilities Market Y-o-Y Growth Rate Comparison by Based On Deployment (2016-2032)
- Table 30: North America Generative AI in Utilities Market Share Comparison by Country (2016-2032)
- Table 31: North America Generative AI in Utilities Market Share Comparison by Based On Type (2016-2032)
- Table 32: North America Generative AI in Utilities Market Share Comparison by Based On Application (2016-2032)
- Table 33: North America Generative AI in Utilities Market Share Comparison by Based On Deployment (2016-2032)
- Table 34: Western Europe Generative AI in Utilities Market Comparison by Based On Type (2016-2032)
- Table 35: Western Europe Generative AI in Utilities Market Comparison by Based On Application (2016-2032)
- Table 36: Western Europe Generative AI in Utilities Market Comparison by Based On Deployment (2016-2032)
- Table 37: Western Europe Generative AI in Utilities Market Revenue (US$ Mn) Comparison by Country (2016-2032)
- Table 38: Western Europe Generative AI in Utilities Market Revenue (US$ Mn) (2016-2032)
- Table 39: Western Europe Generative AI in Utilities Market Revenue (US$ Mn) Comparison by Country (2016-2032)
- Table 40: Western Europe Generative AI in Utilities Market Revenue (US$ Mn) Comparison by Based On Type (2016-2032)
- Table 41: Western Europe Generative AI in Utilities Market Revenue (US$ Mn) Comparison by Based On Application (2016-2032)
- Table 42: Western Europe Generative AI in Utilities Market Revenue (US$ Mn) Comparison by Based On Deployment (2016-2032)
- Table 43: Western Europe Generative AI in Utilities Market Y-o-Y Growth Rate Comparison by Country (2016-2032)
- Table 44: Western Europe Generative AI in Utilities Market Y-o-Y Growth Rate Comparison by Based On Type (2016-2032)
- Table 45: Western Europe Generative AI in Utilities Market Y-o-Y Growth Rate Comparison by Based On Application (2016-2032)
- Table 46: Western Europe Generative AI in Utilities Market Y-o-Y Growth Rate Comparison by Based On Deployment (2016-2032)
- Table 47: Western Europe Generative AI in Utilities Market Share Comparison by Country (2016-2032)
- Table 48: Western Europe Generative AI in Utilities Market Share Comparison by Based On Type (2016-2032)
- Table 49: Western Europe Generative AI in Utilities Market Share Comparison by Based On Application (2016-2032)
- Table 50: Western Europe Generative AI in Utilities Market Share Comparison by Based On Deployment (2016-2032)
- Table 51: Eastern Europe Generative AI in Utilities Market Comparison by Based On Type (2016-2032)
- Table 52: Eastern Europe Generative AI in Utilities Market Comparison by Based On Application (2016-2032)
- Table 53: Eastern Europe Generative AI in Utilities Market Comparison by Based On Deployment (2016-2032)
- Table 54: Eastern Europe Generative AI in Utilities Market Revenue (US$ Mn) Comparison by Country (2016-2032)
- Table 55: Eastern Europe Generative AI in Utilities Market Revenue (US$ Mn) (2016-2032)
- Table 56: Eastern Europe Generative AI in Utilities Market Revenue (US$ Mn) Comparison by Country (2016-2032)
- Table 57: Eastern Europe Generative AI in Utilities Market Revenue (US$ Mn) Comparison by Based On Type (2016-2032)
- Table 58: Eastern Europe Generative AI in Utilities Market Revenue (US$ Mn) Comparison by Based On Application (2016-2032)
- Table 59: Eastern Europe Generative AI in Utilities Market Revenue (US$ Mn) Comparison by Based On Deployment (2016-2032)
- Table 60: Eastern Europe Generative AI in Utilities Market Y-o-Y Growth Rate Comparison by Country (2016-2032)
- Table 61: Eastern Europe Generative AI in Utilities Market Y-o-Y Growth Rate Comparison by Based On Type (2016-2032)
- Table 62: Eastern Europe Generative AI in Utilities Market Y-o-Y Growth Rate Comparison by Based On Application (2016-2032)
- Table 63: Eastern Europe Generative AI in Utilities Market Y-o-Y Growth Rate Comparison by Based On Deployment (2016-2032)
- Table 64: Eastern Europe Generative AI in Utilities Market Share Comparison by Country (2016-2032)
- Table 65: Eastern Europe Generative AI in Utilities Market Share Comparison by Based On Type (2016-2032)
- Table 66: Eastern Europe Generative AI in Utilities Market Share Comparison by Based On Application (2016-2032)
- Table 67: Eastern Europe Generative AI in Utilities Market Share Comparison by Based On Deployment (2016-2032)
- Table 68: APAC Generative AI in Utilities Market Comparison by Based On Type (2016-2032)
- Table 69: APAC Generative AI in Utilities Market Comparison by Based On Application (2016-2032)
- Table 70: APAC Generative AI in Utilities Market Comparison by Based On Deployment (2016-2032)
- Table 71: APAC Generative AI in Utilities Market Revenue (US$ Mn) Comparison by Country (2016-2032)
- Table 72: APAC Generative AI in Utilities Market Revenue (US$ Mn) (2016-2032)
- Table 73: APAC Generative AI in Utilities Market Revenue (US$ Mn) Comparison by Country (2016-2032)
- Table 74: APAC Generative AI in Utilities Market Revenue (US$ Mn) Comparison by Based On Type (2016-2032)
- Table 75: APAC Generative AI in Utilities Market Revenue (US$ Mn) Comparison by Based On Application (2016-2032)
- Table 76: APAC Generative AI in Utilities Market Revenue (US$ Mn) Comparison by Based On Deployment (2016-2032)
- Table 77: APAC Generative AI in Utilities Market Y-o-Y Growth Rate Comparison by Country (2016-2032)
- Table 78: APAC Generative AI in Utilities Market Y-o-Y Growth Rate Comparison by Based On Type (2016-2032)
- Table 79: APAC Generative AI in Utilities Market Y-o-Y Growth Rate Comparison by Based On Application (2016-2032)
- Table 80: APAC Generative AI in Utilities Market Y-o-Y Growth Rate Comparison by Based On Deployment (2016-2032)
- Table 81: APAC Generative AI in Utilities Market Share Comparison by Country (2016-2032)
- Table 82: APAC Generative AI in Utilities Market Share Comparison by Based On Type (2016-2032)
- Table 83: APAC Generative AI in Utilities Market Share Comparison by Based On Application (2016-2032)
- Table 84: APAC Generative AI in Utilities Market Share Comparison by Based On Deployment (2016-2032)
- Table 85: Latin America Generative AI in Utilities Market Comparison by Based On Type (2016-2032)
- Table 86: Latin America Generative AI in Utilities Market Comparison by Based On Application (2016-2032)
- Table 87: Latin America Generative AI in Utilities Market Comparison by Based On Deployment (2016-2032)
- Table 88: Latin America Generative AI in Utilities Market Revenue (US$ Mn) Comparison by Country (2016-2032)
- Table 89: Latin America Generative AI in Utilities Market Revenue (US$ Mn) (2016-2032)
- Table 90: Latin America Generative AI in Utilities Market Revenue (US$ Mn) Comparison by Country (2016-2032)
- Table 91: Latin America Generative AI in Utilities Market Revenue (US$ Mn) Comparison by Based On Type (2016-2032)
- Table 92: Latin America Generative AI in Utilities Market Revenue (US$ Mn) Comparison by Based On Application (2016-2032)
- Table 93: Latin America Generative AI in Utilities Market Revenue (US$ Mn) Comparison by Based On Deployment (2016-2032)
- Table 94: Latin America Generative AI in Utilities Market Y-o-Y Growth Rate Comparison by Country (2016-2032)
- Table 95: Latin America Generative AI in Utilities Market Y-o-Y Growth Rate Comparison by Based On Type (2016-2032)
- Table 96: Latin America Generative AI in Utilities Market Y-o-Y Growth Rate Comparison by Based On Application (2016-2032)
- Table 97: Latin America Generative AI in Utilities Market Y-o-Y Growth Rate Comparison by Based On Deployment (2016-2032)
- Table 98: Latin America Generative AI in Utilities Market Share Comparison by Country (2016-2032)
- Table 99: Latin America Generative AI in Utilities Market Share Comparison by Based On Type (2016-2032)
- Table 100: Latin America Generative AI in Utilities Market Share Comparison by Based On Application (2016-2032)
- Table 101: Latin America Generative AI in Utilities Market Share Comparison by Based On Deployment (2016-2032)
- Table 102: Middle East & Africa Generative AI in Utilities Market Comparison by Based On Type (2016-2032)
- Table 103: Middle East & Africa Generative AI in Utilities Market Comparison by Based On Application (2016-2032)
- Table 104: Middle East & Africa Generative AI in Utilities Market Comparison by Based On Deployment (2016-2032)
- Table 105: Middle East & Africa Generative AI in Utilities Market Revenue (US$ Mn) Comparison by Country (2016-2032)
- Table 106: Middle East & Africa Generative AI in Utilities Market Revenue (US$ Mn) (2016-2032)
- Table 107: Middle East & Africa Generative AI in Utilities Market Revenue (US$ Mn) Comparison by Country (2016-2032)
- Table 108: Middle East & Africa Generative AI in Utilities Market Revenue (US$ Mn) Comparison by Based On Type (2016-2032)
- Table 109: Middle East & Africa Generative AI in Utilities Market Revenue (US$ Mn) Comparison by Based On Application (2016-2032)
- Table 110: Middle East & Africa Generative AI in Utilities Market Revenue (US$ Mn) Comparison by Based On Deployment (2016-2032)
- Table 111: Middle East & Africa Generative AI in Utilities Market Y-o-Y Growth Rate Comparison by Country (2016-2032)
- Table 112: Middle East & Africa Generative AI in Utilities Market Y-o-Y Growth Rate Comparison by Based On Type (2016-2032)
- Table 113: Middle East & Africa Generative AI in Utilities Market Y-o-Y Growth Rate Comparison by Based On Application (2016-2032)
- Table 114: Middle East & Africa Generative AI in Utilities Market Y-o-Y Growth Rate Comparison by Based On Deployment (2016-2032)
- Table 115: Middle East & Africa Generative AI in Utilities Market Share Comparison by Country (2016-2032)
- Table 116: Middle East & Africa Generative AI in Utilities Market Share Comparison by Based On Type (2016-2032)
- Table 117: Middle East & Africa Generative AI in Utilities Market Share Comparison by Based On Application (2016-2032)
- Table 118: Middle East & Africa Generative AI in Utilities Market Share Comparison by Based On Deployment (2016-2032)
- 1. Executive Summary
-
- Siemens AG
- General Electric Company
- ABB Ltd.
- Schneider Electric SE
- IBM Corporation
- Microsoft Corporation
- Other Key Players
Our Clients


View Our Licence Options
