Global Generative AI in Sports Market, By Application (Performance Analysis, Game Strategies and Other), By Deployment (On-Premises and cloud-Based), By Sports Type (Football, Tennis and Other ), By Region and Companies - Industry Segment Outlook, Market Assessment, Competition Scenario, Trends, and Forecast 2023-2032
-
37142
-
May 2023
-
163
-


-
This report was compiled by Vishwa Gaul Vishwa is an experienced market research and consulting professional with over 8 years of expertise in the ICT industry, contributing to over 700 reports across telecommunications, software, hardware, and digital solutions. Correspondence Team Lead- ICT Linkedin | Detailed Market research Methodology Our methodology involves a mix of primary research, including interviews with leading mental health experts, and secondary research from reputable medical journals and databases. View Detailed Methodology Page
-
Quick Navigation
Report Overview
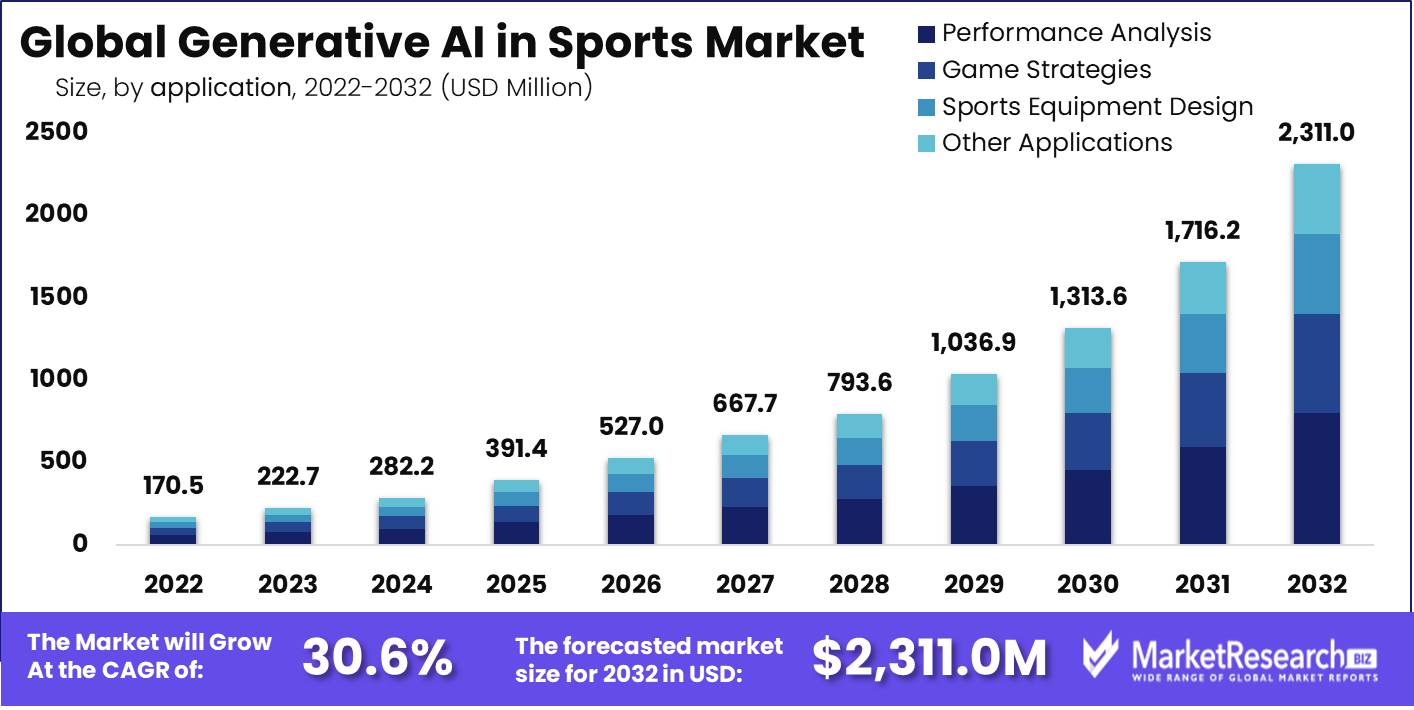
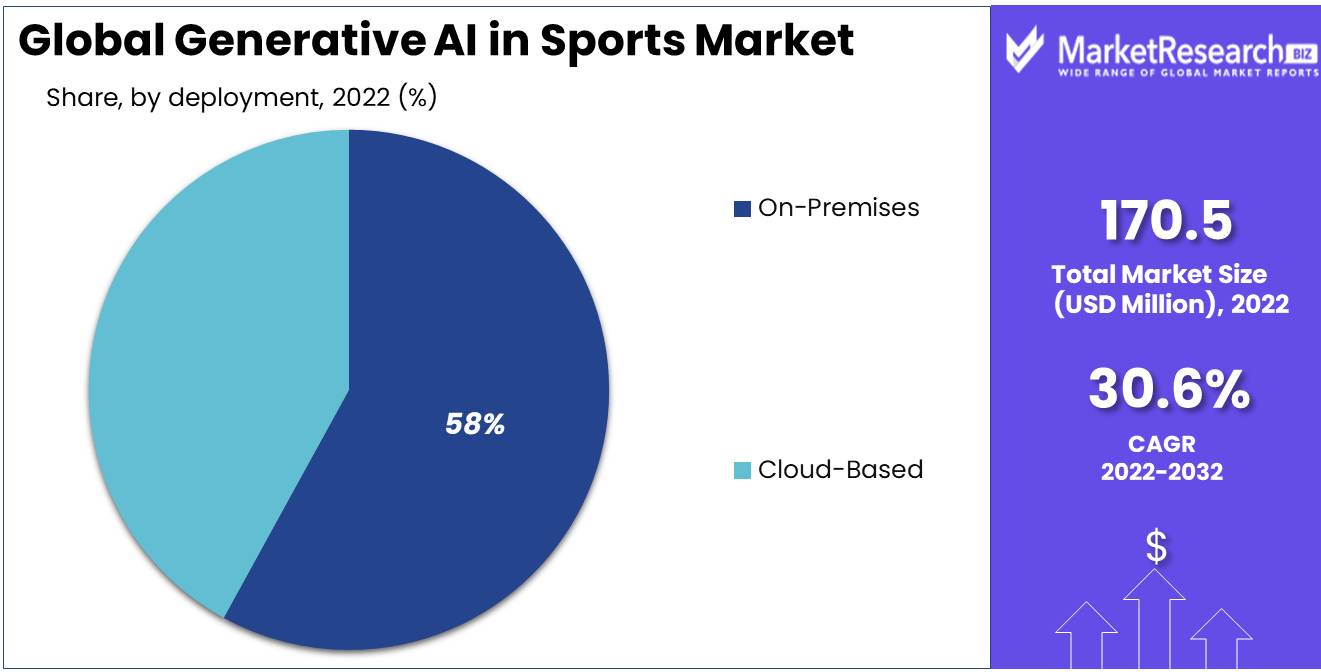
Global Generative AI in Sports Market size is expected to be worth around USD 2,311.0 Mn by 2032 from USD 170.5 Mn in 2022, growing at a CAGR of 30.6% during the forecast period from 2023 to 2032.
Generative AI for sports market is the use of AI technologies and machine learning to generate & analyze data relating to sports events and activities. This technology is increasingly being used by sports teams, organizations, and players to gain insight into player performance, tactics, and audience engagement. Generative AI in sports although still in its beginning, has a huge growth potential because of the growing demand for real-time analytics and insights in sport. The market is expected to grow in the upcoming years as more teams and sports organizations adopt generative AI technology to improve their performance.
Driving Factors
Data Availability, Personalization, and Fan Engagement are Drives the Generative AI in Sports Market.
Sports generate a large amount of data such as player statistics, game footage, and metrics for fan engagement. This data can be analyzed by generative AI to provide insights that can help coaches and teams make better decisions.
Generative AI allows athletes to be trained based on their strengths & weaknesses. This can help athletes to enhance overall performance and reduce the risk of injury. Generative AI is a controlling tool that can be used to create tailored experiences for fans. For example, it can be used to generate highlight reels or interactive video games. This can increase revenue and fan engagement for teams and leagues.
As more teams adopt generative artificial intelligence, those who do not may fall behind when it comes to performance and fan engagement. Teams and leagues could adopt generative AI to remain competitive. Generative AI automates tasks that were previously performed manually, like video analysis or player scouting. This can save teams and leagues time and resources.
Restraining Factors
Lack of Data Quality, Privacy Concerns, Cost, and Complexity is Restraining the Growth of Market.
The data in the sports industry is large but it is not always high-quality. This can limit the efficiency of generative AI algorithms as they rely upon high-quality data to generate accurate insights. Privacy and data security are concerns when using generative AI for sports. Athlete health data and personal details could be exposed or misused.
The adoption of generative AI requires significant investments in terms of infrastructure, technology, and personnel. This can be a barrier to smaller teams or organizations that have limited resources. Some organizations may have a strong tradition of sports training and performance evaluation and may resist adopting new technologies or methodologies. The use of generative AI in sports could raise ethical concerns, such as the use of performance-enhancing drugs or the potential for bias in player evaluations.
COVID-19 Impact Analysis
Due to the pandemic many sports events were delayed, canceled, or played without fans, resulting in a decrease in revenue for broadcasters, teams, and leagues. This has led to a reduction in investment in new technologies including generative AI. As a result, teams have been unable to collect and analyze data as they cannot attend in-person training, games, or events. This has reduced the amount of data available for generative AI development and training.
The pandemic has increased the adoption of remote training and work, which has led to an increased interest in generative AI for remote coaching and analysis. The limitations of remote data analysis and collection have also been highlighted. As in-person attendance is limited, there is a growing interest in engaging fans remotely.
Generative AI is a powerful tool that can be used to create customized experiences for fans. Highlight reels, interactive video games, and social media posts are all examples of personalized experiences. The pandemic forced teams and organizations to reevaluate priorities and strategies with a greater emphasis on cost savings and resilience. As organizations prioritize immediate needs, generative AI may be viewed as a lesser priority or longer-term investment.
By Application Analysis
The Performance Analysis Segment Accounted for the Largest Revenue Share in Generative AI in Sports Market in 2023.
Based on application, the market is segmented into performance analysis, game strategies, sports equipment design, and other applications. Among these types, the performance analysis is expected to be the most lucrative in the global generative AI in the sports market, with the largest revenue share of 34.6%. Performance analysis is a key application of generative AI for the sports market.
By analyzing data collected from games, training sessions, and practices, generative AI algorithms provide insights into team and player performance. This can be used to inform coaching decisions, player growth, and game strategies. Performance analysis is a key application for generative AI in the sports market. It provides coaches and teams with valuable insight into player and team performances that can inform their strategy and decisions.
For example, the use of Generative AI to analyze video footage from games, practices, and training sessions can identify patterns and trends that affect player and team performance. This can give coaches and analysts insights into areas of improvement and strategies for success.
The Game Strategies Segment is Fastest Growing Application Segment in Generative AI in Sports Market.
The game strategies segment is projected as the fastest-growing application segment in generative AI in sports market from 2023 to 2032. Generative AI algorithms can provide insights into game strategy by analyzing data about player and team performance as well as data about opposing teams.
The application of generative AI in game strategies could revolutionize the way teams and coaches approach to game preparation and make decisions. Generative AI can improve the chances of success for teams by providing data-driven insights.
For example, Generative AI can analyze data on opposing teams to identify strengths, weaknesses, and tendencies. This can help coaches devise strategies to exploit opponents' weaknesses and counter their strengths. Exploring Sports Betting and Generative AI in the Fantasy Sports market reveals dynamic trends and unprecedented opportunities for growth.
By Deployment Analysis
The On-Premises Holds the Significant Share in Deployment Segment in Generative AI in Sports Market.
Based on deployment, the market is divided into on-premises and cloud-based. Among these, the on-premises segment is dominant in the deployment segment of generative AI in sports market, with a market share of 58%. On-premises deployment is the installation of generative AI on local servers and equipment, instead of using cloud-based services.
In the sports industry, organizations that prioritize data protection and need faster processing times may prefer on-premises deployment. On-premises deployments can offer enhanced data security as sensitive data is saved locally and not in the cloud.
On-premises deployment allows for faster processing times and reduced suspense as data doesn't need to be sent over the internet. On-premises deployment allows organizations to have greater control over generative AI software as they aren't dependent on third-party providers.
Cloud-Based is Identified as Fastest Growing Deployment Segment in Projected Period.
The cloud-based segment is expected to grow at a high rate in the deployment segment of generative AI in sports market in the projected period. Cloud-based deployment refers to using cloud computing services for hosting and running the software rather than installing it locally on servers and hardware.
Cloud-based deployment of AI software in the sports market has many advantages. Cloud-based deployments can be more cost-effective than on-premises systems, as they remove the need for local equipment and maintenance costs.
Cloud-based solutions can be more expandable compared to on-premises ones since they allow firms to easily rise or down resources as demand changes. Cloud-based deployment is more flexible than on-premises solutions, as it allows organizations the ability to update and maintain generative AI software easily without having to manually update.
By Sports Type Analysis
The Football Segment Accounted for the Largest Revenue Share in Generative AI in Sports Market
Based on sports type, the market is segmented into football, tennis, cricket, basketball, hockey, golf, and other sports. Among these sports types football is expected to be the most lucrative sport in the global generative AI in sports market, with the largest revenue share of 28.4%.
Generative AI can be used to analyze team and player performance in real-time, giving coaches insights into areas where players could improve. This can include analyzing movements, positioning, and decisions. Generative AI is used to predict the outcome of football matches using historical data, team, and player performances & current performance.
This can help teams to prepare for upcoming games and make informed decisions regarding tactics and strategies. Generative AI can provide insights into tactics and strategies. For example, it can identify weaknesses in a competitor’s defense or pinpoint potential areas for attacking. This can help teams develop more effective strategies and game plans.
Generative AI has been used to identify and evaluate potential new players, based on performance metrics and factors like age, height, and weight. Generative AI analyzes data on player movements and techniques to identify areas where they are at risk of injury. This can help coaches adjust training and game plan to reduce the risk and keep players healthy.
The Basketball Segment is Fastest Growing Sports Type Segment in Generative AI in Sports Market.
The basketball segment is projected as the fastest growing sports type segment in generative AI in sports market from 2023 to 2032. Basketball uses generative AI to improve performance, optimize strategies and provide insights into player decisions.
The use of Generative AI to analyze player shooting patterns is providing insights into areas for improvements, such as shot selection, shooting mechanics, and shooting accuracy. The use of generative AI to track player movement on the court is increasing. This includes speed, agility, and reaction time. This can help coaches identify areas where players could improve their performance, and adjust their training.
Generative AI in Sports Key Market Segments
Based on Application
- Performance Analysis
- Game Strategies
- Sports Equipment Design
- Other Applications
Based on Deployment
- On-premises
- Cloud-based
Based on Sports Type
Growth Opportunity
Advanced Analytics, New Revenue Streams are the Opportunities in the Market
As teams strive to gain a competitive edge through advanced analytics, the use of generative AI is expected to grow in sports. As data becomes more available and algorithms more advanced, perceptions generated by generative AI will become more valuable for teams. This could include interactive apps, games, and other digital experiences.
Generative AI is a way to create new revenue streams for businesses and sports teams. For example, data and insights can be sold to other teams. Or licensing agreements with technology companies. As technology develops, new applications of generative AI will likely emerge in sports. This could include developing new game strategies, analyzing performance data, and predicting match results.
Latest Trends
Real-Time Data Analysis, Virtual and Augmented Reality, and Personalized Coaching are the Latest Trends in the Generative AI in Sports Market
Real-time data analytics are becoming more popular as the amount of data collected at games and during practices increases. Generative AI analyzes data in real time and provides coaches with insights they can use to adjust game strategy and make informed decisions.
Combining virtual and augmented realities with generative AI will provide immersive experiences for both players and fans. This technology is used to simulate game situations, provide training simulations and enhance fan engagement.
Generative AI, with its ability to analyze vast quantities of data, is used to provide personalized training for athletes. This includes analyzing data to identify weak areas, creating tailored training programs, as well as offering personalized feedback to the athletes.
Generative AI can be used to create predictive models that predict the outcome of games or even entire seasons. This technology helps sports teams make data-driven decisions and gain a competitive edge. Natural language processing is used to develop chatbots, which can answer questions from fans, and provide game updates and personalized recommendations.
Regional Analysis
North America Accounted for the Largest Revenue Share in Generative AI in Sports Market in 2022.
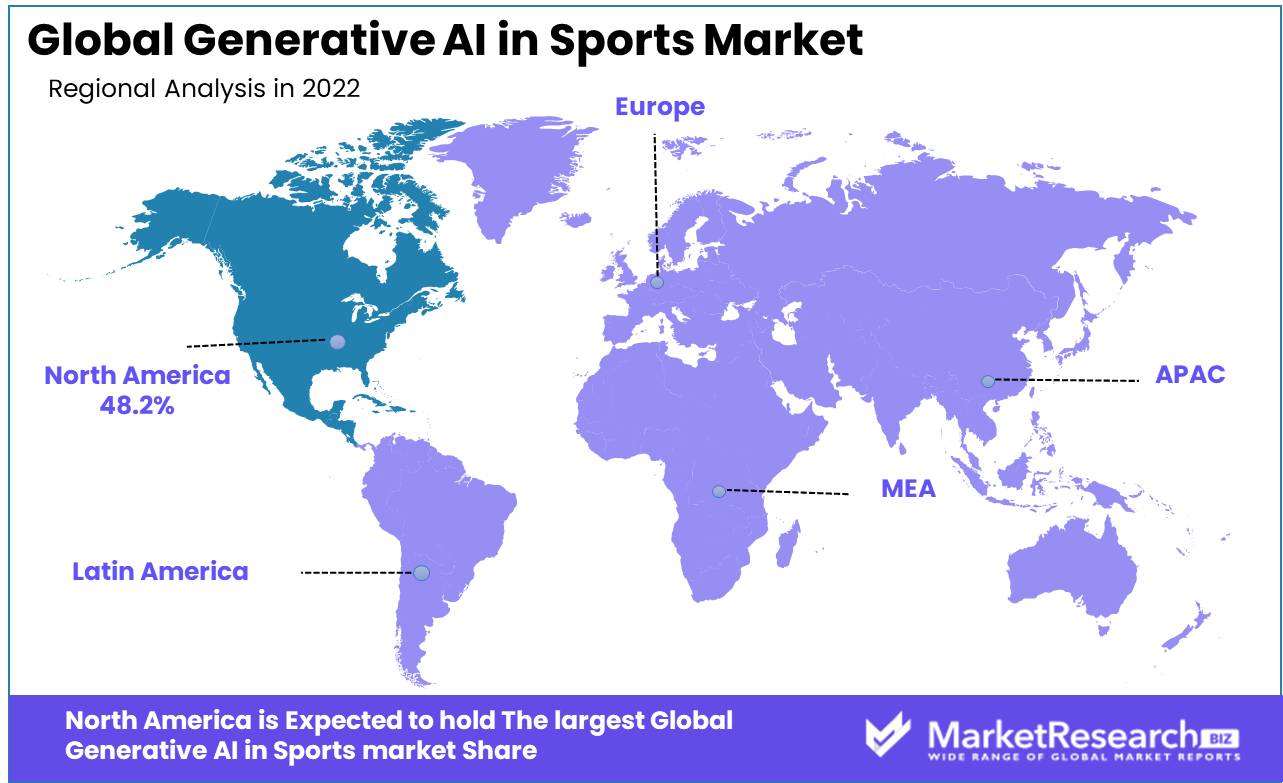
North America is estimated to be the most lucrative market in the global generative AI in sports market, with the largest market share of 48.2%, and is expected to grow at a significant rate during the forecast period.
North America is currently the largest market for generative AI in sports with the U.S. being the major contributor to this market. The region has a high concentration of technology companies, sports teams, and innovation centers which makes it an ideal environment for the growth of generative AI in sports.
Asia-Pacific is Expected as Fastest Growing Region in Projected Period in Generative AI in Sports Market.
Asia-Pacific is expected as fastest growing region in the forecast period in the generative AI in sports market. The Asia Pacific region is the fastest-growing market for generative AI in sports with China & Japan being the major contributors to this growth. The region has a large population, growing sports culture, and several sports events hosted in the region which provides numerous growth opportunities for the market.
Key Regions
- North America
- The US
- Canada
- Mexico
- Western Europe
- Germany
- France
- The UK
- Spain
- Italy
- Portugal
- Ireland
- Austria
- Switzerland
- Benelux
- Nordic
- Rest of Western Europe
- Eastern Europe
- Russia
- Poland
- The Czech Republic
- Greece
- Rest of Eastern Europe
- APAC
- China
- Japan
- South Korea
- India
- Australia & New Zealand
- Indonesia
- Malaysia
- Philippines
- Singapore
- Thailand
- Vietnam
- Rest of APAC
- Latin America
- Brazil
- Colombia
- Chile
- Argentina
- Costa Rica
- Rest of Latin America
- Middle East & Africa
- Algeria
- Egypt
- Israel
- Kuwait
- Nigeria
- Saudi Arabia
- South Africa
- Turkey
- United Arab Emirates
- Rest of MEA
Generative AI in sports is fragmented. The generative AI market in sports is expected to continue growing in the coming year, driven by factors like the increasing adoption and demand for technology in the sports industry, the growing demand for a personalized experience, and the need for businesses and sports teams to gain a competitive edge.
Market Key Players:
- State Perform Group Ltd.
- Zebra Technologies Corporation
- Catapult Group International Ltd.
- Intel Corporation
- IBM Corporation
- Second Spectrum, Inc.
- ShotTracker, Inc.
- Other Key Players
Recent Developments
- In 2021, IBM launched a new AI-powered tool called Coach Watson. It uses natural language processing and computer vision to offer personalized insights and analyses for coaches and players.
- In 2020, Intel Corporation announced a partnership with the International Olympic Committee, which has provided AI-powered analytics to the Tokyo 2020 Olympic Games.
Report Scope
Report Features Description Market Value (2022) USD 170.5 Mn Forecast Revenue (2032) USD 2,311.0 Mn CAGR (2023-2032) 30.65% Base Year for Estimation 2022 Historic Period 2016-2022 Forecast Period 2023-2032 Report Coverage Revenue Forecast, Market Dynamics, COVID-19 Impact, Competitive Landscape, Recent Developments Segments Covered By Application (Performance Analysis, Game Strategies, Sports Equipment Design, Other Applications), By Deployment (On-premises, Cloud-based), By Sports Type (Football, Tennis, Cricket, Basketball, Hockey, Golf, Other Sports) Regional Analysis North America – The US, Canada, & Mexico; Western Europe – Germany, France, The UK, Spain, Italy, Portugal, Ireland, Austria, Switzerland, Benelux, Nordic, & Rest of Western Europe; Eastern Europe – Russia, Poland, The Czech Republic, Greece, & Rest of Eastern Europe; APAC – China, Japan, South Korea, India, Australia & New Zealand, Indonesia, Malaysia, Philippines, Singapore, Thailand, Vietnam, & Rest of APAC; Latin America – Brazil, Colombia, Chile, Argentina, Costa Rica, & Rest of Latin America; Middle East & Africa – Algeria, Egypt, Israel, Kuwait, Nigeria, Saudi Arabia, South Africa, Turkey, United Arab Emirates, & Rest of MEA Competitive Landscape State Perform Group Ltd., Zebra Technologies Corporation, Catapult Group International Ltd., Intel Corporation, IBM Corporation, Second Spectrum, Inc., ShotTracker, Inc., Other Key Players Customization Scope Customization for segments, region/country-level will be provided. Moreover, additional customization can be done based on the requirements. Purchase Options We have three licenses to opt for Single User License, Multi-User License (Up to 5 Users), Corporate Use License (Unlimited User and Printable PDF) -
- 1. Executive Summary
- 1.1. Definition
- 1.2. Taxonomy
- 1.3. Research Scope
- 1.4. Key Analysis
- 1.5. Key Findings by Major Segments
- 1.6. Top strategies by Major Players
- 2. Global Generative AI in Sports Market Overview
- 2.1. Generative AI in Sports Market Dynamics
- 2.1.1. Drivers
- 2.1.2. Opportunities
- 2.1.3. Restraints
- 2.1.4. Challenges
- 2.2. Macro-economic Factors
- 2.3. Regulatory Framework
- 2.4. Market Investment Feasibility Index
- 2.5. PEST Analysis
- 2.6. PORTER’S Five Force Analysis
- 2.7. Drivers & Restraints Impact Analysis
- 2.8. Industry Chain Analysis
- 2.9. Cost Structure Analysis
- 2.10. Marketing Strategy
- 2.11. Russia-Ukraine War Impact Analysis
- 2.12. Opportunity Map Analysis
- 2.13. Market Competition Scenario Analysis
- 2.14. Product Life Cycle Analysis
- 2.15. Opportunity Orbits
- 2.16. Manufacturer Intensity Map
- 2.17. Major Companies sales by Value & Volume
- 2.1. Generative AI in Sports Market Dynamics
- 3. Global Generative AI in Sports Market Analysis, Opportunity and Forecast, 2016-2032
- 3.1. Global Generative AI in Sports Market Analysis, 2016-2021
- 3.2. Global Generative AI in Sports Market Opportunity and Forecast, 2023-2032
- 3.3. Global Generative AI in Sports Market Analysis, Opportunity and Forecast, By Based On Application, 2016-2032
- 3.3.1. Global Generative AI in Sports Market Analysis by Based On Application: Introduction
- 3.3.2. Market Size Absolute $ Opportunity Analysis and Forecast, By Based On Application, 2016-2032
- 3.3.3. Performance Analysis
- 3.3.4. Game Strategies
- 3.3.5. Sports Equipment Design
- 3.3.6. Other Applications
- 3.4. Global Generative AI in Sports Market Analysis, Opportunity and Forecast, By Based On Deployment, 2016-2032
- 3.4.1. Global Generative AI in Sports Market Analysis by Based On Deployment: Introduction
- 3.4.2. Market Size Absolute $ Opportunity Analysis and Forecast, By Based On Deployment, 2016-2032
- 3.4.3. On-premises
- 3.4.4. Cloud-based
- 3.5. Global Generative AI in Sports Market Analysis, Opportunity and Forecast, By Based On Sports Type, 2016-2032
- 3.5.1. Global Generative AI in Sports Market Analysis by Based On Sports Type: Introduction
- 3.5.2. Market Size Absolute $ Opportunity Analysis and Forecast, By Based On Sports Type, 2016-2032
- 3.5.3. Football
- 3.5.4. Tennis
- 3.5.5. Cricket
- 3.5.6. Basketball
- 3.5.7. Hockey
- 3.5.8. Golf
- 3.5.9. Other Sports
- 4. North America Generative AI in Sports Market Analysis, Opportunity and Forecast, 2016-2032
- 4.1. North America Generative AI in Sports Market Analysis, 2016-2021
- 4.2. North America Generative AI in Sports Market Opportunity and Forecast, 2023-2032
- 4.3. North America Generative AI in Sports Market Analysis, Opportunity and Forecast, By Based On Application, 2016-2032
- 4.3.1. North America Generative AI in Sports Market Analysis by Based On Application: Introduction
- 4.3.2. Market Size Absolute $ Opportunity Analysis and Forecast, By Based On Application, 2016-2032
- 4.3.3. Performance Analysis
- 4.3.4. Game Strategies
- 4.3.5. Sports Equipment Design
- 4.3.6. Other Applications
- 4.4. North America Generative AI in Sports Market Analysis, Opportunity and Forecast, By Based On Deployment, 2016-2032
- 4.4.1. North America Generative AI in Sports Market Analysis by Based On Deployment: Introduction
- 4.4.2. Market Size Absolute $ Opportunity Analysis and Forecast, By Based On Deployment, 2016-2032
- 4.4.3. On-premises
- 4.4.4. Cloud-based
- 4.5. North America Generative AI in Sports Market Analysis, Opportunity and Forecast, By Based On Sports Type, 2016-2032
- 4.5.1. North America Generative AI in Sports Market Analysis by Based On Sports Type: Introduction
- 4.5.2. Market Size Absolute $ Opportunity Analysis and Forecast, By Based On Sports Type, 2016-2032
- 4.5.3. Football
- 4.5.4. Tennis
- 4.5.5. Cricket
- 4.5.6. Basketball
- 4.5.7. Hockey
- 4.5.8. Golf
- 4.5.9. Other Sports
- 4.6. North America Generative AI in Sports Market Analysis, Opportunity and Forecast, By Country , 2016-2032
- 4.6.1. North America Generative AI in Sports Market Analysis by Country : Introduction
- 4.6.2. Market Size Absolute $ Opportunity Analysis and Forecast, Country , 2016-2032
- 4.6.2.1. The US
- 4.6.2.2. Canada
- 4.6.2.3. Mexico
- 5. Western Europe Generative AI in Sports Market Analysis, Opportunity and Forecast, 2016-2032
- 5.1. Western Europe Generative AI in Sports Market Analysis, 2016-2021
- 5.2. Western Europe Generative AI in Sports Market Opportunity and Forecast, 2023-2032
- 5.3. Western Europe Generative AI in Sports Market Analysis, Opportunity and Forecast, By Based On Application, 2016-2032
- 5.3.1. Western Europe Generative AI in Sports Market Analysis by Based On Application: Introduction
- 5.3.2. Market Size Absolute $ Opportunity Analysis and Forecast, By Based On Application, 2016-2032
- 5.3.3. Performance Analysis
- 5.3.4. Game Strategies
- 5.3.5. Sports Equipment Design
- 5.3.6. Other Applications
- 5.4. Western Europe Generative AI in Sports Market Analysis, Opportunity and Forecast, By Based On Deployment, 2016-2032
- 5.4.1. Western Europe Generative AI in Sports Market Analysis by Based On Deployment: Introduction
- 5.4.2. Market Size Absolute $ Opportunity Analysis and Forecast, By Based On Deployment, 2016-2032
- 5.4.3. On-premises
- 5.4.4. Cloud-based
- 5.5. Western Europe Generative AI in Sports Market Analysis, Opportunity and Forecast, By Based On Sports Type, 2016-2032
- 5.5.1. Western Europe Generative AI in Sports Market Analysis by Based On Sports Type: Introduction
- 5.5.2. Market Size Absolute $ Opportunity Analysis and Forecast, By Based On Sports Type, 2016-2032
- 5.5.3. Football
- 5.5.4. Tennis
- 5.5.5. Cricket
- 5.5.6. Basketball
- 5.5.7. Hockey
- 5.5.8. Golf
- 5.5.9. Other Sports
- 5.6. Western Europe Generative AI in Sports Market Analysis, Opportunity and Forecast, By Country , 2016-2032
- 5.6.1. Western Europe Generative AI in Sports Market Analysis by Country : Introduction
- 5.6.2. Market Size Absolute $ Opportunity Analysis and Forecast, Country , 2016-2032
- 5.6.2.1. Germany
- 5.6.2.2. France
- 5.6.2.3. The UK
- 5.6.2.4. Spain
- 5.6.2.5. Italy
- 5.6.2.6. Portugal
- 5.6.2.7. Ireland
- 5.6.2.8. Austria
- 5.6.2.9. Switzerland
- 5.6.2.10. Benelux
- 5.6.2.11. Nordic
- 5.6.2.12. Rest of Western Europe
- 6. Eastern Europe Generative AI in Sports Market Analysis, Opportunity and Forecast, 2016-2032
- 6.1. Eastern Europe Generative AI in Sports Market Analysis, 2016-2021
- 6.2. Eastern Europe Generative AI in Sports Market Opportunity and Forecast, 2023-2032
- 6.3. Eastern Europe Generative AI in Sports Market Analysis, Opportunity and Forecast, By Based On Application, 2016-2032
- 6.3.1. Eastern Europe Generative AI in Sports Market Analysis by Based On Application: Introduction
- 6.3.2. Market Size Absolute $ Opportunity Analysis and Forecast, By Based On Application, 2016-2032
- 6.3.3. Performance Analysis
- 6.3.4. Game Strategies
- 6.3.5. Sports Equipment Design
- 6.3.6. Other Applications
- 6.4. Eastern Europe Generative AI in Sports Market Analysis, Opportunity and Forecast, By Based On Deployment, 2016-2032
- 6.4.1. Eastern Europe Generative AI in Sports Market Analysis by Based On Deployment: Introduction
- 6.4.2. Market Size Absolute $ Opportunity Analysis and Forecast, By Based On Deployment, 2016-2032
- 6.4.3. On-premises
- 6.4.4. Cloud-based
- 6.5. Eastern Europe Generative AI in Sports Market Analysis, Opportunity and Forecast, By Based On Sports Type, 2016-2032
- 6.5.1. Eastern Europe Generative AI in Sports Market Analysis by Based On Sports Type: Introduction
- 6.5.2. Market Size Absolute $ Opportunity Analysis and Forecast, By Based On Sports Type, 2016-2032
- 6.5.3. Football
- 6.5.4. Tennis
- 6.5.5. Cricket
- 6.5.6. Basketball
- 6.5.7. Hockey
- 6.5.8. Golf
- 6.5.9. Other Sports
- 6.6. Eastern Europe Generative AI in Sports Market Analysis, Opportunity and Forecast, By Country , 2016-2032
- 6.6.1. Eastern Europe Generative AI in Sports Market Analysis by Country : Introduction
- 6.6.2. Market Size Absolute $ Opportunity Analysis and Forecast, Country , 2016-2032
- 6.6.2.1. Russia
- 6.6.2.2. Poland
- 6.6.2.3. The Czech Republic
- 6.6.2.4. Greece
- 6.6.2.5. Rest of Eastern Europe
- 7. APAC Generative AI in Sports Market Analysis, Opportunity and Forecast, 2016-2032
- 7.1. APAC Generative AI in Sports Market Analysis, 2016-2021
- 7.2. APAC Generative AI in Sports Market Opportunity and Forecast, 2023-2032
- 7.3. APAC Generative AI in Sports Market Analysis, Opportunity and Forecast, By Based On Application, 2016-2032
- 7.3.1. APAC Generative AI in Sports Market Analysis by Based On Application: Introduction
- 7.3.2. Market Size Absolute $ Opportunity Analysis and Forecast, By Based On Application, 2016-2032
- 7.3.3. Performance Analysis
- 7.3.4. Game Strategies
- 7.3.5. Sports Equipment Design
- 7.3.6. Other Applications
- 7.4. APAC Generative AI in Sports Market Analysis, Opportunity and Forecast, By Based On Deployment, 2016-2032
- 7.4.1. APAC Generative AI in Sports Market Analysis by Based On Deployment: Introduction
- 7.4.2. Market Size Absolute $ Opportunity Analysis and Forecast, By Based On Deployment, 2016-2032
- 7.4.3. On-premises
- 7.4.4. Cloud-based
- 7.5. APAC Generative AI in Sports Market Analysis, Opportunity and Forecast, By Based On Sports Type, 2016-2032
- 7.5.1. APAC Generative AI in Sports Market Analysis by Based On Sports Type: Introduction
- 7.5.2. Market Size Absolute $ Opportunity Analysis and Forecast, By Based On Sports Type, 2016-2032
- 7.5.3. Football
- 7.5.4. Tennis
- 7.5.5. Cricket
- 7.5.6. Basketball
- 7.5.7. Hockey
- 7.5.8. Golf
- 7.5.9. Other Sports
- 7.6. APAC Generative AI in Sports Market Analysis, Opportunity and Forecast, By Country , 2016-2032
- 7.6.1. APAC Generative AI in Sports Market Analysis by Country : Introduction
- 7.6.2. Market Size Absolute $ Opportunity Analysis and Forecast, Country , 2016-2032
- 7.6.2.1. China
- 7.6.2.2. Japan
- 7.6.2.3. South Korea
- 7.6.2.4. India
- 7.6.2.5. Australia & New Zeland
- 7.6.2.6. Indonesia
- 7.6.2.7. Malaysia
- 7.6.2.8. Philippines
- 7.6.2.9. Singapore
- 7.6.2.10. Thailand
- 7.6.2.11. Vietnam
- 7.6.2.12. Rest of APAC
- 8. Latin America Generative AI in Sports Market Analysis, Opportunity and Forecast, 2016-2032
- 8.1. Latin America Generative AI in Sports Market Analysis, 2016-2021
- 8.2. Latin America Generative AI in Sports Market Opportunity and Forecast, 2023-2032
- 8.3. Latin America Generative AI in Sports Market Analysis, Opportunity and Forecast, By Based On Application, 2016-2032
- 8.3.1. Latin America Generative AI in Sports Market Analysis by Based On Application: Introduction
- 8.3.2. Market Size Absolute $ Opportunity Analysis and Forecast, By Based On Application, 2016-2032
- 8.3.3. Performance Analysis
- 8.3.4. Game Strategies
- 8.3.5. Sports Equipment Design
- 8.3.6. Other Applications
- 8.4. Latin America Generative AI in Sports Market Analysis, Opportunity and Forecast, By Based On Deployment, 2016-2032
- 8.4.1. Latin America Generative AI in Sports Market Analysis by Based On Deployment: Introduction
- 8.4.2. Market Size Absolute $ Opportunity Analysis and Forecast, By Based On Deployment, 2016-2032
- 8.4.3. On-premises
- 8.4.4. Cloud-based
- 8.5. Latin America Generative AI in Sports Market Analysis, Opportunity and Forecast, By Based On Sports Type, 2016-2032
- 8.5.1. Latin America Generative AI in Sports Market Analysis by Based On Sports Type: Introduction
- 8.5.2. Market Size Absolute $ Opportunity Analysis and Forecast, By Based On Sports Type, 2016-2032
- 8.5.3. Football
- 8.5.4. Tennis
- 8.5.5. Cricket
- 8.5.6. Basketball
- 8.5.7. Hockey
- 8.5.8. Golf
- 8.5.9. Other Sports
- 8.6. Latin America Generative AI in Sports Market Analysis, Opportunity and Forecast, By Country , 2016-2032
- 8.6.1. Latin America Generative AI in Sports Market Analysis by Country : Introduction
- 8.6.2. Market Size Absolute $ Opportunity Analysis and Forecast, Country , 2016-2032
- 8.6.2.1. Brazil
- 8.6.2.2. Colombia
- 8.6.2.3. Chile
- 8.6.2.4. Argentina
- 8.6.2.5. Costa Rica
- 8.6.2.6. Rest of Latin America
- 9. Middle East & Africa Generative AI in Sports Market Analysis, Opportunity and Forecast, 2016-2032
- 9.1. Middle East & Africa Generative AI in Sports Market Analysis, 2016-2021
- 9.2. Middle East & Africa Generative AI in Sports Market Opportunity and Forecast, 2023-2032
- 9.3. Middle East & Africa Generative AI in Sports Market Analysis, Opportunity and Forecast, By Based On Application, 2016-2032
- 9.3.1. Middle East & Africa Generative AI in Sports Market Analysis by Based On Application: Introduction
- 9.3.2. Market Size Absolute $ Opportunity Analysis and Forecast, By Based On Application, 2016-2032
- 9.3.3. Performance Analysis
- 9.3.4. Game Strategies
- 9.3.5. Sports Equipment Design
- 9.3.6. Other Applications
- 9.4. Middle East & Africa Generative AI in Sports Market Analysis, Opportunity and Forecast, By Based On Deployment, 2016-2032
- 9.4.1. Middle East & Africa Generative AI in Sports Market Analysis by Based On Deployment: Introduction
- 9.4.2. Market Size Absolute $ Opportunity Analysis and Forecast, By Based On Deployment, 2016-2032
- 9.4.3. On-premises
- 9.4.4. Cloud-based
- 9.5. Middle East & Africa Generative AI in Sports Market Analysis, Opportunity and Forecast, By Based On Sports Type, 2016-2032
- 9.5.1. Middle East & Africa Generative AI in Sports Market Analysis by Based On Sports Type: Introduction
- 9.5.2. Market Size Absolute $ Opportunity Analysis and Forecast, By Based On Sports Type, 2016-2032
- 9.5.3. Football
- 9.5.4. Tennis
- 9.5.5. Cricket
- 9.5.6. Basketball
- 9.5.7. Hockey
- 9.5.8. Golf
- 9.5.9. Other Sports
- 9.6. Middle East & Africa Generative AI in Sports Market Analysis, Opportunity and Forecast, By Country , 2016-2032
- 9.6.1. Middle East & Africa Generative AI in Sports Market Analysis by Country : Introduction
- 9.6.2. Market Size Absolute $ Opportunity Analysis and Forecast, Country , 2016-2032
- 9.6.2.1. Algeria
- 9.6.2.2. Egypt
- 9.6.2.3. Israel
- 9.6.2.4. Kuwait
- 9.6.2.5. Nigeria
- 9.6.2.6. Saudi Arabia
- 9.6.2.7. South Africa
- 9.6.2.8. Turkey
- 9.6.2.9. The UAE
- 9.6.2.10. Rest of MEA
- 10. Global Generative AI in Sports Market Analysis, Opportunity and Forecast, By Region , 2016-2032
- 10.1. Global Generative AI in Sports Market Analysis by Region : Introduction
- 10.2. Market Size Absolute $ Opportunity Analysis and Forecast, By Region , 2016-2032
- 10.2.1. North America
- 10.2.2. Western Europe
- 10.2.3. Eastern Europe
- 10.2.4. APAC
- 10.2.5. Latin America
- 10.2.6. Middle East & Africa
- 11. Global Generative AI in Sports Market Competitive Landscape, Market Share Analysis, and Company Profiles
- 11.1. Market Share Analysis
- 11.2. Company Profiles
- 11.3. State Perform Group Ltd.
- 11.3.1. Company Overview
- 11.3.2. Financial Highlights
- 11.3.3. Product Portfolio
- 11.3.4. SWOT Analysis
- 11.3.5. Key Strategies and Developments
- 11.4. Zebra Technologies Corporation
- 11.4.1. Company Overview
- 11.4.2. Financial Highlights
- 11.4.3. Product Portfolio
- 11.4.4. SWOT Analysis
- 11.4.5. Key Strategies and Developments
- 11.5. Catapult Group International Ltd.
- 11.5.1. Company Overview
- 11.5.2. Financial Highlights
- 11.5.3. Product Portfolio
- 11.5.4. SWOT Analysis
- 11.5.5. Key Strategies and Developments
- 11.6. Intel Corporation
- 11.6.1. Company Overview
- 11.6.2. Financial Highlights
- 11.6.3. Product Portfolio
- 11.6.4. SWOT Analysis
- 11.6.5. Key Strategies and Developments
- 11.7. IBM Corporation
- 11.7.1. Company Overview
- 11.7.2. Financial Highlights
- 11.7.3. Product Portfolio
- 11.7.4. SWOT Analysis
- 11.7.5. Key Strategies and Developments
- 11.8. Second Spectrum, Inc.
- 11.8.1. Company Overview
- 11.8.2. Financial Highlights
- 11.8.3. Product Portfolio
- 11.8.4. SWOT Analysis
- 11.8.5. Key Strategies and Developments
- 11.9. ShotTracker, Inc.
- 11.9.1. Company Overview
- 11.9.2. Financial Highlights
- 11.9.3. Product Portfolio
- 11.9.4. SWOT Analysis
- 11.9.5. Key Strategies and Developments
- 11.10. Other Key Players
- 11.10.1. Company Overview
- 11.10.2. Financial Highlights
- 11.10.3. Product Portfolio
- 11.10.4. SWOT Analysis
- 11.10.5. Key Strategies and Developments
- 12. Assumptions and Acronyms
- 13. Research Methodology
- 14. Contact
List of Figures
- Figure 1: Global Generative AI in Sports Market Revenue (US$ Mn) Market Share by Based On Application in 2022
- Figure 2: Global Generative AI in Sports Market Attractiveness Analysis by Based On Application, 2016-2032
- Figure 3: Global Generative AI in Sports Market Revenue (US$ Mn) Market Share by Based On Deploymentin 2022
- Figure 4: Global Generative AI in Sports Market Attractiveness Analysis by Based On Deployment, 2016-2032
- Figure 5: Global Generative AI in Sports Market Revenue (US$ Mn) Market Share by Based On Sports Typein 2022
- Figure 6: Global Generative AI in Sports Market Attractiveness Analysis by Based On Sports Type, 2016-2032
- Figure 7: Global Generative AI in Sports Market Revenue (US$ Mn) Market Share by Region in 2022
- Figure 8: Global Generative AI in Sports Market Attractiveness Analysis by Region, 2016-2032
- Figure 9: Global Generative AI in Sports Market Revenue (US$ Mn) (2016-2032)
- Figure 10: Global Generative AI in Sports Market Revenue (US$ Mn) Comparison by Region (2016-2032)
- Figure 11: Global Generative AI in Sports Market Revenue (US$ Mn) Comparison by Based On Application (2016-2032)
- Figure 12: Global Generative AI in Sports Market Revenue (US$ Mn) Comparison by Based On Deployment (2016-2032)
- Figure 13: Global Generative AI in Sports Market Revenue (US$ Mn) Comparison by Based On Sports Type (2016-2032)
- Figure 14: Global Generative AI in Sports Market Y-o-Y Growth Rate Comparison by Region (2016-2032)
- Figure 15: Global Generative AI in Sports Market Y-o-Y Growth Rate Comparison by Based On Application (2016-2032)
- Figure 16: Global Generative AI in Sports Market Y-o-Y Growth Rate Comparison by Based On Deployment (2016-2032)
- Figure 17: Global Generative AI in Sports Market Y-o-Y Growth Rate Comparison by Based On Sports Type (2016-2032)
- Figure 18: Global Generative AI in Sports Market Share Comparison by Region (2016-2032)
- Figure 19: Global Generative AI in Sports Market Share Comparison by Based On Application (2016-2032)
- Figure 20: Global Generative AI in Sports Market Share Comparison by Based On Deployment (2016-2032)
- Figure 21: Global Generative AI in Sports Market Share Comparison by Based On Sports Type (2016-2032)
- Figure 22: North America Generative AI in Sports Market Revenue (US$ Mn) Market Share by Based On Applicationin 2022
- Figure 23: North America Generative AI in Sports Market Attractiveness Analysis by Based On Application, 2016-2032
- Figure 24: North America Generative AI in Sports Market Revenue (US$ Mn) Market Share by Based On Deploymentin 2022
- Figure 25: North America Generative AI in Sports Market Attractiveness Analysis by Based On Deployment, 2016-2032
- Figure 26: North America Generative AI in Sports Market Revenue (US$ Mn) Market Share by Based On Sports Typein 2022
- Figure 27: North America Generative AI in Sports Market Attractiveness Analysis by Based On Sports Type, 2016-2032
- Figure 28: North America Generative AI in Sports Market Revenue (US$ Mn) Market Share by Country in 2022
- Figure 29: North America Generative AI in Sports Market Attractiveness Analysis by Country, 2016-2032
- Figure 30: North America Generative AI in Sports Market Revenue (US$ Mn) (2016-2032)
- Figure 31: North America Generative AI in Sports Market Revenue (US$ Mn) Comparison by Country (2016-2032)
- Figure 32: North America Generative AI in Sports Market Revenue (US$ Mn) Comparison by Based On Application (2016-2032)
- Figure 33: North America Generative AI in Sports Market Revenue (US$ Mn) Comparison by Based On Deployment (2016-2032)
- Figure 34: North America Generative AI in Sports Market Revenue (US$ Mn) Comparison by Based On Sports Type (2016-2032)
- Figure 35: North America Generative AI in Sports Market Y-o-Y Growth Rate Comparison by Country (2016-2032)
- Figure 36: North America Generative AI in Sports Market Y-o-Y Growth Rate Comparison by Based On Application (2016-2032)
- Figure 37: North America Generative AI in Sports Market Y-o-Y Growth Rate Comparison by Based On Deployment (2016-2032)
- Figure 38: North America Generative AI in Sports Market Y-o-Y Growth Rate Comparison by Based On Sports Type (2016-2032)
- Figure 39: North America Generative AI in Sports Market Share Comparison by Country (2016-2032)
- Figure 40: North America Generative AI in Sports Market Share Comparison by Based On Application (2016-2032)
- Figure 41: North America Generative AI in Sports Market Share Comparison by Based On Deployment (2016-2032)
- Figure 42: North America Generative AI in Sports Market Share Comparison by Based On Sports Type (2016-2032)
- Figure 43: Western Europe Generative AI in Sports Market Revenue (US$ Mn) Market Share by Based On Applicationin 2022
- Figure 44: Western Europe Generative AI in Sports Market Attractiveness Analysis by Based On Application, 2016-2032
- Figure 45: Western Europe Generative AI in Sports Market Revenue (US$ Mn) Market Share by Based On Deploymentin 2022
- Figure 46: Western Europe Generative AI in Sports Market Attractiveness Analysis by Based On Deployment, 2016-2032
- Figure 47: Western Europe Generative AI in Sports Market Revenue (US$ Mn) Market Share by Based On Sports Typein 2022
- Figure 48: Western Europe Generative AI in Sports Market Attractiveness Analysis by Based On Sports Type, 2016-2032
- Figure 49: Western Europe Generative AI in Sports Market Revenue (US$ Mn) Market Share by Country in 2022
- Figure 50: Western Europe Generative AI in Sports Market Attractiveness Analysis by Country, 2016-2032
- Figure 51: Western Europe Generative AI in Sports Market Revenue (US$ Mn) (2016-2032)
- Figure 52: Western Europe Generative AI in Sports Market Revenue (US$ Mn) Comparison by Country (2016-2032)
- Figure 53: Western Europe Generative AI in Sports Market Revenue (US$ Mn) Comparison by Based On Application (2016-2032)
- Figure 54: Western Europe Generative AI in Sports Market Revenue (US$ Mn) Comparison by Based On Deployment (2016-2032)
- Figure 55: Western Europe Generative AI in Sports Market Revenue (US$ Mn) Comparison by Based On Sports Type (2016-2032)
- Figure 56: Western Europe Generative AI in Sports Market Y-o-Y Growth Rate Comparison by Country (2016-2032)
- Figure 57: Western Europe Generative AI in Sports Market Y-o-Y Growth Rate Comparison by Based On Application (2016-2032)
- Figure 58: Western Europe Generative AI in Sports Market Y-o-Y Growth Rate Comparison by Based On Deployment (2016-2032)
- Figure 59: Western Europe Generative AI in Sports Market Y-o-Y Growth Rate Comparison by Based On Sports Type (2016-2032)
- Figure 60: Western Europe Generative AI in Sports Market Share Comparison by Country (2016-2032)
- Figure 61: Western Europe Generative AI in Sports Market Share Comparison by Based On Application (2016-2032)
- Figure 62: Western Europe Generative AI in Sports Market Share Comparison by Based On Deployment (2016-2032)
- Figure 63: Western Europe Generative AI in Sports Market Share Comparison by Based On Sports Type (2016-2032)
- Figure 64: Eastern Europe Generative AI in Sports Market Revenue (US$ Mn) Market Share by Based On Applicationin 2022
- Figure 65: Eastern Europe Generative AI in Sports Market Attractiveness Analysis by Based On Application, 2016-2032
- Figure 66: Eastern Europe Generative AI in Sports Market Revenue (US$ Mn) Market Share by Based On Deploymentin 2022
- Figure 67: Eastern Europe Generative AI in Sports Market Attractiveness Analysis by Based On Deployment, 2016-2032
- Figure 68: Eastern Europe Generative AI in Sports Market Revenue (US$ Mn) Market Share by Based On Sports Typein 2022
- Figure 69: Eastern Europe Generative AI in Sports Market Attractiveness Analysis by Based On Sports Type, 2016-2032
- Figure 70: Eastern Europe Generative AI in Sports Market Revenue (US$ Mn) Market Share by Country in 2022
- Figure 71: Eastern Europe Generative AI in Sports Market Attractiveness Analysis by Country, 2016-2032
- Figure 72: Eastern Europe Generative AI in Sports Market Revenue (US$ Mn) (2016-2032)
- Figure 73: Eastern Europe Generative AI in Sports Market Revenue (US$ Mn) Comparison by Country (2016-2032)
- Figure 74: Eastern Europe Generative AI in Sports Market Revenue (US$ Mn) Comparison by Based On Application (2016-2032)
- Figure 75: Eastern Europe Generative AI in Sports Market Revenue (US$ Mn) Comparison by Based On Deployment (2016-2032)
- Figure 76: Eastern Europe Generative AI in Sports Market Revenue (US$ Mn) Comparison by Based On Sports Type (2016-2032)
- Figure 77: Eastern Europe Generative AI in Sports Market Y-o-Y Growth Rate Comparison by Country (2016-2032)
- Figure 78: Eastern Europe Generative AI in Sports Market Y-o-Y Growth Rate Comparison by Based On Application (2016-2032)
- Figure 79: Eastern Europe Generative AI in Sports Market Y-o-Y Growth Rate Comparison by Based On Deployment (2016-2032)
- Figure 80: Eastern Europe Generative AI in Sports Market Y-o-Y Growth Rate Comparison by Based On Sports Type (2016-2032)
- Figure 81: Eastern Europe Generative AI in Sports Market Share Comparison by Country (2016-2032)
- Figure 82: Eastern Europe Generative AI in Sports Market Share Comparison by Based On Application (2016-2032)
- Figure 83: Eastern Europe Generative AI in Sports Market Share Comparison by Based On Deployment (2016-2032)
- Figure 84: Eastern Europe Generative AI in Sports Market Share Comparison by Based On Sports Type (2016-2032)
- Figure 85: APAC Generative AI in Sports Market Revenue (US$ Mn) Market Share by Based On Applicationin 2022
- Figure 86: APAC Generative AI in Sports Market Attractiveness Analysis by Based On Application, 2016-2032
- Figure 87: APAC Generative AI in Sports Market Revenue (US$ Mn) Market Share by Based On Deploymentin 2022
- Figure 88: APAC Generative AI in Sports Market Attractiveness Analysis by Based On Deployment, 2016-2032
- Figure 89: APAC Generative AI in Sports Market Revenue (US$ Mn) Market Share by Based On Sports Typein 2022
- Figure 90: APAC Generative AI in Sports Market Attractiveness Analysis by Based On Sports Type, 2016-2032
- Figure 91: APAC Generative AI in Sports Market Revenue (US$ Mn) Market Share by Country in 2022
- Figure 92: APAC Generative AI in Sports Market Attractiveness Analysis by Country, 2016-2032
- Figure 93: APAC Generative AI in Sports Market Revenue (US$ Mn) (2016-2032)
- Figure 94: APAC Generative AI in Sports Market Revenue (US$ Mn) Comparison by Country (2016-2032)
- Figure 95: APAC Generative AI in Sports Market Revenue (US$ Mn) Comparison by Based On Application (2016-2032)
- Figure 96: APAC Generative AI in Sports Market Revenue (US$ Mn) Comparison by Based On Deployment (2016-2032)
- Figure 97: APAC Generative AI in Sports Market Revenue (US$ Mn) Comparison by Based On Sports Type (2016-2032)
- Figure 98: APAC Generative AI in Sports Market Y-o-Y Growth Rate Comparison by Country (2016-2032)
- Figure 99: APAC Generative AI in Sports Market Y-o-Y Growth Rate Comparison by Based On Application (2016-2032)
- Figure 100: APAC Generative AI in Sports Market Y-o-Y Growth Rate Comparison by Based On Deployment (2016-2032)
- Figure 101: APAC Generative AI in Sports Market Y-o-Y Growth Rate Comparison by Based On Sports Type (2016-2032)
- Figure 102: APAC Generative AI in Sports Market Share Comparison by Country (2016-2032)
- Figure 103: APAC Generative AI in Sports Market Share Comparison by Based On Application (2016-2032)
- Figure 104: APAC Generative AI in Sports Market Share Comparison by Based On Deployment (2016-2032)
- Figure 105: APAC Generative AI in Sports Market Share Comparison by Based On Sports Type (2016-2032)
- Figure 106: Latin America Generative AI in Sports Market Revenue (US$ Mn) Market Share by Based On Applicationin 2022
- Figure 107: Latin America Generative AI in Sports Market Attractiveness Analysis by Based On Application, 2016-2032
- Figure 108: Latin America Generative AI in Sports Market Revenue (US$ Mn) Market Share by Based On Deploymentin 2022
- Figure 109: Latin America Generative AI in Sports Market Attractiveness Analysis by Based On Deployment, 2016-2032
- Figure 110: Latin America Generative AI in Sports Market Revenue (US$ Mn) Market Share by Based On Sports Typein 2022
- Figure 111: Latin America Generative AI in Sports Market Attractiveness Analysis by Based On Sports Type, 2016-2032
- Figure 112: Latin America Generative AI in Sports Market Revenue (US$ Mn) Market Share by Country in 2022
- Figure 113: Latin America Generative AI in Sports Market Attractiveness Analysis by Country, 2016-2032
- Figure 114: Latin America Generative AI in Sports Market Revenue (US$ Mn) (2016-2032)
- Figure 115: Latin America Generative AI in Sports Market Revenue (US$ Mn) Comparison by Country (2016-2032)
- Figure 116: Latin America Generative AI in Sports Market Revenue (US$ Mn) Comparison by Based On Application (2016-2032)
- Figure 117: Latin America Generative AI in Sports Market Revenue (US$ Mn) Comparison by Based On Deployment (2016-2032)
- Figure 118: Latin America Generative AI in Sports Market Revenue (US$ Mn) Comparison by Based On Sports Type (2016-2032)
- Figure 119: Latin America Generative AI in Sports Market Y-o-Y Growth Rate Comparison by Country (2016-2032)
- Figure 120: Latin America Generative AI in Sports Market Y-o-Y Growth Rate Comparison by Based On Application (2016-2032)
- Figure 121: Latin America Generative AI in Sports Market Y-o-Y Growth Rate Comparison by Based On Deployment (2016-2032)
- Figure 122: Latin America Generative AI in Sports Market Y-o-Y Growth Rate Comparison by Based On Sports Type (2016-2032)
- Figure 123: Latin America Generative AI in Sports Market Share Comparison by Country (2016-2032)
- Figure 124: Latin America Generative AI in Sports Market Share Comparison by Based On Application (2016-2032)
- Figure 125: Latin America Generative AI in Sports Market Share Comparison by Based On Deployment (2016-2032)
- Figure 126: Latin America Generative AI in Sports Market Share Comparison by Based On Sports Type (2016-2032)
- Figure 127: Middle East & Africa Generative AI in Sports Market Revenue (US$ Mn) Market Share by Based On Applicationin 2022
- Figure 128: Middle East & Africa Generative AI in Sports Market Attractiveness Analysis by Based On Application, 2016-2032
- Figure 129: Middle East & Africa Generative AI in Sports Market Revenue (US$ Mn) Market Share by Based On Deploymentin 2022
- Figure 130: Middle East & Africa Generative AI in Sports Market Attractiveness Analysis by Based On Deployment, 2016-2032
- Figure 131: Middle East & Africa Generative AI in Sports Market Revenue (US$ Mn) Market Share by Based On Sports Typein 2022
- Figure 132: Middle East & Africa Generative AI in Sports Market Attractiveness Analysis by Based On Sports Type, 2016-2032
- Figure 133: Middle East & Africa Generative AI in Sports Market Revenue (US$ Mn) Market Share by Country in 2022
- Figure 134: Middle East & Africa Generative AI in Sports Market Attractiveness Analysis by Country, 2016-2032
- Figure 135: Middle East & Africa Generative AI in Sports Market Revenue (US$ Mn) (2016-2032)
- Figure 136: Middle East & Africa Generative AI in Sports Market Revenue (US$ Mn) Comparison by Country (2016-2032)
- Figure 137: Middle East & Africa Generative AI in Sports Market Revenue (US$ Mn) Comparison by Based On Application (2016-2032)
- Figure 138: Middle East & Africa Generative AI in Sports Market Revenue (US$ Mn) Comparison by Based On Deployment (2016-2032)
- Figure 139: Middle East & Africa Generative AI in Sports Market Revenue (US$ Mn) Comparison by Based On Sports Type (2016-2032)
- Figure 140: Middle East & Africa Generative AI in Sports Market Y-o-Y Growth Rate Comparison by Country (2016-2032)
- Figure 141: Middle East & Africa Generative AI in Sports Market Y-o-Y Growth Rate Comparison by Based On Application (2016-2032)
- Figure 142: Middle East & Africa Generative AI in Sports Market Y-o-Y Growth Rate Comparison by Based On Deployment (2016-2032)
- Figure 143: Middle East & Africa Generative AI in Sports Market Y-o-Y Growth Rate Comparison by Based On Sports Type (2016-2032)
- Figure 144: Middle East & Africa Generative AI in Sports Market Share Comparison by Country (2016-2032)
- Figure 145: Middle East & Africa Generative AI in Sports Market Share Comparison by Based On Application (2016-2032)
- Figure 146: Middle East & Africa Generative AI in Sports Market Share Comparison by Based On Deployment (2016-2032)
- Figure 147: Middle East & Africa Generative AI in Sports Market Share Comparison by Based On Sports Type (2016-2032)
List of Tables
- Table 1: Global Generative AI in Sports Market Comparison by Based On Application (2016-2032)
- Table 2: Global Generative AI in Sports Market Comparison by Based On Deployment (2016-2032)
- Table 3: Global Generative AI in Sports Market Comparison by Based On Sports Type (2016-2032)
- Table 4: Global Generative AI in Sports Market Revenue (US$ Mn) Comparison by Region (2016-2032)
- Table 5: Global Generative AI in Sports Market Revenue (US$ Mn) (2016-2032)
- Table 6: Global Generative AI in Sports Market Revenue (US$ Mn) Comparison by Region (2016-2032)
- Table 7: Global Generative AI in Sports Market Revenue (US$ Mn) Comparison by Based On Application (2016-2032)
- Table 8: Global Generative AI in Sports Market Revenue (US$ Mn) Comparison by Based On Deployment (2016-2032)
- Table 9: Global Generative AI in Sports Market Revenue (US$ Mn) Comparison by Based On Sports Type (2016-2032)
- Table 10: Global Generative AI in Sports Market Y-o-Y Growth Rate Comparison by Region (2016-2032)
- Table 11: Global Generative AI in Sports Market Y-o-Y Growth Rate Comparison by Based On Application (2016-2032)
- Table 12: Global Generative AI in Sports Market Y-o-Y Growth Rate Comparison by Based On Deployment (2016-2032)
- Table 13: Global Generative AI in Sports Market Y-o-Y Growth Rate Comparison by Based On Sports Type (2016-2032)
- Table 14: Global Generative AI in Sports Market Share Comparison by Region (2016-2032)
- Table 15: Global Generative AI in Sports Market Share Comparison by Based On Application (2016-2032)
- Table 16: Global Generative AI in Sports Market Share Comparison by Based On Deployment (2016-2032)
- Table 17: Global Generative AI in Sports Market Share Comparison by Based On Sports Type (2016-2032)
- Table 18: North America Generative AI in Sports Market Comparison by Based On Deployment (2016-2032)
- Table 19: North America Generative AI in Sports Market Comparison by Based On Sports Type (2016-2032)
- Table 20: North America Generative AI in Sports Market Revenue (US$ Mn) Comparison by Country (2016-2032)
- Table 21: North America Generative AI in Sports Market Revenue (US$ Mn) (2016-2032)
- Table 22: North America Generative AI in Sports Market Revenue (US$ Mn) Comparison by Country (2016-2032)
- Table 23: North America Generative AI in Sports Market Revenue (US$ Mn) Comparison by Based On Application (2016-2032)
- Table 24: North America Generative AI in Sports Market Revenue (US$ Mn) Comparison by Based On Deployment (2016-2032)
- Table 25: North America Generative AI in Sports Market Revenue (US$ Mn) Comparison by Based On Sports Type (2016-2032)
- Table 26: North America Generative AI in Sports Market Y-o-Y Growth Rate Comparison by Country (2016-2032)
- Table 27: North America Generative AI in Sports Market Y-o-Y Growth Rate Comparison by Based On Application (2016-2032)
- Table 28: North America Generative AI in Sports Market Y-o-Y Growth Rate Comparison by Based On Deployment (2016-2032)
- Table 29: North America Generative AI in Sports Market Y-o-Y Growth Rate Comparison by Based On Sports Type (2016-2032)
- Table 30: North America Generative AI in Sports Market Share Comparison by Country (2016-2032)
- Table 31: North America Generative AI in Sports Market Share Comparison by Based On Application (2016-2032)
- Table 32: North America Generative AI in Sports Market Share Comparison by Based On Deployment (2016-2032)
- Table 33: North America Generative AI in Sports Market Share Comparison by Based On Sports Type (2016-2032)
- Table 34: Western Europe Generative AI in Sports Market Comparison by Based On Application (2016-2032)
- Table 35: Western Europe Generative AI in Sports Market Comparison by Based On Deployment (2016-2032)
- Table 36: Western Europe Generative AI in Sports Market Comparison by Based On Sports Type (2016-2032)
- Table 37: Western Europe Generative AI in Sports Market Revenue (US$ Mn) Comparison by Country (2016-2032)
- Table 38: Western Europe Generative AI in Sports Market Revenue (US$ Mn) (2016-2032)
- Table 39: Western Europe Generative AI in Sports Market Revenue (US$ Mn) Comparison by Country (2016-2032)
- Table 40: Western Europe Generative AI in Sports Market Revenue (US$ Mn) Comparison by Based On Application (2016-2032)
- Table 41: Western Europe Generative AI in Sports Market Revenue (US$ Mn) Comparison by Based On Deployment (2016-2032)
- Table 42: Western Europe Generative AI in Sports Market Revenue (US$ Mn) Comparison by Based On Sports Type (2016-2032)
- Table 43: Western Europe Generative AI in Sports Market Y-o-Y Growth Rate Comparison by Country (2016-2032)
- Table 44: Western Europe Generative AI in Sports Market Y-o-Y Growth Rate Comparison by Based On Application (2016-2032)
- Table 45: Western Europe Generative AI in Sports Market Y-o-Y Growth Rate Comparison by Based On Deployment (2016-2032)
- Table 46: Western Europe Generative AI in Sports Market Y-o-Y Growth Rate Comparison by Based On Sports Type (2016-2032)
- Table 47: Western Europe Generative AI in Sports Market Share Comparison by Country (2016-2032)
- Table 48: Western Europe Generative AI in Sports Market Share Comparison by Based On Application (2016-2032)
- Table 49: Western Europe Generative AI in Sports Market Share Comparison by Based On Deployment (2016-2032)
- Table 50: Western Europe Generative AI in Sports Market Share Comparison by Based On Sports Type (2016-2032)
- Table 51: Eastern Europe Generative AI in Sports Market Comparison by Based On Application (2016-2032)
- Table 52: Eastern Europe Generative AI in Sports Market Comparison by Based On Deployment (2016-2032)
- Table 53: Eastern Europe Generative AI in Sports Market Comparison by Based On Sports Type (2016-2032)
- Table 54: Eastern Europe Generative AI in Sports Market Revenue (US$ Mn) Comparison by Country (2016-2032)
- Table 55: Eastern Europe Generative AI in Sports Market Revenue (US$ Mn) (2016-2032)
- Table 56: Eastern Europe Generative AI in Sports Market Revenue (US$ Mn) Comparison by Country (2016-2032)
- Table 57: Eastern Europe Generative AI in Sports Market Revenue (US$ Mn) Comparison by Based On Application (2016-2032)
- Table 58: Eastern Europe Generative AI in Sports Market Revenue (US$ Mn) Comparison by Based On Deployment (2016-2032)
- Table 59: Eastern Europe Generative AI in Sports Market Revenue (US$ Mn) Comparison by Based On Sports Type (2016-2032)
- Table 60: Eastern Europe Generative AI in Sports Market Y-o-Y Growth Rate Comparison by Country (2016-2032)
- Table 61: Eastern Europe Generative AI in Sports Market Y-o-Y Growth Rate Comparison by Based On Application (2016-2032)
- Table 62: Eastern Europe Generative AI in Sports Market Y-o-Y Growth Rate Comparison by Based On Deployment (2016-2032)
- Table 63: Eastern Europe Generative AI in Sports Market Y-o-Y Growth Rate Comparison by Based On Sports Type (2016-2032)
- Table 64: Eastern Europe Generative AI in Sports Market Share Comparison by Country (2016-2032)
- Table 65: Eastern Europe Generative AI in Sports Market Share Comparison by Based On Application (2016-2032)
- Table 66: Eastern Europe Generative AI in Sports Market Share Comparison by Based On Deployment (2016-2032)
- Table 67: Eastern Europe Generative AI in Sports Market Share Comparison by Based On Sports Type (2016-2032)
- Table 68: APAC Generative AI in Sports Market Comparison by Based On Application (2016-2032)
- Table 69: APAC Generative AI in Sports Market Comparison by Based On Deployment (2016-2032)
- Table 70: APAC Generative AI in Sports Market Comparison by Based On Sports Type (2016-2032)
- Table 71: APAC Generative AI in Sports Market Revenue (US$ Mn) Comparison by Country (2016-2032)
- Table 72: APAC Generative AI in Sports Market Revenue (US$ Mn) (2016-2032)
- Table 73: APAC Generative AI in Sports Market Revenue (US$ Mn) Comparison by Country (2016-2032)
- Table 74: APAC Generative AI in Sports Market Revenue (US$ Mn) Comparison by Based On Application (2016-2032)
- Table 75: APAC Generative AI in Sports Market Revenue (US$ Mn) Comparison by Based On Deployment (2016-2032)
- Table 76: APAC Generative AI in Sports Market Revenue (US$ Mn) Comparison by Based On Sports Type (2016-2032)
- Table 77: APAC Generative AI in Sports Market Y-o-Y Growth Rate Comparison by Country (2016-2032)
- Table 78: APAC Generative AI in Sports Market Y-o-Y Growth Rate Comparison by Based On Application (2016-2032)
- Table 79: APAC Generative AI in Sports Market Y-o-Y Growth Rate Comparison by Based On Deployment (2016-2032)
- Table 80: APAC Generative AI in Sports Market Y-o-Y Growth Rate Comparison by Based On Sports Type (2016-2032)
- Table 81: APAC Generative AI in Sports Market Share Comparison by Country (2016-2032)
- Table 82: APAC Generative AI in Sports Market Share Comparison by Based On Application (2016-2032)
- Table 83: APAC Generative AI in Sports Market Share Comparison by Based On Deployment (2016-2032)
- Table 84: APAC Generative AI in Sports Market Share Comparison by Based On Sports Type (2016-2032)
- Table 85: Latin America Generative AI in Sports Market Comparison by Based On Application (2016-2032)
- Table 86: Latin America Generative AI in Sports Market Comparison by Based On Deployment (2016-2032)
- Table 87: Latin America Generative AI in Sports Market Comparison by Based On Sports Type (2016-2032)
- Table 88: Latin America Generative AI in Sports Market Revenue (US$ Mn) Comparison by Country (2016-2032)
- Table 89: Latin America Generative AI in Sports Market Revenue (US$ Mn) (2016-2032)
- Table 90: Latin America Generative AI in Sports Market Revenue (US$ Mn) Comparison by Country (2016-2032)
- Table 91: Latin America Generative AI in Sports Market Revenue (US$ Mn) Comparison by Based On Application (2016-2032)
- Table 92: Latin America Generative AI in Sports Market Revenue (US$ Mn) Comparison by Based On Deployment (2016-2032)
- Table 93: Latin America Generative AI in Sports Market Revenue (US$ Mn) Comparison by Based On Sports Type (2016-2032)
- Table 94: Latin America Generative AI in Sports Market Y-o-Y Growth Rate Comparison by Country (2016-2032)
- Table 95: Latin America Generative AI in Sports Market Y-o-Y Growth Rate Comparison by Based On Application (2016-2032)
- Table 96: Latin America Generative AI in Sports Market Y-o-Y Growth Rate Comparison by Based On Deployment (2016-2032)
- Table 97: Latin America Generative AI in Sports Market Y-o-Y Growth Rate Comparison by Based On Sports Type (2016-2032)
- Table 98: Latin America Generative AI in Sports Market Share Comparison by Country (2016-2032)
- Table 99: Latin America Generative AI in Sports Market Share Comparison by Based On Application (2016-2032)
- Table 100: Latin America Generative AI in Sports Market Share Comparison by Based On Deployment (2016-2032)
- Table 101: Latin America Generative AI in Sports Market Share Comparison by Based On Sports Type (2016-2032)
- Table 102: Middle East & Africa Generative AI in Sports Market Comparison by Based On Application (2016-2032)
- Table 103: Middle East & Africa Generative AI in Sports Market Comparison by Based On Deployment (2016-2032)
- Table 104: Middle East & Africa Generative AI in Sports Market Comparison by Based On Sports Type (2016-2032)
- Table 105: Middle East & Africa Generative AI in Sports Market Revenue (US$ Mn) Comparison by Country (2016-2032)
- Table 106: Middle East & Africa Generative AI in Sports Market Revenue (US$ Mn) (2016-2032)
- Table 107: Middle East & Africa Generative AI in Sports Market Revenue (US$ Mn) Comparison by Country (2016-2032)
- Table 108: Middle East & Africa Generative AI in Sports Market Revenue (US$ Mn) Comparison by Based On Application (2016-2032)
- Table 109: Middle East & Africa Generative AI in Sports Market Revenue (US$ Mn) Comparison by Based On Deployment (2016-2032)
- Table 110: Middle East & Africa Generative AI in Sports Market Revenue (US$ Mn) Comparison by Based On Sports Type (2016-2032)
- Table 111: Middle East & Africa Generative AI in Sports Market Y-o-Y Growth Rate Comparison by Country (2016-2032)
- Table 112: Middle East & Africa Generative AI in Sports Market Y-o-Y Growth Rate Comparison by Based On Application (2016-2032)
- Table 113: Middle East & Africa Generative AI in Sports Market Y-o-Y Growth Rate Comparison by Based On Deployment (2016-2032)
- Table 114: Middle East & Africa Generative AI in Sports Market Y-o-Y Growth Rate Comparison by Based On Sports Type (2016-2032)
- Table 115: Middle East & Africa Generative AI in Sports Market Share Comparison by Country (2016-2032)
- Table 116: Middle East & Africa Generative AI in Sports Market Share Comparison by Based On Application (2016-2032)
- Table 117: Middle East & Africa Generative AI in Sports Market Share Comparison by Based On Deployment (2016-2032)
- Table 118: Middle East & Africa Generative AI in Sports Market Share Comparison by Based On Sports Type (2016-2032)
- 1. Executive Summary
-
- State Perform Group Ltd.
- Zebra Technologies Corporation
- Catapult Group International Ltd.
- Intel Corporation
- IBM Corporation
- Second Spectrum, Inc.
- ShotTracker, Inc.
- Other Key Players
Our Clients


View Our Licence Options
