
Generative AI in Logistics Market By Component (Solutions and Software), By Deployment Mode (Cloud-Based and On-premises), By End User (Retail, Manufacturing, Healthcare, and Others), By Region and Companies - Industry Segment Outlook, Market Assessment, Competition Scenario, Trends and Forecast 2023-2032
-
37848
-
April 2024
-
285
-


-
This report was compiled by Research Team Research team of over 50 passionate professionals leverages advanced research methodologies and analytical expertise to deliver insightful, data-driven market intelligence that empowers businesses across diverse industries to make strategic, well-informed Correspondence Research Team Linkedin | Detailed Market research Methodology Our methodology involves a mix of primary research, including interviews with leading mental health experts, and secondary research from reputable medical journals and databases. View Detailed Methodology Page
-
Quick Navigation
Report Overview
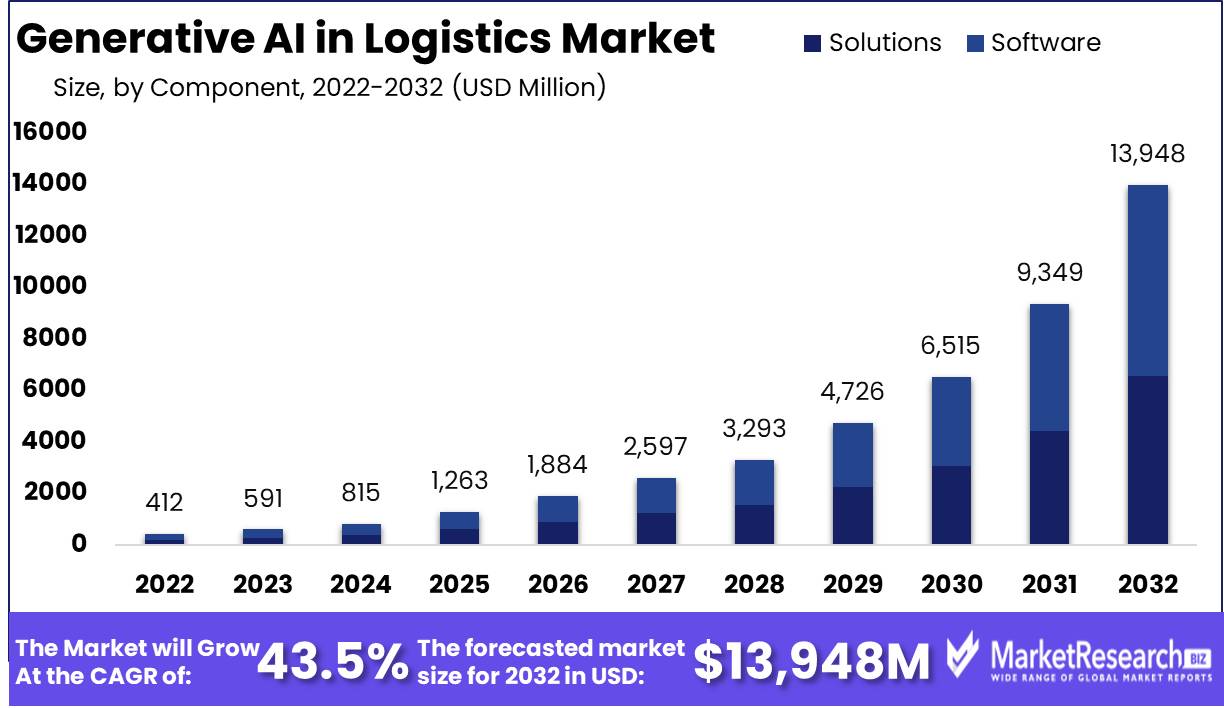
The Global Generative AI in Logistics Market size is expected to be worth around USD 13,948 Mn by 2032 from USD 412 Mn in 2022, growing at a CAGR of 43.5% during the forecast period from 2023 to 2032.
The surge in demand for the new advanced technologies and the rise in supply chain organizations and logistics providers are some of the main driving factors for generative AI in logistics.
Generative AI in logistics is defined as the application of artificial intelligence methods that design and develop data or scenarios relevant to the logistic domain.
Such technology uses generative models like generative adversarial networks and variational autoencoders to generate realistic representations of logistics-related data, including demand patterns, inventory distributions, and route simulations.
By producing synthetic data, generative AI helps in training predictive models by enhancing supply chain operations and creating robust logistics tactics. It simplifies the discovery of hypothetical situations by simplifying risk assessment and decision-making in difficult logistical surroundings.
Moreover, generative AI supports the development of virtual simulations for testing and training logistical skills, reducing real-world experimentation expenses and improving operational efficiency. Generative AI allows logistics experts to harness data-driven insights and acclimate swiftly to transforming conditions and enhanced logistical methods that lead to optimized performance and customer satisfaction in the logistic sector.
According to MSN in March 2024, highlights that by 2028, 25% of all logistics-focused KPI reporting will depend on generative AI. Logistic leaders uses generative AI for logistics in KPI reporting. 14% of supply chain organizations have already implemented or are working to implement generative AI.
An additional 50% of leaders indicated they plan to implement the technology within the next year. There will be more smart robots than frontline workers in manufacturing, retail and logistics. Moreover, 40% of all large warehouse operations will deploy tools to engage their employees. That could help motivate the workforce and may, in turn, drive higher retention rates.
Generative AI in logistics provides several benefits by developing realistic data for predictive modeling, enhancing supply chain operations, and allowing scenarios for risk assessments. It reduces expenses related to real-world experimentation, improves decision-making, and augments operational efficacy, ultimately leading to better performance and customer satisfaction. The demand for generative AI in logistics will increase due to its requirements in supply chain organizations, which will help in market expansion in the coming years.
Key Takeaways
- Market Value: The Generative AI in Logistics Market is projected to reach USD 13,948 million by 2032, with a remarkable CAGR of 43.5% from 2023 to 2032.
- Dominant Segments:
- Component Analysis: Solutions dominate with 53% market share, offering comprehensive software applications and platforms that optimize and automate logistics workflows. Software components play a vital role but focus on specific functions within logistics operations.
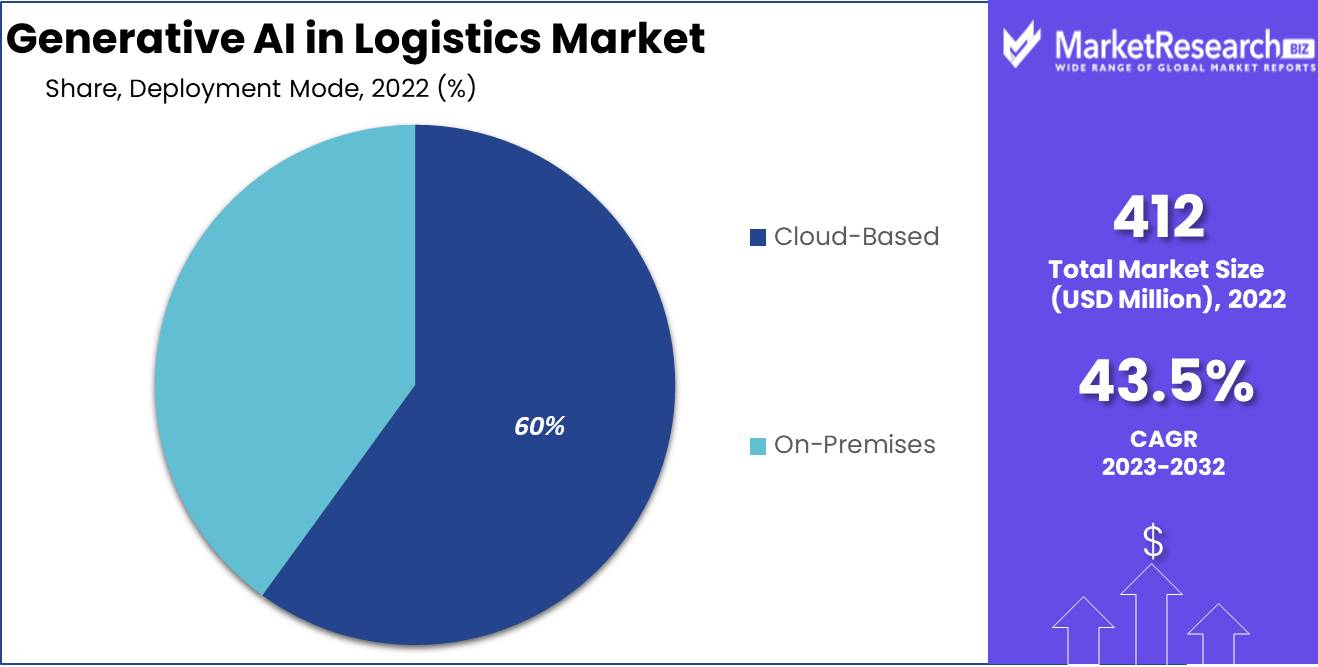
- Deployment Mode Analysis: Cloud-based solutions lead with 60% market share, providing flexibility, scalability, and real-time data sharing capabilities. On-premises solutions remain relevant for organizations prioritizing data control and customization.
- End-User Analysis: The retail sector holds the largest share of 45%, leveraging Generative AI for inventory accuracy, supply chain optimization, and personalized customer experiences. Manufacturing, healthcare, and other sectors also contribute significantly to market growth.
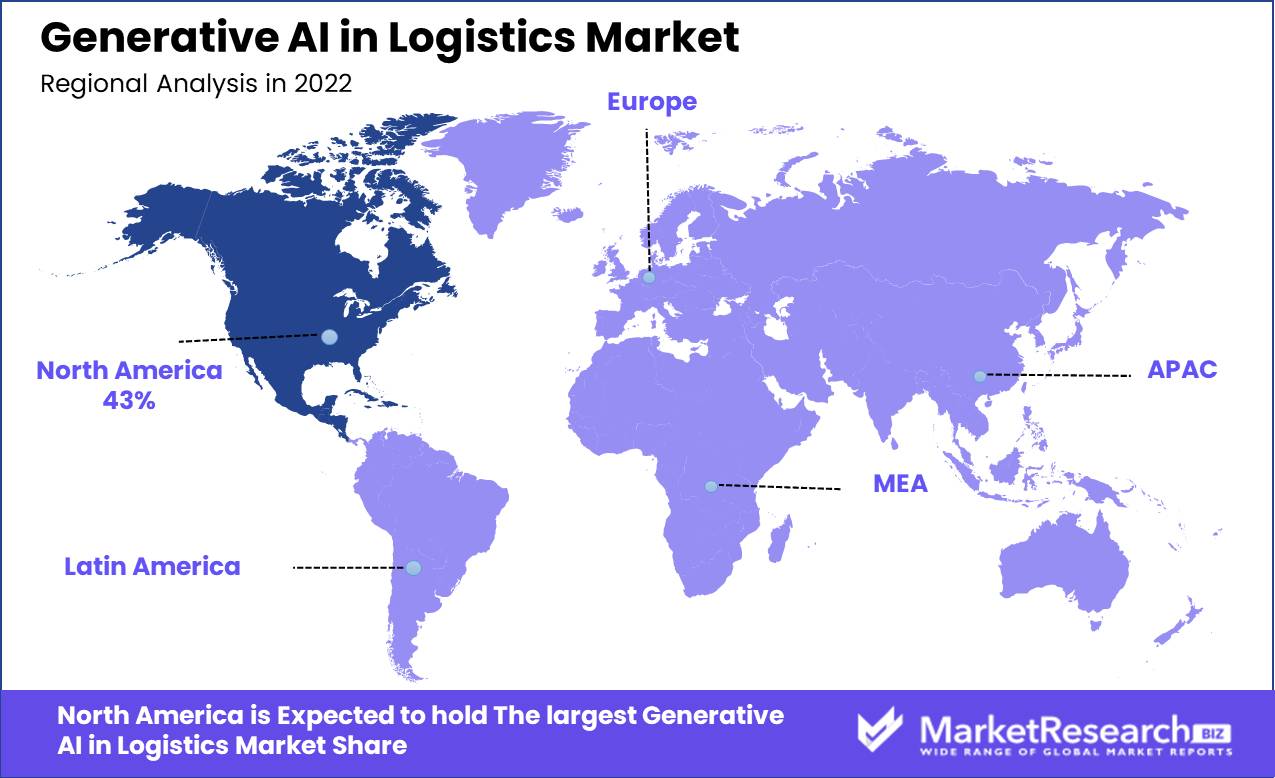
- Regional Dynamics: North America dominates with a 43% market share, driven by advanced logistics infrastructure and the presence of major technology players.
- Key Players: Major players in the Generative AI in Logistics Market include IBM Corporation, Microsoft Corporation, SAP SE, Oracle Corporation, Blue Yonder, LLamasoft Inc, and AIMMS, among others, focusing on providing comprehensive solutions and platforms to meet diverse logistical challenges.
- Analyst Viewpoint: Analysts anticipate substantial growth opportunities in the Generative AI in Logistics Market, driven by increasing demand for AI-driven solutions to optimize logistics operations, improve efficiency, and meet evolving consumer expectations.
- Growth Opportunities: Opportunities for growth lie in further advancements in AI technology, expansion of AI applications across diverse logistics functions, enhancing integration capabilities with existing logistics systems, and catering to the specific needs of various industries such as retail, manufacturing, and healthcare. Additionally, strategic partnerships and investments in research and development can further drive market expansion and innovation.
Driving Factors
Optimization of Supply Chain Operations Drives Market Growth
The integration of Generative AI into logistics operations, as pioneered by NEC in 2023, marks a significant leap towards optimizing supply chain efficiency. Generative AI's core capability to enhance predictive analytics, route optimization, and demand forecasting underpins its pivotal role in redefining logistics management.
This technological advancement allows for the meticulous analysis of extensive datasets, encompassing historical shipping records, weather conditions, and evolving market dynamics. The outcome is a streamlined decision-making process, enabling the identification and exploitation of optimization opportunities. The strategic utilization of AI in logistics not only diminishes transportation costs and curtails delivery times but also bolsters the industry's competitive edge. The consequential benefits are manifold, including heightened operational efficiency and reinforced market positioning.
Enhanced Inventory Management Powers Market Expansion
Generative AI revolutionizes inventory management within the logistics sector through its predictive capabilities, thereby facilitating demand forecasting, inventory optimization, and automated replenishment. By leveraging AI to dissect sales data, identify seasonal patterns, and comprehend consumer behavior, businesses can precisely forecast demand and judiciously manage inventory levels.
Amazon exemplifies the successful application of AI in predicting product demand, enabling the retail giant to maintain optimal stock levels while preventing inventory surplus and minimizing carrying costs. This technological innovation ensures product availability aligns with consumer demand, thus mitigating financial risks associated with excess inventory and elevating the efficiency of supply chain operations.
Automation of Warehousing Operations Catalyzes Industry Growth
The advent of Generative AI in logistics heralds a new era of warehousing operations, characterized by robotic automation, advanced inventory tracking, and streamlined order fulfillment processes. The deployment of AI-driven robotics and automation technologies facilitates a myriad of tasks, including but not limited to picking, packing, and sorting, with unparalleled speed and accuracy. This automation not only slashes labor costs but also significantly enhances operational efficiency.
Companies are at the forefront of this transformation, employing AI-enhanced robots and Automated Guided Vehicles (AGVs) to expedite sorting and order fulfillment, thereby reducing order processing times and improving customer satisfaction. The ripple effects of such innovations are profound, promising reduced human error, improved order accuracy, and faster delivery times, which collectively contribute to the logistics market's growth trajectory.
Restraining Factors
Quality and Reliability Concerns Restrains Market Growth
The deployment of Generative AI in logistics faces significant hurdles due to concerns about the quality and reliability of its applications, akin to the challenges in AI-driven coding. In logistics, this translates into potential inaccuracies in predictive analytics, route optimization, and demand forecasting.
If the AI-generated suggestions are off mark, it could lead to inefficiencies, such as suboptimal routing, inventory mismanagement, and ultimately, decreased customer satisfaction. The integrity and stability of logistic operations might be compromised, necessitating additional oversight and correction measures. This not only increases operational costs but also impacts the trust in AI solutions, making businesses hesitant to adopt such technologies extensively.
Dependency on Training Data and Bias Limits Market Expansion
The effectiveness of Generative AI in logistics heavily relies on the quality and comprehensiveness of the training data, mirroring the constraints observed in AI coding. Biases, errors, or gaps in the data can lead to skewed AI insights and recommendations, adversely affecting logistics operations. For instance, if an AI model for demand forecasting is trained on historical sales data that does not account for unprecedented events like a global pandemic, its predictions may be significantly off target.
This limitation restricts the versatility and applicability of Generative AI across different logistical scenarios and environments. Consequently, the potential for bias and data dependency not only undermines the performance of AI-driven logistics solutions but also curtails their adaptability and effectiveness in addressing diverse logistical challenges.
Component Analysis
Solutions Dominate Generative AI in Logistics Market with 53% Share, Offering Comprehensive Optimization
In the Generative AI in Logistics Market, an analysis of components shows a distinct dominance of solutions, which constitute 53% of the market. This segment primarily encompasses comprehensive software applications and platforms designed to integrate seamlessly into existing logistics workflows, offering end-to-end optimization and automation capabilities.
The prominence of solutions over isolated software components underscores a market preference for holistic, immediately deployable systems that address a wide spectrum of logistical challenges, from inventory management to route optimization. The software sub-segment, while essential, typically represents stand-alone applications or tools that cater to specific aspects of the logistics process. These tools are integral for targeted improvements but do not offer the broad scope of functionality seen in complete solutions.
The dominance of solutions can be attributed to their capacity to provide a unified platform for data analysis, decision-making, and operational execution, thereby reducing complexity and enhancing efficiency across logistics operations. The integration of advanced analytics and AI-driven insights into these solutions allows businesses to preemptively identify and address potential disruptions, optimize resource allocation, and enhance delivery timelines. As logistics becomes increasingly data-driven, the demand for these comprehensive solutions is expected to grow, driven by their ability to leverage big data and AI for strategic advantage.
Conversely, the software sub-segment, though not as predominant, plays a critical role in the ecosystem by providing the technological backbone for the broader solutions. These applications often focus on specific functions such as demand forecasting, warehouse management, or transportation optimization, offering depth in areas where full-scale solutions might provide breadth. As such, they remain vital for organizations seeking to augment their existing systems with advanced AI capabilities or to address niche challenges within their operations.
Deployment Mode Analysis
Cloud-Based Solutions Lead Deployment in Generative AI Logistics Market with 60% Share
The deployment mode analysis of the Generative AI in Logistics Market reveals a strong preference for cloud-based solutions, which account for 60% of the market. This trend underscores the shift towards more flexible, scalable, and cost-effective deployment models in the logistics industry. Cloud-based platforms offer several advantages over traditional on-premises installations, including lower upfront costs, ease of access, and the ability to rapidly scale operations in response to changing business needs. The scalability of cloud solutions is particularly relevant in logistics, where fluctuating demand patterns require agile systems that can adapt quickly without significant additional investment.
The cloud-based segment's dominance is further reinforced by its inherent capability to facilitate real-time data sharing and collaboration across the supply chain. This is crucial for optimizing logistics operations, as it enables immediate adjustments to routing, scheduling, and inventory management based on the latest information. Moreover, the cloud's capacity for integrating with other digital tools and platforms enhances its value proposition, making it the preferred choice for businesses looking to leverage Generative AI within their logistics frameworks.
On-premises solutions, while less prevalent in the current market landscape, continue to hold significance for organizations prioritizing data control, security, and customization. These systems are typically favored by entities with specific regulatory requirements or those with complex, highly specialized logistics operations that necessitate a bespoke approach. Although they require a larger initial investment and ongoing maintenance, on-premises deployments offer a level of customization and control that is sometimes essential for meeting unique business or regulatory requirements.
End-User Analysis
Retail Sector Commands 45% Share in End-User Adoption of Generative AI in Logistics
Within the diverse ecosystem of end users in the Generative AI in Logistics Market, the retail sector emerges as the predominant segment, capturing 45% of the market. This dominance is a testament to the retail industry's complex logistics needs and its rapid adoption of AI-driven solutions to meet these demands.
Retailers leverage Generative AI for a variety of purposes, including enhancing inventory accuracy, optimizing supply chain operations, and personalizing customer experiences. The high volume and variability of retail goods, coupled with the competitive pressure to deliver fast and accurately, drive the demand for advanced AI solutions that can predict consumer behavior, streamline warehouse operations, and optimize delivery routes.
While the retail sector leads in adoption, manufacturing, healthcare, and other end-users also significantly contribute to the market's growth. In manufacturing, Generative AI is utilized to optimize production logistics, manage supply chains, and anticipate maintenance needs, thereby reducing downtime and improving efficiency.
The healthcare sector employs AI to manage medical supplies, predict patient needs, and streamline the delivery of healthcare products, highlighting the versatility and impact of Generative AI across various domains. Each of these sectors, though not as dominant as retail, plays a crucial role in the broader adoption and evolution of Generative AI in logistics, underscoring the technology's adaptability and value across diverse industries.
Key Market Segments
Based on Component
- Solutions
- Software
Based on the Deployment Mode
- Cloud-Based
- On-premises
Based on End Users
- Retail
- Manufacturing
- Healthcare
- Other End-Users
Growth Opportunities
Last-Mile Delivery Optimization Offers Growth Opportunity
The escalating growth of e-commerce and the consequent demand for rapid, efficient delivery services spotlight last-mile delivery optimization as a pivotal growth avenue within the Generative AI in Logistics Market.
Generative AI leverages deep analysis of traffic flows, delivery paths, and consumer inclinations to refine delivery schedules dynamically, ensuring minimal travel distances and expedited delivery timelines. This optimization not only boosts operational efficiency but also significantly enhances customer satisfaction levels. FedEx's implementation of generative AI to refine its last-mile delivery exemplifies this potential, yielding swifter, more dependable deliveries with the added benefit of reduced fuel usage and lower emissions.
Warehouse Automation and Robotics Presents Market Expansion Potential
Amidst the burgeoning e-commerce sector and heightened expectations for swift, accurate deliveries, warehouse automation and robotics emerge as a lucrative growth sector, propelled by generative AI. By applying generative AI, logistics operations can revamp warehouse configurations, automate inventory oversight, and synchronize robotic systems for efficiency in picking, packaging, and sorting tasks.
This technological integration elevates processing capacity, diminishes labor expenses, and curtails error rates, thereby streamlining warehouse operations and accommodating increasing consumer demands. Amazon’s AI-driven robots, enhancing inventory handling and order fulfillment processes, underscore the transformative impact of generative AI on warehouse efficiency and the broader logistics landscape.
Trending Factors
Integration of AI and IoT Technologies Are Trending Factors
The convergence of AI and IoT technologies marks a significant trend in the generative AI in logistics market, driven by the ability to analyze real-time data for enhanced operational decision-making. IoT devices, through the collection of extensive data on shipment conditions and asset locations, paired with AI's analytical prowess, enable logistics operations to optimize efficiency, preempt disruptions, and enhance asset tracking.
This synergy fosters improved logistical visibility and operational responsiveness. A notable application is UPS's implementation of IoT and AI for monitoring temperature-sensitive consignments, demonstrating the trend's role in ensuring regulatory compliance and product integrity, thereby setting a benchmark for operational excellence in logistics.
Demand for Predictive Analytics and Forecasting Are Trending Factors
The increasing demand for predictive analytics and forecasting, powered by generative AI, represents a key trend in the logistics market. As global supply chains become more complex and unpredictable, the need for advanced analytics to forecast demand and optimize operations has become paramount.
Generative AI's capability to process historical data, alongside current market dynamics and external variables, allows for precise demand forecasting and supply chain optimization. This trend is instrumental in enhancing inventory management, minimizing stockouts, and ensuring efficient resource utilization. DHL’s application of generative AI for demand forecasting in its supply network underscores the growing reliance on predictive analytics to streamline logistics and supply chain management.
Regional Analysis
North America Dominates with 43% Market Share
North America's commanding 43% share of the Generative AI in Logistics Market underscores its leadership position, propelled by a combination of advanced technological infrastructure, robust investment in AI and IoT, and a highly competitive e-commerce landscape. This region benefits from a mature digital ecosystem, fostering rapid adoption and integration of cutting-edge technologies within logistics operations.
The dominance of North America can be attributed to its significant investments in AI research and development, a strong presence of tech giants, and a culture of innovation that permeates the logistics sector. Additionally, the region's advanced infrastructure supports the seamless deployment of IoT and AI technologies, enhancing operational efficiencies.
The synergy between technological prowess and a dynamic e-commerce sector in North America fuels the region's superior market performance. The demand for faster, more efficient logistics solutions, driven by consumer expectations for quick delivery, further propels the adoption of generative AI in logistics.
North America's influence in the Generative AI in Logistics Market is poised to grow, driven by ongoing technological advancements, increased digital transformation initiatives within the logistics sector, and a continuous push for innovation. This trend suggests a sustained or even expanded market dominance, cementing the region's status as a global leader in the integration of AI in logistics.
Regional Market Share and Growth:
- Europe: Europe follows with a significant market share, characterized by its robust regulatory framework supporting AI development and deployment, alongside strong logistics and manufacturing sectors.
- Asia Pacific: This region is experiencing rapid growth, driven by the digital transformation of its burgeoning e-commerce sector and investments in smart logistics solutions.
- Middle East & Africa: Although a smaller market share, there's increasing interest in leveraging AI for logistics to enhance the efficiency of its growing trade and e-commerce sectors.
- Latin America: Latin America shows promising growth potential, with increased digitalization efforts and investments in logistics infrastructure aiming to improve supply chain operations.
Key Regions and Countries
- North America
- The US
- Canada
- Mexico
- Western Europe
- Germany
- France
- The UK
- Spain
- Italy
- Portugal
- Ireland
- Austria
- Switzerland
- Benelux
- Nordic
- Rest of Western Europe
- Eastern Europe
- Russia
- Poland
- The Czech Republic
- Greece
- Rest of Eastern Europe
- APAC
- China
- Japan
- South Korea
- India
- Australia & New Zealand
- Indonesia
- Malaysia
- Philippines
- Singapore
- Thailand
- Vietnam
- Rest of APAC
- Latin America
- Brazil
- Colombia
- Chile
- Argentina
- Costa Rica
- Rest of Latin America
- Middle East & Africa
- Algeria
- Egypt
- Israel
- Kuwait
- Nigeria
- Saudi Arabia
- South Africa
- Turkey
- United Arab Emirates
- Rest of MEA
Key Players Analysis
In the Generative AI in Logistics sector, companies such as IBM Corporation, Microsoft Corporation, SAP SE, Oracle Corporation, Blue Yonder, LLamasoft Inc, and AIMMS are playing pivotal roles in driving innovation and efficiency. IBM and Microsoft are at the forefront, leveraging their AI and cloud computing capabilities to offer solutions that enhance supply chain visibility, demand forecasting, and route optimization. SAP SE and Oracle Corporation, with their extensive experience in enterprise resource planning (ERP), are integrating AI to refine logistics operations, from inventory management to customer service, streamlining processes for businesses of all sizes.
Blue Yonder specializes in digital supply chain and omnichannel commerce fulfillment, employing AI to predict and shape demand, improve pricing strategies, and ensure product availability. LLamasoft Inc stands out for its supply chain design and planning tools, utilizing AI to model, simulate, and optimize logistics networks, making supply chains more resilient to disruptions. AIMMS provides advanced analytics solutions, helping companies to make strategic decisions about their logistics and supply chain operations based on AI-generated insights.
Together, these key players are setting new standards for operational efficiency, sustainability, and customer satisfaction in the logistics industry. Their innovative use of generative AI is not just automating tasks but also providing strategic insights that enable more agile, responsive, and intelligent supply chain ecosystems. This, in turn, is redefining what's possible in logistics, from predictive analytics and intelligent routing to dynamic pricing and automated inventory management, paving the way for a more interconnected and smart global supply chain.
Top Key Players in Generative AI in Logistics Market
- IBM Corporation
- Microsoft Corporation
- SAP SE
- Oracle Corporation
- Blue Yonder
- LLamasoft Inc
- AIMMS
- Other Key Players
Recent Development
- In 2023, NEC set its sights on the development of generative AI models with a specific emphasis on logistics. This strategic shift is part of NEC's broader plan to innovate and drive growth in various industries, including healthcare, finance, and manufacturing, by harnessing the power of AI.
- In 2023, Deloitte's Tech Trends 2024 report highlighted the increasing popularity of technologies, including digital twins, spatial computing, augmented reality (AR), and virtual reality (VR), in reshaping industrial operations. Digital twins and spatial simulations were identified as transformative technologies, enhancing efficiency and planning accuracy in industrial processes.
- In December 2023, SingPost and Google Cloud announced a multi-year strategic collaboration to accelerate SingPost’s digital transformation. The goal is to empower SingPost employees with user-friendly AI tools to enhance productivity, streamline tasks, and facilitate collaboration with external partners and customers.
Report Scope:
Report Features Description Market Value (2022) USD 412 Mn Forecast Revenue (2032) USD 13,948 Mn CAGR (2023-2032) 43.5% Base Year for Estimation 2022 Historic Period 2016-2022 Forecast Period 2023-2032 Report Coverage Revenue Forecast, Market Dynamics, COVID-19 Impact, Competitive Landscape, Recent Developments Segments Covered Based on Component (Solutions, Software)
Based on the Deployment Mode (Cloud-Based, On-premises)
Based on End Users (Retail, Manufacturing, Healthcare, Other End-Users)Regional Analysis North America – The US, Canada, & Mexico; Western Europe – Germany, France, The UK, Spain, Italy, Portugal, Ireland, Austria, Switzerland, Benelux, Nordic, & Rest of Western Europe; Eastern Europe – Russia, Poland, The Czech Republic, Greece, & Rest of Eastern Europe; APAC – China, Japan, South Korea, India, Australia & New Zealand, Indonesia, Malaysia, Philippines, Singapore, Thailand, Vietnam, & Rest of APAC; Latin America – Brazil, Colombia, Chile, Argentina, Costa Rica, & Rest of Latin America; Middle East & Africa – Algeria, Egypt, Israel, Kuwait, Nigeria, Saudi Arabia, South Africa, Turkey, United Arab Emirates, & Rest of MEA Competitive Landscape IBM Corporation, Microsoft Corporation, SAP SE, Oracle Corporation, Blue Yonder, LLamasoft Inc, AIMMS, Other Key Players Customization Scope Customization for segments, region/country-level will be provided. Moreover, additional customization can be done based on the requirements. Purchase Options We have three licenses to opt for: Single User License, Multi-User License (Up to 5 Users), Corporate Use License (Unlimited User and Printable PDF) -
- 1. Executive Summary
- 1.1. Definition
- 1.2. Taxonomy
- 1.3. Research Scope
- 1.4. Key Analysis
- 1.5. Key Findings by Major Segments
- 1.6. Top strategies by Major Players
- 2. Global Generative AI in Logistics Market Overview
- 2.1. Generative AI in Logistics Market Dynamics
- 2.1.1. Drivers
- 2.1.2. Opportunities
- 2.1.3. Restraints
- 2.1.4. Challenges
- 2.2. Macro-economic Factors
- 2.3. Regulatory Framework
- 2.4. Market Investment Feasibility Index
- 2.5. PEST Analysis
- 2.6. PORTER’S Five Force Analysis
- 2.7. Drivers & Restraints Impact Analysis
- 2.8. Industry Chain Analysis
- 2.9. Cost Structure Analysis
- 2.10. Marketing Strategy
- 2.11. Russia-Ukraine War Impact Analysis
- 2.12. Opportunity Map Analysis
- 2.13. Market Competition Scenario Analysis
- 2.14. Product Life Cycle Analysis
- 2.15. Opportunity Orbits
- 2.16. Manufacturer Intensity Map
- 2.17. Major Companies sales by Value & Volume
- 2.1. Generative AI in Logistics Market Dynamics
- 3. Global Generative AI in Logistics Market Analysis, Opportunity and Forecast, 2016-2032
- 3.1. Global Generative AI in Logistics Market Analysis, 2016-2021
- 3.2. Global Generative AI in Logistics Market Opportunity and Forecast, 2023-2032
- 3.3. Global Generative AI in Logistics Market Analysis, Opportunity and Forecast, By Component, 2016-2032
- 3.3.1. Global Generative AI in Logistics Market Analysis by Component: Introduction
- 3.3.2. Market Size Absolute $ Opportunity Analysis and Forecast, By Component, 2016-2032
- 3.3.3. Solutions
- 3.3.4. Software
- 3.4. Global Generative AI in Logistics Market Analysis, Opportunity and Forecast, By Deployment Mode, 2016-2032
- 3.4.1. Global Generative AI in Logistics Market Analysis by Deployment Mode: Introduction
- 3.4.2. Market Size Absolute $ Opportunity Analysis and Forecast, By Deployment Mode, 2016-2032
- 3.4.3. Cloud-Based
- 3.4.4. On-Premises
- 3.5. Global Generative AI in Logistics Market Analysis, Opportunity and Forecast, By End-User, 2016-2032
- 3.5.1. Global Generative AI in Logistics Market Analysis by End-User: Introduction
- 3.5.2. Market Size Absolute $ Opportunity Analysis and Forecast, By End-User, 2016-2032
- 3.5.3. Retail
- 3.5.4. Manufacturing
- 3.5.5. Healthcare
- 3.5.6. Other End-Users
- 4. North America Generative AI in Logistics Market Analysis, Opportunity and Forecast, 2016-2032
- 4.1. North America Generative AI in Logistics Market Analysis, 2016-2021
- 4.2. North America Generative AI in Logistics Market Opportunity and Forecast, 2023-2032
- 4.3. North America Generative AI in Logistics Market Analysis, Opportunity and Forecast, By Component, 2016-2032
- 4.3.1. North America Generative AI in Logistics Market Analysis by Component: Introduction
- 4.3.2. Market Size Absolute $ Opportunity Analysis and Forecast, By Component, 2016-2032
- 4.3.3. Solutions
- 4.3.4. Software
- 4.4. North America Generative AI in Logistics Market Analysis, Opportunity and Forecast, By Deployment Mode, 2016-2032
- 4.4.1. North America Generative AI in Logistics Market Analysis by Deployment Mode: Introduction
- 4.4.2. Market Size Absolute $ Opportunity Analysis and Forecast, By Deployment Mode, 2016-2032
- 4.4.3. Cloud-Based
- 4.4.4. On-Premises
- 4.5. North America Generative AI in Logistics Market Analysis, Opportunity and Forecast, By End-User, 2016-2032
- 4.5.1. North America Generative AI in Logistics Market Analysis by End-User: Introduction
- 4.5.2. Market Size Absolute $ Opportunity Analysis and Forecast, By End-User, 2016-2032
- 4.5.3. Retail
- 4.5.4. Manufacturing
- 4.5.5. Healthcare
- 4.5.6. Other End-Users
- 4.6. North America Generative AI in Logistics Market Analysis, Opportunity and Forecast, By Country , 2016-2032
- 4.6.1. North America Generative AI in Logistics Market Analysis by Country : Introduction
- 4.6.2. Market Size Absolute $ Opportunity Analysis and Forecast, Country , 2016-2032
- 4.6.2.1. The US
- 4.6.2.2. Canada
- 4.6.2.3. Mexico
- 5. Western Europe Generative AI in Logistics Market Analysis, Opportunity and Forecast, 2016-2032
- 5.1. Western Europe Generative AI in Logistics Market Analysis, 2016-2021
- 5.2. Western Europe Generative AI in Logistics Market Opportunity and Forecast, 2023-2032
- 5.3. Western Europe Generative AI in Logistics Market Analysis, Opportunity and Forecast, By Component, 2016-2032
- 5.3.1. Western Europe Generative AI in Logistics Market Analysis by Component: Introduction
- 5.3.2. Market Size Absolute $ Opportunity Analysis and Forecast, By Component, 2016-2032
- 5.3.3. Solutions
- 5.3.4. Software
- 5.4. Western Europe Generative AI in Logistics Market Analysis, Opportunity and Forecast, By Deployment Mode, 2016-2032
- 5.4.1. Western Europe Generative AI in Logistics Market Analysis by Deployment Mode: Introduction
- 5.4.2. Market Size Absolute $ Opportunity Analysis and Forecast, By Deployment Mode, 2016-2032
- 5.4.3. Cloud-Based
- 5.4.4. On-Premises
- 5.5. Western Europe Generative AI in Logistics Market Analysis, Opportunity and Forecast, By End-User, 2016-2032
- 5.5.1. Western Europe Generative AI in Logistics Market Analysis by End-User: Introduction
- 5.5.2. Market Size Absolute $ Opportunity Analysis and Forecast, By End-User, 2016-2032
- 5.5.3. Retail
- 5.5.4. Manufacturing
- 5.5.5. Healthcare
- 5.5.6. Other End-Users
- 5.6. Western Europe Generative AI in Logistics Market Analysis, Opportunity and Forecast, By Country , 2016-2032
- 5.6.1. Western Europe Generative AI in Logistics Market Analysis by Country : Introduction
- 5.6.2. Market Size Absolute $ Opportunity Analysis and Forecast, Country , 2016-2032
- 5.6.2.1. Germany
- 5.6.2.2. France
- 5.6.2.3. The UK
- 5.6.2.4. Spain
- 5.6.2.5. Italy
- 5.6.2.6. Portugal
- 5.6.2.7. Ireland
- 5.6.2.8. Austria
- 5.6.2.9. Switzerland
- 5.6.2.10. Benelux
- 5.6.2.11. Nordic
- 5.6.2.12. Rest of Western Europe
- 6. Eastern Europe Generative AI in Logistics Market Analysis, Opportunity and Forecast, 2016-2032
- 6.1. Eastern Europe Generative AI in Logistics Market Analysis, 2016-2021
- 6.2. Eastern Europe Generative AI in Logistics Market Opportunity and Forecast, 2023-2032
- 6.3. Eastern Europe Generative AI in Logistics Market Analysis, Opportunity and Forecast, By Component, 2016-2032
- 6.3.1. Eastern Europe Generative AI in Logistics Market Analysis by Component: Introduction
- 6.3.2. Market Size Absolute $ Opportunity Analysis and Forecast, By Component, 2016-2032
- 6.3.3. Solutions
- 6.3.4. Software
- 6.4. Eastern Europe Generative AI in Logistics Market Analysis, Opportunity and Forecast, By Deployment Mode, 2016-2032
- 6.4.1. Eastern Europe Generative AI in Logistics Market Analysis by Deployment Mode: Introduction
- 6.4.2. Market Size Absolute $ Opportunity Analysis and Forecast, By Deployment Mode, 2016-2032
- 6.4.3. Cloud-Based
- 6.4.4. On-Premises
- 6.5. Eastern Europe Generative AI in Logistics Market Analysis, Opportunity and Forecast, By End-User, 2016-2032
- 6.5.1. Eastern Europe Generative AI in Logistics Market Analysis by End-User: Introduction
- 6.5.2. Market Size Absolute $ Opportunity Analysis and Forecast, By End-User, 2016-2032
- 6.5.3. Retail
- 6.5.4. Manufacturing
- 6.5.5. Healthcare
- 6.5.6. Other End-Users
- 6.6. Eastern Europe Generative AI in Logistics Market Analysis, Opportunity and Forecast, By Country , 2016-2032
- 6.6.1. Eastern Europe Generative AI in Logistics Market Analysis by Country : Introduction
- 6.6.2. Market Size Absolute $ Opportunity Analysis and Forecast, Country , 2016-2032
- 6.6.2.1. Russia
- 6.6.2.2. Poland
- 6.6.2.3. The Czech Republic
- 6.6.2.4. Greece
- 6.6.2.5. Rest of Eastern Europe
- 7. APAC Generative AI in Logistics Market Analysis, Opportunity and Forecast, 2016-2032
- 7.1. APAC Generative AI in Logistics Market Analysis, 2016-2021
- 7.2. APAC Generative AI in Logistics Market Opportunity and Forecast, 2023-2032
- 7.3. APAC Generative AI in Logistics Market Analysis, Opportunity and Forecast, By Component, 2016-2032
- 7.3.1. APAC Generative AI in Logistics Market Analysis by Component: Introduction
- 7.3.2. Market Size Absolute $ Opportunity Analysis and Forecast, By Component, 2016-2032
- 7.3.3. Solutions
- 7.3.4. Software
- 7.4. APAC Generative AI in Logistics Market Analysis, Opportunity and Forecast, By Deployment Mode, 2016-2032
- 7.4.1. APAC Generative AI in Logistics Market Analysis by Deployment Mode: Introduction
- 7.4.2. Market Size Absolute $ Opportunity Analysis and Forecast, By Deployment Mode, 2016-2032
- 7.4.3. Cloud-Based
- 7.4.4. On-Premises
- 7.5. APAC Generative AI in Logistics Market Analysis, Opportunity and Forecast, By End-User, 2016-2032
- 7.5.1. APAC Generative AI in Logistics Market Analysis by End-User: Introduction
- 7.5.2. Market Size Absolute $ Opportunity Analysis and Forecast, By End-User, 2016-2032
- 7.5.3. Retail
- 7.5.4. Manufacturing
- 7.5.5. Healthcare
- 7.5.6. Other End-Users
- 7.6. APAC Generative AI in Logistics Market Analysis, Opportunity and Forecast, By Country , 2016-2032
- 7.6.1. APAC Generative AI in Logistics Market Analysis by Country : Introduction
- 7.6.2. Market Size Absolute $ Opportunity Analysis and Forecast, Country , 2016-2032
- 7.6.2.1. China
- 7.6.2.2. Japan
- 7.6.2.3. South Korea
- 7.6.2.4. India
- 7.6.2.5. Australia & New Zeland
- 7.6.2.6. Indonesia
- 7.6.2.7. Malaysia
- 7.6.2.8. Philippines
- 7.6.2.9. Singapore
- 7.6.2.10. Thailand
- 7.6.2.11. Vietnam
- 7.6.2.12. Rest of APAC
- 8. Latin America Generative AI in Logistics Market Analysis, Opportunity and Forecast, 2016-2032
- 8.1. Latin America Generative AI in Logistics Market Analysis, 2016-2021
- 8.2. Latin America Generative AI in Logistics Market Opportunity and Forecast, 2023-2032
- 8.3. Latin America Generative AI in Logistics Market Analysis, Opportunity and Forecast, By Component, 2016-2032
- 8.3.1. Latin America Generative AI in Logistics Market Analysis by Component: Introduction
- 8.3.2. Market Size Absolute $ Opportunity Analysis and Forecast, By Component, 2016-2032
- 8.3.3. Solutions
- 8.3.4. Software
- 8.4. Latin America Generative AI in Logistics Market Analysis, Opportunity and Forecast, By Deployment Mode, 2016-2032
- 8.4.1. Latin America Generative AI in Logistics Market Analysis by Deployment Mode: Introduction
- 8.4.2. Market Size Absolute $ Opportunity Analysis and Forecast, By Deployment Mode, 2016-2032
- 8.4.3. Cloud-Based
- 8.4.4. On-Premises
- 8.5. Latin America Generative AI in Logistics Market Analysis, Opportunity and Forecast, By End-User, 2016-2032
- 8.5.1. Latin America Generative AI in Logistics Market Analysis by End-User: Introduction
- 8.5.2. Market Size Absolute $ Opportunity Analysis and Forecast, By End-User, 2016-2032
- 8.5.3. Retail
- 8.5.4. Manufacturing
- 8.5.5. Healthcare
- 8.5.6. Other End-Users
- 8.6. Latin America Generative AI in Logistics Market Analysis, Opportunity and Forecast, By Country , 2016-2032
- 8.6.1. Latin America Generative AI in Logistics Market Analysis by Country : Introduction
- 8.6.2. Market Size Absolute $ Opportunity Analysis and Forecast, Country , 2016-2032
- 8.6.2.1. Brazil
- 8.6.2.2. Colombia
- 8.6.2.3. Chile
- 8.6.2.4. Argentina
- 8.6.2.5. Costa Rica
- 8.6.2.6. Rest of Latin America
- 9. Middle East & Africa Generative AI in Logistics Market Analysis, Opportunity and Forecast, 2016-2032
- 9.1. Middle East & Africa Generative AI in Logistics Market Analysis, 2016-2021
- 9.2. Middle East & Africa Generative AI in Logistics Market Opportunity and Forecast, 2023-2032
- 9.3. Middle East & Africa Generative AI in Logistics Market Analysis, Opportunity and Forecast, By Component, 2016-2032
- 9.3.1. Middle East & Africa Generative AI in Logistics Market Analysis by Component: Introduction
- 9.3.2. Market Size Absolute $ Opportunity Analysis and Forecast, By Component, 2016-2032
- 9.3.3. Solutions
- 9.3.4. Software
- 9.4. Middle East & Africa Generative AI in Logistics Market Analysis, Opportunity and Forecast, By Deployment Mode, 2016-2032
- 9.4.1. Middle East & Africa Generative AI in Logistics Market Analysis by Deployment Mode: Introduction
- 9.4.2. Market Size Absolute $ Opportunity Analysis and Forecast, By Deployment Mode, 2016-2032
- 9.4.3. Cloud-Based
- 9.4.4. On-Premises
- 9.5. Middle East & Africa Generative AI in Logistics Market Analysis, Opportunity and Forecast, By End-User, 2016-2032
- 9.5.1. Middle East & Africa Generative AI in Logistics Market Analysis by End-User: Introduction
- 9.5.2. Market Size Absolute $ Opportunity Analysis and Forecast, By End-User, 2016-2032
- 9.5.3. Retail
- 9.5.4. Manufacturing
- 9.5.5. Healthcare
- 9.5.6. Other End-Users
- 9.6. Middle East & Africa Generative AI in Logistics Market Analysis, Opportunity and Forecast, By Country , 2016-2032
- 9.6.1. Middle East & Africa Generative AI in Logistics Market Analysis by Country : Introduction
- 9.6.2. Market Size Absolute $ Opportunity Analysis and Forecast, Country , 2016-2032
- 9.6.2.1. Algeria
- 9.6.2.2. Egypt
- 9.6.2.3. Israel
- 9.6.2.4. Kuwait
- 9.6.2.5. Nigeria
- 9.6.2.6. Saudi Arabia
- 9.6.2.7. South Africa
- 9.6.2.8. Turkey
- 9.6.2.9. The UAE
- 9.6.2.10. Rest of MEA
- 10. Global Generative AI in Logistics Market Analysis, Opportunity and Forecast, By Region , 2016-2032
- 10.1. Global Generative AI in Logistics Market Analysis by Region : Introduction
- 10.2. Market Size Absolute $ Opportunity Analysis and Forecast, By Region , 2016-2032
- 10.2.1. North America
- 10.2.2. Western Europe
- 10.2.3. Eastern Europe
- 10.2.4. APAC
- 10.2.5. Latin America
- 10.2.6. Middle East & Africa
- 11. Global Generative AI in Logistics Market Competitive Landscape, Market Share Analysis, and Company Profiles
- 11.1. Market Share Analysis
- 11.2. Company Profiles
- 11.3. Boston Scientific Corporation
- 11.3.1. Company Overview
- 11.3.2. Financial Highlights
- 11.3.3. Product Portfolio
- 11.3.4. SWOT Analysis
- 11.3.5. Key Strategies and Developments
- 11.4. Terumo Corporation
- 11.4.1. Company Overview
- 11.4.2. Financial Highlights
- 11.4.3. Product Portfolio
- 11.4.4. SWOT Analysis
- 11.4.5. Key Strategies and Developments
- 11.5. Medtronic, Inc.
- 11.5.1. Company Overview
- 11.5.2. Financial Highlights
- 11.5.3. Product Portfolio
- 11.5.4. SWOT Analysis
- 11.5.5. Key Strategies and Developments
- 11.6. DePuy Synthes
- 11.6.1. Company Overview
- 11.6.2. Financial Highlights
- 11.6.3. Product Portfolio
- 11.6.4. SWOT Analysis
- 11.6.5. Key Strategies and Developments
- 11.7. Stryker Corporation
- 11.7.1. Company Overview
- 11.7.2. Financial Highlights
- 11.7.3. Product Portfolio
- 11.7.4. SWOT Analysis
- 11.7.5. Key Strategies and Developments
- 11.8. Cordis Corporation
- 11.8.1. Company Overview
- 11.8.2. Financial Highlights
- 11.8.3. Product Portfolio
- 11.8.4. SWOT Analysis
- 11.8.5. Key Strategies and Developments
- 11.9. St. Jude Medical
- 11.9.1. Company Overview
- 11.9.2. Financial Highlights
- 11.9.3. Product Portfolio
- 11.9.4. SWOT Analysis
- 11.9.5. Key Strategies and Developments
- 11.10. Pfizer, Inc.
- 11.10.1. Company Overview
- 11.10.2. Financial Highlights
- 11.10.3. Product Portfolio
- 11.10.4. SWOT Analysis
- 11.10.5. Key Strategies and Developments
- 11.11. Sirtex Medical
- 11.11.1. Company Overview
- 11.11.2. Financial Highlights
- 11.11.3. Product Portfolio
- 11.11.4. SWOT Analysis
- 11.11.5. Key Strategies and Developments
- 11.12. Nordian
- 11.12.1. Company Overview
- 11.12.2. Financial Highlights
- 11.12.3. Product Portfolio
- 11.12.4. SWOT Analysis
- 11.12.5. Key Strategies and Developments
- 11.13. Other Key Players
- 11.13.1. Company Overview
- 11.13.2. Financial Highlights
- 11.13.3. Product Portfolio
- 11.13.4. SWOT Analysis
- 11.13.5. Key Strategies and Developments
- 11.14. Other Key Players
- 11.14.1. Company Overview
- 11.14.2. Financial Highlights
- 11.14.3. Product Portfolio
- 11.14.4. SWOT Analysis
- 11.14.5. Key Strategies and Developments
- 12. Assumptions and Acronyms
- 13. Research Methodology
- 14. Contact
- List of Figures
- Figure 1: Global Generative AI in Logistics Market Revenue (US$ Mn) Market Share by Component in 2022
- Figure 2: Global Generative AI in Logistics Market Attractiveness Analysis by Component, 2016-2032
- Figure 3: Global Generative AI in Logistics Market Revenue (US$ Mn) Market Share by Deployment Modein 2022
- Figure 4: Global Generative AI in Logistics Market Attractiveness Analysis by Deployment Mode, 2016-2032
- Figure 5: Global Generative AI in Logistics Market Revenue (US$ Mn) Market Share by End-Userin 2022
- Figure 6: Global Generative AI in Logistics Market Attractiveness Analysis by End-User, 2016-2032
- Figure 7: Global Generative AI in Logistics Market Revenue (US$ Mn) Market Share by Region in 2022
- Figure 8: Global Generative AI in Logistics Market Attractiveness Analysis by Region, 2016-2032
- Figure 9: Global Generative AI in Logistics Market Revenue (US$ Mn) (2016-2032)
- Figure 10: Global Generative AI in Logistics Market Revenue (US$ Mn) Comparison by Region (2016-2032)
- Figure 11: Global Generative AI in Logistics Market Revenue (US$ Mn) Comparison by Component (2016-2032)
- Figure 12: Global Generative AI in Logistics Market Revenue (US$ Mn) Comparison by Deployment Mode (2016-2032)
- Figure 13: Global Generative AI in Logistics Market Revenue (US$ Mn) Comparison by End-User (2016-2032)
- Figure 14: Global Generative AI in Logistics Market Y-o-Y Growth Rate Comparison by Region (2016-2032)
- Figure 15: Global Generative AI in Logistics Market Y-o-Y Growth Rate Comparison by Component (2016-2032)
- Figure 16: Global Generative AI in Logistics Market Y-o-Y Growth Rate Comparison by Deployment Mode (2016-2032)
- Figure 17: Global Generative AI in Logistics Market Y-o-Y Growth Rate Comparison by End-User (2016-2032)
- Figure 18: Global Generative AI in Logistics Market Share Comparison by Region (2016-2032)
- Figure 19: Global Generative AI in Logistics Market Share Comparison by Component (2016-2032)
- Figure 20: Global Generative AI in Logistics Market Share Comparison by Deployment Mode (2016-2032)
- Figure 21: Global Generative AI in Logistics Market Share Comparison by End-User (2016-2032)
- Figure 22: North America Generative AI in Logistics Market Revenue (US$ Mn) Market Share by Componentin 2022
- Figure 23: North America Generative AI in Logistics Market Attractiveness Analysis by Component, 2016-2032
- Figure 24: North America Generative AI in Logistics Market Revenue (US$ Mn) Market Share by Deployment Modein 2022
- Figure 25: North America Generative AI in Logistics Market Attractiveness Analysis by Deployment Mode, 2016-2032
- Figure 26: North America Generative AI in Logistics Market Revenue (US$ Mn) Market Share by End-Userin 2022
- Figure 27: North America Generative AI in Logistics Market Attractiveness Analysis by End-User, 2016-2032
- Figure 28: North America Generative AI in Logistics Market Revenue (US$ Mn) Market Share by Country in 2022
- Figure 29: North America Generative AI in Logistics Market Attractiveness Analysis by Country, 2016-2032
- Figure 30: North America Generative AI in Logistics Market Revenue (US$ Mn) (2016-2032)
- Figure 31: North America Generative AI in Logistics Market Revenue (US$ Mn) Comparison by Country (2016-2032)
- Figure 32: North America Generative AI in Logistics Market Revenue (US$ Mn) Comparison by Component (2016-2032)
- Figure 33: North America Generative AI in Logistics Market Revenue (US$ Mn) Comparison by Deployment Mode (2016-2032)
- Figure 34: North America Generative AI in Logistics Market Revenue (US$ Mn) Comparison by End-User (2016-2032)
- Figure 35: North America Generative AI in Logistics Market Y-o-Y Growth Rate Comparison by Country (2016-2032)
- Figure 36: North America Generative AI in Logistics Market Y-o-Y Growth Rate Comparison by Component (2016-2032)
- Figure 37: North America Generative AI in Logistics Market Y-o-Y Growth Rate Comparison by Deployment Mode (2016-2032)
- Figure 38: North America Generative AI in Logistics Market Y-o-Y Growth Rate Comparison by End-User (2016-2032)
- Figure 39: North America Generative AI in Logistics Market Share Comparison by Country (2016-2032)
- Figure 40: North America Generative AI in Logistics Market Share Comparison by Component (2016-2032)
- Figure 41: North America Generative AI in Logistics Market Share Comparison by Deployment Mode (2016-2032)
- Figure 42: North America Generative AI in Logistics Market Share Comparison by End-User (2016-2032)
- Figure 43: Western Europe Generative AI in Logistics Market Revenue (US$ Mn) Market Share by Componentin 2022
- Figure 44: Western Europe Generative AI in Logistics Market Attractiveness Analysis by Component, 2016-2032
- Figure 45: Western Europe Generative AI in Logistics Market Revenue (US$ Mn) Market Share by Deployment Modein 2022
- Figure 46: Western Europe Generative AI in Logistics Market Attractiveness Analysis by Deployment Mode, 2016-2032
- Figure 47: Western Europe Generative AI in Logistics Market Revenue (US$ Mn) Market Share by End-Userin 2022
- Figure 48: Western Europe Generative AI in Logistics Market Attractiveness Analysis by End-User, 2016-2032
- Figure 49: Western Europe Generative AI in Logistics Market Revenue (US$ Mn) Market Share by Country in 2022
- Figure 50: Western Europe Generative AI in Logistics Market Attractiveness Analysis by Country, 2016-2032
- Figure 51: Western Europe Generative AI in Logistics Market Revenue (US$ Mn) (2016-2032)
- Figure 52: Western Europe Generative AI in Logistics Market Revenue (US$ Mn) Comparison by Country (2016-2032)
- Figure 53: Western Europe Generative AI in Logistics Market Revenue (US$ Mn) Comparison by Component (2016-2032)
- Figure 54: Western Europe Generative AI in Logistics Market Revenue (US$ Mn) Comparison by Deployment Mode (2016-2032)
- Figure 55: Western Europe Generative AI in Logistics Market Revenue (US$ Mn) Comparison by End-User (2016-2032)
- Figure 56: Western Europe Generative AI in Logistics Market Y-o-Y Growth Rate Comparison by Country (2016-2032)
- Figure 57: Western Europe Generative AI in Logistics Market Y-o-Y Growth Rate Comparison by Component (2016-2032)
- Figure 58: Western Europe Generative AI in Logistics Market Y-o-Y Growth Rate Comparison by Deployment Mode (2016-2032)
- Figure 59: Western Europe Generative AI in Logistics Market Y-o-Y Growth Rate Comparison by End-User (2016-2032)
- Figure 60: Western Europe Generative AI in Logistics Market Share Comparison by Country (2016-2032)
- Figure 61: Western Europe Generative AI in Logistics Market Share Comparison by Component (2016-2032)
- Figure 62: Western Europe Generative AI in Logistics Market Share Comparison by Deployment Mode (2016-2032)
- Figure 63: Western Europe Generative AI in Logistics Market Share Comparison by End-User (2016-2032)
- Figure 64: Eastern Europe Generative AI in Logistics Market Revenue (US$ Mn) Market Share by Componentin 2022
- Figure 65: Eastern Europe Generative AI in Logistics Market Attractiveness Analysis by Component, 2016-2032
- Figure 66: Eastern Europe Generative AI in Logistics Market Revenue (US$ Mn) Market Share by Deployment Modein 2022
- Figure 67: Eastern Europe Generative AI in Logistics Market Attractiveness Analysis by Deployment Mode, 2016-2032
- Figure 68: Eastern Europe Generative AI in Logistics Market Revenue (US$ Mn) Market Share by End-Userin 2022
- Figure 69: Eastern Europe Generative AI in Logistics Market Attractiveness Analysis by End-User, 2016-2032
- Figure 70: Eastern Europe Generative AI in Logistics Market Revenue (US$ Mn) Market Share by Country in 2022
- Figure 71: Eastern Europe Generative AI in Logistics Market Attractiveness Analysis by Country, 2016-2032
- Figure 72: Eastern Europe Generative AI in Logistics Market Revenue (US$ Mn) (2016-2032)
- Figure 73: Eastern Europe Generative AI in Logistics Market Revenue (US$ Mn) Comparison by Country (2016-2032)
- Figure 74: Eastern Europe Generative AI in Logistics Market Revenue (US$ Mn) Comparison by Component (2016-2032)
- Figure 75: Eastern Europe Generative AI in Logistics Market Revenue (US$ Mn) Comparison by Deployment Mode (2016-2032)
- Figure 76: Eastern Europe Generative AI in Logistics Market Revenue (US$ Mn) Comparison by End-User (2016-2032)
- Figure 77: Eastern Europe Generative AI in Logistics Market Y-o-Y Growth Rate Comparison by Country (2016-2032)
- Figure 78: Eastern Europe Generative AI in Logistics Market Y-o-Y Growth Rate Comparison by Component (2016-2032)
- Figure 79: Eastern Europe Generative AI in Logistics Market Y-o-Y Growth Rate Comparison by Deployment Mode (2016-2032)
- Figure 80: Eastern Europe Generative AI in Logistics Market Y-o-Y Growth Rate Comparison by End-User (2016-2032)
- Figure 81: Eastern Europe Generative AI in Logistics Market Share Comparison by Country (2016-2032)
- Figure 82: Eastern Europe Generative AI in Logistics Market Share Comparison by Component (2016-2032)
- Figure 83: Eastern Europe Generative AI in Logistics Market Share Comparison by Deployment Mode (2016-2032)
- Figure 84: Eastern Europe Generative AI in Logistics Market Share Comparison by End-User (2016-2032)
- Figure 85: APAC Generative AI in Logistics Market Revenue (US$ Mn) Market Share by Componentin 2022
- Figure 86: APAC Generative AI in Logistics Market Attractiveness Analysis by Component, 2016-2032
- Figure 87: APAC Generative AI in Logistics Market Revenue (US$ Mn) Market Share by Deployment Modein 2022
- Figure 88: APAC Generative AI in Logistics Market Attractiveness Analysis by Deployment Mode, 2016-2032
- Figure 89: APAC Generative AI in Logistics Market Revenue (US$ Mn) Market Share by End-Userin 2022
- Figure 90: APAC Generative AI in Logistics Market Attractiveness Analysis by End-User, 2016-2032
- Figure 91: APAC Generative AI in Logistics Market Revenue (US$ Mn) Market Share by Country in 2022
- Figure 92: APAC Generative AI in Logistics Market Attractiveness Analysis by Country, 2016-2032
- Figure 93: APAC Generative AI in Logistics Market Revenue (US$ Mn) (2016-2032)
- Figure 94: APAC Generative AI in Logistics Market Revenue (US$ Mn) Comparison by Country (2016-2032)
- Figure 95: APAC Generative AI in Logistics Market Revenue (US$ Mn) Comparison by Component (2016-2032)
- Figure 96: APAC Generative AI in Logistics Market Revenue (US$ Mn) Comparison by Deployment Mode (2016-2032)
- Figure 97: APAC Generative AI in Logistics Market Revenue (US$ Mn) Comparison by End-User (2016-2032)
- Figure 98: APAC Generative AI in Logistics Market Y-o-Y Growth Rate Comparison by Country (2016-2032)
- Figure 99: APAC Generative AI in Logistics Market Y-o-Y Growth Rate Comparison by Component (2016-2032)
- Figure 100: APAC Generative AI in Logistics Market Y-o-Y Growth Rate Comparison by Deployment Mode (2016-2032)
- Figure 101: APAC Generative AI in Logistics Market Y-o-Y Growth Rate Comparison by End-User (2016-2032)
- Figure 102: APAC Generative AI in Logistics Market Share Comparison by Country (2016-2032)
- Figure 103: APAC Generative AI in Logistics Market Share Comparison by Component (2016-2032)
- Figure 104: APAC Generative AI in Logistics Market Share Comparison by Deployment Mode (2016-2032)
- Figure 105: APAC Generative AI in Logistics Market Share Comparison by End-User (2016-2032)
- Figure 106: Latin America Generative AI in Logistics Market Revenue (US$ Mn) Market Share by Componentin 2022
- Figure 107: Latin America Generative AI in Logistics Market Attractiveness Analysis by Component, 2016-2032
- Figure 108: Latin America Generative AI in Logistics Market Revenue (US$ Mn) Market Share by Deployment Modein 2022
- Figure 109: Latin America Generative AI in Logistics Market Attractiveness Analysis by Deployment Mode, 2016-2032
- Figure 110: Latin America Generative AI in Logistics Market Revenue (US$ Mn) Market Share by End-Userin 2022
- Figure 111: Latin America Generative AI in Logistics Market Attractiveness Analysis by End-User, 2016-2032
- Figure 112: Latin America Generative AI in Logistics Market Revenue (US$ Mn) Market Share by Country in 2022
- Figure 113: Latin America Generative AI in Logistics Market Attractiveness Analysis by Country, 2016-2032
- Figure 114: Latin America Generative AI in Logistics Market Revenue (US$ Mn) (2016-2032)
- Figure 115: Latin America Generative AI in Logistics Market Revenue (US$ Mn) Comparison by Country (2016-2032)
- Figure 116: Latin America Generative AI in Logistics Market Revenue (US$ Mn) Comparison by Component (2016-2032)
- Figure 117: Latin America Generative AI in Logistics Market Revenue (US$ Mn) Comparison by Deployment Mode (2016-2032)
- Figure 118: Latin America Generative AI in Logistics Market Revenue (US$ Mn) Comparison by End-User (2016-2032)
- Figure 119: Latin America Generative AI in Logistics Market Y-o-Y Growth Rate Comparison by Country (2016-2032)
- Figure 120: Latin America Generative AI in Logistics Market Y-o-Y Growth Rate Comparison by Component (2016-2032)
- Figure 121: Latin America Generative AI in Logistics Market Y-o-Y Growth Rate Comparison by Deployment Mode (2016-2032)
- Figure 122: Latin America Generative AI in Logistics Market Y-o-Y Growth Rate Comparison by End-User (2016-2032)
- Figure 123: Latin America Generative AI in Logistics Market Share Comparison by Country (2016-2032)
- Figure 124: Latin America Generative AI in Logistics Market Share Comparison by Component (2016-2032)
- Figure 125: Latin America Generative AI in Logistics Market Share Comparison by Deployment Mode (2016-2032)
- Figure 126: Latin America Generative AI in Logistics Market Share Comparison by End-User (2016-2032)
- Figure 127: Middle East & Africa Generative AI in Logistics Market Revenue (US$ Mn) Market Share by Componentin 2022
- Figure 128: Middle East & Africa Generative AI in Logistics Market Attractiveness Analysis by Component, 2016-2032
- Figure 129: Middle East & Africa Generative AI in Logistics Market Revenue (US$ Mn) Market Share by Deployment Modein 2022
- Figure 130: Middle East & Africa Generative AI in Logistics Market Attractiveness Analysis by Deployment Mode, 2016-2032
- Figure 131: Middle East & Africa Generative AI in Logistics Market Revenue (US$ Mn) Market Share by End-Userin 2022
- Figure 132: Middle East & Africa Generative AI in Logistics Market Attractiveness Analysis by End-User, 2016-2032
- Figure 133: Middle East & Africa Generative AI in Logistics Market Revenue (US$ Mn) Market Share by Country in 2022
- Figure 134: Middle East & Africa Generative AI in Logistics Market Attractiveness Analysis by Country, 2016-2032
- Figure 135: Middle East & Africa Generative AI in Logistics Market Revenue (US$ Mn) (2016-2032)
- Figure 136: Middle East & Africa Generative AI in Logistics Market Revenue (US$ Mn) Comparison by Country (2016-2032)
- Figure 137: Middle East & Africa Generative AI in Logistics Market Revenue (US$ Mn) Comparison by Component (2016-2032)
- Figure 138: Middle East & Africa Generative AI in Logistics Market Revenue (US$ Mn) Comparison by Deployment Mode (2016-2032)
- Figure 139: Middle East & Africa Generative AI in Logistics Market Revenue (US$ Mn) Comparison by End-User (2016-2032)
- Figure 140: Middle East & Africa Generative AI in Logistics Market Y-o-Y Growth Rate Comparison by Country (2016-2032)
- Figure 141: Middle East & Africa Generative AI in Logistics Market Y-o-Y Growth Rate Comparison by Component (2016-2032)
- Figure 142: Middle East & Africa Generative AI in Logistics Market Y-o-Y Growth Rate Comparison by Deployment Mode (2016-2032)
- Figure 143: Middle East & Africa Generative AI in Logistics Market Y-o-Y Growth Rate Comparison by End-User (2016-2032)
- Figure 144: Middle East & Africa Generative AI in Logistics Market Share Comparison by Country (2016-2032)
- Figure 145: Middle East & Africa Generative AI in Logistics Market Share Comparison by Component (2016-2032)
- Figure 146: Middle East & Africa Generative AI in Logistics Market Share Comparison by Deployment Mode (2016-2032)
- Figure 147: Middle East & Africa Generative AI in Logistics Market Share Comparison by End-User (2016-2032)
- List of Tables
- Table 1: Global Generative AI in Logistics Market Comparison by Component (2016-2032)
- Table 2: Global Generative AI in Logistics Market Comparison by Deployment Mode (2016-2032)
- Table 3: Global Generative AI in Logistics Market Comparison by End-User (2016-2032)
- Table 4: Global Generative AI in Logistics Market Revenue (US$ Mn) Comparison by Region (2016-2032)
- Table 5: Global Generative AI in Logistics Market Revenue (US$ Mn) (2016-2032)
- Table 6: Global Generative AI in Logistics Market Revenue (US$ Mn) Comparison by Region (2016-2032)
- Table 7: Global Generative AI in Logistics Market Revenue (US$ Mn) Comparison by Component (2016-2032)
- Table 8: Global Generative AI in Logistics Market Revenue (US$ Mn) Comparison by Deployment Mode (2016-2032)
- Table 9: Global Generative AI in Logistics Market Revenue (US$ Mn) Comparison by End-User (2016-2032)
- Table 10: Global Generative AI in Logistics Market Y-o-Y Growth Rate Comparison by Region (2016-2032)
- Table 11: Global Generative AI in Logistics Market Y-o-Y Growth Rate Comparison by Component (2016-2032)
- Table 12: Global Generative AI in Logistics Market Y-o-Y Growth Rate Comparison by Deployment Mode (2016-2032)
- Table 13: Global Generative AI in Logistics Market Y-o-Y Growth Rate Comparison by End-User (2016-2032)
- Table 14: Global Generative AI in Logistics Market Share Comparison by Region (2016-2032)
- Table 15: Global Generative AI in Logistics Market Share Comparison by Component (2016-2032)
- Table 16: Global Generative AI in Logistics Market Share Comparison by Deployment Mode (2016-2032)
- Table 17: Global Generative AI in Logistics Market Share Comparison by End-User (2016-2032)
- Table 18: North America Generative AI in Logistics Market Comparison by Deployment Mode (2016-2032)
- Table 19: North America Generative AI in Logistics Market Comparison by End-User (2016-2032)
- Table 20: North America Generative AI in Logistics Market Revenue (US$ Mn) Comparison by Country (2016-2032)
- Table 21: North America Generative AI in Logistics Market Revenue (US$ Mn) (2016-2032)
- Table 22: North America Generative AI in Logistics Market Revenue (US$ Mn) Comparison by Country (2016-2032)
- Table 23: North America Generative AI in Logistics Market Revenue (US$ Mn) Comparison by Component (2016-2032)
- Table 24: North America Generative AI in Logistics Market Revenue (US$ Mn) Comparison by Deployment Mode (2016-2032)
- Table 25: North America Generative AI in Logistics Market Revenue (US$ Mn) Comparison by End-User (2016-2032)
- Table 26: North America Generative AI in Logistics Market Y-o-Y Growth Rate Comparison by Country (2016-2032)
- Table 27: North America Generative AI in Logistics Market Y-o-Y Growth Rate Comparison by Component (2016-2032)
- Table 28: North America Generative AI in Logistics Market Y-o-Y Growth Rate Comparison by Deployment Mode (2016-2032)
- Table 29: North America Generative AI in Logistics Market Y-o-Y Growth Rate Comparison by End-User (2016-2032)
- Table 30: North America Generative AI in Logistics Market Share Comparison by Country (2016-2032)
- Table 31: North America Generative AI in Logistics Market Share Comparison by Component (2016-2032)
- Table 32: North America Generative AI in Logistics Market Share Comparison by Deployment Mode (2016-2032)
- Table 33: North America Generative AI in Logistics Market Share Comparison by End-User (2016-2032)
- Table 34: Western Europe Generative AI in Logistics Market Comparison by Component (2016-2032)
- Table 35: Western Europe Generative AI in Logistics Market Comparison by Deployment Mode (2016-2032)
- Table 36: Western Europe Generative AI in Logistics Market Comparison by End-User (2016-2032)
- Table 37: Western Europe Generative AI in Logistics Market Revenue (US$ Mn) Comparison by Country (2016-2032)
- Table 38: Western Europe Generative AI in Logistics Market Revenue (US$ Mn) (2016-2032)
- Table 39: Western Europe Generative AI in Logistics Market Revenue (US$ Mn) Comparison by Country (2016-2032)
- Table 40: Western Europe Generative AI in Logistics Market Revenue (US$ Mn) Comparison by Component (2016-2032)
- Table 41: Western Europe Generative AI in Logistics Market Revenue (US$ Mn) Comparison by Deployment Mode (2016-2032)
- Table 42: Western Europe Generative AI in Logistics Market Revenue (US$ Mn) Comparison by End-User (2016-2032)
- Table 43: Western Europe Generative AI in Logistics Market Y-o-Y Growth Rate Comparison by Country (2016-2032)
- Table 44: Western Europe Generative AI in Logistics Market Y-o-Y Growth Rate Comparison by Component (2016-2032)
- Table 45: Western Europe Generative AI in Logistics Market Y-o-Y Growth Rate Comparison by Deployment Mode (2016-2032)
- Table 46: Western Europe Generative AI in Logistics Market Y-o-Y Growth Rate Comparison by End-User (2016-2032)
- Table 47: Western Europe Generative AI in Logistics Market Share Comparison by Country (2016-2032)
- Table 48: Western Europe Generative AI in Logistics Market Share Comparison by Component (2016-2032)
- Table 49: Western Europe Generative AI in Logistics Market Share Comparison by Deployment Mode (2016-2032)
- Table 50: Western Europe Generative AI in Logistics Market Share Comparison by End-User (2016-2032)
- Table 51: Eastern Europe Generative AI in Logistics Market Comparison by Component (2016-2032)
- Table 52: Eastern Europe Generative AI in Logistics Market Comparison by Deployment Mode (2016-2032)
- Table 53: Eastern Europe Generative AI in Logistics Market Comparison by End-User (2016-2032)
- Table 54: Eastern Europe Generative AI in Logistics Market Revenue (US$ Mn) Comparison by Country (2016-2032)
- Table 55: Eastern Europe Generative AI in Logistics Market Revenue (US$ Mn) (2016-2032)
- Table 56: Eastern Europe Generative AI in Logistics Market Revenue (US$ Mn) Comparison by Country (2016-2032)
- Table 57: Eastern Europe Generative AI in Logistics Market Revenue (US$ Mn) Comparison by Component (2016-2032)
- Table 58: Eastern Europe Generative AI in Logistics Market Revenue (US$ Mn) Comparison by Deployment Mode (2016-2032)
- Table 59: Eastern Europe Generative AI in Logistics Market Revenue (US$ Mn) Comparison by End-User (2016-2032)
- Table 60: Eastern Europe Generative AI in Logistics Market Y-o-Y Growth Rate Comparison by Country (2016-2032)
- Table 61: Eastern Europe Generative AI in Logistics Market Y-o-Y Growth Rate Comparison by Component (2016-2032)
- Table 62: Eastern Europe Generative AI in Logistics Market Y-o-Y Growth Rate Comparison by Deployment Mode (2016-2032)
- Table 63: Eastern Europe Generative AI in Logistics Market Y-o-Y Growth Rate Comparison by End-User (2016-2032)
- Table 64: Eastern Europe Generative AI in Logistics Market Share Comparison by Country (2016-2032)
- Table 65: Eastern Europe Generative AI in Logistics Market Share Comparison by Component (2016-2032)
- Table 66: Eastern Europe Generative AI in Logistics Market Share Comparison by Deployment Mode (2016-2032)
- Table 67: Eastern Europe Generative AI in Logistics Market Share Comparison by End-User (2016-2032)
- Table 68: APAC Generative AI in Logistics Market Comparison by Component (2016-2032)
- Table 69: APAC Generative AI in Logistics Market Comparison by Deployment Mode (2016-2032)
- Table 70: APAC Generative AI in Logistics Market Comparison by End-User (2016-2032)
- Table 71: APAC Generative AI in Logistics Market Revenue (US$ Mn) Comparison by Country (2016-2032)
- Table 72: APAC Generative AI in Logistics Market Revenue (US$ Mn) (2016-2032)
- Table 73: APAC Generative AI in Logistics Market Revenue (US$ Mn) Comparison by Country (2016-2032)
- Table 74: APAC Generative AI in Logistics Market Revenue (US$ Mn) Comparison by Component (2016-2032)
- Table 75: APAC Generative AI in Logistics Market Revenue (US$ Mn) Comparison by Deployment Mode (2016-2032)
- Table 76: APAC Generative AI in Logistics Market Revenue (US$ Mn) Comparison by End-User (2016-2032)
- Table 77: APAC Generative AI in Logistics Market Y-o-Y Growth Rate Comparison by Country (2016-2032)
- Table 78: APAC Generative AI in Logistics Market Y-o-Y Growth Rate Comparison by Component (2016-2032)
- Table 79: APAC Generative AI in Logistics Market Y-o-Y Growth Rate Comparison by Deployment Mode (2016-2032)
- Table 80: APAC Generative AI in Logistics Market Y-o-Y Growth Rate Comparison by End-User (2016-2032)
- Table 81: APAC Generative AI in Logistics Market Share Comparison by Country (2016-2032)
- Table 82: APAC Generative AI in Logistics Market Share Comparison by Component (2016-2032)
- Table 83: APAC Generative AI in Logistics Market Share Comparison by Deployment Mode (2016-2032)
- Table 84: APAC Generative AI in Logistics Market Share Comparison by End-User (2016-2032)
- Table 85: Latin America Generative AI in Logistics Market Comparison by Component (2016-2032)
- Table 86: Latin America Generative AI in Logistics Market Comparison by Deployment Mode (2016-2032)
- Table 87: Latin America Generative AI in Logistics Market Comparison by End-User (2016-2032)
- Table 88: Latin America Generative AI in Logistics Market Revenue (US$ Mn) Comparison by Country (2016-2032)
- Table 89: Latin America Generative AI in Logistics Market Revenue (US$ Mn) (2016-2032)
- Table 90: Latin America Generative AI in Logistics Market Revenue (US$ Mn) Comparison by Country (2016-2032)
- Table 91: Latin America Generative AI in Logistics Market Revenue (US$ Mn) Comparison by Component (2016-2032)
- Table 92: Latin America Generative AI in Logistics Market Revenue (US$ Mn) Comparison by Deployment Mode (2016-2032)
- Table 93: Latin America Generative AI in Logistics Market Revenue (US$ Mn) Comparison by End-User (2016-2032)
- Table 94: Latin America Generative AI in Logistics Market Y-o-Y Growth Rate Comparison by Country (2016-2032)
- Table 95: Latin America Generative AI in Logistics Market Y-o-Y Growth Rate Comparison by Component (2016-2032)
- Table 96: Latin America Generative AI in Logistics Market Y-o-Y Growth Rate Comparison by Deployment Mode (2016-2032)
- Table 97: Latin America Generative AI in Logistics Market Y-o-Y Growth Rate Comparison by End-User (2016-2032)
- Table 98: Latin America Generative AI in Logistics Market Share Comparison by Country (2016-2032)
- Table 99: Latin America Generative AI in Logistics Market Share Comparison by Component (2016-2032)
- Table 100: Latin America Generative AI in Logistics Market Share Comparison by Deployment Mode (2016-2032)
- Table 101: Latin America Generative AI in Logistics Market Share Comparison by End-User (2016-2032)
- Table 102: Middle East & Africa Generative AI in Logistics Market Comparison by Component (2016-2032)
- Table 103: Middle East & Africa Generative AI in Logistics Market Comparison by Deployment Mode (2016-2032)
- Table 104: Middle East & Africa Generative AI in Logistics Market Comparison by End-User (2016-2032)
- Table 105: Middle East & Africa Generative AI in Logistics Market Revenue (US$ Mn) Comparison by Country (2016-2032)
- Table 106: Middle East & Africa Generative AI in Logistics Market Revenue (US$ Mn) (2016-2032)
- Table 107: Middle East & Africa Generative AI in Logistics Market Revenue (US$ Mn) Comparison by Country (2016-2032)
- Table 108: Middle East & Africa Generative AI in Logistics Market Revenue (US$ Mn) Comparison by Component (2016-2032)
- Table 109: Middle East & Africa Generative AI in Logistics Market Revenue (US$ Mn) Comparison by Deployment Mode (2016-2032)
- Table 110: Middle East & Africa Generative AI in Logistics Market Revenue (US$ Mn) Comparison by End-User (2016-2032)
- Table 111: Middle East & Africa Generative AI in Logistics Market Y-o-Y Growth Rate Comparison by Country (2016-2032)
- Table 112: Middle East & Africa Generative AI in Logistics Market Y-o-Y Growth Rate Comparison by Component (2016-2032)
- Table 113: Middle East & Africa Generative AI in Logistics Market Y-o-Y Growth Rate Comparison by Deployment Mode (2016-2032)
- Table 114: Middle East & Africa Generative AI in Logistics Market Y-o-Y Growth Rate Comparison by End-User (2016-2032)
- Table 115: Middle East & Africa Generative AI in Logistics Market Share Comparison by Country (2016-2032)
- Table 116: Middle East & Africa Generative AI in Logistics Market Share Comparison by Component (2016-2032)
- Table 117: Middle East & Africa Generative AI in Logistics Market Share Comparison by Deployment Mode (2016-2032)
- Table 118: Middle East & Africa Generative AI in Logistics Market Share Comparison by End-User (2016-2032)
- 1. Executive Summary
-
- IBM Corporation
- Microsoft Corporation
- SAP SE
- Oracle Corporation
- Blue Yonder
- LLamasoft Inc
- AIMMS
- Other Key Players
Our Clients


View Our Licence Options
