
Global Generative AI in Biotech Market by Technology (Generative Adversarial Networks (GANs), Variational Auto Encoders (VAEs), and Other), By Application (Drug discovery, Protein Engineering, and Other), By End-Users (Pharmaceutical Company, Biotechnology Startups, and Other ), By Region and Companies - Industry Segment Outlook, Market Assessment, Competition Scenario, Trends, and Forecast 2023-2032
-
38026
-
April 2024
-
260
-


-
This report was compiled by Vishwa Gaul Vishwa is an experienced market research and consulting professional with over 8 years of expertise in the ICT industry, contributing to over 700 reports across telecommunications, software, hardware, and digital solutions. Correspondence Team Lead- ICT Linkedin | Detailed Market research Methodology Our methodology involves a mix of primary research, including interviews with leading mental health experts, and secondary research from reputable medical journals and databases. View Detailed Methodology Page
-
Quick Navigation
Report Overview
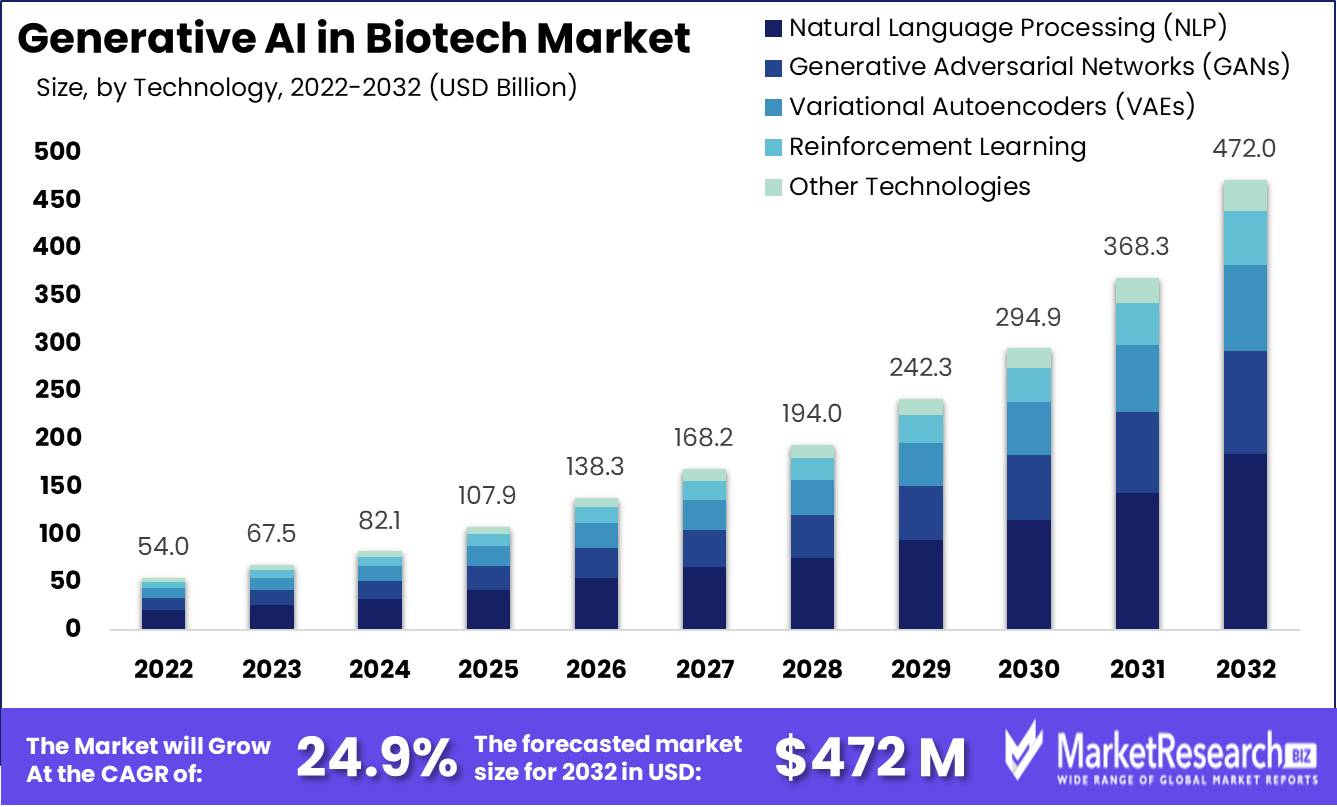
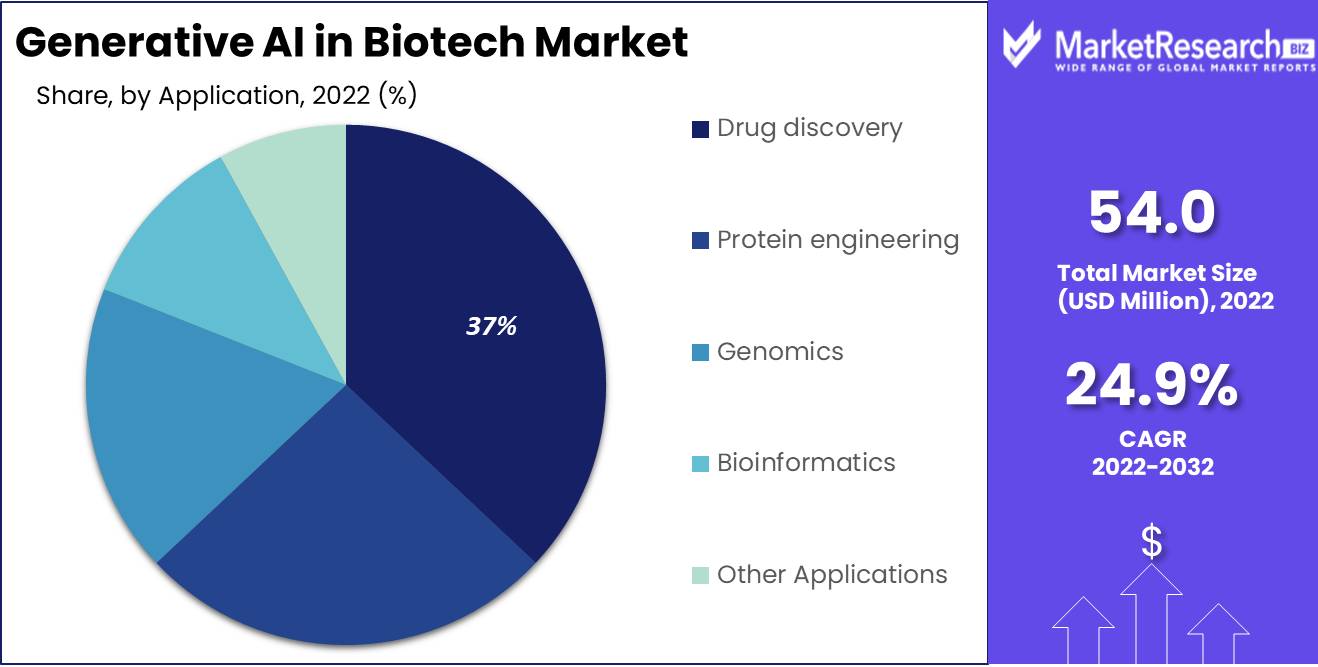
Global Generative AI in Biotech Market size is expected to be worth around USD 472 million by 2032 from USD 54 million in 2022, growing at a CAGR of 24.9%. during the forecast period from 2023 to 2032.
The surge in demand for new advanced technologies, the rise in global population, and the requirement for customized medicines are some of the main driving factors for generative AI in the biotech market. Biotech is also known as biotechnology, which uses technology based on the study of biology.
One of the main categories under this segment is pharmaceutical firms, but there are also many other categories that fall under the biotech market. The biotech sector has witnessed some of the vital advancements in the past few years with the help of biology as well as the use of GenAI tools that have helped the researchers in many ways.
GenAI has become a significant tool for any business or firm in the industry. According to an article published by IBEF in August 2023, under Asia-Pacific, India is the third largest biotech market and ranks 12 globally.
Moreover, in India, there are 665 FDA-approved plants in the United States, 44% of the world-wide abbreviated drug application, which is known as ANDA, and more than 1,400 production plants that are compliant with WHO’s protocols. In February 2023, the department of biotechnology had 1,523 ongoing projects. By FY22, the pharmaceutical sector in India had exported almost USD 23.04 billion in formulations and biologicals, which accounted for 73.31% of the nation’s total exports, followed by bulk medications and drug intermediates.
There are many leading companies in the biotech market that are using GenAI to gain benefits from the market. For example, Gilead Science is one of the leading biotech companies that does research, creates, and sells drugs and medicines. This firm is using the AI platform of Insitrio to explore and build new treatments for non-alcoholic steatohepatitis (NASH). By launching data-driven discovery and development, the firm will change the method by which drugs are discovered and provided to patients.
Another example is GenenTech, another well-known biotechnology firm that builds, explores, produces, and sells medicines for treating patients suffering from severe medical conditions. This firm has focused on utilizing ML in order to change a huge amount of cancer patient information into a computer system that can be utilized to identify new targets for cancer treatment.
Generative AI and ML are commonly used in the biotech industry. They comprise clinical data management, automation of disease forecasting, prevention, and biomarker discovery. Generative AI is paving the way for new innovations in medical and biotech solutions that have the potential to dominate the analytical skills and experiences of human minds. The demand for generative AI in the biotech industry will expand due to the high requirement for drug developments that will help in market expansion in the coming years.
Key Takeaways
- Market Value: The Global Generative AI in Biotech Market is projected to reach approximately USD 472 million by 2032, exhibiting a remarkable CAGR of 24.9% from 2023 to 2032.
- Dominant Segments:
- Technology Analysis: Natural Language Processing (NLP) holds the largest market share at 39%, owing to its crucial role in extracting insights from complex biological data.
- Application Analysis: Drug discovery leads the application domain with a 37% market share, showcasing the transformative impact of generative AI in identifying novel drug candidates and optimizing drug development processes.
- Organization Type Analysis: Pharmaceutical companies dominate with a 36% market share, leveraging generative AI to accelerate drug discovery and development processes.
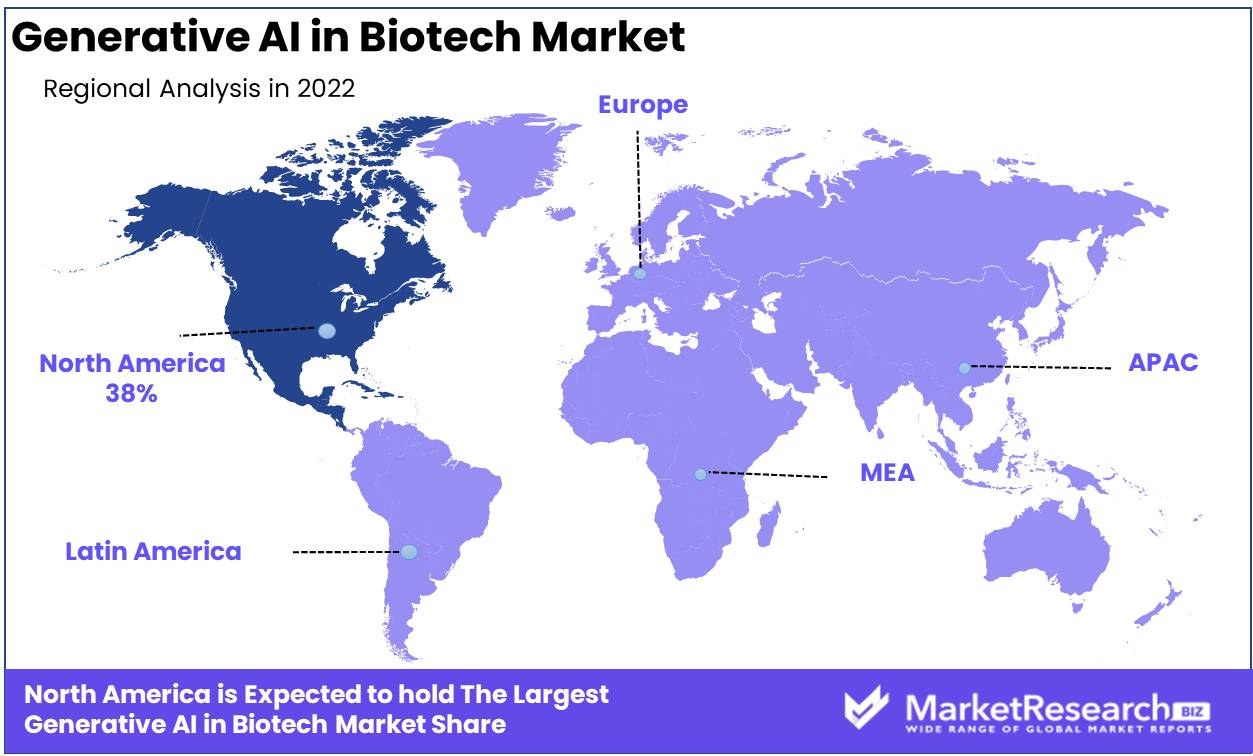
- Regional Dynamics: North America commands the largest market share at 38%, driven by robust healthcare systems and substantial research outputs. Europe follows closely behind with approximately 29% market share, benefiting from strong regulatory frameworks and extensive research activities.
- Key Players: Major players in the market include Insilico Medicine, Recursion Pharmaceuticals, Atomwise, Deep Genomics, and BenevolentAI, among others, contributing to the market's innovation and growth.
- Analyst Viewpoint: Analysts foresee a promising future for the Generative AI in Biotech Market, fueled by technological advancements, increasing demand for drug discovery solutions, and growing investments in AI-driven biotech research.
- Growth Opportunities: Opportunities for growth lie in further technological advancements, expansion into emerging markets, strategic collaborations, and the development of AI-driven solutions for diverse biotech applications such as protein engineering, genomics, and bioinformatics.
Driving Factors
Efficient Drug Discovery and Development Drives Market Growth
Generative AI is revolutionizing the biotech industry by making drug discovery and development significantly more efficient and cost-effective. By employing AI-powered platforms, pharmaceutical companies can now design, optimize, and predict the efficacy and safety of drug molecules with unprecedented speed and precision. This technological advancement allows for the identification of viable drug candidates much earlier in the development process, potentially reducing both time and costs by 25-50%, as highlighted in a joint report by BCG and Wellcome.
The integration of generative AI into the drug development pipeline accelerates the entire process from conception to clinical trials, ensuring that new treatments reach the market faster. This efficiency not only drives market growth by enabling the quicker introduction of new drugs but also attracts considerable investments into biotech firms leveraging AI technologies. The economic benefits are substantial, offering pharmaceutical companies a competitive edge in a highly dynamic market. The application of generative AI in drug discovery and development is a pivotal factor that not only promises to streamline R&D expenditures but also catalyzes innovation, making it a cornerstone for the expansion of the generative AI in biotech market.
Personalized Medicine Catalyzes Market Expansion
The shift towards personalized medicine is a significant growth driver for the generative AI in biotech market. As medical treatment becomes increasingly patient-specific, AI's role in identifying unique patient characteristics and tailoring treatments accordingly becomes indispensable. This approach enhances patient outcomes by ensuring that therapies are precisely matched to individual genetic profiles, disease histories, and response patterns.
The demand for such customized healthcare solutions is rising sharply, spurred by a growing recognition of its benefits in treating various conditions more effectively. Generative AI facilitates the analysis of vast datasets to uncover insights into patient-specific treatment responses, enabling the development of highly targeted therapies. This capability not only improves the success rates of treatments but also broadens the market for biotech companies by opening new avenues for innovation in patient care. The convergence of AI with personalized medicine represents a transformative shift in healthcare, offering significant growth opportunities for the biotech sector by meeting the evolving needs of patients and healthcare providers alike.
Increasing Prevalence of Chronic Diseases Propels Market Growth
The escalating prevalence of chronic diseases worldwide, such as cancer and cardiovascular diseases, demands innovative and effective treatment solutions. Generative AI stands at the forefront of this challenge, offering new pathways for the rapid development of drugs and therapies tailored to these complex conditions. The technology's capacity to accelerate research and development processes is particularly critical in addressing the urgent need for new treatments, potentially saving up to 70% in time and costs, as observed by pharmaceutical giant Merck in its AI endeavors.
This efficiency translates into a faster transition from laboratory discoveries to available treatments, significantly impacting the market by speeding up the delivery of life-saving drugs. The relentless rise in chronic disease cases continues to drive demand for new healthcare solutions, making generative AI an invaluable asset in the biotech industry's quest to meet this demand. By enhancing the efficiency of drug discovery and development processes, generative AI not only fosters market growth but also contributes to a broader societal impact by improving healthcare outcomes for patients worldwide.
Restraining Factors
High Development Costs Restrains Market Growth
High development costs for AI-powered platforms pose a significant barrier to the generative AI in biotech market. Developing, testing, and implementing AI technologies require substantial financial investment, often running into millions of dollars. This high cost threshold makes it challenging for smaller biotech firms to enter or compete in the market, thereby restricting the diversity and innovation that are crucial for market growth.
Smaller companies often lack the resources to invest in such expensive technology, which limits their ability to contribute to the industry's expansion and innovation. Consequently, the market may become dominated by a few large players with the financial capacity to invest in AI, reducing competition and potentially slowing the pace of innovation. This concentration can stifle market dynamism, preventing the full potential of generative AI from being realized across the biotech sector.
Regulatory Challenges Restrains Market Growth
Navigating regulatory challenges is a critical hurdle that can significantly slow the growth of the generative AI in biotech market. AI-powered drug discovery and development platforms must comply with stringent regulatory standards to ensure safety, efficacy, and accuracy. Meeting these standards involves a complex and lengthy process of validation, verification, and approval by regulatory bodies. This process can delay the introduction of new AI technologies and slow down their adoption in the market.
For companies, the time and resources required to navigate these regulatory pathways can be considerable, potentially deterring investment in AI development. Furthermore, the evolving nature of AI technology means that regulatory frameworks may struggle to keep pace, creating uncertainties that can further inhibit market growth. As a result, regulatory challenges not only delay the deployment of generative AI solutions but also impact the overall growth and dynamism of the biotech sector.
Technology Analysis
Natural Language Processing Leads with 39% Share in Generative AI for Biotech Market
In the technology segment of the Generative AI in Biotech Market, Natural Language Processing (NLP) holds a dominant position, accounting for 39% of the market share. This prominence is attributed to NLP's critical role in understanding complex biological data, which is often unstructured and vast. NLP technologies enable the extraction of valuable insights from scientific papers, genetic information, and clinical reports, thereby accelerating drug discovery processes and enhancing precision in predictive models for patient outcomes. Its application ranges from analyzing patient records to identifying new drug candidates, making it indispensable in the biotech field.
Generative Adversarial Networks (GANs), Variational Auto Encoders (VAEs), and Reinforcement Learning represent other significant technologies within this segment. GANs are particularly noted for their ability to generate synthetic biological data, aiding in overcoming data scarcity issues. VAEs play a crucial role in understanding genetic variations and their implications for diseases, while Reinforcement Learning is instrumental in optimizing therapeutic strategies and drug development pipelines. Each of these technologies contributes uniquely to the growth and diversification of the Generative AI in Biotech Market, complementing the strengths of NLP and ensuring robust market expansion.
Application Analysis
Drug Discovery Commands 37% of Generative AI in Biotech Market
In the application domain, drug discovery emerges as the leading sub-segment, capturing 37% of the market. The significant share held by drug discovery is a testament to the transformative impact of generative AI on identifying novel drug candidates, optimizing lead compounds, and predicting drug efficacy and side effects. This technology dramatically reduces the time and financial resources traditionally required in drug development, making it a cornerstone for innovation and efficiency in the biotech industry.
The remaining sub-segments, including protein engineering, genomics, bioinformatics, and other applications, each play a pivotal role in enriching the application landscape of generative AI in biotech. Protein engineering benefits from AI in designing proteins with desired functions, which has vast implications for developing new therapies and enzymes. Genomics and bioinformatics leverage AI to decipher complex genetic information, offering insights into disease mechanisms and patient responses to treatments. These applications not only support the growth within their specific fields but also contribute to the overarching expansion of the generative AI market by broadening the range of possible innovations and applications.
Organization Type Analysis
Pharmaceutical Companies Hold 36% Share in Generative AI for Biotech Market
Pharmaceutical companies represent the largest sub-segment within the organization type category, holding 36% of the market share. Their leading position underscores the critical role of generative AI in transforming traditional pharmaceutical research and development. By integrating AI into their operations, pharmaceutical companies can achieve significant advancements in drug discovery, clinical trials, and personalized medicine, leading to faster market entry of new drugs and therapies.
Biotechnology startups, academic institutions, research organizations, and other end-users collectively contribute to the dynamic and innovative environment of the Generative AI in Biotech Market. Startups often bring novel AI applications and business models, driving technological advancements and market growth. Academic institutions and research organizations are pivotal in advancing AI research, translating into new tools and methodologies for biotech applications. Together, these segments foster a collaborative ecosystem that supports the continuous evolution and adoption of generative AI technologies across the biotech industry, ensuring sustained market growth and innovation.
Key Market Segments
Based on Technology
- Natural Language Processing (NLP)
- Generative Adversarial Networks (GANs)
- Variational Auto Encoders (VAEs)
- Reinforcement Learning
- Other Technologies
Based on Application
- Drug discovery
- Protein engineering
- Genomics
- Bioinformatics
- Other Applications
Based on Organization Type
- Pharmaceutical companies
- Biotechnology startups
- Academic institutions
- Research organizations
- Other End-Users
Growth Opportunities
Drug Discovery Offers Growth Opportunity
Generative AI significantly transforms the landscape of drug discovery, presenting vast opportunities for market expansion. By leveraging algorithms capable of generating and optimizing novel molecules, biotech companies can venture into previously unexplored chemical spaces. This capability not only accelerates the identification of promising drug candidates but also streamlines the entire discovery process, making it more efficient and cost-effective compared to traditional methods.
The adoption of generative AI in drug discovery reduces the reliance on conventional, labor-intensive screening processes, thereby decreasing both the time and financial investment required to bring new drugs to market. This efficiency fosters a more dynamic and competitive market environment, encouraging innovation and potentially leading to a surge in successful drug development projects. The role of generative AI in drug discovery is a key driver of growth within the biotech sector, promising to unlock new therapeutic possibilities and enhance the rate at which medical advancements reach patients.
Protein Engineering Offers Growth Opportunity
The application of generative AI in protein engineering represents a significant frontier for growth in the biotech market. By utilizing generative AI models trained on extensive datasets of biological information, biotech companies can now design proteins with precise functions or properties, mirroring or even enhancing those found in nature. This innovative approach to protein design enables the creation of novel enzymes for industrial processes, therapeutic proteins for medical treatment, and other biologically active compounds.
The ability to engineer proteins with specific characteristics opens up new avenues for product development across various sectors, including pharmaceuticals, agriculture, and biomanufacturing. As generative AI continues to evolve and become more sophisticated, its potential in protein engineering expands, offering unprecedented opportunities for market growth. The integration of AI into protein design not only accelerates the development process but also increases the precision and effectiveness of the resulting products, marking a pivotal shift in how biotech companies approach the creation of new biological entities.
Trending Factors
Regulatory Support Are Trending Factors
Regulatory support is increasingly becoming a key trend in the Generative AI in Biotech Market. As regulatory bodies begin to recognize the potential of AI in enhancing drug development processes, they are gradually offering more support and guidance for its integration. This trend is crucial as it lowers the traditional barriers to AI adoption within the biotech sector.
With clearer regulatory pathways, biotech companies are encouraged to invest in and deploy AI technologies, confident that their developments will align with compliance requirements. This support not only fosters innovation but also accelerates the approval and market entry of AI-driven solutions, ultimately driving market growth.
Collaboration between AI and Biotech Companies Are Trending Factors
The growing trend of collaboration between AI and biotech companies marks a significant shift in the industry. These partnerships combine the strengths of AI's data-processing capabilities with the biotech sector's deep understanding of biological processes, leading to the creation of groundbreaking AI-powered platforms for drug discovery and development.
Such collaborations are instrumental in pushing the boundaries of what's possible in biotech, paving the way for innovative treatments and therapies that were previously unattainable. By working together, AI and biotech companies can overcome complex challenges more efficiently, driving market growth through the development of new applications and solutions that address unmet needs in healthcare.
Regional Analysis
North America Dominates with 38% Market Share
North America's leading position in the Generative AI in Biotech Market, holding 38% of the market share, is driven by several factors. A robust investment landscape, cutting-edge research institutions, and supportive regulatory frameworks contribute significantly to this dominance. The region's strong focus on innovation and the presence of leading biotech and AI companies create an environment ripe for advancements in generative AI applications in biotechnology.
The dynamics of North America's market are influenced by its highly developed biotech ecosystem, substantial healthcare spending, and a culture of embracing technological advancements. The EY Biotechnology Report 2023 indicates that public biotech companies in the US and Europe amassed revenues of US$215 billion in 2022, despite a slight decrease from the previous year. This showcases the region's capacity to sustain high levels of investment and innovation, even in challenging economic conditions.
North America's influence in the global Generative AI in Biotech Market is expected to remain significant. Continuous investment in AI research, favorable regulatory conditions, and collaborative efforts between the tech and biotech sectors will likely keep propelling the region's market share. As AI technologies evolve and integrate more deeply into biotech research and development, North America is poised to lead in pioneering new therapies and drug discovery methodologies.
Regional Market Shares:
- Europe: The second-largest market, Europe, holds approximately 29% of the global market share. The region's strength lies in its robust healthcare systems, strong regulatory frameworks, and substantial research outputs from both public and private sectors.
- Asia Pacific: Asia Pacific is emerging rapidly, with a market share of 21%. This growth is fueled by increasing investments in healthcare technology, a growing biotech startup ecosystem, and significant government initiatives to support biotech and AI industries.
- Middle East & Africa: Holding a smaller share of the market at around 7%, the Middle East and Africa are witnessing growth due to increasing healthcare expenditure and investments in biotech research. However, the region is still in the early stages of adopting generative AI technologies.
- Latin America: With approximately 5% of the market share, Latin America's biotech sector is gradually expanding. The region's growth is supported by growing interest in biotechnology innovations and improving healthcare infrastructure, though it faces challenges in funding and technology access.
Key Regions and Countries
- North America
- The US
- Canada
- Mexico
- Western Europe
- Germany
- France
- The UK
- Spain
- Italy
- Portugal
- Ireland
- Austria
- Switzerland
- Benelux
- Nordic
- Rest of Western Europe
- Eastern Europe
- Russia
- Poland
- The Czech Republic
- Greece
- Rest of Eastern Europe
- APAC
- China
- Japan
- South Korea
- India
- Australia & New Zealand
- Indonesia
- Malaysia
- Philippines
- Singapore
- Thailand
- Vietnam
- Rest of APAC
- Latin America
- Brazil
- Colombia
- Chile
- Argentina
- Costa Rica
- Rest of Latin America
- Middle East & Africa
- Algeria
- Egypt
- Israel
- Kuwait
- Nigeria
- Saudi Arabia
- South Africa
- Turkey
- United Arab Emirates
- Rest of MEA
Key Players Analysis
In the rapidly evolving Generative AI in Biotech market, key players such as Insilico Medicine, Recursion Pharmaceuticals, Atomwise, Deep Genomics, BenevolentAI, Numerate, Ginkgo Bioworks, Zymergen, OpenAI, and DeepMind have established strong footholds. These organizations are pivotal in shaping the trajectory of innovation, leveraging artificial intelligence to accelerate drug discovery, personalized medicine, and genetic research.
Insilico Medicine and BenevolentAI are at the forefront, focusing on AI-driven drug development and disease understanding, demonstrating significant market influence and strategic positioning. Recursion Pharmaceuticals and Atomwise excel in utilizing AI for drug repurposing and molecular predictions, respectively, indicating their critical roles in reducing development costs and time.
Deep Genomics stands out in genetic disease research, while Ginkgo Bioworks and Zymergen emphasize synthetic biology, highlighting diverse applications of AI in biotech. OpenAI and DeepMind, although broader in focus, contribute foundational AI advancements that underpin sector-specific applications. Other key players also contribute valuable innovations, collectively driving the market forward. This landscape reflects a dynamic and competitive environment, with each player's strategic initiatives and market influence shaping the future of biotech through AI integration.
Market Key Players
- Insilico Medicine
- Recursion Pharmaceuticals
- Atomwise
- Deep Genomics
- BenevolentAI
- Numerate
- Ginkgo Bioworks
- Zymergen
- OpenAI
- DeepMind
- Other Key Players
Recent Developments
- In September 2023, Evozyne, a generative AI-focused biotech startup, raising $81 million in a Series B investment round is indicative of the growing impact of generative AI in the biotech market. Evozyne's algorithms, which simulate millions of years of evolution in proteins, aim to identify potential functional candidates for drug development more efficiently than traditional methods.
- On November 22, 2023, Genentech announced a multi-year research partnership with Nvidia to leverage generative AI technology for expediting drug discovery. In this collaboration, Genentech is incorporating its proprietary algorithms, which will operate on Nvidia's DGX cloud services.
- The collaboration between Terray Therapeutics and NVIDIA, announced on November 9, 2023, has marked a significant development in the application of generative AI in the biotech market. Terray Therapeutics, a biotechnology company specializing in integrating scale experimentation and generative AI for small molecule drug discovery, received an equity investment from NVentures, the venture capital arm of NVIDIA.
- On December 1, 2022, two notable developments in this domain were announced by Terray Therapeutics and NVIDIA. These companies have introduced powerful generative models, Chroma and RoseTTAFold Diffusion, designed to generate precise protein designs not seen in nature.
- In August 2023, AI biotech company Genesis, based in California, has successfully raised $200 million in an oversubscribed Series B funding round, reaching a total funding of $280 million. The round was co-led by Andreessen Horowitz and a U.S.-based life sciences-focused investor.
- In June 2023, Insilico Medicine, a groundbreaking biotechnology company specializing in generative artificial intelligence (AI), has achieved a significant milestone with its AI-discovered and AI-generated drug, INS018_055. This potentially first-in-class anti-fibrotic drug candidate has entered multi-regional Phase II clinical trials in both the U.S and China, with the first patients having received doses.
Report Scope
Report Features Description Market Value (2022) USD 54 Mn Forecast Revenue (2032) USD 472 Mn CAGR (2023-2032) 24.9% Base Year for Estimation 2022 Historic Period 2016-2022 Forecast Period 2023-2032 Report Coverage Revenue Forecast, Market Dynamics, COVID-19 Impact, Competitive Landscape, Recent Developments Segments Covered by Technology (Generative Adversarial Networks (GANs), Variational Auto Encoders (VAEs), Reinforcement Learning, Natural Language Processing (NLP), Other Technologies); By Application (Drug discovery, Protein Engineering, Genomics, Bioinformatics, Other Applications);
By End-Users (Pharmaceutical Company, Biotechnology Start-up's, Academic Institutes, Research Organizations, Other End-Users);
Regional Analysis North America – The US, Canada, & Mexico; Western Europe – Germany, France, The UK, Spain, Italy, Portugal, Ireland, Austria, Switzerland, Benelux, Nordic, & Rest of Western Europe; Eastern Europe – Russia, Poland, The Czech Republic, Greece, & Rest of Eastern Europe; APAC – China, Japan, South Korea, India, Australia & New Zealand, Indonesia, Malaysia, Philippines, Singapore, Thailand, Vietnam, & Rest of APAC; Latin America – Brazil, Colombia, Chile, Argentina, Costa Rica, & Rest of Latin America; Middle East & Africa – Algeria, Egypt, Israel, Kuwait, Nigeria, Saudi Arabia, South Africa, Turkey, United Arab Emirates, & Rest of MEA Competitive Landscape Insilico Medicine, Recursion Pharmaceuticals, Atomwise, Deep Genomics, BenevolentAI, Numerate, Ginkgo Bioworks, Zymergen, OpenAI, DeepMind, Other Key Players Customization Scope Customization for segments, region/country-level will be provided. Moreover, additional customization can be done based on the requirements. Purchase Options We have three licenses to opt for: Single User License, Multi-User License (Up to 5 Users), Corporate Use License (Unlimited User and Printable PDF) -
- 1. Executive Summary
- 1.1. Definition
- 1.2. Taxonomy
- 1.3. Research Scope
- 1.4. Key Analysis
- 1.5. Key Findings by Major Segments
- 1.6. Top strategies by Major Players
- 2. Global Generative AI in Biotech Market Overview
- 2.1. Generative AI in Biotech Market Dynamics
- 2.1.1. Drivers
- 2.1.2. Opportunities
- 2.1.3. Restraints
- 2.1.4. Challenges
- 2.2. Macro-economic Factors
- 2.3. Regulatory Framework
- 2.4. Market Investment Feasibility Index
- 2.5. PEST Analysis
- 2.6. PORTER’S Five Force Analysis
- 2.7. Drivers & Restraints Impact Analysis
- 2.8. Industry Chain Analysis
- 2.9. Cost Structure Analysis
- 2.10. Marketing Strategy
- 2.11. Russia-Ukraine War Impact Analysis
- 2.12. Opportunity Map Analysis
- 2.13. Market Competition Scenario Analysis
- 2.14. Product Life Cycle Analysis
- 2.15. Opportunity Orbits
- 2.16. Manufacturer Intensity Map
- 2.17. Major Companies sales by Value & Volume
- 2.1. Generative AI in Biotech Market Dynamics
- 3. Global Generative AI in Biotech Market Analysis, Opportunity and Forecast, 2016-2032
- 3.1. Global Generative AI in Biotech Market Analysis, 2016-2021
- 3.2. Global Generative AI in Biotech Market Opportunity and Forecast, 2023-2032
- 3.3. Global Generative AI in Biotech Market Analysis, Opportunity and Forecast, By Based on Technology, 2016-2032
- 3.3.1. Global Generative AI in Biotech Market Analysis by Based on Technology: Introduction
- 3.3.2. Market Size Absolute $ Opportunity Analysis and Forecast, By Based on Technology, 2016-2032
- 3.3.3. Natural Language Processing (NLP)
- 3.3.4. Generative Adversarial Networks (GANs)
- 3.3.5. Variational Autoencoders (VAEs)
- 3.3.6. Reinforcement Learning
- 3.3.7. Other Technologies
- 3.4. Global Generative AI in Biotech Market Analysis, Opportunity and Forecast, By Based on Applications, 2016-2032
- 3.4.1. Global Generative AI in Biotech Market Analysis by Based on Applications: Introduction
- 3.4.2. Market Size Absolute $ Opportunity Analysis and Forecast, By Based on Applications, 2016-2032
- 3.4.3. Drug discovery
- 3.4.4. Protein engineering
- 3.4.5. Genomics
- 3.4.6. Bioinformatics
- 3.4.7. Other Applications
- 3.5. Global Generative AI in Biotech Market Analysis, Opportunity and Forecast, By Based on End-Users, 2016-2032
- 3.5.1. Global Generative AI in Biotech Market Analysis by Based on End-Users: Introduction
- 3.5.2. Market Size Absolute $ Opportunity Analysis and Forecast, By Based on End-Users, 2016-2032
- 3.5.3. Pharmaceutical companies
- 3.5.4. Biotechnology startups
- 3.5.5. Academic institutions
- 3.5.6. Research organizations
- 3.5.7. Other end-users
- 4. North America Generative AI in Biotech Market Analysis, Opportunity and Forecast, 2016-2032
- 4.1. North America Generative AI in Biotech Market Analysis, 2016-2021
- 4.2. North America Generative AI in Biotech Market Opportunity and Forecast, 2023-2032
- 4.3. North America Generative AI in Biotech Market Analysis, Opportunity and Forecast, By Based on Technology, 2016-2032
- 4.3.1. North America Generative AI in Biotech Market Analysis by Based on Technology: Introduction
- 4.3.2. Market Size Absolute $ Opportunity Analysis and Forecast, By Based on Technology, 2016-2032
- 4.3.3. Natural Language Processing (NLP)
- 4.3.4. Generative Adversarial Networks (GANs)
- 4.3.5. Variational Autoencoders (VAEs)
- 4.3.6. Reinforcement Learning
- 4.3.7. Other Technologies
- 4.4. North America Generative AI in Biotech Market Analysis, Opportunity and Forecast, By Based on Applications, 2016-2032
- 4.4.1. North America Generative AI in Biotech Market Analysis by Based on Applications: Introduction
- 4.4.2. Market Size Absolute $ Opportunity Analysis and Forecast, By Based on Applications, 2016-2032
- 4.4.3. Drug discovery
- 4.4.4. Protein engineering
- 4.4.5. Genomics
- 4.4.6. Bioinformatics
- 4.4.7. Other Applications
- 4.5. North America Generative AI in Biotech Market Analysis, Opportunity and Forecast, By Based on End-Users, 2016-2032
- 4.5.1. North America Generative AI in Biotech Market Analysis by Based on End-Users: Introduction
- 4.5.2. Market Size Absolute $ Opportunity Analysis and Forecast, By Based on End-Users, 2016-2032
- 4.5.3. Pharmaceutical companies
- 4.5.4. Biotechnology startups
- 4.5.5. Academic institutions
- 4.5.6. Research organizations
- 4.5.7. Other end-users
- 4.6. North America Generative AI in Biotech Market Analysis, Opportunity and Forecast, By Country , 2016-2032
- 4.6.1. North America Generative AI in Biotech Market Analysis by Country : Introduction
- 4.6.2. Market Size Absolute $ Opportunity Analysis and Forecast, Country , 2016-2032
- 4.6.2.1. The US
- 4.6.2.2. Canada
- 4.6.2.3. Mexico
- 5. Western Europe Generative AI in Biotech Market Analysis, Opportunity and Forecast, 2016-2032
- 5.1. Western Europe Generative AI in Biotech Market Analysis, 2016-2021
- 5.2. Western Europe Generative AI in Biotech Market Opportunity and Forecast, 2023-2032
- 5.3. Western Europe Generative AI in Biotech Market Analysis, Opportunity and Forecast, By Based on Technology, 2016-2032
- 5.3.1. Western Europe Generative AI in Biotech Market Analysis by Based on Technology: Introduction
- 5.3.2. Market Size Absolute $ Opportunity Analysis and Forecast, By Based on Technology, 2016-2032
- 5.3.3. Natural Language Processing (NLP)
- 5.3.4. Generative Adversarial Networks (GANs)
- 5.3.5. Variational Autoencoders (VAEs)
- 5.3.6. Reinforcement Learning
- 5.3.7. Other Technologies
- 5.4. Western Europe Generative AI in Biotech Market Analysis, Opportunity and Forecast, By Based on Applications, 2016-2032
- 5.4.1. Western Europe Generative AI in Biotech Market Analysis by Based on Applications: Introduction
- 5.4.2. Market Size Absolute $ Opportunity Analysis and Forecast, By Based on Applications, 2016-2032
- 5.4.3. Drug discovery
- 5.4.4. Protein engineering
- 5.4.5. Genomics
- 5.4.6. Bioinformatics
- 5.4.7. Other Applications
- 5.5. Western Europe Generative AI in Biotech Market Analysis, Opportunity and Forecast, By Based on End-Users, 2016-2032
- 5.5.1. Western Europe Generative AI in Biotech Market Analysis by Based on End-Users: Introduction
- 5.5.2. Market Size Absolute $ Opportunity Analysis and Forecast, By Based on End-Users, 2016-2032
- 5.5.3. Pharmaceutical companies
- 5.5.4. Biotechnology startups
- 5.5.5. Academic institutions
- 5.5.6. Research organizations
- 5.5.7. Other end-users
- 5.6. Western Europe Generative AI in Biotech Market Analysis, Opportunity and Forecast, By Country , 2016-2032
- 5.6.1. Western Europe Generative AI in Biotech Market Analysis by Country : Introduction
- 5.6.2. Market Size Absolute $ Opportunity Analysis and Forecast, Country , 2016-2032
- 5.6.2.1. Germany
- 5.6.2.2. France
- 5.6.2.3. The UK
- 5.6.2.4. Spain
- 5.6.2.5. Italy
- 5.6.2.6. Portugal
- 5.6.2.7. Ireland
- 5.6.2.8. Austria
- 5.6.2.9. Switzerland
- 5.6.2.10. Benelux
- 5.6.2.11. Nordic
- 5.6.2.12. Rest of Western Europe
- 6. Eastern Europe Generative AI in Biotech Market Analysis, Opportunity and Forecast, 2016-2032
- 6.1. Eastern Europe Generative AI in Biotech Market Analysis, 2016-2021
- 6.2. Eastern Europe Generative AI in Biotech Market Opportunity and Forecast, 2023-2032
- 6.3. Eastern Europe Generative AI in Biotech Market Analysis, Opportunity and Forecast, By Based on Technology, 2016-2032
- 6.3.1. Eastern Europe Generative AI in Biotech Market Analysis by Based on Technology: Introduction
- 6.3.2. Market Size Absolute $ Opportunity Analysis and Forecast, By Based on Technology, 2016-2032
- 6.3.3. Natural Language Processing (NLP)
- 6.3.4. Generative Adversarial Networks (GANs)
- 6.3.5. Variational Autoencoders (VAEs)
- 6.3.6. Reinforcement Learning
- 6.3.7. Other Technologies
- 6.4. Eastern Europe Generative AI in Biotech Market Analysis, Opportunity and Forecast, By Based on Applications, 2016-2032
- 6.4.1. Eastern Europe Generative AI in Biotech Market Analysis by Based on Applications: Introduction
- 6.4.2. Market Size Absolute $ Opportunity Analysis and Forecast, By Based on Applications, 2016-2032
- 6.4.3. Drug discovery
- 6.4.4. Protein engineering
- 6.4.5. Genomics
- 6.4.6. Bioinformatics
- 6.4.7. Other Applications
- 6.5. Eastern Europe Generative AI in Biotech Market Analysis, Opportunity and Forecast, By Based on End-Users, 2016-2032
- 6.5.1. Eastern Europe Generative AI in Biotech Market Analysis by Based on End-Users: Introduction
- 6.5.2. Market Size Absolute $ Opportunity Analysis and Forecast, By Based on End-Users, 2016-2032
- 6.5.3. Pharmaceutical companies
- 6.5.4. Biotechnology startups
- 6.5.5. Academic institutions
- 6.5.6. Research organizations
- 6.5.7. Other end-users
- 6.6. Eastern Europe Generative AI in Biotech Market Analysis, Opportunity and Forecast, By Country , 2016-2032
- 6.6.1. Eastern Europe Generative AI in Biotech Market Analysis by Country : Introduction
- 6.6.2. Market Size Absolute $ Opportunity Analysis and Forecast, Country , 2016-2032
- 6.6.2.1. Russia
- 6.6.2.2. Poland
- 6.6.2.3. The Czech Republic
- 6.6.2.4. Greece
- 6.6.2.5. Rest of Eastern Europe
- 7. APAC Generative AI in Biotech Market Analysis, Opportunity and Forecast, 2016-2032
- 7.1. APAC Generative AI in Biotech Market Analysis, 2016-2021
- 7.2. APAC Generative AI in Biotech Market Opportunity and Forecast, 2023-2032
- 7.3. APAC Generative AI in Biotech Market Analysis, Opportunity and Forecast, By Based on Technology, 2016-2032
- 7.3.1. APAC Generative AI in Biotech Market Analysis by Based on Technology: Introduction
- 7.3.2. Market Size Absolute $ Opportunity Analysis and Forecast, By Based on Technology, 2016-2032
- 7.3.3. Natural Language Processing (NLP)
- 7.3.4. Generative Adversarial Networks (GANs)
- 7.3.5. Variational Autoencoders (VAEs)
- 7.3.6. Reinforcement Learning
- 7.3.7. Other Technologies
- 7.4. APAC Generative AI in Biotech Market Analysis, Opportunity and Forecast, By Based on Applications, 2016-2032
- 7.4.1. APAC Generative AI in Biotech Market Analysis by Based on Applications: Introduction
- 7.4.2. Market Size Absolute $ Opportunity Analysis and Forecast, By Based on Applications, 2016-2032
- 7.4.3. Drug discovery
- 7.4.4. Protein engineering
- 7.4.5. Genomics
- 7.4.6. Bioinformatics
- 7.4.7. Other Applications
- 7.5. APAC Generative AI in Biotech Market Analysis, Opportunity and Forecast, By Based on End-Users, 2016-2032
- 7.5.1. APAC Generative AI in Biotech Market Analysis by Based on End-Users: Introduction
- 7.5.2. Market Size Absolute $ Opportunity Analysis and Forecast, By Based on End-Users, 2016-2032
- 7.5.3. Pharmaceutical companies
- 7.5.4. Biotechnology startups
- 7.5.5. Academic institutions
- 7.5.6. Research organizations
- 7.5.7. Other end-users
- 7.6. APAC Generative AI in Biotech Market Analysis, Opportunity and Forecast, By Country , 2016-2032
- 7.6.1. APAC Generative AI in Biotech Market Analysis by Country : Introduction
- 7.6.2. Market Size Absolute $ Opportunity Analysis and Forecast, Country , 2016-2032
- 7.6.2.1. China
- 7.6.2.2. Japan
- 7.6.2.3. South Korea
- 7.6.2.4. India
- 7.6.2.5. Australia & New Zeland
- 7.6.2.6. Indonesia
- 7.6.2.7. Malaysia
- 7.6.2.8. Philippines
- 7.6.2.9. Singapore
- 7.6.2.10. Thailand
- 7.6.2.11. Vietnam
- 7.6.2.12. Rest of APAC
- 8. Latin America Generative AI in Biotech Market Analysis, Opportunity and Forecast, 2016-2032
- 8.1. Latin America Generative AI in Biotech Market Analysis, 2016-2021
- 8.2. Latin America Generative AI in Biotech Market Opportunity and Forecast, 2023-2032
- 8.3. Latin America Generative AI in Biotech Market Analysis, Opportunity and Forecast, By Based on Technology, 2016-2032
- 8.3.1. Latin America Generative AI in Biotech Market Analysis by Based on Technology: Introduction
- 8.3.2. Market Size Absolute $ Opportunity Analysis and Forecast, By Based on Technology, 2016-2032
- 8.3.3. Natural Language Processing (NLP)
- 8.3.4. Generative Adversarial Networks (GANs)
- 8.3.5. Variational Autoencoders (VAEs)
- 8.3.6. Reinforcement Learning
- 8.3.7. Other Technologies
- 8.4. Latin America Generative AI in Biotech Market Analysis, Opportunity and Forecast, By Based on Applications, 2016-2032
- 8.4.1. Latin America Generative AI in Biotech Market Analysis by Based on Applications: Introduction
- 8.4.2. Market Size Absolute $ Opportunity Analysis and Forecast, By Based on Applications, 2016-2032
- 8.4.3. Drug discovery
- 8.4.4. Protein engineering
- 8.4.5. Genomics
- 8.4.6. Bioinformatics
- 8.4.7. Other Applications
- 8.5. Latin America Generative AI in Biotech Market Analysis, Opportunity and Forecast, By Based on End-Users, 2016-2032
- 8.5.1. Latin America Generative AI in Biotech Market Analysis by Based on End-Users: Introduction
- 8.5.2. Market Size Absolute $ Opportunity Analysis and Forecast, By Based on End-Users, 2016-2032
- 8.5.3. Pharmaceutical companies
- 8.5.4. Biotechnology startups
- 8.5.5. Academic institutions
- 8.5.6. Research organizations
- 8.5.7. Other end-users
- 8.6. Latin America Generative AI in Biotech Market Analysis, Opportunity and Forecast, By Country , 2016-2032
- 8.6.1. Latin America Generative AI in Biotech Market Analysis by Country : Introduction
- 8.6.2. Market Size Absolute $ Opportunity Analysis and Forecast, Country , 2016-2032
- 8.6.2.1. Brazil
- 8.6.2.2. Colombia
- 8.6.2.3. Chile
- 8.6.2.4. Argentina
- 8.6.2.5. Costa Rica
- 8.6.2.6. Rest of Latin America
- 9. Middle East & Africa Generative AI in Biotech Market Analysis, Opportunity and Forecast, 2016-2032
- 9.1. Middle East & Africa Generative AI in Biotech Market Analysis, 2016-2021
- 9.2. Middle East & Africa Generative AI in Biotech Market Opportunity and Forecast, 2023-2032
- 9.3. Middle East & Africa Generative AI in Biotech Market Analysis, Opportunity and Forecast, By Based on Technology, 2016-2032
- 9.3.1. Middle East & Africa Generative AI in Biotech Market Analysis by Based on Technology: Introduction
- 9.3.2. Market Size Absolute $ Opportunity Analysis and Forecast, By Based on Technology, 2016-2032
- 9.3.3. Natural Language Processing (NLP)
- 9.3.4. Generative Adversarial Networks (GANs)
- 9.3.5. Variational Autoencoders (VAEs)
- 9.3.6. Reinforcement Learning
- 9.3.7. Other Technologies
- 9.4. Middle East & Africa Generative AI in Biotech Market Analysis, Opportunity and Forecast, By Based on Applications, 2016-2032
- 9.4.1. Middle East & Africa Generative AI in Biotech Market Analysis by Based on Applications: Introduction
- 9.4.2. Market Size Absolute $ Opportunity Analysis and Forecast, By Based on Applications, 2016-2032
- 9.4.3. Drug discovery
- 9.4.4. Protein engineering
- 9.4.5. Genomics
- 9.4.6. Bioinformatics
- 9.4.7. Other Applications
- 9.5. Middle East & Africa Generative AI in Biotech Market Analysis, Opportunity and Forecast, By Based on End-Users, 2016-2032
- 9.5.1. Middle East & Africa Generative AI in Biotech Market Analysis by Based on End-Users: Introduction
- 9.5.2. Market Size Absolute $ Opportunity Analysis and Forecast, By Based on End-Users, 2016-2032
- 9.5.3. Pharmaceutical companies
- 9.5.4. Biotechnology startups
- 9.5.5. Academic institutions
- 9.5.6. Research organizations
- 9.5.7. Other end-users
- 9.6. Middle East & Africa Generative AI in Biotech Market Analysis, Opportunity and Forecast, By Country , 2016-2032
- 9.6.1. Middle East & Africa Generative AI in Biotech Market Analysis by Country : Introduction
- 9.6.2. Market Size Absolute $ Opportunity Analysis and Forecast, Country , 2016-2032
- 9.6.2.1. Algeria
- 9.6.2.2. Egypt
- 9.6.2.3. Israel
- 9.6.2.4. Kuwait
- 9.6.2.5. Nigeria
- 9.6.2.6. Saudi Arabia
- 9.6.2.7. South Africa
- 9.6.2.8. Turkey
- 9.6.2.9. The UAE
- 9.6.2.10. Rest of MEA
- 10. Global Generative AI in Biotech Market Analysis, Opportunity and Forecast, By Region , 2016-2032
- 10.1. Global Generative AI in Biotech Market Analysis by Region : Introduction
- 10.2. Market Size Absolute $ Opportunity Analysis and Forecast, By Region , 2016-2032
- 10.2.1. North America
- 10.2.2. Western Europe
- 10.2.3. Eastern Europe
- 10.2.4. APAC
- 10.2.5. Latin America
- 10.2.6. Middle East & Africa
- 11. Global Generative AI in Biotech Market Competitive Landscape, Market Share Analysis, and Company Profiles
- 11.1. Market Share Analysis
- 11.2. Company Profiles
- 11.3. Insilico Medicine
- 11.3.1. Company Overview
- 11.3.2. Financial Highlights
- 11.3.3. Product Portfolio
- 11.3.4. SWOT Analysis
- 11.3.5. Key Strategies and Developments
- 11.4. Recursion Pharmaceuticals
- 11.4.1. Company Overview
- 11.4.2. Financial Highlights
- 11.4.3. Product Portfolio
- 11.4.4. SWOT Analysis
- 11.4.5. Key Strategies and Developments
- 11.5. Atomwise
- 11.5.1. Company Overview
- 11.5.2. Financial Highlights
- 11.5.3. Product Portfolio
- 11.5.4. SWOT Analysis
- 11.5.5. Key Strategies and Developments
- 11.6. Deep Genomics
- 11.6.1. Company Overview
- 11.6.2. Financial Highlights
- 11.6.3. Product Portfolio
- 11.6.4. SWOT Analysis
- 11.6.5. Key Strategies and Developments
- 11.7. BenevolentAI
- 11.7.1. Company Overview
- 11.7.2. Financial Highlights
- 11.7.3. Product Portfolio
- 11.7.4. SWOT Analysis
- 11.7.5. Key Strategies and Developments
- 11.8. Numerate
- 11.8.1. Company Overview
- 11.8.2. Financial Highlights
- 11.8.3. Product Portfolio
- 11.8.4. SWOT Analysis
- 11.8.5. Key Strategies and Developments
- 11.9. Ginkgo Bioworks
- 11.9.1. Company Overview
- 11.9.2. Financial Highlights
- 11.9.3. Product Portfolio
- 11.9.4. SWOT Analysis
- 11.9.5. Key Strategies and Developments
- 11.10. Zymergen
- 11.10.1. Company Overview
- 11.10.2. Financial Highlights
- 11.10.3. Product Portfolio
- 11.10.4. SWOT Analysis
- 11.10.5. Key Strategies and Developments
- 11.11. OpenAI
- 11.11.1. Company Overview
- 11.11.2. Financial Highlights
- 11.11.3. Product Portfolio
- 11.11.4. SWOT Analysis
- 11.11.5. Key Strategies and Developments
- 11.12. DeepMind
- 11.12.1. Company Overview
- 11.12.2. Financial Highlights
- 11.12.3. Product Portfolio
- 11.12.4. SWOT Analysis
- 11.12.5. Key Strategies and Developments
- 11.13. Other Key Players
- 11.13.1. Company Overview
- 11.13.2. Financial Highlights
- 11.13.3. Product Portfolio
- 11.13.4. SWOT Analysis
- 11.13.5. Key Strategies and Developments
- 12. Assumptions and Acronyms
- 13. Research Methodology
- 14. Contact
- List of Figures
- Figure 1: Global Generative AI in Biotech Market Revenue (US$ Mn) Market Share by Based on Technology in 2022
- Figure 2: Global Generative AI in Biotech Market Attractiveness Analysis by Based on Technology, 2016-2032
- Figure 3: Global Generative AI in Biotech Market Revenue (US$ Mn) Market Share by Based on Applicationsin 2022
- Figure 4: Global Generative AI in Biotech Market Attractiveness Analysis by Based on Applications, 2016-2032
- Figure 5: Global Generative AI in Biotech Market Revenue (US$ Mn) Market Share by Based on End-Usersin 2022
- Figure 6: Global Generative AI in Biotech Market Attractiveness Analysis by Based on End-Users, 2016-2032
- Figure 7: Global Generative AI in Biotech Market Revenue (US$ Mn) Market Share by Region in 2022
- Figure 8: Global Generative AI in Biotech Market Attractiveness Analysis by Region, 2016-2032
- Figure 9: Global Generative AI in Biotech Market Revenue (US$ Mn) (2016-2032)
- Figure 10: Global Generative AI in Biotech Market Revenue (US$ Mn) Comparison by Region (2016-2032)
- Figure 11: Global Generative AI in Biotech Market Revenue (US$ Mn) Comparison by Based on Technology (2016-2032)
- Figure 12: Global Generative AI in Biotech Market Revenue (US$ Mn) Comparison by Based on Applications (2016-2032)
- Figure 13: Global Generative AI in Biotech Market Revenue (US$ Mn) Comparison by Based on End-Users (2016-2032)
- Figure 14: Global Generative AI in Biotech Market Y-o-Y Growth Rate Comparison by Region (2016-2032)
- Figure 15: Global Generative AI in Biotech Market Y-o-Y Growth Rate Comparison by Based on Technology (2016-2032)
- Figure 16: Global Generative AI in Biotech Market Y-o-Y Growth Rate Comparison by Based on Applications (2016-2032)
- Figure 17: Global Generative AI in Biotech Market Y-o-Y Growth Rate Comparison by Based on End-Users (2016-2032)
- Figure 18: Global Generative AI in Biotech Market Share Comparison by Region (2016-2032)
- Figure 19: Global Generative AI in Biotech Market Share Comparison by Based on Technology (2016-2032)
- Figure 20: Global Generative AI in Biotech Market Share Comparison by Based on Applications (2016-2032)
- Figure 21: Global Generative AI in Biotech Market Share Comparison by Based on End-Users (2016-2032)
- Figure 22: North America Generative AI in Biotech Market Revenue (US$ Mn) Market Share by Based on Technologyin 2022
- Figure 23: North America Generative AI in Biotech Market Attractiveness Analysis by Based on Technology, 2016-2032
- Figure 24: North America Generative AI in Biotech Market Revenue (US$ Mn) Market Share by Based on Applicationsin 2022
- Figure 25: North America Generative AI in Biotech Market Attractiveness Analysis by Based on Applications, 2016-2032
- Figure 26: North America Generative AI in Biotech Market Revenue (US$ Mn) Market Share by Based on End-Usersin 2022
- Figure 27: North America Generative AI in Biotech Market Attractiveness Analysis by Based on End-Users, 2016-2032
- Figure 28: North America Generative AI in Biotech Market Revenue (US$ Mn) Market Share by Country in 2022
- Figure 29: North America Generative AI in Biotech Market Attractiveness Analysis by Country, 2016-2032
- Figure 30: North America Generative AI in Biotech Market Revenue (US$ Mn) (2016-2032)
- Figure 31: North America Generative AI in Biotech Market Revenue (US$ Mn) Comparison by Country (2016-2032)
- Figure 32: North America Generative AI in Biotech Market Revenue (US$ Mn) Comparison by Based on Technology (2016-2032)
- Figure 33: North America Generative AI in Biotech Market Revenue (US$ Mn) Comparison by Based on Applications (2016-2032)
- Figure 34: North America Generative AI in Biotech Market Revenue (US$ Mn) Comparison by Based on End-Users (2016-2032)
- Figure 35: North America Generative AI in Biotech Market Y-o-Y Growth Rate Comparison by Country (2016-2032)
- Figure 36: North America Generative AI in Biotech Market Y-o-Y Growth Rate Comparison by Based on Technology (2016-2032)
- Figure 37: North America Generative AI in Biotech Market Y-o-Y Growth Rate Comparison by Based on Applications (2016-2032)
- Figure 38: North America Generative AI in Biotech Market Y-o-Y Growth Rate Comparison by Based on End-Users (2016-2032)
- Figure 39: North America Generative AI in Biotech Market Share Comparison by Country (2016-2032)
- Figure 40: North America Generative AI in Biotech Market Share Comparison by Based on Technology (2016-2032)
- Figure 41: North America Generative AI in Biotech Market Share Comparison by Based on Applications (2016-2032)
- Figure 42: North America Generative AI in Biotech Market Share Comparison by Based on End-Users (2016-2032)
- Figure 43: Western Europe Generative AI in Biotech Market Revenue (US$ Mn) Market Share by Based on Technologyin 2022
- Figure 44: Western Europe Generative AI in Biotech Market Attractiveness Analysis by Based on Technology, 2016-2032
- Figure 45: Western Europe Generative AI in Biotech Market Revenue (US$ Mn) Market Share by Based on Applicationsin 2022
- Figure 46: Western Europe Generative AI in Biotech Market Attractiveness Analysis by Based on Applications, 2016-2032
- Figure 47: Western Europe Generative AI in Biotech Market Revenue (US$ Mn) Market Share by Based on End-Usersin 2022
- Figure 48: Western Europe Generative AI in Biotech Market Attractiveness Analysis by Based on End-Users, 2016-2032
- Figure 49: Western Europe Generative AI in Biotech Market Revenue (US$ Mn) Market Share by Country in 2022
- Figure 50: Western Europe Generative AI in Biotech Market Attractiveness Analysis by Country, 2016-2032
- Figure 51: Western Europe Generative AI in Biotech Market Revenue (US$ Mn) (2016-2032)
- Figure 52: Western Europe Generative AI in Biotech Market Revenue (US$ Mn) Comparison by Country (2016-2032)
- Figure 53: Western Europe Generative AI in Biotech Market Revenue (US$ Mn) Comparison by Based on Technology (2016-2032)
- Figure 54: Western Europe Generative AI in Biotech Market Revenue (US$ Mn) Comparison by Based on Applications (2016-2032)
- Figure 55: Western Europe Generative AI in Biotech Market Revenue (US$ Mn) Comparison by Based on End-Users (2016-2032)
- Figure 56: Western Europe Generative AI in Biotech Market Y-o-Y Growth Rate Comparison by Country (2016-2032)
- Figure 57: Western Europe Generative AI in Biotech Market Y-o-Y Growth Rate Comparison by Based on Technology (2016-2032)
- Figure 58: Western Europe Generative AI in Biotech Market Y-o-Y Growth Rate Comparison by Based on Applications (2016-2032)
- Figure 59: Western Europe Generative AI in Biotech Market Y-o-Y Growth Rate Comparison by Based on End-Users (2016-2032)
- Figure 60: Western Europe Generative AI in Biotech Market Share Comparison by Country (2016-2032)
- Figure 61: Western Europe Generative AI in Biotech Market Share Comparison by Based on Technology (2016-2032)
- Figure 62: Western Europe Generative AI in Biotech Market Share Comparison by Based on Applications (2016-2032)
- Figure 63: Western Europe Generative AI in Biotech Market Share Comparison by Based on End-Users (2016-2032)
- Figure 64: Eastern Europe Generative AI in Biotech Market Revenue (US$ Mn) Market Share by Based on Technologyin 2022
- Figure 65: Eastern Europe Generative AI in Biotech Market Attractiveness Analysis by Based on Technology, 2016-2032
- Figure 66: Eastern Europe Generative AI in Biotech Market Revenue (US$ Mn) Market Share by Based on Applicationsin 2022
- Figure 67: Eastern Europe Generative AI in Biotech Market Attractiveness Analysis by Based on Applications, 2016-2032
- Figure 68: Eastern Europe Generative AI in Biotech Market Revenue (US$ Mn) Market Share by Based on End-Usersin 2022
- Figure 69: Eastern Europe Generative AI in Biotech Market Attractiveness Analysis by Based on End-Users, 2016-2032
- Figure 70: Eastern Europe Generative AI in Biotech Market Revenue (US$ Mn) Market Share by Country in 2022
- Figure 71: Eastern Europe Generative AI in Biotech Market Attractiveness Analysis by Country, 2016-2032
- Figure 72: Eastern Europe Generative AI in Biotech Market Revenue (US$ Mn) (2016-2032)
- Figure 73: Eastern Europe Generative AI in Biotech Market Revenue (US$ Mn) Comparison by Country (2016-2032)
- Figure 74: Eastern Europe Generative AI in Biotech Market Revenue (US$ Mn) Comparison by Based on Technology (2016-2032)
- Figure 75: Eastern Europe Generative AI in Biotech Market Revenue (US$ Mn) Comparison by Based on Applications (2016-2032)
- Figure 76: Eastern Europe Generative AI in Biotech Market Revenue (US$ Mn) Comparison by Based on End-Users (2016-2032)
- Figure 77: Eastern Europe Generative AI in Biotech Market Y-o-Y Growth Rate Comparison by Country (2016-2032)
- Figure 78: Eastern Europe Generative AI in Biotech Market Y-o-Y Growth Rate Comparison by Based on Technology (2016-2032)
- Figure 79: Eastern Europe Generative AI in Biotech Market Y-o-Y Growth Rate Comparison by Based on Applications (2016-2032)
- Figure 80: Eastern Europe Generative AI in Biotech Market Y-o-Y Growth Rate Comparison by Based on End-Users (2016-2032)
- Figure 81: Eastern Europe Generative AI in Biotech Market Share Comparison by Country (2016-2032)
- Figure 82: Eastern Europe Generative AI in Biotech Market Share Comparison by Based on Technology (2016-2032)
- Figure 83: Eastern Europe Generative AI in Biotech Market Share Comparison by Based on Applications (2016-2032)
- Figure 84: Eastern Europe Generative AI in Biotech Market Share Comparison by Based on End-Users (2016-2032)
- Figure 85: APAC Generative AI in Biotech Market Revenue (US$ Mn) Market Share by Based on Technologyin 2022
- Figure 86: APAC Generative AI in Biotech Market Attractiveness Analysis by Based on Technology, 2016-2032
- Figure 87: APAC Generative AI in Biotech Market Revenue (US$ Mn) Market Share by Based on Applicationsin 2022
- Figure 88: APAC Generative AI in Biotech Market Attractiveness Analysis by Based on Applications, 2016-2032
- Figure 89: APAC Generative AI in Biotech Market Revenue (US$ Mn) Market Share by Based on End-Usersin 2022
- Figure 90: APAC Generative AI in Biotech Market Attractiveness Analysis by Based on End-Users, 2016-2032
- Figure 91: APAC Generative AI in Biotech Market Revenue (US$ Mn) Market Share by Country in 2022
- Figure 92: APAC Generative AI in Biotech Market Attractiveness Analysis by Country, 2016-2032
- Figure 93: APAC Generative AI in Biotech Market Revenue (US$ Mn) (2016-2032)
- Figure 94: APAC Generative AI in Biotech Market Revenue (US$ Mn) Comparison by Country (2016-2032)
- Figure 95: APAC Generative AI in Biotech Market Revenue (US$ Mn) Comparison by Based on Technology (2016-2032)
- Figure 96: APAC Generative AI in Biotech Market Revenue (US$ Mn) Comparison by Based on Applications (2016-2032)
- Figure 97: APAC Generative AI in Biotech Market Revenue (US$ Mn) Comparison by Based on End-Users (2016-2032)
- Figure 98: APAC Generative AI in Biotech Market Y-o-Y Growth Rate Comparison by Country (2016-2032)
- Figure 99: APAC Generative AI in Biotech Market Y-o-Y Growth Rate Comparison by Based on Technology (2016-2032)
- Figure 100: APAC Generative AI in Biotech Market Y-o-Y Growth Rate Comparison by Based on Applications (2016-2032)
- Figure 101: APAC Generative AI in Biotech Market Y-o-Y Growth Rate Comparison by Based on End-Users (2016-2032)
- Figure 102: APAC Generative AI in Biotech Market Share Comparison by Country (2016-2032)
- Figure 103: APAC Generative AI in Biotech Market Share Comparison by Based on Technology (2016-2032)
- Figure 104: APAC Generative AI in Biotech Market Share Comparison by Based on Applications (2016-2032)
- Figure 105: APAC Generative AI in Biotech Market Share Comparison by Based on End-Users (2016-2032)
- Figure 106: Latin America Generative AI in Biotech Market Revenue (US$ Mn) Market Share by Based on Technologyin 2022
- Figure 107: Latin America Generative AI in Biotech Market Attractiveness Analysis by Based on Technology, 2016-2032
- Figure 108: Latin America Generative AI in Biotech Market Revenue (US$ Mn) Market Share by Based on Applicationsin 2022
- Figure 109: Latin America Generative AI in Biotech Market Attractiveness Analysis by Based on Applications, 2016-2032
- Figure 110: Latin America Generative AI in Biotech Market Revenue (US$ Mn) Market Share by Based on End-Usersin 2022
- Figure 111: Latin America Generative AI in Biotech Market Attractiveness Analysis by Based on End-Users, 2016-2032
- Figure 112: Latin America Generative AI in Biotech Market Revenue (US$ Mn) Market Share by Country in 2022
- Figure 113: Latin America Generative AI in Biotech Market Attractiveness Analysis by Country, 2016-2032
- Figure 114: Latin America Generative AI in Biotech Market Revenue (US$ Mn) (2016-2032)
- Figure 115: Latin America Generative AI in Biotech Market Revenue (US$ Mn) Comparison by Country (2016-2032)
- Figure 116: Latin America Generative AI in Biotech Market Revenue (US$ Mn) Comparison by Based on Technology (2016-2032)
- Figure 117: Latin America Generative AI in Biotech Market Revenue (US$ Mn) Comparison by Based on Applications (2016-2032)
- Figure 118: Latin America Generative AI in Biotech Market Revenue (US$ Mn) Comparison by Based on End-Users (2016-2032)
- Figure 119: Latin America Generative AI in Biotech Market Y-o-Y Growth Rate Comparison by Country (2016-2032)
- Figure 120: Latin America Generative AI in Biotech Market Y-o-Y Growth Rate Comparison by Based on Technology (2016-2032)
- Figure 121: Latin America Generative AI in Biotech Market Y-o-Y Growth Rate Comparison by Based on Applications (2016-2032)
- Figure 122: Latin America Generative AI in Biotech Market Y-o-Y Growth Rate Comparison by Based on End-Users (2016-2032)
- Figure 123: Latin America Generative AI in Biotech Market Share Comparison by Country (2016-2032)
- Figure 124: Latin America Generative AI in Biotech Market Share Comparison by Based on Technology (2016-2032)
- Figure 125: Latin America Generative AI in Biotech Market Share Comparison by Based on Applications (2016-2032)
- Figure 126: Latin America Generative AI in Biotech Market Share Comparison by Based on End-Users (2016-2032)
- Figure 127: Middle East & Africa Generative AI in Biotech Market Revenue (US$ Mn) Market Share by Based on Technologyin 2022
- Figure 128: Middle East & Africa Generative AI in Biotech Market Attractiveness Analysis by Based on Technology, 2016-2032
- Figure 129: Middle East & Africa Generative AI in Biotech Market Revenue (US$ Mn) Market Share by Based on Applicationsin 2022
- Figure 130: Middle East & Africa Generative AI in Biotech Market Attractiveness Analysis by Based on Applications, 2016-2032
- Figure 131: Middle East & Africa Generative AI in Biotech Market Revenue (US$ Mn) Market Share by Based on End-Usersin 2022
- Figure 132: Middle East & Africa Generative AI in Biotech Market Attractiveness Analysis by Based on End-Users, 2016-2032
- Figure 133: Middle East & Africa Generative AI in Biotech Market Revenue (US$ Mn) Market Share by Country in 2022
- Figure 134: Middle East & Africa Generative AI in Biotech Market Attractiveness Analysis by Country, 2016-2032
- Figure 135: Middle East & Africa Generative AI in Biotech Market Revenue (US$ Mn) (2016-2032)
- Figure 136: Middle East & Africa Generative AI in Biotech Market Revenue (US$ Mn) Comparison by Country (2016-2032)
- Figure 137: Middle East & Africa Generative AI in Biotech Market Revenue (US$ Mn) Comparison by Based on Technology (2016-2032)
- Figure 138: Middle East & Africa Generative AI in Biotech Market Revenue (US$ Mn) Comparison by Based on Applications (2016-2032)
- Figure 139: Middle East & Africa Generative AI in Biotech Market Revenue (US$ Mn) Comparison by Based on End-Users (2016-2032)
- Figure 140: Middle East & Africa Generative AI in Biotech Market Y-o-Y Growth Rate Comparison by Country (2016-2032)
- Figure 141: Middle East & Africa Generative AI in Biotech Market Y-o-Y Growth Rate Comparison by Based on Technology (2016-2032)
- Figure 142: Middle East & Africa Generative AI in Biotech Market Y-o-Y Growth Rate Comparison by Based on Applications (2016-2032)
- Figure 143: Middle East & Africa Generative AI in Biotech Market Y-o-Y Growth Rate Comparison by Based on End-Users (2016-2032)
- Figure 144: Middle East & Africa Generative AI in Biotech Market Share Comparison by Country (2016-2032)
- Figure 145: Middle East & Africa Generative AI in Biotech Market Share Comparison by Based on Technology (2016-2032)
- Figure 146: Middle East & Africa Generative AI in Biotech Market Share Comparison by Based on Applications (2016-2032)
- Figure 147: Middle East & Africa Generative AI in Biotech Market Share Comparison by Based on End-Users (2016-2032)
List of Tables
- Table 1: Global Generative AI in Biotech Market Comparison by Based on Technology (2016-2032)
- Table 2: Global Generative AI in Biotech Market Comparison by Based on Applications (2016-2032)
- Table 3: Global Generative AI in Biotech Market Comparison by Based on End-Users (2016-2032)
- Table 4: Global Generative AI in Biotech Market Revenue (US$ Mn) Comparison by Region (2016-2032)
- Table 5: Global Generative AI in Biotech Market Revenue (US$ Mn) (2016-2032)
- Table 6: Global Generative AI in Biotech Market Revenue (US$ Mn) Comparison by Region (2016-2032)
- Table 7: Global Generative AI in Biotech Market Revenue (US$ Mn) Comparison by Based on Technology (2016-2032)
- Table 8: Global Generative AI in Biotech Market Revenue (US$ Mn) Comparison by Based on Applications (2016-2032)
- Table 9: Global Generative AI in Biotech Market Revenue (US$ Mn) Comparison by Based on End-Users (2016-2032)
- Table 10: Global Generative AI in Biotech Market Y-o-Y Growth Rate Comparison by Region (2016-2032)
- Table 11: Global Generative AI in Biotech Market Y-o-Y Growth Rate Comparison by Based on Technology (2016-2032)
- Table 12: Global Generative AI in Biotech Market Y-o-Y Growth Rate Comparison by Based on Applications (2016-2032)
- Table 13: Global Generative AI in Biotech Market Y-o-Y Growth Rate Comparison by Based on End-Users (2016-2032)
- Table 14: Global Generative AI in Biotech Market Share Comparison by Region (2016-2032)
- Table 15: Global Generative AI in Biotech Market Share Comparison by Based on Technology (2016-2032)
- Table 16: Global Generative AI in Biotech Market Share Comparison by Based on Applications (2016-2032)
- Table 17: Global Generative AI in Biotech Market Share Comparison by Based on End-Users (2016-2032)
- Table 18: North America Generative AI in Biotech Market Comparison by Based on Applications (2016-2032)
- Table 19: North America Generative AI in Biotech Market Comparison by Based on End-Users (2016-2032)
- Table 20: North America Generative AI in Biotech Market Revenue (US$ Mn) Comparison by Country (2016-2032)
- Table 21: North America Generative AI in Biotech Market Revenue (US$ Mn) (2016-2032)
- Table 22: North America Generative AI in Biotech Market Revenue (US$ Mn) Comparison by Country (2016-2032)
- Table 23: North America Generative AI in Biotech Market Revenue (US$ Mn) Comparison by Based on Technology (2016-2032)
- Table 24: North America Generative AI in Biotech Market Revenue (US$ Mn) Comparison by Based on Applications (2016-2032)
- Table 25: North America Generative AI in Biotech Market Revenue (US$ Mn) Comparison by Based on End-Users (2016-2032)
- Table 26: North America Generative AI in Biotech Market Y-o-Y Growth Rate Comparison by Country (2016-2032)
- Table 27: North America Generative AI in Biotech Market Y-o-Y Growth Rate Comparison by Based on Technology (2016-2032)
- Table 28: North America Generative AI in Biotech Market Y-o-Y Growth Rate Comparison by Based on Applications (2016-2032)
- Table 29: North America Generative AI in Biotech Market Y-o-Y Growth Rate Comparison by Based on End-Users (2016-2032)
- Table 30: North America Generative AI in Biotech Market Share Comparison by Country (2016-2032)
- Table 31: North America Generative AI in Biotech Market Share Comparison by Based on Technology (2016-2032)
- Table 32: North America Generative AI in Biotech Market Share Comparison by Based on Applications (2016-2032)
- Table 33: North America Generative AI in Biotech Market Share Comparison by Based on End-Users (2016-2032)
- Table 34: Western Europe Generative AI in Biotech Market Comparison by Based on Technology (2016-2032)
- Table 35: Western Europe Generative AI in Biotech Market Comparison by Based on Applications (2016-2032)
- Table 36: Western Europe Generative AI in Biotech Market Comparison by Based on End-Users (2016-2032)
- Table 37: Western Europe Generative AI in Biotech Market Revenue (US$ Mn) Comparison by Country (2016-2032)
- Table 38: Western Europe Generative AI in Biotech Market Revenue (US$ Mn) (2016-2032)
- Table 39: Western Europe Generative AI in Biotech Market Revenue (US$ Mn) Comparison by Country (2016-2032)
- Table 40: Western Europe Generative AI in Biotech Market Revenue (US$ Mn) Comparison by Based on Technology (2016-2032)
- Table 41: Western Europe Generative AI in Biotech Market Revenue (US$ Mn) Comparison by Based on Applications (2016-2032)
- Table 42: Western Europe Generative AI in Biotech Market Revenue (US$ Mn) Comparison by Based on End-Users (2016-2032)
- Table 43: Western Europe Generative AI in Biotech Market Y-o-Y Growth Rate Comparison by Country (2016-2032)
- Table 44: Western Europe Generative AI in Biotech Market Y-o-Y Growth Rate Comparison by Based on Technology (2016-2032)
- Table 45: Western Europe Generative AI in Biotech Market Y-o-Y Growth Rate Comparison by Based on Applications (2016-2032)
- Table 46: Western Europe Generative AI in Biotech Market Y-o-Y Growth Rate Comparison by Based on End-Users (2016-2032)
- Table 47: Western Europe Generative AI in Biotech Market Share Comparison by Country (2016-2032)
- Table 48: Western Europe Generative AI in Biotech Market Share Comparison by Based on Technology (2016-2032)
- Table 49: Western Europe Generative AI in Biotech Market Share Comparison by Based on Applications (2016-2032)
- Table 50: Western Europe Generative AI in Biotech Market Share Comparison by Based on End-Users (2016-2032)
- Table 51: Eastern Europe Generative AI in Biotech Market Comparison by Based on Technology (2016-2032)
- Table 52: Eastern Europe Generative AI in Biotech Market Comparison by Based on Applications (2016-2032)
- Table 53: Eastern Europe Generative AI in Biotech Market Comparison by Based on End-Users (2016-2032)
- Table 54: Eastern Europe Generative AI in Biotech Market Revenue (US$ Mn) Comparison by Country (2016-2032)
- Table 55: Eastern Europe Generative AI in Biotech Market Revenue (US$ Mn) (2016-2032)
- Table 56: Eastern Europe Generative AI in Biotech Market Revenue (US$ Mn) Comparison by Country (2016-2032)
- Table 57: Eastern Europe Generative AI in Biotech Market Revenue (US$ Mn) Comparison by Based on Technology (2016-2032)
- Table 58: Eastern Europe Generative AI in Biotech Market Revenue (US$ Mn) Comparison by Based on Applications (2016-2032)
- Table 59: Eastern Europe Generative AI in Biotech Market Revenue (US$ Mn) Comparison by Based on End-Users (2016-2032)
- Table 60: Eastern Europe Generative AI in Biotech Market Y-o-Y Growth Rate Comparison by Country (2016-2032)
- Table 61: Eastern Europe Generative AI in Biotech Market Y-o-Y Growth Rate Comparison by Based on Technology (2016-2032)
- Table 62: Eastern Europe Generative AI in Biotech Market Y-o-Y Growth Rate Comparison by Based on Applications (2016-2032)
- Table 63: Eastern Europe Generative AI in Biotech Market Y-o-Y Growth Rate Comparison by Based on End-Users (2016-2032)
- Table 64: Eastern Europe Generative AI in Biotech Market Share Comparison by Country (2016-2032)
- Table 65: Eastern Europe Generative AI in Biotech Market Share Comparison by Based on Technology (2016-2032)
- Table 66: Eastern Europe Generative AI in Biotech Market Share Comparison by Based on Applications (2016-2032)
- Table 67: Eastern Europe Generative AI in Biotech Market Share Comparison by Based on End-Users (2016-2032)
- Table 68: APAC Generative AI in Biotech Market Comparison by Based on Technology (2016-2032)
- Table 69: APAC Generative AI in Biotech Market Comparison by Based on Applications (2016-2032)
- Table 70: APAC Generative AI in Biotech Market Comparison by Based on End-Users (2016-2032)
- Table 71: APAC Generative AI in Biotech Market Revenue (US$ Mn) Comparison by Country (2016-2032)
- Table 72: APAC Generative AI in Biotech Market Revenue (US$ Mn) (2016-2032)
- Table 73: APAC Generative AI in Biotech Market Revenue (US$ Mn) Comparison by Country (2016-2032)
- Table 74: APAC Generative AI in Biotech Market Revenue (US$ Mn) Comparison by Based on Technology (2016-2032)
- Table 75: APAC Generative AI in Biotech Market Revenue (US$ Mn) Comparison by Based on Applications (2016-2032)
- Table 76: APAC Generative AI in Biotech Market Revenue (US$ Mn) Comparison by Based on End-Users (2016-2032)
- Table 77: APAC Generative AI in Biotech Market Y-o-Y Growth Rate Comparison by Country (2016-2032)
- Table 78: APAC Generative AI in Biotech Market Y-o-Y Growth Rate Comparison by Based on Technology (2016-2032)
- Table 79: APAC Generative AI in Biotech Market Y-o-Y Growth Rate Comparison by Based on Applications (2016-2032)
- Table 80: APAC Generative AI in Biotech Market Y-o-Y Growth Rate Comparison by Based on End-Users (2016-2032)
- Table 81: APAC Generative AI in Biotech Market Share Comparison by Country (2016-2032)
- Table 82: APAC Generative AI in Biotech Market Share Comparison by Based on Technology (2016-2032)
- Table 83: APAC Generative AI in Biotech Market Share Comparison by Based on Applications (2016-2032)
- Table 84: APAC Generative AI in Biotech Market Share Comparison by Based on End-Users (2016-2032)
- Table 85: Latin America Generative AI in Biotech Market Comparison by Based on Technology (2016-2032)
- Table 86: Latin America Generative AI in Biotech Market Comparison by Based on Applications (2016-2032)
- Table 87: Latin America Generative AI in Biotech Market Comparison by Based on End-Users (2016-2032)
- Table 88: Latin America Generative AI in Biotech Market Revenue (US$ Mn) Comparison by Country (2016-2032)
- Table 89: Latin America Generative AI in Biotech Market Revenue (US$ Mn) (2016-2032)
- Table 90: Latin America Generative AI in Biotech Market Revenue (US$ Mn) Comparison by Country (2016-2032)
- Table 91: Latin America Generative AI in Biotech Market Revenue (US$ Mn) Comparison by Based on Technology (2016-2032)
- Table 92: Latin America Generative AI in Biotech Market Revenue (US$ Mn) Comparison by Based on Applications (2016-2032)
- Table 93: Latin America Generative AI in Biotech Market Revenue (US$ Mn) Comparison by Based on End-Users (2016-2032)
- Table 94: Latin America Generative AI in Biotech Market Y-o-Y Growth Rate Comparison by Country (2016-2032)
- Table 95: Latin America Generative AI in Biotech Market Y-o-Y Growth Rate Comparison by Based on Technology (2016-2032)
- Table 96: Latin America Generative AI in Biotech Market Y-o-Y Growth Rate Comparison by Based on Applications (2016-2032)
- Table 97: Latin America Generative AI in Biotech Market Y-o-Y Growth Rate Comparison by Based on End-Users (2016-2032)
- Table 98: Latin America Generative AI in Biotech Market Share Comparison by Country (2016-2032)
- Table 99: Latin America Generative AI in Biotech Market Share Comparison by Based on Technology (2016-2032)
- Table 100: Latin America Generative AI in Biotech Market Share Comparison by Based on Applications (2016-2032)
- Table 101: Latin America Generative AI in Biotech Market Share Comparison by Based on End-Users (2016-2032)
- Table 102: Middle East & Africa Generative AI in Biotech Market Comparison by Based on Technology (2016-2032)
- Table 103: Middle East & Africa Generative AI in Biotech Market Comparison by Based on Applications (2016-2032)
- Table 104: Middle East & Africa Generative AI in Biotech Market Comparison by Based on End-Users (2016-2032)
- Table 105: Middle East & Africa Generative AI in Biotech Market Revenue (US$ Mn) Comparison by Country (2016-2032)
- Table 106: Middle East & Africa Generative AI in Biotech Market Revenue (US$ Mn) (2016-2032)
- Table 107: Middle East & Africa Generative AI in Biotech Market Revenue (US$ Mn) Comparison by Country (2016-2032)
- Table 108: Middle East & Africa Generative AI in Biotech Market Revenue (US$ Mn) Comparison by Based on Technology (2016-2032)
- Table 109: Middle East & Africa Generative AI in Biotech Market Revenue (US$ Mn) Comparison by Based on Applications (2016-2032)
- Table 110: Middle East & Africa Generative AI in Biotech Market Revenue (US$ Mn) Comparison by Based on End-Users (2016-2032)
- Table 111: Middle East & Africa Generative AI in Biotech Market Y-o-Y Growth Rate Comparison by Country (2016-2032)
- Table 112: Middle East & Africa Generative AI in Biotech Market Y-o-Y Growth Rate Comparison by Based on Technology (2016-2032)
- Table 113: Middle East & Africa Generative AI in Biotech Market Y-o-Y Growth Rate Comparison by Based on Applications (2016-2032)
- Table 114: Middle East & Africa Generative AI in Biotech Market Y-o-Y Growth Rate Comparison by Based on End-Users (2016-2032)
- Table 115: Middle East & Africa Generative AI in Biotech Market Share Comparison by Country (2016-2032)
- Table 116: Middle East & Africa Generative AI in Biotech Market Share Comparison by Based on Technology (2016-2032)
- Table 117: Middle East & Africa Generative AI in Biotech Market Share Comparison by Based on Applications (2016-2032)
- Table 118: Middle East & Africa Generative AI in Biotech Market Share Comparison by Based on End-Users (2016-2032)
- 1. Executive Summary
-
- Insilico Medicine
- Recursion Pharmaceuticals
- Atomwise
- Deep Genomics
- BenevolentAI
- Numerate
- Ginkgo Bioworks
- Zymergen
- OpenAI
- DeepMind
- Other Key Players
Our Clients


View Our Licence Options
