
Global Generative AI in Supply Chain Market By Component (Solutions and Software), By Deployment Mode (Cloud-based and On-Premise), By End-User (Retail, Manufacturing, Healthcare, and Other End-Users), By Region and Companies - Industry Segment Outlook, Market Assessment, Competition Scenario, Trends, and Forecast 2023-2032
-
36886
-
July 2023
-
155
-


-
This report was compiled by Vishwa Gaul Vishwa is an experienced market research and consulting professional with over 8 years of expertise in the ICT industry, contributing to over 700 reports across telecommunications, software, hardware, and digital solutions. Correspondence Team Lead- ICT Linkedin | Detailed Market research Methodology Our methodology involves a mix of primary research, including interviews with leading mental health experts, and secondary research from reputable medical journals and databases. View Detailed Methodology Page
-
Quick Navigation
Report Overview
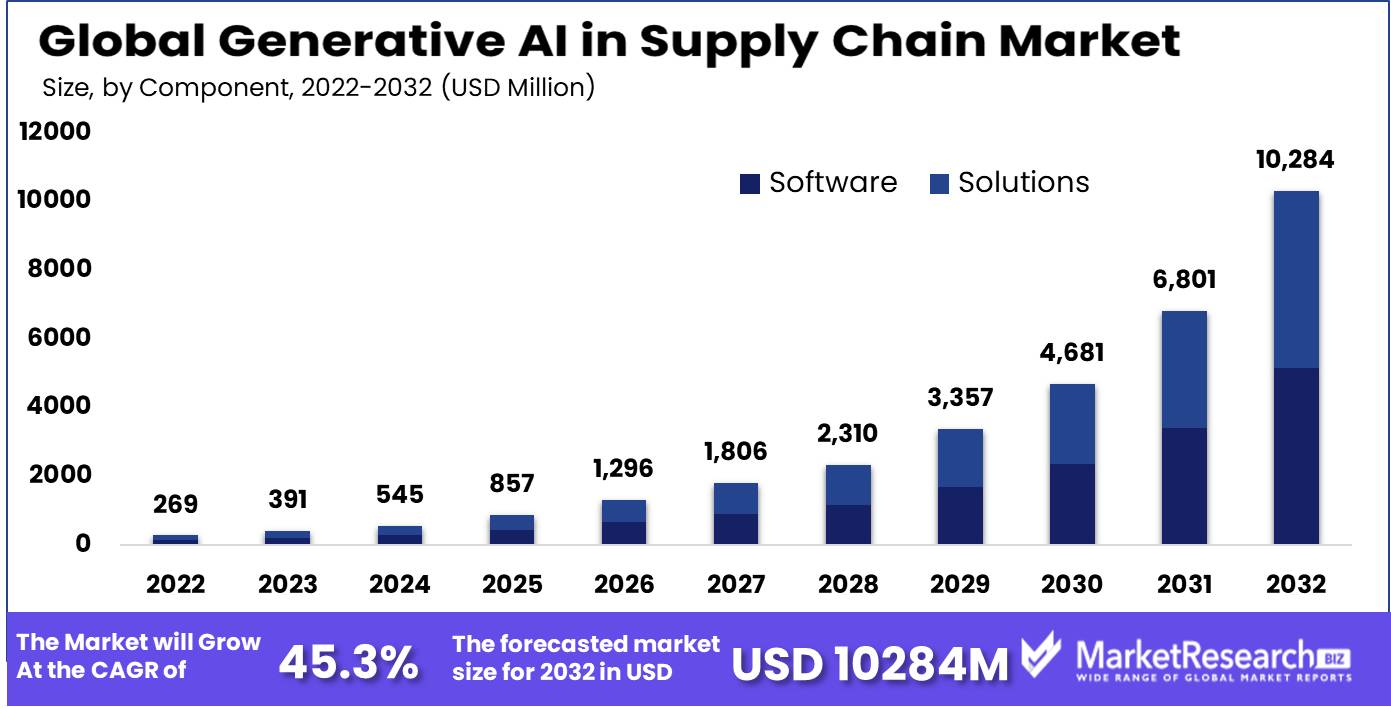
Global Generative AI in Supply Chain Market size is expected to be worth around USD 10,284 Mn by 2032 from USD 269 Mn in 2022, growing at a CAGR of 45.3% during the forecast period from 2023 to 2032.
Utilizing machine learning algorithms to produce fresh, original outputs based on already-existing data inputs is known as generative AI. The production, distribution, and delivery of goods and services are all handled through a complex network of organizations, assets, processes, and information known as the supply chain. It includes many phases, including manufacturing, logistics, and customer service. To optimize operations, cut costs, and satisfy consumer needs, firms must manage the supply chain effectively. Because it can analyze huge datasets, spot patterns, and produce insights and solutions, generative AI has attracted a lot of attention lately. Generative AI can be used in the supply chain to boost efficiency by streamlining procedures and enhancing decision-making.
Number might vary in actual report
Market Scope
Component Analysis
Based on components, generative AI in supply chain market is segmented into solutions and software. Among these types, both segments have lucrative in the global generative AI in supply chain market. Solutions typically refer to comprehensive packages or platforms that incorporate various software components to provide end-to-end generative AI capabilities for supply chain optimization, demand forecasting, inventory management, and other related tasks. On the other hand, software specifically focuses on the computer programs and algorithms used to develop and deploy generative AI models in the supply chain domain.
These software solutions may include machine learning libraries, data processing tools, optimization algorithms, and other software components required to build and operate generative AI systems. The dominance of either segment can vary depending on market dynamics, technological advancements, and specific business requirements.
Deployment Mode Analysis
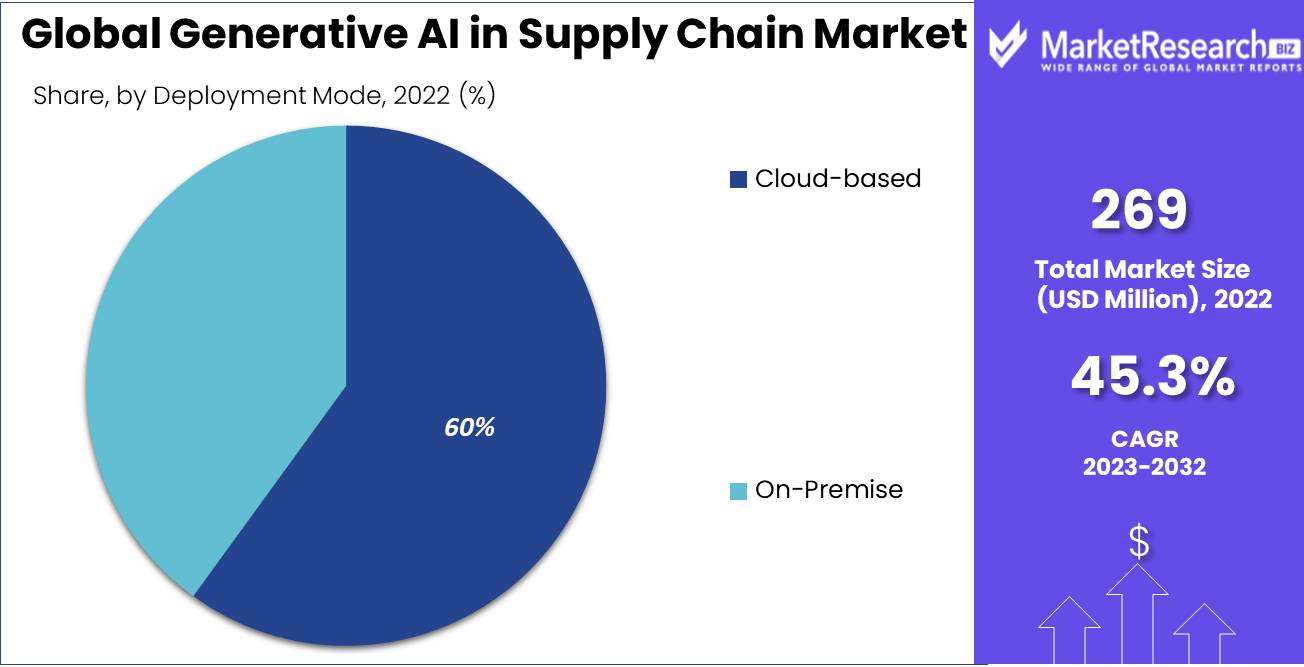
By deployment mode, the generative AI in supply chain market is further divided into cloud-based and on-premise. The cloud-based segment is estimated to be the most lucrative segment in the global generative AI in supply chain market. Cloud-based deployment has gained significant popularity in recent years due to its advantages such as scalability, flexibility, ease of implementation, and reduced infrastructure costs. Cloud-based solutions leverage remote servers and computing resources to process and analyze large volumes of data, making them well-suited for organizations with dynamic needs, limited IT resources, or a preference for outsourcing infrastructure management.
On-premise solutions involve installing and managing generative AI software and infrastructure within the organization's own data centers or servers. This approach offers greater control over data and infrastructure but may require higher upfront investments, increased maintenance efforts, and limited scalability compared to cloud-based alternatives.
Number might vary in actual report
End-User Analysis
Based on end-user, the generative AI in supply chain market is segmented into Retail, Manufacturing, Healthcare, and Other End-Users. Generative AI is transforming supply chain operations across various industries, empowering businesses to make data-driven decisions, enhance efficiency, and deliver better customer experiences. The retail sector is a significant end-user of generative AI in supply chain market. Retailers are leveraging generative AI technologies to optimize inventory management, demand forecasting, and supply chain logistics.
The healthcare sector is increasingly adopting generative AI in supply chain to improve patient care and optimize operations. AI algorithms can assist healthcare providers in managing medical inventory, tracking medical equipment, and optimizing supply chain logistics. The Other End-User category includes various industries such as logistics, transportation, agriculture, and energy.
Key Market Segments
Based on Component
- Solutions
- Software
Based on Deployment Mode
- Cloud-based
- On-Premise
Based on End-User
- Retail
- Manufacturing
- Healthcare
- Other End-Users
Market Dynamics
Drivers
By analyzing massive datasets, finding patterns, and producing insights to improve operations, generative AI aids organizations in managing this complexity. For supply chain management to be successful in the fast-paced business climate of today, real-time decision-making is essential. By analyzing and processing enormous volumes of data in real-time, generative AI enables businesses to assist rapid decision-making throughout the supply chain.
The capabilities of generative AI in the area of supply chains have increased thanks to the quick development of AI and machine learning technology. Utilizing generative AI for complicated supply chains is now viable because of improved algorithms, more powerful computers, and improved data analytics methods.
Restraints
The availability of high-quality and diverse datasets is crucial for generative AI. It might be difficult to gather and integrate pertinent data from multiple sources along the supply chain, though. A generative AI algorithm's performance and accuracy can be negatively impacted by incomplete or erroneous data, producing less-than-ideal results.
Large amounts of sensitive data, including those about customers, suppliers, and operational data, must be handled while using generative AI. A crucial concern is ensuring data privacy and upholding the security of this information. Businesses may face legal issues and reputational damage as a result of data breaches or improper handling.
Opportunity
To produce precise demand estimates, generative AI models can analyze historical data, industry patterns, and other pertinent aspects. Supply chain managers can use this to reduce stockouts, increase overall supply chain efficiency, and optimize inventory levels. Various scenarios and their potential effects on the supply chain can be simulated by generative AI models. Organizations can proactively create contingency plans to reduce risks and boost resilience by taking into account situations like supplier disruptions, market volatility, or natural disasters.
By creating a variety of prototypes depending on provided criteria, generative AI can help with product design. This can facilitate modification to fit unique consumer needs while also speeding up the design process and lowering costs. Considering variables like distance, traffic, delivery windows, and vehicle capacity, generative AI algorithms can optimize delivery routes.
Trends
The supply chain landscape is changing as a result of the digital revolution. To automate operations, increase visibility, and improve decision-making, businesses are implementing technologies like the Internet of Things (IoT), cloud computing, blockchain, and artificial intelligence (AI). E-commerce's expansion has increased the demand for effective omnichannel fulfillment. To support same-day delivery, direct-to-consumer orders, and seamless customer experiences across different channels, supply chain networks are being optimized.
Generative AI in Supply Chain Market, sustainable practices are becoming more and more important. To satisfy environmental goals and customer expectations, businesses are introducing eco-friendly efforts including reducing carbon footprints, using responsible sourcing practices, reducing waste, and adopting circular economy ideas.
COVID-19 Impact Analysis
The pandemic has caused substantial fluctuations in consumer demand for different products. Generative AI algorithms trained on historical data may struggle to accurately predict demand patterns during the pandemic due to the unprecedented and volatile nature of the market. Supply chain systems relying on generative AI models may face challenges in adjusting to sudden shifts in demand, leading to issues such as overstocking or understocking of goods. With supply chain disruptions and uncertain demand, effective inventory management has become crucial.
Generative AI can assist in optimizing inventory levels and improving demand forecasting. However, the pandemic has introduced additional complexities, such as the need to account for perishable goods, expiration dates, and shifting customer preferences. Adjustments to generative AI models may be required to handle these unique considerations.
Regional Analysis
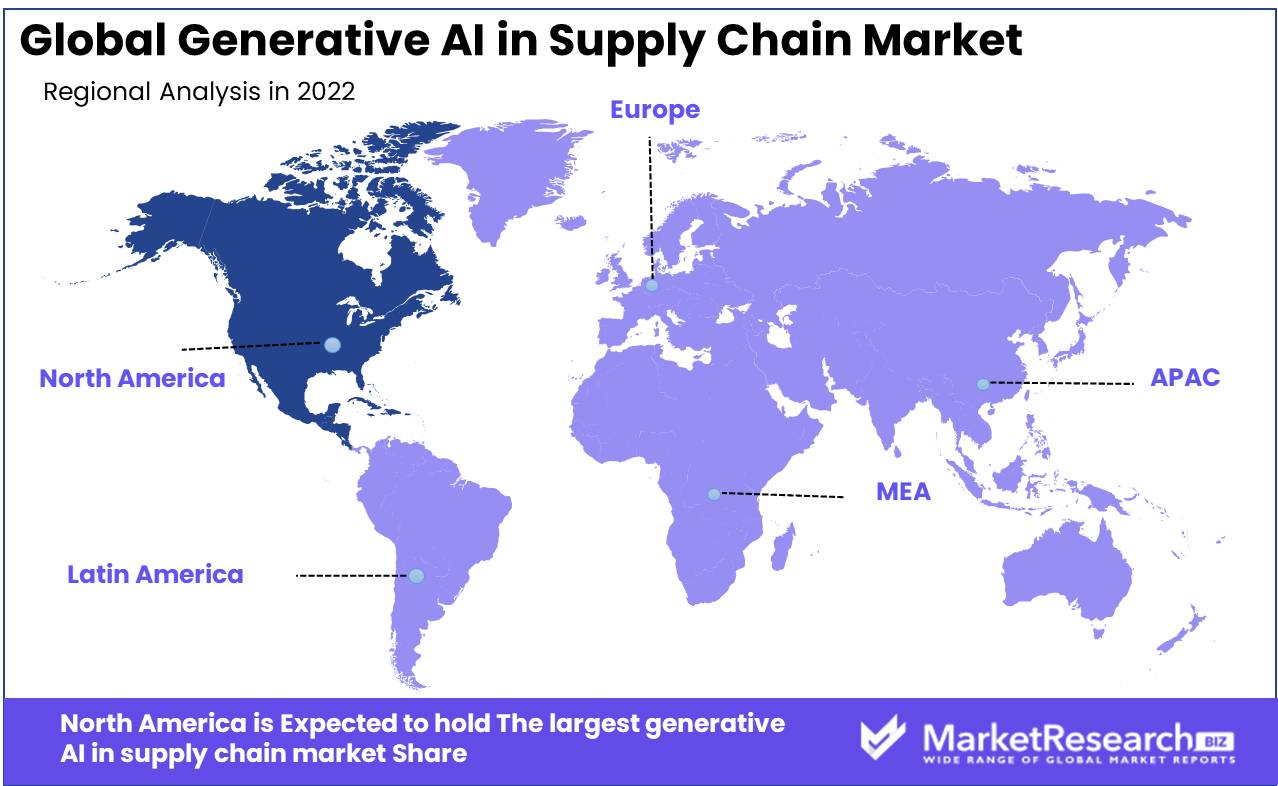
North America is estimated to be the most lucrative market in the global generative AI in supply chain market. The United States possesses a substantial presence in AI research and development as well as the global supply chain. The nation hosts major technology firms, research institutions, and innovative startups that drive progress in generative AI for supply chain applications. In Europe, there exists a robust AI research community with a strong emphasis on supply chain management.
Countries like Germany, the United Kingdom, and France have taken the lead in AI advancements within the region. European companies actively investigate generative AI applications to improve supply chain operations and logistics efficiency. It is worth noting that generative AI is a swiftly evolving field, and its potential in the supply chain is currently being explored and developed by organizations and researchers worldwide.
Number might vary in actual report
Key Regions
- North America
- The US
- Canada
- Mexico
- Western Europe
- Germany
- France
- The UK
- Spain
- Italy
- Portugal
- Ireland
- Austria
- Switzerland
- Benelux
- Nordic
- Rest of Western Europe
- Eastern Europe
- Russia
- Poland
- The Czech Republic
- Greece
- Rest of Eastern Europe
- APAC
- China
- Japan
- South Korea
- India
- Australia & New Zealand
- Indonesia
- Malaysia
- Philippines
- Singapore
- Thailand
- Vietnam
- Rest of APAC
- Latin America
- Brazil
- Colombia
- Chile
- Argentina
- Costa Rica
- Rest of Latin America
- Middle East & Africa
- Algeria
- Egypt
- Israel
- Kuwait
- Nigeria
- Saudi Arabia
- South Africa
- Turkey
- United Arab Emirates
- Rest of MEA
Emerging key players in the global generative AI in supply chain market are adopting diverse strategic approaches to enhance their business presence in international markets. Many companies are prioritizing the expansion of their existing operations and research and development (R&D) facilities. Additionally, players in the generative AI supply chain market are actively involved in developing new products and expanding their portfolios through investments, mergers, and acquisitions. Moreover, several key players are placing increased emphasis on marketing strategies aimed at raising awareness about the benefits of generative AI in optimizing supply chain processes, thereby fueling the growth of their offerings.
Market Key Players
- IBM Corporation
- Microsoft Corporation
- SAP SE
- Oracle Corporation
- Blue Yonder
- LLamasoft Inc
- AIMMS
- Other Key Players
Recent Developments
- IBM offers the Sterling Supply Chain Suite, which integrates various AI technologies, including generative AI, to optimize supply chain operations. The suite includes capabilities for demand forecasting, inventory optimization, order management, and supplier collaboration, among others.
- IBM Watson Supply Chain Insights is a solution that leverages AI and machine learning techniques, including generative AI, to provide end-to-end visibility and insights into supply chain operations. It helps organizations identify patterns, predict disruptions, and optimize decision-making for better supply chain performance.
- Microsoft's Project Bonsai aims to democratize AI and make it accessible to subject matter experts, including those in the supply chain domain. While the focus of Project Bonsai is broader than just generative AI, it provides tools and capabilities for developing intelligent systems that can optimize complex processes and decision-making in supply chain management.
Report Scope:
Report Features Description Market Value (2022) USD 269 Mn Forecast Revenue (2032) USD 10,284 Mn CAGR (2023-2032) 45.30% Base Year for Estimation 2022 Historic Period 2016-2022 Forecast Period 2023-2032 Report Coverage Revenue Forecast, Market Dynamics, COVID-19 Impact, Competitive Landscape, Recent Developments Segments Covered By Component - Solutions and Software; By Deployment Mode -Cloud-based and On-Premise; By End-User - Retail, Manufacturing, Healthcare, and Other End-Users Regional Analysis North America – The US, Canada, & Mexico; Western Europe – Germany, France, The UK, Spain, Italy, Portugal, Ireland, Austria, Switzerland, Benelux, Nordic, & Rest of Western Europe; Eastern Europe – Russia, Poland, The Czech Republic, Greece, & Rest of Eastern Europe; APAC – China, Japan, South Korea, India, Australia & New Zealand, Indonesia, Malaysia, Philippines, Singapore, Thailand, Vietnam, & Rest of APAC; Latin America – Brazil, Colombia, Chile, Argentina, Costa Rica, & Rest of Latin America; Middle East & Africa – Algeria, Egypt, Israel, Kuwait, Nigeria, Saudi Arabia, South Africa, Turkey, United Arab Emirates, & Rest of MEA Competitive Landscape IBM Corporation, Microsoft Corporation, SAP SE, Oracle Corporation Blue Yonder, LLamasoft Inc, AIMMS, Other Key Players
Customization Scope Customization for segments, region/country-level will be provided. Moreover, additional customization can be done based on the requirements. Purchase Options We have three licenses to opt for: Single User License, Multi-User License (Up to 5 Users), Corporate Use License (Unlimited User and Printable PDF) -
- 1. Executive Summary
- 1.1. Definition
- 1.2. Taxonomy
- 1.3. Research Scope
- 1.4. Key Analysis
- 1.5. Key Findings by Major Segments
- 1.6. Top strategies by Major Players
- 2. Global Generative AI in Supply Chain Market Overview
- 2.1. Generative AI in Supply Chain Market Dynamics
- 2.1.1. Drivers
- 2.1.2. Opportunities
- 2.1.3. Restraints
- 2.1.4. Challenges
- 2.2. Macro-economic Factors
- 2.3. Regulatory Framework
- 2.4. Market Investment Feasibility Index
- 2.5. PEST Analysis
- 2.6. PORTER’S Five Force Analysis
- 2.7. Drivers & Restraints Impact Analysis
- 2.8. Industry Chain Analysis
- 2.9. Cost Structure Analysis
- 2.10. Marketing Strategy
- 2.11. Russia-Ukraine War Impact Analysis
- 2.12. Opportunity Map Analysis
- 2.13. Market Competition Scenario Analysis
- 2.14. Product Life Cycle Analysis
- 2.15. Opportunity Orbits
- 2.16. Manufacturer Intensity Map
- 2.17. Major Companies sales by Value & Volume
- 2.1. Generative AI in Supply Chain Market Dynamics
- 3. Global Generative AI in Supply Chain Market Analysis, Opportunity and Forecast, 2016-2032
- 3.1. Global Generative AI in Supply Chain Market Analysis, 2016-2021
- 3.2. Global Generative AI in Supply Chain Market Opportunity and Forecast, 2023-2032
- 3.3. Global Generative AI in Supply Chain Market Analysis, Opportunity and Forecast, By Based on Component, 2016-2032
- 3.3.1. Global Generative AI in Supply Chain Market Analysis by Based on Component: Introduction
- 3.3.2. Market Size Absolute $ Opportunity Analysis and Forecast, By Based on Component, 2016-2032
- 3.3.3. Solution
- 3.3.4. Services
- 3.4. Global Generative AI in Supply Chain Market Analysis, Opportunity and Forecast, By Based on Deployment Mode, 2016-2032
- 3.4.1. Global Generative AI in Supply Chain Market Analysis by Based on Deployment Mode: Introduction
- 3.4.2. Market Size Absolute $ Opportunity Analysis and Forecast, By Based on Deployment Mode, 2016-2032
- 3.4.3. Cloud-based
- 3.4.4. On-Premise
- 3.5. Global Generative AI in Supply Chain Market Analysis, Opportunity and Forecast, By Based on End-User, 2016-2032
- 3.5.1. Global Generative AI in Supply Chain Market Analysis by Based on End-User: Introduction
- 3.5.2. Market Size Absolute $ Opportunity Analysis and Forecast, By Based on End-User, 2016-2032
- 3.5.3. Retail
- 3.5.4. Manufacturing
- 3.5.5. Healthcare
- 3.5.6. Other End-Users
- 4. North America Generative AI in Supply Chain Market Analysis, Opportunity and Forecast, 2016-2032
- 4.1. North America Generative AI in Supply Chain Market Analysis, 2016-2021
- 4.2. North America Generative AI in Supply Chain Market Opportunity and Forecast, 2023-2032
- 4.3. North America Generative AI in Supply Chain Market Analysis, Opportunity and Forecast, By Based on Component, 2016-2032
- 4.3.1. North America Generative AI in Supply Chain Market Analysis by Based on Component: Introduction
- 4.3.2. Market Size Absolute $ Opportunity Analysis and Forecast, By Based on Component, 2016-2032
- 4.3.3. Solution
- 4.3.4. Services
- 4.4. North America Generative AI in Supply Chain Market Analysis, Opportunity and Forecast, By Based on Deployment Mode, 2016-2032
- 4.4.1. North America Generative AI in Supply Chain Market Analysis by Based on Deployment Mode: Introduction
- 4.4.2. Market Size Absolute $ Opportunity Analysis and Forecast, By Based on Deployment Mode, 2016-2032
- 4.4.3. Cloud-based
- 4.4.4. On-Premise
- 4.5. North America Generative AI in Supply Chain Market Analysis, Opportunity and Forecast, By Based on End-User, 2016-2032
- 4.5.1. North America Generative AI in Supply Chain Market Analysis by Based on End-User: Introduction
- 4.5.2. Market Size Absolute $ Opportunity Analysis and Forecast, By Based on End-User, 2016-2032
- 4.5.3. Retail
- 4.5.4. Manufacturing
- 4.5.5. Healthcare
- 4.5.6. Other End-Users
- 4.6. North America Generative AI in Supply Chain Market Analysis, Opportunity and Forecast, By Country , 2016-2032
- 4.6.1. North America Generative AI in Supply Chain Market Analysis by Country : Introduction
- 4.6.2. Market Size Absolute $ Opportunity Analysis and Forecast, Country , 2016-2032
- 4.6.2.1. The US
- 4.6.2.2. Canada
- 4.6.2.3. Mexico
- 5. Western Europe Generative AI in Supply Chain Market Analysis, Opportunity and Forecast, 2016-2032
- 5.1. Western Europe Generative AI in Supply Chain Market Analysis, 2016-2021
- 5.2. Western Europe Generative AI in Supply Chain Market Opportunity and Forecast, 2023-2032
- 5.3. Western Europe Generative AI in Supply Chain Market Analysis, Opportunity and Forecast, By Based on Component, 2016-2032
- 5.3.1. Western Europe Generative AI in Supply Chain Market Analysis by Based on Component: Introduction
- 5.3.2. Market Size Absolute $ Opportunity Analysis and Forecast, By Based on Component, 2016-2032
- 5.3.3. Solution
- 5.3.4. Services
- 5.4. Western Europe Generative AI in Supply Chain Market Analysis, Opportunity and Forecast, By Based on Deployment Mode, 2016-2032
- 5.4.1. Western Europe Generative AI in Supply Chain Market Analysis by Based on Deployment Mode: Introduction
- 5.4.2. Market Size Absolute $ Opportunity Analysis and Forecast, By Based on Deployment Mode, 2016-2032
- 5.4.3. Cloud-based
- 5.4.4. On-Premise
- 5.5. Western Europe Generative AI in Supply Chain Market Analysis, Opportunity and Forecast, By Based on End-User, 2016-2032
- 5.5.1. Western Europe Generative AI in Supply Chain Market Analysis by Based on End-User: Introduction
- 5.5.2. Market Size Absolute $ Opportunity Analysis and Forecast, By Based on End-User, 2016-2032
- 5.5.3. Retail
- 5.5.4. Manufacturing
- 5.5.5. Healthcare
- 5.5.6. Other End-Users
- 5.6. Western Europe Generative AI in Supply Chain Market Analysis, Opportunity and Forecast, By Country , 2016-2032
- 5.6.1. Western Europe Generative AI in Supply Chain Market Analysis by Country : Introduction
- 5.6.2. Market Size Absolute $ Opportunity Analysis and Forecast, Country , 2016-2032
- 5.6.2.1. Germany
- 5.6.2.2. France
- 5.6.2.3. The UK
- 5.6.2.4. Spain
- 5.6.2.5. Italy
- 5.6.2.6. Portugal
- 5.6.2.7. Ireland
- 5.6.2.8. Austria
- 5.6.2.9. Switzerland
- 5.6.2.10. Benelux
- 5.6.2.11. Nordic
- 5.6.2.12. Rest of Western Europe
- 6. Eastern Europe Generative AI in Supply Chain Market Analysis, Opportunity and Forecast, 2016-2032
- 6.1. Eastern Europe Generative AI in Supply Chain Market Analysis, 2016-2021
- 6.2. Eastern Europe Generative AI in Supply Chain Market Opportunity and Forecast, 2023-2032
- 6.3. Eastern Europe Generative AI in Supply Chain Market Analysis, Opportunity and Forecast, By Based on Component, 2016-2032
- 6.3.1. Eastern Europe Generative AI in Supply Chain Market Analysis by Based on Component: Introduction
- 6.3.2. Market Size Absolute $ Opportunity Analysis and Forecast, By Based on Component, 2016-2032
- 6.3.3. Solution
- 6.3.4. Services
- 6.4. Eastern Europe Generative AI in Supply Chain Market Analysis, Opportunity and Forecast, By Based on Deployment Mode, 2016-2032
- 6.4.1. Eastern Europe Generative AI in Supply Chain Market Analysis by Based on Deployment Mode: Introduction
- 6.4.2. Market Size Absolute $ Opportunity Analysis and Forecast, By Based on Deployment Mode, 2016-2032
- 6.4.3. Cloud-based
- 6.4.4. On-Premise
- 6.5. Eastern Europe Generative AI in Supply Chain Market Analysis, Opportunity and Forecast, By Based on End-User, 2016-2032
- 6.5.1. Eastern Europe Generative AI in Supply Chain Market Analysis by Based on End-User: Introduction
- 6.5.2. Market Size Absolute $ Opportunity Analysis and Forecast, By Based on End-User, 2016-2032
- 6.5.3. Retail
- 6.5.4. Manufacturing
- 6.5.5. Healthcare
- 6.5.6. Other End-Users
- 6.6. Eastern Europe Generative AI in Supply Chain Market Analysis, Opportunity and Forecast, By Country , 2016-2032
- 6.6.1. Eastern Europe Generative AI in Supply Chain Market Analysis by Country : Introduction
- 6.6.2. Market Size Absolute $ Opportunity Analysis and Forecast, Country , 2016-2032
- 6.6.2.1. Russia
- 6.6.2.2. Poland
- 6.6.2.3. The Czech Republic
- 6.6.2.4. Greece
- 6.6.2.5. Rest of Eastern Europe
- 7. APAC Generative AI in Supply Chain Market Analysis, Opportunity and Forecast, 2016-2032
- 7.1. APAC Generative AI in Supply Chain Market Analysis, 2016-2021
- 7.2. APAC Generative AI in Supply Chain Market Opportunity and Forecast, 2023-2032
- 7.3. APAC Generative AI in Supply Chain Market Analysis, Opportunity and Forecast, By Based on Component, 2016-2032
- 7.3.1. APAC Generative AI in Supply Chain Market Analysis by Based on Component: Introduction
- 7.3.2. Market Size Absolute $ Opportunity Analysis and Forecast, By Based on Component, 2016-2032
- 7.3.3. Solution
- 7.3.4. Services
- 7.4. APAC Generative AI in Supply Chain Market Analysis, Opportunity and Forecast, By Based on Deployment Mode, 2016-2032
- 7.4.1. APAC Generative AI in Supply Chain Market Analysis by Based on Deployment Mode: Introduction
- 7.4.2. Market Size Absolute $ Opportunity Analysis and Forecast, By Based on Deployment Mode, 2016-2032
- 7.4.3. Cloud-based
- 7.4.4. On-Premise
- 7.5. APAC Generative AI in Supply Chain Market Analysis, Opportunity and Forecast, By Based on End-User, 2016-2032
- 7.5.1. APAC Generative AI in Supply Chain Market Analysis by Based on End-User: Introduction
- 7.5.2. Market Size Absolute $ Opportunity Analysis and Forecast, By Based on End-User, 2016-2032
- 7.5.3. Retail
- 7.5.4. Manufacturing
- 7.5.5. Healthcare
- 7.5.6. Other End-Users
- 7.6. APAC Generative AI in Supply Chain Market Analysis, Opportunity and Forecast, By Country , 2016-2032
- 7.6.1. APAC Generative AI in Supply Chain Market Analysis by Country : Introduction
- 7.6.2. Market Size Absolute $ Opportunity Analysis and Forecast, Country , 2016-2032
- 7.6.2.1. China
- 7.6.2.2. Japan
- 7.6.2.3. South Korea
- 7.6.2.4. India
- 7.6.2.5. Australia & New Zeland
- 7.6.2.6. Indonesia
- 7.6.2.7. Malaysia
- 7.6.2.8. Philippines
- 7.6.2.9. Singapore
- 7.6.2.10. Thailand
- 7.6.2.11. Vietnam
- 7.6.2.12. Rest of APAC
- 8. Latin America Generative AI in Supply Chain Market Analysis, Opportunity and Forecast, 2016-2032
- 8.1. Latin America Generative AI in Supply Chain Market Analysis, 2016-2021
- 8.2. Latin America Generative AI in Supply Chain Market Opportunity and Forecast, 2023-2032
- 8.3. Latin America Generative AI in Supply Chain Market Analysis, Opportunity and Forecast, By Based on Component, 2016-2032
- 8.3.1. Latin America Generative AI in Supply Chain Market Analysis by Based on Component: Introduction
- 8.3.2. Market Size Absolute $ Opportunity Analysis and Forecast, By Based on Component, 2016-2032
- 8.3.3. Solution
- 8.3.4. Services
- 8.4. Latin America Generative AI in Supply Chain Market Analysis, Opportunity and Forecast, By Based on Deployment Mode, 2016-2032
- 8.4.1. Latin America Generative AI in Supply Chain Market Analysis by Based on Deployment Mode: Introduction
- 8.4.2. Market Size Absolute $ Opportunity Analysis and Forecast, By Based on Deployment Mode, 2016-2032
- 8.4.3. Cloud-based
- 8.4.4. On-Premise
- 8.5. Latin America Generative AI in Supply Chain Market Analysis, Opportunity and Forecast, By Based on End-User, 2016-2032
- 8.5.1. Latin America Generative AI in Supply Chain Market Analysis by Based on End-User: Introduction
- 8.5.2. Market Size Absolute $ Opportunity Analysis and Forecast, By Based on End-User, 2016-2032
- 8.5.3. Retail
- 8.5.4. Manufacturing
- 8.5.5. Healthcare
- 8.5.6. Other End-Users
- 8.6. Latin America Generative AI in Supply Chain Market Analysis, Opportunity and Forecast, By Country , 2016-2032
- 8.6.1. Latin America Generative AI in Supply Chain Market Analysis by Country : Introduction
- 8.6.2. Market Size Absolute $ Opportunity Analysis and Forecast, Country , 2016-2032
- 8.6.2.1. Brazil
- 8.6.2.2. Colombia
- 8.6.2.3. Chile
- 8.6.2.4. Argentina
- 8.6.2.5. Costa Rica
- 8.6.2.6. Rest of Latin America
- 9. Middle East & Africa Generative AI in Supply Chain Market Analysis, Opportunity and Forecast, 2016-2032
- 9.1. Middle East & Africa Generative AI in Supply Chain Market Analysis, 2016-2021
- 9.2. Middle East & Africa Generative AI in Supply Chain Market Opportunity and Forecast, 2023-2032
- 9.3. Middle East & Africa Generative AI in Supply Chain Market Analysis, Opportunity and Forecast, By Based on Component, 2016-2032
- 9.3.1. Middle East & Africa Generative AI in Supply Chain Market Analysis by Based on Component: Introduction
- 9.3.2. Market Size Absolute $ Opportunity Analysis and Forecast, By Based on Component, 2016-2032
- 9.3.3. Solution
- 9.3.4. Services
- 9.4. Middle East & Africa Generative AI in Supply Chain Market Analysis, Opportunity and Forecast, By Based on Deployment Mode, 2016-2032
- 9.4.1. Middle East & Africa Generative AI in Supply Chain Market Analysis by Based on Deployment Mode: Introduction
- 9.4.2. Market Size Absolute $ Opportunity Analysis and Forecast, By Based on Deployment Mode, 2016-2032
- 9.4.3. Cloud-based
- 9.4.4. On-Premise
- 9.5. Middle East & Africa Generative AI in Supply Chain Market Analysis, Opportunity and Forecast, By Based on End-User, 2016-2032
- 9.5.1. Middle East & Africa Generative AI in Supply Chain Market Analysis by Based on End-User: Introduction
- 9.5.2. Market Size Absolute $ Opportunity Analysis and Forecast, By Based on End-User, 2016-2032
- 9.5.3. Retail
- 9.5.4. Manufacturing
- 9.5.5. Healthcare
- 9.5.6. Other End-Users
- 9.6. Middle East & Africa Generative AI in Supply Chain Market Analysis, Opportunity and Forecast, By Country , 2016-2032
- 9.6.1. Middle East & Africa Generative AI in Supply Chain Market Analysis by Country : Introduction
- 9.6.2. Market Size Absolute $ Opportunity Analysis and Forecast, Country , 2016-2032
- 9.6.2.1. Algeria
- 9.6.2.2. Egypt
- 9.6.2.3. Israel
- 9.6.2.4. Kuwait
- 9.6.2.5. Nigeria
- 9.6.2.6. Saudi Arabia
- 9.6.2.7. South Africa
- 9.6.2.8. Turkey
- 9.6.2.9. The UAE
- 9.6.2.10. Rest of MEA
- 10. Global Generative AI in Supply Chain Market Analysis, Opportunity and Forecast, By Region , 2016-2032
- 10.1. Global Generative AI in Supply Chain Market Analysis by Region : Introduction
- 10.2. Market Size Absolute $ Opportunity Analysis and Forecast, By Region , 2016-2032
- 10.2.1. North America
- 10.2.2. Western Europe
- 10.2.3. Eastern Europe
- 10.2.4. APAC
- 10.2.5. Latin America
- 10.2.6. Middle East & Africa
- 11. Global Generative AI in Supply Chain Market Competitive Landscape, Market Share Analysis, and Company Profiles
- 11.1. Market Share Analysis
- 11.2. Company Profiles
- 11.3. IBM Corporation
- 11.3.1. Company Overview
- 11.3.2. Financial Highlights
- 11.3.3. Product Portfolio
- 11.3.4. SWOT Analysis
- 11.3.5. Key Strategies and Developments
- 11.4. Microsoft Corporation
- 11.4.1. Company Overview
- 11.4.2. Financial Highlights
- 11.4.3. Product Portfolio
- 11.4.4. SWOT Analysis
- 11.4.5. Key Strategies and Developments
- 11.5. SAP SE
- 11.5.1. Company Overview
- 11.5.2. Financial Highlights
- 11.5.3. Product Portfolio
- 11.5.4. SWOT Analysis
- 11.5.5. Key Strategies and Developments
- 11.6. Oracle Corporation
- 11.6.1. Company Overview
- 11.6.2. Financial Highlights
- 11.6.3. Product Portfolio
- 11.6.4. SWOT Analysis
- 11.6.5. Key Strategies and Developments
- 11.7. Blue Yonder
- 11.7.1. Company Overview
- 11.7.2. Financial Highlights
- 11.7.3. Product Portfolio
- 11.7.4. SWOT Analysis
- 11.7.5. Key Strategies and Developments
- 11.8. LLamasoft Inc
- 11.8.1. Company Overview
- 11.8.2. Financial Highlights
- 11.8.3. Product Portfolio
- 11.8.4. SWOT Analysis
- 11.8.5. Key Strategies and Developments
- 11.9. AIMMS
- 11.9.1. Company Overview
- 11.9.2. Financial Highlights
- 11.9.3. Product Portfolio
- 11.9.4. SWOT Analysis
- 11.9.5. Key Strategies and Developments
- 11.10. Other Key Players
- 11.10.1. Company Overview
- 11.10.2. Financial Highlights
- 11.10.3. Product Portfolio
- 11.10.4. SWOT Analysis
- 11.10.5. Key Strategies and Developments
- 12. Assumptions and Acronyms
- 13. Research Methodology
- 14. Contact
List of Figures
- Figure 1: Global Generative AI in Supply Chain Market Revenue (US$ Mn) Market Share by Based on Component in 2022
- Figure 2: Global Generative AI in Supply Chain Market Attractiveness Analysis by Based on Component, 2016-2032
- Figure 3: Global Generative AI in Supply Chain Market Revenue (US$ Mn) Market Share by Based on Deployment Modein 2022
- Figure 4: Global Generative AI in Supply Chain Market Attractiveness Analysis by Based on Deployment Mode, 2016-2032
- Figure 5: Global Generative AI in Supply Chain Market Revenue (US$ Mn) Market Share by Based on End-Userin 2022
- Figure 6: Global Generative AI in Supply Chain Market Attractiveness Analysis by Based on End-User, 2016-2032
- Figure 7: Global Generative AI in Supply Chain Market Revenue (US$ Mn) Market Share by Region in 2022
- Figure 8: Global Generative AI in Supply Chain Market Attractiveness Analysis by Region, 2016-2032
- Figure 9: Global Generative AI in Supply Chain Market Revenue (US$ Mn) (2016-2032)
- Figure 10: Global Generative AI in Supply Chain Market Revenue (US$ Mn) Comparison by Region (2016-2032)
- Figure 11: Global Generative AI in Supply Chain Market Revenue (US$ Mn) Comparison by Based on Component (2016-2032)
- Figure 12: Global Generative AI in Supply Chain Market Revenue (US$ Mn) Comparison by Based on Deployment Mode (2016-2032)
- Figure 13: Global Generative AI in Supply Chain Market Revenue (US$ Mn) Comparison by Based on End-User (2016-2032)
- Figure 14: Global Generative AI in Supply Chain Market Y-o-Y Growth Rate Comparison by Region (2016-2032)
- Figure 15: Global Generative AI in Supply Chain Market Y-o-Y Growth Rate Comparison by Based on Component (2016-2032)
- Figure 16: Global Generative AI in Supply Chain Market Y-o-Y Growth Rate Comparison by Based on Deployment Mode (2016-2032)
- Figure 17: Global Generative AI in Supply Chain Market Y-o-Y Growth Rate Comparison by Based on End-User (2016-2032)
- Figure 18: Global Generative AI in Supply Chain Market Share Comparison by Region (2016-2032)
- Figure 19: Global Generative AI in Supply Chain Market Share Comparison by Based on Component (2016-2032)
- Figure 20: Global Generative AI in Supply Chain Market Share Comparison by Based on Deployment Mode (2016-2032)
- Figure 21: Global Generative AI in Supply Chain Market Share Comparison by Based on End-User (2016-2032)
- Figure 22: North America Generative AI in Supply Chain Market Revenue (US$ Mn) Market Share by Based on Componentin 2022
- Figure 23: North America Generative AI in Supply Chain Market Attractiveness Analysis by Based on Component, 2016-2032
- Figure 24: North America Generative AI in Supply Chain Market Revenue (US$ Mn) Market Share by Based on Deployment Modein 2022
- Figure 25: North America Generative AI in Supply Chain Market Attractiveness Analysis by Based on Deployment Mode, 2016-2032
- Figure 26: North America Generative AI in Supply Chain Market Revenue (US$ Mn) Market Share by Based on End-Userin 2022
- Figure 27: North America Generative AI in Supply Chain Market Attractiveness Analysis by Based on End-User, 2016-2032
- Figure 28: North America Generative AI in Supply Chain Market Revenue (US$ Mn) Market Share by Country in 2022
- Figure 29: North America Generative AI in Supply Chain Market Attractiveness Analysis by Country, 2016-2032
- Figure 30: North America Generative AI in Supply Chain Market Revenue (US$ Mn) (2016-2032)
- Figure 31: North America Generative AI in Supply Chain Market Revenue (US$ Mn) Comparison by Country (2016-2032)
- Figure 32: North America Generative AI in Supply Chain Market Revenue (US$ Mn) Comparison by Based on Component (2016-2032)
- Figure 33: North America Generative AI in Supply Chain Market Revenue (US$ Mn) Comparison by Based on Deployment Mode (2016-2032)
- Figure 34: North America Generative AI in Supply Chain Market Revenue (US$ Mn) Comparison by Based on End-User (2016-2032)
- Figure 35: North America Generative AI in Supply Chain Market Y-o-Y Growth Rate Comparison by Country (2016-2032)
- Figure 36: North America Generative AI in Supply Chain Market Y-o-Y Growth Rate Comparison by Based on Component (2016-2032)
- Figure 37: North America Generative AI in Supply Chain Market Y-o-Y Growth Rate Comparison by Based on Deployment Mode (2016-2032)
- Figure 38: North America Generative AI in Supply Chain Market Y-o-Y Growth Rate Comparison by Based on End-User (2016-2032)
- Figure 39: North America Generative AI in Supply Chain Market Share Comparison by Country (2016-2032)
- Figure 40: North America Generative AI in Supply Chain Market Share Comparison by Based on Component (2016-2032)
- Figure 41: North America Generative AI in Supply Chain Market Share Comparison by Based on Deployment Mode (2016-2032)
- Figure 42: North America Generative AI in Supply Chain Market Share Comparison by Based on End-User (2016-2032)
- Figure 43: Western Europe Generative AI in Supply Chain Market Revenue (US$ Mn) Market Share by Based on Componentin 2022
- Figure 44: Western Europe Generative AI in Supply Chain Market Attractiveness Analysis by Based on Component, 2016-2032
- Figure 45: Western Europe Generative AI in Supply Chain Market Revenue (US$ Mn) Market Share by Based on Deployment Modein 2022
- Figure 46: Western Europe Generative AI in Supply Chain Market Attractiveness Analysis by Based on Deployment Mode, 2016-2032
- Figure 47: Western Europe Generative AI in Supply Chain Market Revenue (US$ Mn) Market Share by Based on End-Userin 2022
- Figure 48: Western Europe Generative AI in Supply Chain Market Attractiveness Analysis by Based on End-User, 2016-2032
- Figure 49: Western Europe Generative AI in Supply Chain Market Revenue (US$ Mn) Market Share by Country in 2022
- Figure 50: Western Europe Generative AI in Supply Chain Market Attractiveness Analysis by Country, 2016-2032
- Figure 51: Western Europe Generative AI in Supply Chain Market Revenue (US$ Mn) (2016-2032)
- Figure 52: Western Europe Generative AI in Supply Chain Market Revenue (US$ Mn) Comparison by Country (2016-2032)
- Figure 53: Western Europe Generative AI in Supply Chain Market Revenue (US$ Mn) Comparison by Based on Component (2016-2032)
- Figure 54: Western Europe Generative AI in Supply Chain Market Revenue (US$ Mn) Comparison by Based on Deployment Mode (2016-2032)
- Figure 55: Western Europe Generative AI in Supply Chain Market Revenue (US$ Mn) Comparison by Based on End-User (2016-2032)
- Figure 56: Western Europe Generative AI in Supply Chain Market Y-o-Y Growth Rate Comparison by Country (2016-2032)
- Figure 57: Western Europe Generative AI in Supply Chain Market Y-o-Y Growth Rate Comparison by Based on Component (2016-2032)
- Figure 58: Western Europe Generative AI in Supply Chain Market Y-o-Y Growth Rate Comparison by Based on Deployment Mode (2016-2032)
- Figure 59: Western Europe Generative AI in Supply Chain Market Y-o-Y Growth Rate Comparison by Based on End-User (2016-2032)
- Figure 60: Western Europe Generative AI in Supply Chain Market Share Comparison by Country (2016-2032)
- Figure 61: Western Europe Generative AI in Supply Chain Market Share Comparison by Based on Component (2016-2032)
- Figure 62: Western Europe Generative AI in Supply Chain Market Share Comparison by Based on Deployment Mode (2016-2032)
- Figure 63: Western Europe Generative AI in Supply Chain Market Share Comparison by Based on End-User (2016-2032)
- Figure 64: Eastern Europe Generative AI in Supply Chain Market Revenue (US$ Mn) Market Share by Based on Componentin 2022
- Figure 65: Eastern Europe Generative AI in Supply Chain Market Attractiveness Analysis by Based on Component, 2016-2032
- Figure 66: Eastern Europe Generative AI in Supply Chain Market Revenue (US$ Mn) Market Share by Based on Deployment Modein 2022
- Figure 67: Eastern Europe Generative AI in Supply Chain Market Attractiveness Analysis by Based on Deployment Mode, 2016-2032
- Figure 68: Eastern Europe Generative AI in Supply Chain Market Revenue (US$ Mn) Market Share by Based on End-Userin 2022
- Figure 69: Eastern Europe Generative AI in Supply Chain Market Attractiveness Analysis by Based on End-User, 2016-2032
- Figure 70: Eastern Europe Generative AI in Supply Chain Market Revenue (US$ Mn) Market Share by Country in 2022
- Figure 71: Eastern Europe Generative AI in Supply Chain Market Attractiveness Analysis by Country, 2016-2032
- Figure 72: Eastern Europe Generative AI in Supply Chain Market Revenue (US$ Mn) (2016-2032)
- Figure 73: Eastern Europe Generative AI in Supply Chain Market Revenue (US$ Mn) Comparison by Country (2016-2032)
- Figure 74: Eastern Europe Generative AI in Supply Chain Market Revenue (US$ Mn) Comparison by Based on Component (2016-2032)
- Figure 75: Eastern Europe Generative AI in Supply Chain Market Revenue (US$ Mn) Comparison by Based on Deployment Mode (2016-2032)
- Figure 76: Eastern Europe Generative AI in Supply Chain Market Revenue (US$ Mn) Comparison by Based on End-User (2016-2032)
- Figure 77: Eastern Europe Generative AI in Supply Chain Market Y-o-Y Growth Rate Comparison by Country (2016-2032)
- Figure 78: Eastern Europe Generative AI in Supply Chain Market Y-o-Y Growth Rate Comparison by Based on Component (2016-2032)
- Figure 79: Eastern Europe Generative AI in Supply Chain Market Y-o-Y Growth Rate Comparison by Based on Deployment Mode (2016-2032)
- Figure 80: Eastern Europe Generative AI in Supply Chain Market Y-o-Y Growth Rate Comparison by Based on End-User (2016-2032)
- Figure 81: Eastern Europe Generative AI in Supply Chain Market Share Comparison by Country (2016-2032)
- Figure 82: Eastern Europe Generative AI in Supply Chain Market Share Comparison by Based on Component (2016-2032)
- Figure 83: Eastern Europe Generative AI in Supply Chain Market Share Comparison by Based on Deployment Mode (2016-2032)
- Figure 84: Eastern Europe Generative AI in Supply Chain Market Share Comparison by Based on End-User (2016-2032)
- Figure 85: APAC Generative AI in Supply Chain Market Revenue (US$ Mn) Market Share by Based on Componentin 2022
- Figure 86: APAC Generative AI in Supply Chain Market Attractiveness Analysis by Based on Component, 2016-2032
- Figure 87: APAC Generative AI in Supply Chain Market Revenue (US$ Mn) Market Share by Based on Deployment Modein 2022
- Figure 88: APAC Generative AI in Supply Chain Market Attractiveness Analysis by Based on Deployment Mode, 2016-2032
- Figure 89: APAC Generative AI in Supply Chain Market Revenue (US$ Mn) Market Share by Based on End-Userin 2022
- Figure 90: APAC Generative AI in Supply Chain Market Attractiveness Analysis by Based on End-User, 2016-2032
- Figure 91: APAC Generative AI in Supply Chain Market Revenue (US$ Mn) Market Share by Country in 2022
- Figure 92: APAC Generative AI in Supply Chain Market Attractiveness Analysis by Country, 2016-2032
- Figure 93: APAC Generative AI in Supply Chain Market Revenue (US$ Mn) (2016-2032)
- Figure 94: APAC Generative AI in Supply Chain Market Revenue (US$ Mn) Comparison by Country (2016-2032)
- Figure 95: APAC Generative AI in Supply Chain Market Revenue (US$ Mn) Comparison by Based on Component (2016-2032)
- Figure 96: APAC Generative AI in Supply Chain Market Revenue (US$ Mn) Comparison by Based on Deployment Mode (2016-2032)
- Figure 97: APAC Generative AI in Supply Chain Market Revenue (US$ Mn) Comparison by Based on End-User (2016-2032)
- Figure 98: APAC Generative AI in Supply Chain Market Y-o-Y Growth Rate Comparison by Country (2016-2032)
- Figure 99: APAC Generative AI in Supply Chain Market Y-o-Y Growth Rate Comparison by Based on Component (2016-2032)
- Figure 100: APAC Generative AI in Supply Chain Market Y-o-Y Growth Rate Comparison by Based on Deployment Mode (2016-2032)
- Figure 101: APAC Generative AI in Supply Chain Market Y-o-Y Growth Rate Comparison by Based on End-User (2016-2032)
- Figure 102: APAC Generative AI in Supply Chain Market Share Comparison by Country (2016-2032)
- Figure 103: APAC Generative AI in Supply Chain Market Share Comparison by Based on Component (2016-2032)
- Figure 104: APAC Generative AI in Supply Chain Market Share Comparison by Based on Deployment Mode (2016-2032)
- Figure 105: APAC Generative AI in Supply Chain Market Share Comparison by Based on End-User (2016-2032)
- Figure 106: Latin America Generative AI in Supply Chain Market Revenue (US$ Mn) Market Share by Based on Componentin 2022
- Figure 107: Latin America Generative AI in Supply Chain Market Attractiveness Analysis by Based on Component, 2016-2032
- Figure 108: Latin America Generative AI in Supply Chain Market Revenue (US$ Mn) Market Share by Based on Deployment Modein 2022
- Figure 109: Latin America Generative AI in Supply Chain Market Attractiveness Analysis by Based on Deployment Mode, 2016-2032
- Figure 110: Latin America Generative AI in Supply Chain Market Revenue (US$ Mn) Market Share by Based on End-Userin 2022
- Figure 111: Latin America Generative AI in Supply Chain Market Attractiveness Analysis by Based on End-User, 2016-2032
- Figure 112: Latin America Generative AI in Supply Chain Market Revenue (US$ Mn) Market Share by Country in 2022
- Figure 113: Latin America Generative AI in Supply Chain Market Attractiveness Analysis by Country, 2016-2032
- Figure 114: Latin America Generative AI in Supply Chain Market Revenue (US$ Mn) (2016-2032)
- Figure 115: Latin America Generative AI in Supply Chain Market Revenue (US$ Mn) Comparison by Country (2016-2032)
- Figure 116: Latin America Generative AI in Supply Chain Market Revenue (US$ Mn) Comparison by Based on Component (2016-2032)
- Figure 117: Latin America Generative AI in Supply Chain Market Revenue (US$ Mn) Comparison by Based on Deployment Mode (2016-2032)
- Figure 118: Latin America Generative AI in Supply Chain Market Revenue (US$ Mn) Comparison by Based on End-User (2016-2032)
- Figure 119: Latin America Generative AI in Supply Chain Market Y-o-Y Growth Rate Comparison by Country (2016-2032)
- Figure 120: Latin America Generative AI in Supply Chain Market Y-o-Y Growth Rate Comparison by Based on Component (2016-2032)
- Figure 121: Latin America Generative AI in Supply Chain Market Y-o-Y Growth Rate Comparison by Based on Deployment Mode (2016-2032)
- Figure 122: Latin America Generative AI in Supply Chain Market Y-o-Y Growth Rate Comparison by Based on End-User (2016-2032)
- Figure 123: Latin America Generative AI in Supply Chain Market Share Comparison by Country (2016-2032)
- Figure 124: Latin America Generative AI in Supply Chain Market Share Comparison by Based on Component (2016-2032)
- Figure 125: Latin America Generative AI in Supply Chain Market Share Comparison by Based on Deployment Mode (2016-2032)
- Figure 126: Latin America Generative AI in Supply Chain Market Share Comparison by Based on End-User (2016-2032)
- Figure 127: Middle East & Africa Generative AI in Supply Chain Market Revenue (US$ Mn) Market Share by Based on Componentin 2022
- Figure 128: Middle East & Africa Generative AI in Supply Chain Market Attractiveness Analysis by Based on Component, 2016-2032
- Figure 129: Middle East & Africa Generative AI in Supply Chain Market Revenue (US$ Mn) Market Share by Based on Deployment Modein 2022
- Figure 130: Middle East & Africa Generative AI in Supply Chain Market Attractiveness Analysis by Based on Deployment Mode, 2016-2032
- Figure 131: Middle East & Africa Generative AI in Supply Chain Market Revenue (US$ Mn) Market Share by Based on End-Userin 2022
- Figure 132: Middle East & Africa Generative AI in Supply Chain Market Attractiveness Analysis by Based on End-User, 2016-2032
- Figure 133: Middle East & Africa Generative AI in Supply Chain Market Revenue (US$ Mn) Market Share by Country in 2022
- Figure 134: Middle East & Africa Generative AI in Supply Chain Market Attractiveness Analysis by Country, 2016-2032
- Figure 135: Middle East & Africa Generative AI in Supply Chain Market Revenue (US$ Mn) (2016-2032)
- Figure 136: Middle East & Africa Generative AI in Supply Chain Market Revenue (US$ Mn) Comparison by Country (2016-2032)
- Figure 137: Middle East & Africa Generative AI in Supply Chain Market Revenue (US$ Mn) Comparison by Based on Component (2016-2032)
- Figure 138: Middle East & Africa Generative AI in Supply Chain Market Revenue (US$ Mn) Comparison by Based on Deployment Mode (2016-2032)
- Figure 139: Middle East & Africa Generative AI in Supply Chain Market Revenue (US$ Mn) Comparison by Based on End-User (2016-2032)
- Figure 140: Middle East & Africa Generative AI in Supply Chain Market Y-o-Y Growth Rate Comparison by Country (2016-2032)
- Figure 141: Middle East & Africa Generative AI in Supply Chain Market Y-o-Y Growth Rate Comparison by Based on Component (2016-2032)
- Figure 142: Middle East & Africa Generative AI in Supply Chain Market Y-o-Y Growth Rate Comparison by Based on Deployment Mode (2016-2032)
- Figure 143: Middle East & Africa Generative AI in Supply Chain Market Y-o-Y Growth Rate Comparison by Based on End-User (2016-2032)
- Figure 144: Middle East & Africa Generative AI in Supply Chain Market Share Comparison by Country (2016-2032)
- Figure 145: Middle East & Africa Generative AI in Supply Chain Market Share Comparison by Based on Component (2016-2032)
- Figure 146: Middle East & Africa Generative AI in Supply Chain Market Share Comparison by Based on Deployment Mode (2016-2032)
- Figure 147: Middle East & Africa Generative AI in Supply Chain Market Share Comparison by Based on End-User (2016-2032)
List of Tables
- Table 1: Global Generative AI in Supply Chain Market Comparison by Based on Component (2016-2032)
- Table 2: Global Generative AI in Supply Chain Market Comparison by Based on Deployment Mode (2016-2032)
- Table 3: Global Generative AI in Supply Chain Market Comparison by Based on End-User (2016-2032)
- Table 4: Global Generative AI in Supply Chain Market Revenue (US$ Mn) Comparison by Region (2016-2032)
- Table 5: Global Generative AI in Supply Chain Market Revenue (US$ Mn) (2016-2032)
- Table 6: Global Generative AI in Supply Chain Market Revenue (US$ Mn) Comparison by Region (2016-2032)
- Table 7: Global Generative AI in Supply Chain Market Revenue (US$ Mn) Comparison by Based on Component (2016-2032)
- Table 8: Global Generative AI in Supply Chain Market Revenue (US$ Mn) Comparison by Based on Deployment Mode (2016-2032)
- Table 9: Global Generative AI in Supply Chain Market Revenue (US$ Mn) Comparison by Based on End-User (2016-2032)
- Table 10: Global Generative AI in Supply Chain Market Y-o-Y Growth Rate Comparison by Region (2016-2032)
- Table 11: Global Generative AI in Supply Chain Market Y-o-Y Growth Rate Comparison by Based on Component (2016-2032)
- Table 12: Global Generative AI in Supply Chain Market Y-o-Y Growth Rate Comparison by Based on Deployment Mode (2016-2032)
- Table 13: Global Generative AI in Supply Chain Market Y-o-Y Growth Rate Comparison by Based on End-User (2016-2032)
- Table 14: Global Generative AI in Supply Chain Market Share Comparison by Region (2016-2032)
- Table 15: Global Generative AI in Supply Chain Market Share Comparison by Based on Component (2016-2032)
- Table 16: Global Generative AI in Supply Chain Market Share Comparison by Based on Deployment Mode (2016-2032)
- Table 17: Global Generative AI in Supply Chain Market Share Comparison by Based on End-User (2016-2032)
- Table 18: North America Generative AI in Supply Chain Market Comparison by Based on Deployment Mode (2016-2032)
- Table 19: North America Generative AI in Supply Chain Market Comparison by Based on End-User (2016-2032)
- Table 20: North America Generative AI in Supply Chain Market Revenue (US$ Mn) Comparison by Country (2016-2032)
- Table 21: North America Generative AI in Supply Chain Market Revenue (US$ Mn) (2016-2032)
- Table 22: North America Generative AI in Supply Chain Market Revenue (US$ Mn) Comparison by Country (2016-2032)
- Table 23: North America Generative AI in Supply Chain Market Revenue (US$ Mn) Comparison by Based on Component (2016-2032)
- Table 24: North America Generative AI in Supply Chain Market Revenue (US$ Mn) Comparison by Based on Deployment Mode (2016-2032)
- Table 25: North America Generative AI in Supply Chain Market Revenue (US$ Mn) Comparison by Based on End-User (2016-2032)
- Table 26: North America Generative AI in Supply Chain Market Y-o-Y Growth Rate Comparison by Country (2016-2032)
- Table 27: North America Generative AI in Supply Chain Market Y-o-Y Growth Rate Comparison by Based on Component (2016-2032)
- Table 28: North America Generative AI in Supply Chain Market Y-o-Y Growth Rate Comparison by Based on Deployment Mode (2016-2032)
- Table 29: North America Generative AI in Supply Chain Market Y-o-Y Growth Rate Comparison by Based on End-User (2016-2032)
- Table 30: North America Generative AI in Supply Chain Market Share Comparison by Country (2016-2032)
- Table 31: North America Generative AI in Supply Chain Market Share Comparison by Based on Component (2016-2032)
- Table 32: North America Generative AI in Supply Chain Market Share Comparison by Based on Deployment Mode (2016-2032)
- Table 33: North America Generative AI in Supply Chain Market Share Comparison by Based on End-User (2016-2032)
- Table 34: Western Europe Generative AI in Supply Chain Market Comparison by Based on Component (2016-2032)
- Table 35: Western Europe Generative AI in Supply Chain Market Comparison by Based on Deployment Mode (2016-2032)
- Table 36: Western Europe Generative AI in Supply Chain Market Comparison by Based on End-User (2016-2032)
- Table 37: Western Europe Generative AI in Supply Chain Market Revenue (US$ Mn) Comparison by Country (2016-2032)
- Table 38: Western Europe Generative AI in Supply Chain Market Revenue (US$ Mn) (2016-2032)
- Table 39: Western Europe Generative AI in Supply Chain Market Revenue (US$ Mn) Comparison by Country (2016-2032)
- Table 40: Western Europe Generative AI in Supply Chain Market Revenue (US$ Mn) Comparison by Based on Component (2016-2032)
- Table 41: Western Europe Generative AI in Supply Chain Market Revenue (US$ Mn) Comparison by Based on Deployment Mode (2016-2032)
- Table 42: Western Europe Generative AI in Supply Chain Market Revenue (US$ Mn) Comparison by Based on End-User (2016-2032)
- Table 43: Western Europe Generative AI in Supply Chain Market Y-o-Y Growth Rate Comparison by Country (2016-2032)
- Table 44: Western Europe Generative AI in Supply Chain Market Y-o-Y Growth Rate Comparison by Based on Component (2016-2032)
- Table 45: Western Europe Generative AI in Supply Chain Market Y-o-Y Growth Rate Comparison by Based on Deployment Mode (2016-2032)
- Table 46: Western Europe Generative AI in Supply Chain Market Y-o-Y Growth Rate Comparison by Based on End-User (2016-2032)
- Table 47: Western Europe Generative AI in Supply Chain Market Share Comparison by Country (2016-2032)
- Table 48: Western Europe Generative AI in Supply Chain Market Share Comparison by Based on Component (2016-2032)
- Table 49: Western Europe Generative AI in Supply Chain Market Share Comparison by Based on Deployment Mode (2016-2032)
- Table 50: Western Europe Generative AI in Supply Chain Market Share Comparison by Based on End-User (2016-2032)
- Table 51: Eastern Europe Generative AI in Supply Chain Market Comparison by Based on Component (2016-2032)
- Table 52: Eastern Europe Generative AI in Supply Chain Market Comparison by Based on Deployment Mode (2016-2032)
- Table 53: Eastern Europe Generative AI in Supply Chain Market Comparison by Based on End-User (2016-2032)
- Table 54: Eastern Europe Generative AI in Supply Chain Market Revenue (US$ Mn) Comparison by Country (2016-2032)
- Table 55: Eastern Europe Generative AI in Supply Chain Market Revenue (US$ Mn) (2016-2032)
- Table 56: Eastern Europe Generative AI in Supply Chain Market Revenue (US$ Mn) Comparison by Country (2016-2032)
- Table 57: Eastern Europe Generative AI in Supply Chain Market Revenue (US$ Mn) Comparison by Based on Component (2016-2032)
- Table 58: Eastern Europe Generative AI in Supply Chain Market Revenue (US$ Mn) Comparison by Based on Deployment Mode (2016-2032)
- Table 59: Eastern Europe Generative AI in Supply Chain Market Revenue (US$ Mn) Comparison by Based on End-User (2016-2032)
- Table 60: Eastern Europe Generative AI in Supply Chain Market Y-o-Y Growth Rate Comparison by Country (2016-2032)
- Table 61: Eastern Europe Generative AI in Supply Chain Market Y-o-Y Growth Rate Comparison by Based on Component (2016-2032)
- Table 62: Eastern Europe Generative AI in Supply Chain Market Y-o-Y Growth Rate Comparison by Based on Deployment Mode (2016-2032)
- Table 63: Eastern Europe Generative AI in Supply Chain Market Y-o-Y Growth Rate Comparison by Based on End-User (2016-2032)
- Table 64: Eastern Europe Generative AI in Supply Chain Market Share Comparison by Country (2016-2032)
- Table 65: Eastern Europe Generative AI in Supply Chain Market Share Comparison by Based on Component (2016-2032)
- Table 66: Eastern Europe Generative AI in Supply Chain Market Share Comparison by Based on Deployment Mode (2016-2032)
- Table 67: Eastern Europe Generative AI in Supply Chain Market Share Comparison by Based on End-User (2016-2032)
- Table 68: APAC Generative AI in Supply Chain Market Comparison by Based on Component (2016-2032)
- Table 69: APAC Generative AI in Supply Chain Market Comparison by Based on Deployment Mode (2016-2032)
- Table 70: APAC Generative AI in Supply Chain Market Comparison by Based on End-User (2016-2032)
- Table 71: APAC Generative AI in Supply Chain Market Revenue (US$ Mn) Comparison by Country (2016-2032)
- Table 72: APAC Generative AI in Supply Chain Market Revenue (US$ Mn) (2016-2032)
- Table 73: APAC Generative AI in Supply Chain Market Revenue (US$ Mn) Comparison by Country (2016-2032)
- Table 74: APAC Generative AI in Supply Chain Market Revenue (US$ Mn) Comparison by Based on Component (2016-2032)
- Table 75: APAC Generative AI in Supply Chain Market Revenue (US$ Mn) Comparison by Based on Deployment Mode (2016-2032)
- Table 76: APAC Generative AI in Supply Chain Market Revenue (US$ Mn) Comparison by Based on End-User (2016-2032)
- Table 77: APAC Generative AI in Supply Chain Market Y-o-Y Growth Rate Comparison by Country (2016-2032)
- Table 78: APAC Generative AI in Supply Chain Market Y-o-Y Growth Rate Comparison by Based on Component (2016-2032)
- Table 79: APAC Generative AI in Supply Chain Market Y-o-Y Growth Rate Comparison by Based on Deployment Mode (2016-2032)
- Table 80: APAC Generative AI in Supply Chain Market Y-o-Y Growth Rate Comparison by Based on End-User (2016-2032)
- Table 81: APAC Generative AI in Supply Chain Market Share Comparison by Country (2016-2032)
- Table 82: APAC Generative AI in Supply Chain Market Share Comparison by Based on Component (2016-2032)
- Table 83: APAC Generative AI in Supply Chain Market Share Comparison by Based on Deployment Mode (2016-2032)
- Table 84: APAC Generative AI in Supply Chain Market Share Comparison by Based on End-User (2016-2032)
- Table 85: Latin America Generative AI in Supply Chain Market Comparison by Based on Component (2016-2032)
- Table 86: Latin America Generative AI in Supply Chain Market Comparison by Based on Deployment Mode (2016-2032)
- Table 87: Latin America Generative AI in Supply Chain Market Comparison by Based on End-User (2016-2032)
- Table 88: Latin America Generative AI in Supply Chain Market Revenue (US$ Mn) Comparison by Country (2016-2032)
- Table 89: Latin America Generative AI in Supply Chain Market Revenue (US$ Mn) (2016-2032)
- Table 90: Latin America Generative AI in Supply Chain Market Revenue (US$ Mn) Comparison by Country (2016-2032)
- Table 91: Latin America Generative AI in Supply Chain Market Revenue (US$ Mn) Comparison by Based on Component (2016-2032)
- Table 92: Latin America Generative AI in Supply Chain Market Revenue (US$ Mn) Comparison by Based on Deployment Mode (2016-2032)
- Table 93: Latin America Generative AI in Supply Chain Market Revenue (US$ Mn) Comparison by Based on End-User (2016-2032)
- Table 94: Latin America Generative AI in Supply Chain Market Y-o-Y Growth Rate Comparison by Country (2016-2032)
- Table 95: Latin America Generative AI in Supply Chain Market Y-o-Y Growth Rate Comparison by Based on Component (2016-2032)
- Table 96: Latin America Generative AI in Supply Chain Market Y-o-Y Growth Rate Comparison by Based on Deployment Mode (2016-2032)
- Table 97: Latin America Generative AI in Supply Chain Market Y-o-Y Growth Rate Comparison by Based on End-User (2016-2032)
- Table 98: Latin America Generative AI in Supply Chain Market Share Comparison by Country (2016-2032)
- Table 99: Latin America Generative AI in Supply Chain Market Share Comparison by Based on Component (2016-2032)
- Table 100: Latin America Generative AI in Supply Chain Market Share Comparison by Based on Deployment Mode (2016-2032)
- Table 101: Latin America Generative AI in Supply Chain Market Share Comparison by Based on End-User (2016-2032)
- Table 102: Middle East & Africa Generative AI in Supply Chain Market Comparison by Based on Component (2016-2032)
- Table 103: Middle East & Africa Generative AI in Supply Chain Market Comparison by Based on Deployment Mode (2016-2032)
- Table 104: Middle East & Africa Generative AI in Supply Chain Market Comparison by Based on End-User (2016-2032)
- Table 105: Middle East & Africa Generative AI in Supply Chain Market Revenue (US$ Mn) Comparison by Country (2016-2032)
- Table 106: Middle East & Africa Generative AI in Supply Chain Market Revenue (US$ Mn) (2016-2032)
- Table 107: Middle East & Africa Generative AI in Supply Chain Market Revenue (US$ Mn) Comparison by Country (2016-2032)
- Table 108: Middle East & Africa Generative AI in Supply Chain Market Revenue (US$ Mn) Comparison by Based on Component (2016-2032)
- Table 109: Middle East & Africa Generative AI in Supply Chain Market Revenue (US$ Mn) Comparison by Based on Deployment Mode (2016-2032)
- Table 110: Middle East & Africa Generative AI in Supply Chain Market Revenue (US$ Mn) Comparison by Based on End-User (2016-2032)
- Table 111: Middle East & Africa Generative AI in Supply Chain Market Y-o-Y Growth Rate Comparison by Country (2016-2032)
- Table 112: Middle East & Africa Generative AI in Supply Chain Market Y-o-Y Growth Rate Comparison by Based on Component (2016-2032)
- Table 113: Middle East & Africa Generative AI in Supply Chain Market Y-o-Y Growth Rate Comparison by Based on Deployment Mode (2016-2032)
- Table 114: Middle East & Africa Generative AI in Supply Chain Market Y-o-Y Growth Rate Comparison by Based on End-User (2016-2032)
- Table 115: Middle East & Africa Generative AI in Supply Chain Market Share Comparison by Country (2016-2032)
- Table 116: Middle East & Africa Generative AI in Supply Chain Market Share Comparison by Based on Component (2016-2032)
- Table 117: Middle East & Africa Generative AI in Supply Chain Market Share Comparison by Based on Deployment Mode (2016-2032)
- Table 118: Middle East & Africa Generative AI in Supply Chain Market Share Comparison by Based on End-User (2016-2032)
- 1. Executive Summary
-
- IBM Corporation
- Microsoft Corporation
- SAP SE
- Oracle Corporation
- Blue Yonder
- LLamasoft Inc
- AIMMS
- Other Key Players
Our Clients


View Our Licence Options
