
Generative AI in Private Equity Market By Type (Generative Adversarial Networks (GANs), and Variational Autoencoder (VAEs)), By Application (Market Segmentation and Portfolio Optimization), By Component, By Deployment, By Region and Companies - Industry Segment Outlook, Market Assessment, Competition Scenario, Trends, and Forecast 2023-2032
-
39056
-
Feb 2024
-
137
-


-
This report was compiled by Vishwa Gaul Vishwa is an experienced market research and consulting professional with over 8 years of expertise in the ICT industry, contributing to over 700 reports across telecommunications, software, hardware, and digital solutions. Correspondence Team Lead- ICT Linkedin | Detailed Market research Methodology Our methodology involves a mix of primary research, including interviews with leading mental health experts, and secondary research from reputable medical journals and databases. View Detailed Methodology Page
-
Quick Navigation
Report Overview
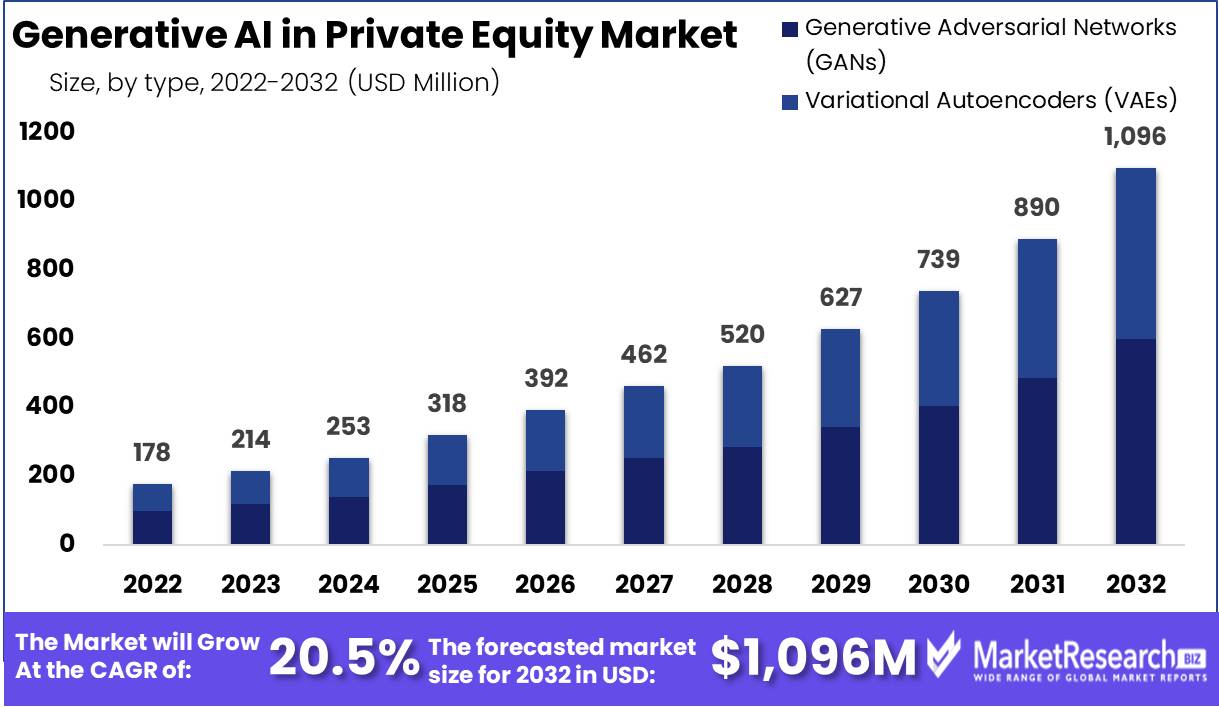
The Global Generative AI in Private Equity Market size is expected to be worth around USD 1,096 Million by 2033, from USD 178 Million in 2023, growing at a CAGR of 20.50% during the forecast period from 2024 to 2033.
Generative AI in the Private Equity Market refers to the integration of advanced artificial intelligence technologies to innovate and enhance decision-making processes in private equity (PE) investments. This technology enables PE firms to analyze vast amounts of data for uncovering investment opportunities, conducting due diligence, and optimizing portfolio performance.
By leveraging generative AI, firms can generate predictive models, automate labor-intensive research, repetitive tasks, and personalize investment strategies, thereby gaining a competitive advantage.
Generative AI is fast becoming a transformative force in the Private Equity (PE) market, offering profound efficiencies and strategic advantages. This technology empowers PE firms to navigate the complexities of investment processes with greater precision and speed, a critical edge in today’s competitive landscape.
According to Accenture, the implementation of generative AI technologies has enabled some PE firms to realize a significant EBITDA uplift, approximately $460 million across four portfolio companies, underscoring the technology's potential for value creation. Furthermore, the adoption of generative AI has been shown to streamline deal sourcing and due diligence processes, reducing the time frame required by an impressive 50–60%.
A recent EY CEO Outlook Pulse Survey reinforces this trend, indicating that 74% of PE-backed companies are either actively using AI solutions in their transaction processes or are in the pilot stage of exploring such technologies. This widespread adoption reflects a growing recognition within the PE sector of the strategic benefits offered by generative AI, including enhanced investment strategies, operational efficiencies, and the automation of labor-intensive tasks.
Generative AI enables PE firms to leverage sophisticated analytics and predictive modeling, facilitating deeper market segmentation, portfolio optimization, and the identification of investment opportunities. The technology's capacity to process and analyze vast datasets not only accelerates investment decision-making but also provides a richer, data-driven foundation for those decisions.
Key Takeaways
- Market Growth: The Global Generative AI in Private Equity Market is anticipated to witness substantial growth, reaching approximately USD 1,096 million by 2033, with a CAGR of 20.50% from 2024 to 2033.
- Dominant Type: Generative Adversarial Networks (GANs) hold a significant market share of 54.6%, owing to their efficacy in generating synthetic data and providing valuable insights from complex datasets.
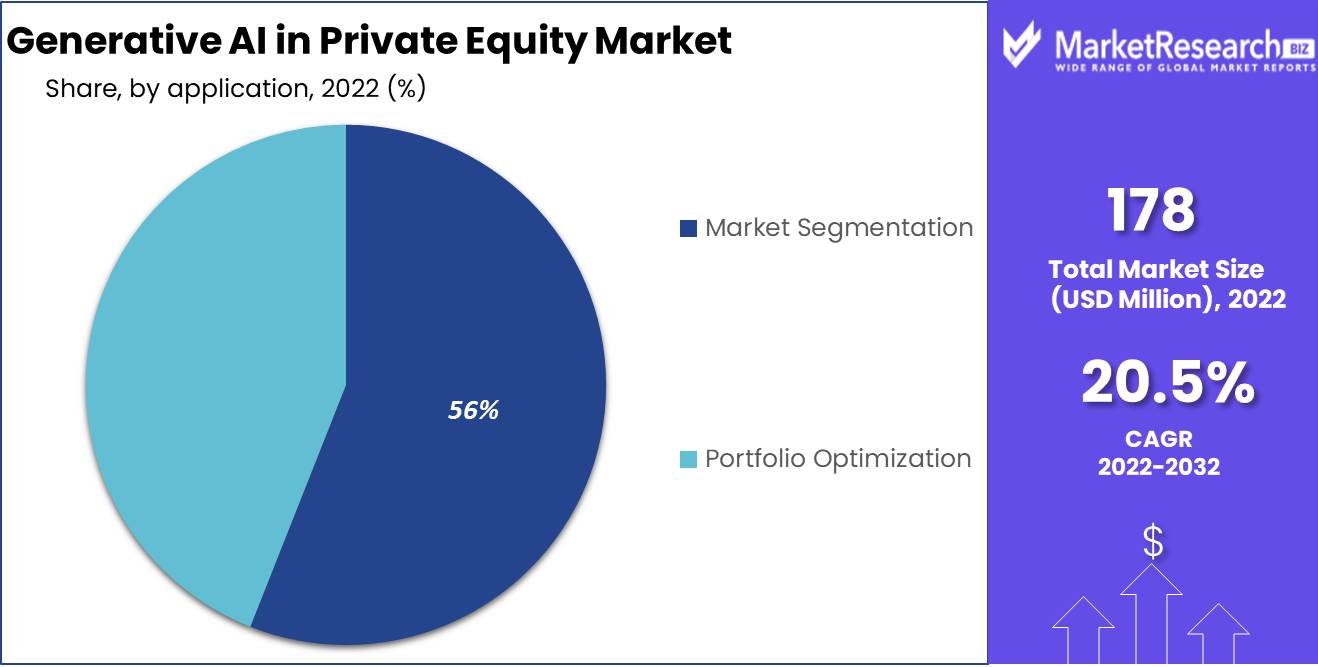
- Application Importance: Market Segmentation emerges as the leading application sub-segment, accounting for 56% of usage, enabling PE firms to tailor their investment strategies effectively. Portfolio Optimization remains crucial for refining investment portfolios for maximum efficiency and return.
- Foundational Component: "Data Collection and Preprocessing" is the dominant component, highlighting the importance of gathering and refining high-quality data for effective AI application. Market Analysis and Prediction and Decision Making follow suit, translating processed data into visuals.
- Deployment Preferences: The "Cloud-Based" deployment model holds the largest market share at 46.8%, driven by scalability, flexibility, and cost-effectiveness. However, "On-Premises" deployment, though with higher initial costs, remains critical for firms with stringent data privacy concerns.
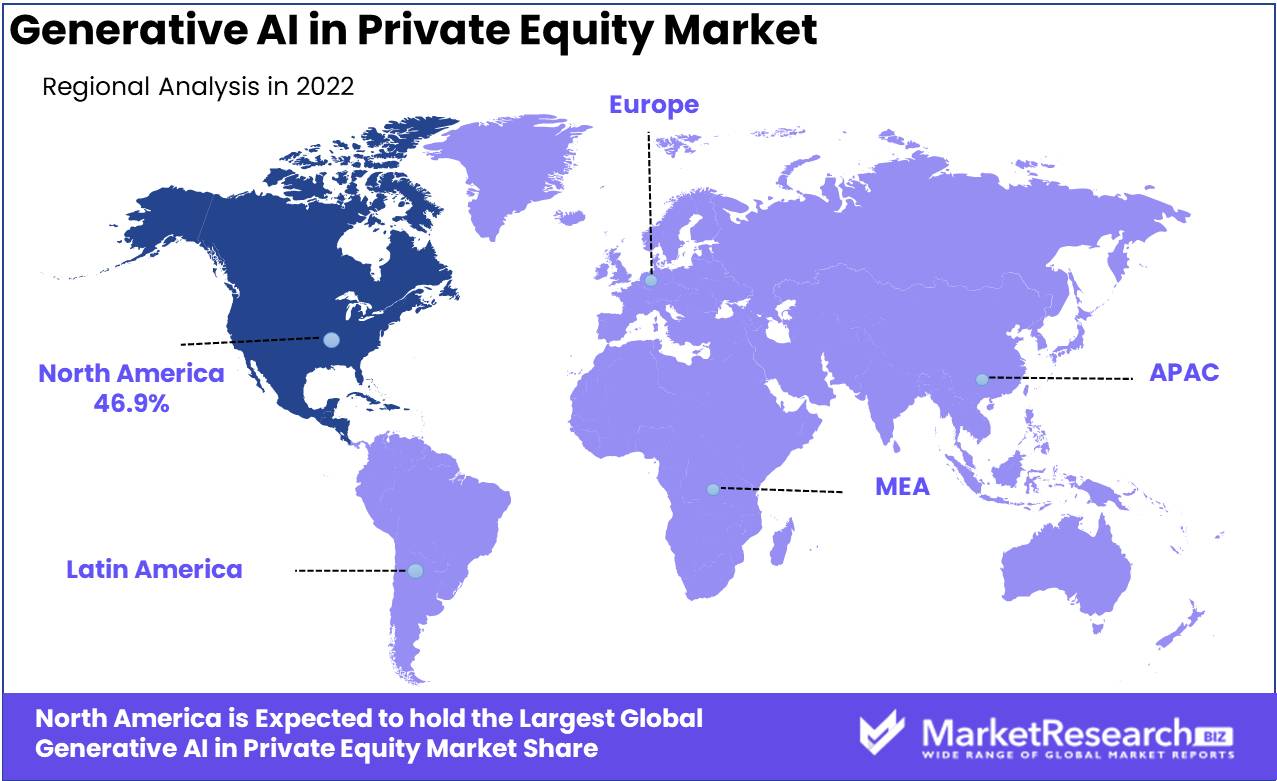
- Regional Distribution: North America leads in the adoption of Generative AI in Private Equity, holding 46.9% of the market share.
- Key Players: Notable companies in the sector include OpenAI LP, DeepMind Technologies Ltd., Vicarious FPC Inc., among others, indicating a mix of established entities and emerging players driving innovation in the field.
- Analyst Overview: Generative AI facilitates deal origination for mid-market funds, expanding their deal sourcing reach, and enhances portfolio value creation by identifying risks and growth levers across portfolio companies, ultimately improving returns.
Driving Factors
Faster Deal Screening Drives Market Growth
The integration of generative AI into the private equity (PE) market significantly streamlines the deal screening process. By rapidly analyzing and evaluating thousands of companies, generative AI enables finance to swiftly identify potential investment targets that align with their strategic criteria. This technological advancement not only enhances the efficiency of deal sourcing but also increases the volume of opportunities that can be assessed within a given timeframe.
The ability to quickly sift through vast amounts of data and pinpoint relevant private equity investment prospects fundamentally accelerates the initial stages of investment, contributing to market growth by enabling more deals to be executed with greater precision and speed.
Enhanced Due Diligence Enhances Market Competitiveness
Generative AI's role in due diligence transforms the way PE firms evaluate potential investments. By digesting and cross-analyzing extensive datasets from diverse sources, including company financials and market reports, generative AI provides a comprehensive and nuanced view of investment targets.
This depth of analysis ensures that investment decisions are based on a holistic understanding of the target's potential, risks, and market position. The enhanced due diligence process not only mitigates investment risks but also contributes to more informed, strategic decision-making, thereby bolstering the PE market's overall competitiveness and growth.
Democratization of Access Levels the Playing Field
The democratization of access to generative AI technologies empowers smaller PE firms, enabling them to compete more effectively with larger counterparts. By leveraging generative AI, these smaller firms can enhance their deal pipelines and perform competitive analyses with a level of sophistication previously reserved for firms with more substantial resources.
This leveling of the playing field fosters a more dynamic and competitive market environment, encouraging innovation and strategic investment across the spectrum of PE firms. The broadened accessibility to advanced analytical tools promotes market growth by expanding the pool of active participants capable of identifying and pursuing valuable investment opportunities.
Value Creation Monitoring Optimizes Investment Outcomes
Generative AI's capability to continuously monitor portfolio company data for risks, growth levers, and areas for value creation plays a crucial role in optimizing investment outcomes. This ongoing oversight enables PE firms to proactively manage their investments, identifying opportunities for intervention and enhancement.
The real-time insights provided by generative AI into portfolio performance not only help in maximizing value creation but also in mitigating potential risks before they escalate. This strategic advantage supports market growth by improving the success rate and return on investments, making the PE market more attractive and resilient.
Restraining Factors
Lack of Explainability Restrains Market Growth
The "black box" nature of generative AI models significantly hampers their acceptance in the private equity (PE) market. Without clear transparency on how these models arrive at their conclusions, stakeholders often express mistrust, especially when faced with high-stakes investment decisions.
This lack of explainability can deter PE firms from fully integrating generative AI into their strategic processes, fearing the potential risks of misguided investments based on uninterpretable AI recommendations. Consequently, the growth of generative AI in the PE market is restrained, as firms prioritize trust and understanding in their decision-making tools over the potential benefits of AI-driven insights.
Data Privacy Concerns Limit Market Adoption
Data privacy and cybersecurity concerns further limit the adoption of generative AI in the private equity market. PE deals typically involve sensitive and proprietary financial data, making firms cautious about utilizing generative AI systems that require extensive data inputs. The apprehension revolves around the potential for data breaches and misuse, posing significant reputational and financial risks.
This cautious stance towards adopting generative AI technologies, driven by the need to protect critical data, directly impacts the growth potential of generative AI in the PE sector. Firms may hesitate to leverage AI capabilities, missing out on the efficiency and insights these technologies offer, due to these prevailing privacy concerns.
Type Analysis
In the landscape of Generative AI within the Private Equity Market, Generative Adversarial Networks (GANs) stand out as the dominant type, holding a significant 54.6% market share. GANs' unique architecture, which pits two neural networks against each other to generate new, synthetic instances of data while improving upon the realism of the data, has proven to be especially beneficial in the PE sector.
This technology is adept at identifying and generating valuable insights from complex datasets, a critical capability for PE firms looking to uncover hidden opportunities or assess potential risks in their investment portfolios. The use of GANs facilitates a deeper understanding of market trends and private equity investment potentials, driving informed decision-making.
On the other hand, Variational Autoencoders (VAEs) also play a crucial role in the generative AI landscape, despite their smaller share compared to GANs. VAEs are instrumental in modeling the distribution of data, offering a different approach to generating and understanding complex datasets.
Their ability to compress data into lower-dimensional representations and then generate new data from these representations makes VAEs valuable for tasks such as anomaly detection and data reconstruction within the PE market. Although not as predominant as GANs, VAEs contribute to the diversity and depth of generative AI applications, supporting the sector's overall growth by providing alternative methodologies for data analysis and insight generation.
Application Analysis
In terms of application, Market Segmentation emerges as the leading sub-segment in the Generative AI Private Equity Market, accounting for 56% of its application use. This dominant role is attributed to the critical importance of identifying distinct segments within markets, which enables PE firms to tailor their investment strategies more effectively.
Generative AI technologies, particularly through their capacity for handling vast datasets, allow for the nuanced segmentation of markets based on a multitude of factors, including consumer behavior, financial performance, and growth potential. This precise segmentation helps PE firms to pinpoint investment opportunities and optimize their approaches to different market niches, enhancing the potential for targeted and successful investments.
Portfolio Optimization, while not the dominant application, remains a vital sub-segment, reflecting generative AI's role in refining investment portfolios for maximum efficiency and return. By leveraging generative AI for portfolio optimization, PE firms can simulate various investment scenarios and outcomes, enabling a more strategic allocation of resources and risk management.
This application of generative AI supports the broader objective of maximizing returns while mitigating risks, complementing the insights gained from market segmentation efforts. Together, these applications underscore the multifaceted impact of generative AI in transforming the strategies and operations of private equity firms, propelling the sector towards more data-driven and analytically sophisticated methodologies.
Component Analysis
In the Generative AI in Private Equity Market, "Data Collection and Preprocessing" emerges as the foundational and dominant component, accounting for 44.8% of the market's focus. This significant share highlights the critical importance of gathering and refining high-quality data as a precursor to effective AI application.
In private equity, where investment decisions hinge on the depth and accuracy of available information, the process of collecting diverse datasets and transforming them into a usable format is indispensable. This stage sets the groundwork for all subsequent AI-driven analyses, making it a pivotal component of the generative AI workflow. The emphasis on data collection and preprocessing underscores the sector's recognition that the value derived from AI technologies is only as good as the data fed into them.
Following this dominant component, "Market Analysis" and "Prediction and Decision Making" play crucial roles in translating processed data into actionable insights and strategic actions. Market analysis leverages the cleaned and structured data to identify trends, opportunities, and competitive landscapes, offering PE firms a comprehensive understanding of the market dynamics. Meanwhile, prediction and decision-making capabilities focus on utilizing generative AI to forecast future market behaviors and guide investment decisions.
Though these components hold smaller shares compared to data collection and preprocessing, their contributions are vital, driving the application of generative AI from foundational data handling to strategic implementation and decision support within the private equity market.
Deployment Analysis
The "Cloud-Based" deployment model claims the largest market share within the Generative AI in Private Equity Market, at 46.8%. This preference is driven by the cloud's scalability, flexibility, and cost-effectiveness, which align perfectly with the dynamic and data-intensive nature of private equity investments.
Cloud-based solutions offer PE firms the ability to access advanced AI tools and vast computational resources on demand, without the need for significant upfront investment in physical infrastructure. This model supports rapid scaling of operations and the ability to swiftly adapt to changing market conditions, making it an attractive option for firms looking to leverage generative AI capabilities.
In contrast, the "On-Premises" deployment, while offering greater control over data security and system customization, presents higher initial costs and complexity, leading to its smaller market share. However, for certain PE firms, especially those with stringent data privacy concerns or specific regulatory requirements, on-premises deployment remains a critical option.
"Collaborative Platforms" represent a burgeoning segment that facilitates shared AI resources and knowledge among PE firms, fostering innovation and efficiency. Though cloud-based solutions dominate, the combined roles of on-premises and collaborative platforms highlight the diverse deployment needs within the private equity sector, catering to different preferences for control, cost, and collaboration in the utilization of generative AI technologies.
Key Market Segments
Based on Type
- Generative Adversarial Networks (GANs)
- Variational Autoencoder (VAEs)
Based on Application
- Market Segmentation
- Portfolio Optimization
Based on Component
- Data Collection and Preprocessing
- Market Analysis
- Prediction and Decision Making
Based on Deployment
- Cloud-Based
- On-Premises
- Collaborative Platforms
Growth Opportunities
Deal Origination for Mid-Market Funds Offers Growth Opportunity
Generative AI presents a significant growth opportunity for mid-market private equity (PE) funds by revolutionizing deal origination processes. By leveraging AI, smaller PE firms can "punch above their weight," expanding their reach and capabilities in identifying attractive investment opportunities. This technology enables them to efficiently analyze vast amounts of data, uncovering hidden gems that may have been overlooked by traditional methods.
Consequently, generative AI levels the playing field, allowing mid-market funds to compete more effectively with larger entities. This democratization of investment sourcing not only enhances the competitive dynamics of the PE industry but also drives market expansion by broadening the scope of potential investments accessible to a wider range of funds.
Portfolio Value Creation Offers Growth Opportunity
Generative AI significantly contributes to portfolio value creation, offering PE firms the tools to enhance returns across their investments. By analyzing large datasets, AI can identify underlying risks and pinpoint growth levers within portfolio companies, enabling targeted interventions that drive value creation. This capability allows PE firms to optimize their portfolio strategies, improving the performance of individual investments and the portfolio overall.
The application of generative AI in this context not only increases the potential for higher returns but also enhances the attractiveness of PE as an investment class. The strategic use of AI in driving portfolio value creation marks a pivotal shift towards more data-driven and efficient management of investments, promising to foster growth and innovation within the private equity market.
Trending Factors
"AI-First" PE Firms Are Trending Factors
The emergence of "AI-first" private equity (PE) firms marks a significant trend within the industry. These firms, built with the optimization and integration of generative AI at their core, are setting new standards for investment strategy and operations. By embedding AI technologies from the outset, these innovative firms can efficiently process vast datasets, uncover insights faster, and make more informed investment decisions. This approach not only gives them a competitive edge but also signals a broader shift in the industry towards technology-driven investment strategies. The rise of AI-first PE firms reflects the growing recognition of generative AI's potential to transform traditional investment methodologies, making it a trending factor in the market's evolution.
Syndicating Data Lakes Are Trending Factors
The trend of syndicating data lakes among PE firms is reshaping the landscape of generative AI in the industry. By pooling access to proprietary data lakes, participating firms significantly enhance the data capacity available for generative AI analysis. This collaboration allows for a more profound and comprehensive analysis of potential investments, market trends, and operational optimizations. The shared resources not only improve the efficiency and accuracy of generative AI applications but also foster a spirit of innovation and cooperation within the private equity sector. As firms leverage these expanded data lakes, the capability of generative AI to drive value across investments is markedly increased, cementing data syndication as a key trending factor in the market.
Regional Analysis
North America Dominates with 46.9% Market Share
North America's commanding 46.9% share in the Generative AI in Private Equity Market underscores its pioneering role and innovative landscape. This dominance is attributed to several key factors, including a well-established technological infrastructure, significant investments in language models and AI research and development, and a robust ecosystem of startups and venture capital.
The region's regulatory environment, which supports innovation while protecting investors and companies, further bolsters its leading position.
The market dynamics in North America are characterized by aggressive adoption of new technologies, a culture of innovation, and the presence of tech giants and specialized AI startups. These elements combine to create a fertile ground for the development and application of generative AI in private equity, enabling firms to leverage advanced analytics for deal sourcing, due diligence, and portfolio management.
North America: A Leader in Generative AI Adoption
North America, with its 46.9% market share in the Generative AI in Private Equity Market, leads due to its advanced technological infrastructure, robust investment in AI, and a dynamic startup ecosystem. The region's commitment to innovation, coupled with significant R&D expenditures and a favorable regulatory environment, has established it as a global frontrunner.
Europe: Balancing Growth with Regulation
Europe's market share in Generative AI applications within private equity reflects a careful balance between embracing technological advancement and adhering to stringent data protection regulations. The focus on ethical AI and transparency fosters a trusted environment for AI development and application.
Asia Pacific: Rapid Expansion and Digital Transformation
The Asia Pacific region is witnessing rapid growth in the adoption of Generative AI within the private equity market. Driven by digital transformation initiatives and an increasing number of tech-savvy startups, the region is fast becoming a significant player. Investments in AI research and development, along with government support for technological innovation, are key factors propelling the market forward.
Middle East & Africa: Emerging Players on the Rise
The Middle East & Africa region, though a smaller market share, is showing signs of accelerated growth in the adoption of Generative AI in private equity. Initiatives to diversify economies, coupled with investments in digital infrastructure, are laying the groundwork for increased AI adoption.
Latin America: Navigating Growth Amid Challenges
Latin America's market share in the Generative AI in Private Equity Market is on a growth trajectory, despite facing challenges such as limited technological infrastructure and investment. However, increasing digitalization efforts and a rising interest in AI and machine learning are sparking change.
Key Regions and Countries
- North America
- The US
- Canada
- Mexico
- Western Europe
- Germany
- France
- The UK
- Spain
- Italy
- Portugal
- Ireland
- Austria
- Switzerland
- Benelux
- Nordic
- Rest of Western Europe
- Eastern Europe
- Russia
- Poland
- The Czech Republic
- Greece
- Rest of Eastern Europe
- APAC
- China
- Japan
- South Korea
- India
- Australia & New Zealand
- Indonesia
- Malaysia
- Philippines
- Singapore
- Thailand
- Vietnam
- Rest of APAC
- Latin America
- Brazil
- Colombia
- Chile
- Argentina
- Costa Rica
- Rest of Latin America
- Middle East & Africa
- Algeria
- Egypt
- Israel
- Kuwait
- Nigeria
- Saudi Arabia
- South Africa
- Turkey
- United Arab Emirates
- Rest of MEA
Key Players Analysis
In the Generative AI in Private Equity Market, key players such as OpenAI LP, DeepMind Technologies Ltd., and Vicarious FPC Inc. are at the forefront of technological innovation, pushing the boundaries of what AI can achieve in data analysis and investment strategy formulation. Companies like Numerai LLC and Citadel LLC blend financial expertise with advanced AI, creating competitive edges in market prediction and investment optimization.
Meanwhile, investment giants like The Blackstone Group Inc., SoftBank Group Corp., and Khosla Ventures LLC leverage generative AI to enhance due diligence, deal sourcing, and portfolio management, showcasing the technology's versatility across different aspects of private equity.
These private equity portfolio companies not only demonstrate the profound impact of generative AI on enhancing decision-making and operational efficiency but also highlight the strategic positioning of firms investing in AI to gain a competitive advantage. Their collective influence is reshaping the private equity landscape, driving innovation, and setting new standards for investment excellence.
Market Key Players
- OpenAI LP
- DeepMind Technologies Ltd.
- Vicarious FPC Inc.
- Numerai LLC
- Citadel LLC
- The Blackstone Group Inc.
- SoftBank Group Corp.
- Khosla Ventures LLC
- Other Key Players
Recent Developments
- In 2023, GitHub Universe 2023 announced the general availability of GitHub Copilot in December, with Copilot Enterprise offering fine-tuned models and code-review capabilities. This development could lead to increased private equity interest in AI startups focused on code-related applications.
- In September 2023, Amazon announced its plan to invest up to $4 billion in the artificial intelligence company Anthropic. This substantial investment aimed to propel Amazon's presence in the healthcare generative AI sector, putting it in competition with tech giants like Microsoft and Google.
- In 2023, Evozyne, a Chicago-based AI-powered biotech company, achieved a significant milestone in the field of generative AI applied to Private Equity, particularly in the realm of therapeutic discovery and drug development. Evozyne successfully closed an $81 million Series B funding round, demonstrating growing investor confidence in the potential of generative AI in revolutionizing drug discovery processes.
Report Scope
Report Features Description Market Value (2022) USD 178 Mn Forecast Revenue (2032) USD 1,096 Mn CAGR (2023-2032) 20.5% Base Year for Estimation 2022 Historic Period 2016-2022 Forecast Period 2023-2032 Report Coverage Revenue Forecast, Market Dynamics, COVID-19 Impact, Competitive Landscape, Recent Developments Segments Covered By Type (Generative Adversarial Networks (GANs), Variational Autoencoder (VAEs))
By Application (Market Segmentation, Portfolio Optimization)
By Component (Data Collection and Preprocessing, Market Analysis, Prediction, and Decision Making)
By Deployment (Cloud-Based, On-Premises, Collaborative Platforms)Regional Analysis North America – The US, Canada, & Mexico; Western Europe – Germany, France, The UK, Spain, Italy, Portugal, Ireland, Austria, Switzerland, Benelux, Nordic, & Rest of Western Europe; Eastern Europe – Russia, Poland, The Czech Republic, Greece, & Rest of Eastern Europe; APAC – China, Japan, South Korea, India, Australia & New Zealand, Indonesia, Malaysia, Philippines, Singapore, Thailand, Vietnam, & Rest of APAC; Latin America – Brazil, Colombia, Chile, Argentina, Costa Rica, & Rest of Latin America; Middle East & Africa – Algeria, Egypt, Israel, Kuwait, Nigeria, Saudi Arabia, South Africa, Turkey, United Arab Emirates, & Rest of MEA Competitive Landscape OpenAI LP, DeepMind Technologies Ltd., Vicarious FPC Inc., Numerai LLC, Citadel LLC, The Blackstone Group Inc., SoftBank Group Corp., Khosla Ventures LLC, Other Key Players Customization Scope Customization for segments, region/country-level will be provided. Moreover, additional customization can be done based on the requirements. Purchase Options We have three licenses to opt for: Single User License, Multi-User License (Up to 5 Users), Corporate Use License (Unlimited User and Printable PDF) -
-
- OpenAI LP
- DeepMind Technologies Ltd.
- Vicarious FPC Inc.
- Numerai LLC
- Citadel LLC
- The Blackstone Group Inc.
- SoftBank Group Corp.
- Khosla Ventures LLC
- Other Key Players
Our Clients


View Our Licence Options
