
Generative AI in Data Visualization Market By Deployment Mode(Cloud-based, On-Premises), By Technology(GANs , VAEs, Other Technologies), By Application(Exploratory Data Analysis, Business Intelligence, Reporting, Other Applications), By Industry Vertical(IT and Telecom, Healthcare, Finance, Retail, Manufacturing, Other Industry Verticals) By Region And Companies - Industry Segment Outlook, Market Assessment, Competition Scenario, Trends, And Forecast 2024-2033
-
43291
-
Jan 2022
-
158
-


-
This report was compiled by Vishwa Gaul Vishwa is an experienced market research and consulting professional with over 8 years of expertise in the ICT industry, contributing to over 700 reports across telecommunications, software, hardware, and digital solutions. Correspondence Team Lead- ICT Linkedin | Detailed Market research Methodology Our methodology involves a mix of primary research, including interviews with leading mental health experts, and secondary research from reputable medical journals and databases. View Detailed Methodology Page
-
Quick Navigation
Report Overview
The Global Generative AI in Data Visualization Market was valued at USD 23.2 Bn in 2023. It is expected to reach USD 101.1 Bn by 2033, with a CAGR of 16.3% during the forecast period from 2024 to 2033.
The Generative AI in Data Visualization Market involves the integration of advanced artificial intelligence technologies to enhance the creation and interpretation of data visualizations. This market encompasses AI-driven tools and platforms designed to automate the generation of visual data representations, thereby improving data comprehension and decision-making processes. By leveraging generative AI, organizations can transform complex datasets into intuitive and interactive visual formats, reducing the time and expertise required for data analysis. This innovation is particularly valuable for businesses aiming to harness big data for strategic insights, driving efficiency, accuracy, and innovation across various sectors.
 The Generative AI in Data Visualization Market represents a significant evolution in the field of data analytics, where AI technologies are leveraged to automate and enhance the creation of data visualizations. This market is driven by the growing need for efficient data interpretation methods as businesses increasingly rely on big data for strategic decision-making. Generative AI tools can transform raw data into intuitive visual formats, reducing the complexity and time required for analysis.
These tools enhance accuracy by minimizing human errors. According to research by IBM, AI-enhanced data visualization tools can reduce data errors by up to 50%, significantly improving the reliability of insights derived from data. This reduction in errors is crucial for decision-makers who depend on precise data to formulate business strategies.
The application of AI in data visualization extends beyond error reduction. For instance, AI algorithms can enhance MRI scans, providing higher resolution images. This technology has been shown to improve the identification of anomalies as small as 1-2 mm, thereby increasing early diagnosis rates of diseases like cancer by up to 30%. Such advancements underscore the broader potential of generative AI in transforming how data is visualized and utilized across various industries.
The integration of AI in data visualization is expected to drive substantial growth in this market, as organizations seek to harness the full potential of their data assets. With continuous innovations and increasing adoption, the Generative AI in Data Visualization Market is poised for significant expansion, offering enhanced capabilities and improved outcomes for businesses worldwide.
Key Takeaways
- Market Value: The Global Generative AI in Data Visualization Market was valued at USD 23.2 Bn in 2023. It is expected to reach USD 101.1 Bn by 2033, with a CAGR of 16.3% during the forecast period from 2024 to 2033.
- By Deployment Mode: Cloud-based solutions dominate, accounting for 70% of the market, offering scalability and ease of access.
- By Technology: GANs (Generative Adversarial Networks) lead with 45%, known for creating high-quality, realistic data visualizations.
- By Application: Business Intelligence utilizes 35% of these technologies, enhancing data-driven decision-making processes.
- By Industry Vertical: Finance is a key sector, representing 30%, leveraging AI for advanced data analytics and risk management.
- Regional Dominance: North America holds a 35% market share, driven by technological advancements and high adoption rates.
- Growth Opportunity: Expanding into real-time analytics and automated data insights can drive significant growth in the business intelligence sector.
Driving factors
Increasing Demand for Efficient and Optimized Transportation Solutions
The generative AI in data visualization market is experiencing significant growth due to the rising need for efficient and optimized transportation solutions. As urbanization continues to intensify, the demand for sophisticated transportation management systems has surged. Generative AI enables the creation of complex visual models that can simulate traffic patterns, optimize route planning, and predict maintenance needs.
By leveraging these capabilities, cities and transportation agencies can reduce congestion, improve public transit efficiency, and lower operational costs. This has led to an increased adoption of generative AI solutions in the transportation sector, driving market growth.
Advancements in AI and Machine Learning Technologies
Advancements in AI and machine learning development are pivotal to the growth of the generative AI in data visualization market. Recent breakthroughs in deep learning algorithms, natural language processing, and computer vision have significantly enhanced the ability of AI systems to process and visualize vast amounts of data. These advancements enable more accurate predictions, sophisticated data analysis, and intuitive visualizations that can uncover hidden patterns and insights.
As organizations across various industries recognize the value of these capabilities, investment in generative AI solutions has increased, further propelling market expansion. For instance, the integration of AI in data visualization tools has improved decision-making processes in sectors such as finance, healthcare, and manufacturing, leading to more efficient operations and better outcomes.
Growth in Smart City Initiatives and IoT Integration
The proliferation of smart city initiatives and the integration of the Internet of Things (IoT) are driving the generative AI in data visualization market. Smart cities rely on a vast network of connected devices and sensors to collect and analyze data in real-time. Generative AI plays a crucial role in visualizing this data, helping city planners and administrators to monitor infrastructure, manage resources, and enhance the quality of life for residents.
The ability to generate dynamic, interactive visualizations from IoT data allows for more informed decision-making and proactive problem-solving. As more cities adopt smart technologies and IoT ecosystems expand, the demand for advanced data visualization solutions powered by generative AI continues to grow. This trend is expected to accelerate market growth, with significant investments being made in smart city projects worldwide.
Restraining Factors
High Implementation and Operational Costs
The generative AI in data visualization market faces significant challenges due to high implementation and operational costs. The development and deployment of advanced AI-driven visualization systems require substantial investment in both hardware and software infrastructure. This includes the cost of powerful computational resources, specialized software licenses, and the integration of these systems with existing IT infrastructure.
Ongoing operational expenses, such as maintenance, updates, and skilled personnel, further add to the financial burden. Small and medium-sized enterprises (SMEs) may find these costs prohibitive, limiting their ability to adopt and benefit from generative AI solutions.
Concerns Over Data Privacy and Security
Concerns over data privacy and security present another significant retraining factor for the generative AI in data visualization market. The deployment of AI systems involves the collection, processing, and analysis of vast amounts of data, often including sensitive and personal information. This raises serious privacy issues, as improper handling of data can lead to breaches and misuse. Regulatory frameworks such as the General Data Protection Regulation (GDPR) in Europe and the California Consumer Privacy Act (CCPA) in the United States impose strict requirements on data protection and user consent.
Companies must invest heavily in robust security measures and compliance strategies to safeguard data, which can be both costly and complex. Failure to address these concerns can result in legal penalties, reputational damage, and loss of customer trust. Consequently, apprehensions about data privacy and security can slow down the adoption of generative AI technologies, particularly in industries dealing with highly sensitive information such as healthcare, finance, and government sectors.
By Deployment Mode
Cloud-based held a dominant market position in the By Deployment Mode segment of the Generative AI in Data Visualization Market, capturing more than a 70% share.
In 2023, Cloud-based solutions held a dominant market position in the By Deployment Mode segment of the Generative AI in Data Visualization Market, capturing more than a 70% share. This dominance is attributed to the scalability, flexibility, and cost-effectiveness offered by cloud-based platforms, making them highly appealing to businesses of all sizes. Cloud-based deployment enables seamless integration with existing systems, easy access to updates, and the ability to handle large volumes of data efficiently.
On-Premises solutions, while important, hold a smaller market share. These are preferred by organizations with stringent data security requirements, regulatory compliance needs, or limited internet connectivity. On-premises deployments offer greater control over data and infrastructure but involve higher upfront costs and maintenance. Despite their advantages, the shift towards cloud computing is reducing the relative market share of on-premises solutions.
By Technology
GANs (Generative Adversarial Networks) held a dominant market position in the By Technology segment of the Generative AI in Data Visualization Market, capturing 45% share.
In 2023, GANs (Generative Adversarial Networks) held a dominant market position in the By Technology segment of the Generative AI in Data Visualization Market, capturing more than a 45% share. This prominence is due to GANs' ability to generate highly realistic and complex data visualizations, which are essential for detailed analysis and decision-making. GANs are widely used for creating synthetic data, enhancing image quality, and producing intricate visual patterns that can reveal hidden insights.
VAEs (Variational Autoencoders) also play a critical role, particularly in tasks requiring data compression and generation of continuous data representations. VAEs are valued for their ability to create smooth data transitions and are used in various exploratory data analysis tasks.
Other Technologies include a range of deep learning models and neural networks that cater to specific visualization needs. These technologies, while integral to the market, hold a smaller collective share compared to GANs and VAEs due to their specialized applications and varied adoption rates.
By Application
Business Intelligence held a dominant market position in the By Application segment of the Generative AI in Data Visualization Market, capturing 35% share.
In 2023, Business Intelligence held a dominant market position in the By Application segment of the Generative AI in Data Visualization Market, capturing more than a 35% share. The integration of generative AI with BI tools enables companies to analyze vast datasets, identify trends, and make data-driven decisions with greater accuracy and speed. Generative AI enhances BI capabilities by automating data processing and generating high-quality visual content, which helps organizations uncover valuable insights and optimize business strategies..
Exploratory Data Analysis (EDA) is also critical, leveraging generative AI to identify patterns, anomalies, and relationships within data sets. EDA is essential for hypothesis generation and preliminary data investigation. Although vital, EDA holds a smaller market share compared to BI due to its more specialized and initial role in data analysis.
Reporting is another key application area, where generative AI automates and enhances the creation of detailed, visually appealing reports. These reports are crucial for communicating findings to stakeholders and supporting strategic decisions.
Other Applications include various niche uses of generative AI in data visualization, such as personalized dashboard software, interactive visual storytelling, and educational tools. These applications, while growing, collectively hold a smaller market share compared to the primary applications of BI, EDA, and reporting.

By Industry Vertical
Finance held a dominant market position in the By Industry Vertical segment of the Generative AI in Data Visualization Market, capturing 30% share.
In 2023, Finance held a dominant market position in the By Industry Vertical segment of the Generative AI in Data Visualization Market, capturing more than a 30% share. The finance sector's reliance on data-driven insights for risk management, market analysis, and strategic planning drives the adoption of generative AI for advanced data visualization. Financial institutions leverage AI to generate detailed visualizations that help in predicting market trends, managing portfolios, detecting fraud, and enhancing customer insights.
IT and Telecom also represent a significant segment, utilizing generative AI to manage and analyze large volumes of data from digital and telecommunications networks. The sector benefits from AI-driven visualizations to optimize network performance, enhance customer service, and drive innovation.
Healthcare leverages generative AI to visualize complex medical data, improve diagnostics, and personalize patient care. Although the market share is smaller than finance, healthcare's use of AI in medical research and clinical applications is growing rapidly.
Retail benefits from AI-driven data visualization to understand consumer behavior, optimize supply chains, and enhance marketing strategies. The sector's share reflects its ongoing digital transformation and the need for data-driven decision-making.
Manufacturing employs generative AI to optimize production processes, predict maintenance needs, and ensure quality control. While the market share is smaller compared to finance and IT, manufacturing has significant growth potential as more companies adopt AI technologies.
Other Industry Verticals, including education, transportation, and energy, use generative AI for various data visualization needs. These industries, while collectively important, hold a smaller market share due to their specialized applications and varied adoption rates.
Key Market Segments
By Deployment Mode
- Cloud-based
- On-Premises
By Technology
- GANs (Generative Adversarial Networks)
- VAEs (Variational Autoencoders)
- Other Technologies
By Application
- Exploratory Data Analysis
- Business Intelligence
- Reporting
- Other Applications
By Industry Vertical
- IT and Telecom
- Healthcare
- Finance
- Retail
- Manufacturing
- Other Industry Verticals
Growth Opportunity
AI-Driven Predictive Maintenance Systems
The development of AI-driven predictive maintenance systems presents a significant growth opportunity for the generative AI in data visualization market in 2024. Predictive maintenance leverages AI to analyze data from machinery and equipment, forecasting potential failures and optimizing maintenance schedules. This not only enhances operational efficiency but also reduces downtime and maintenance costs.
The visualization of predictive maintenance data through generative AI provides intuitive and actionable insights, enabling businesses to proactively manage their assets. As industries such as manufacturing, energy, and transportation increasingly adopt predictive maintenance solutions, the demand for advanced data visualization tools is expected to rise, driving market growth.
Expansion in Autonomous Vehicle Technology
The expansion of autonomous vehicle technology is another promising avenue for the generative AI in data visualization market. Autonomous vehicles rely on vast amounts of data from sensors, cameras, and other sources to navigate and operate safely. Generative AI enhances the visualization of this complex data, providing clear and comprehensive representations that are crucial for decision-making and system optimization.
As the autonomous vehicle industry continues to grow, the integration of generative AI for data visualization will become essential for improving the performance and safety of these vehicles. This trend is likely to spur significant investments in generative AI solutions, fostering market expansion.
Latest Trends
Use of Generative AI for Traffic Management and Route Optimization
In 2024, the use of generative AI for traffic management and route optimization is anticipated to be a key trend driving the global generative AI in data visualization market. Urban areas worldwide are grappling with increasing traffic congestion, which necessitates innovative solutions to optimize traffic flow and reduce travel times. Generative AI can analyze real-time traffic data, predict congestion patterns, and suggest optimal routes, significantly improving urban mobility.
These capabilities are visualized through sophisticated, user-friendly interfaces that help city planners and traffic authorities make data-driven decisions. As cities continue to expand and the demand for efficient transportation systems grows, the adoption of generative AI in traffic management is set to rise, reinforcing its importance in the data visualization market.
Integration with Connected Vehicle Networks for Enhanced Safety
Another notable trend in 2024 is the integration of generative AI with connected vehicle networks to enhance safety. Connected vehicles communicate with each other and with infrastructure to share data on road conditions, traffic, and potential hazards. Generative AI plays a crucial role in visualizing this data, providing drivers and automated systems with clear and actionable insights to prevent accidents and improve road safety.
The visualization of data from connected vehicle networks allows for real-time monitoring and predictive analysis, facilitating proactive safety measures. As the automotive industry moves towards greater connectivity and autonomy, the demand for generative AI-driven data visualization solutions will increase, highlighting its critical role in advancing vehicle safety technologies.
Regional Analysis
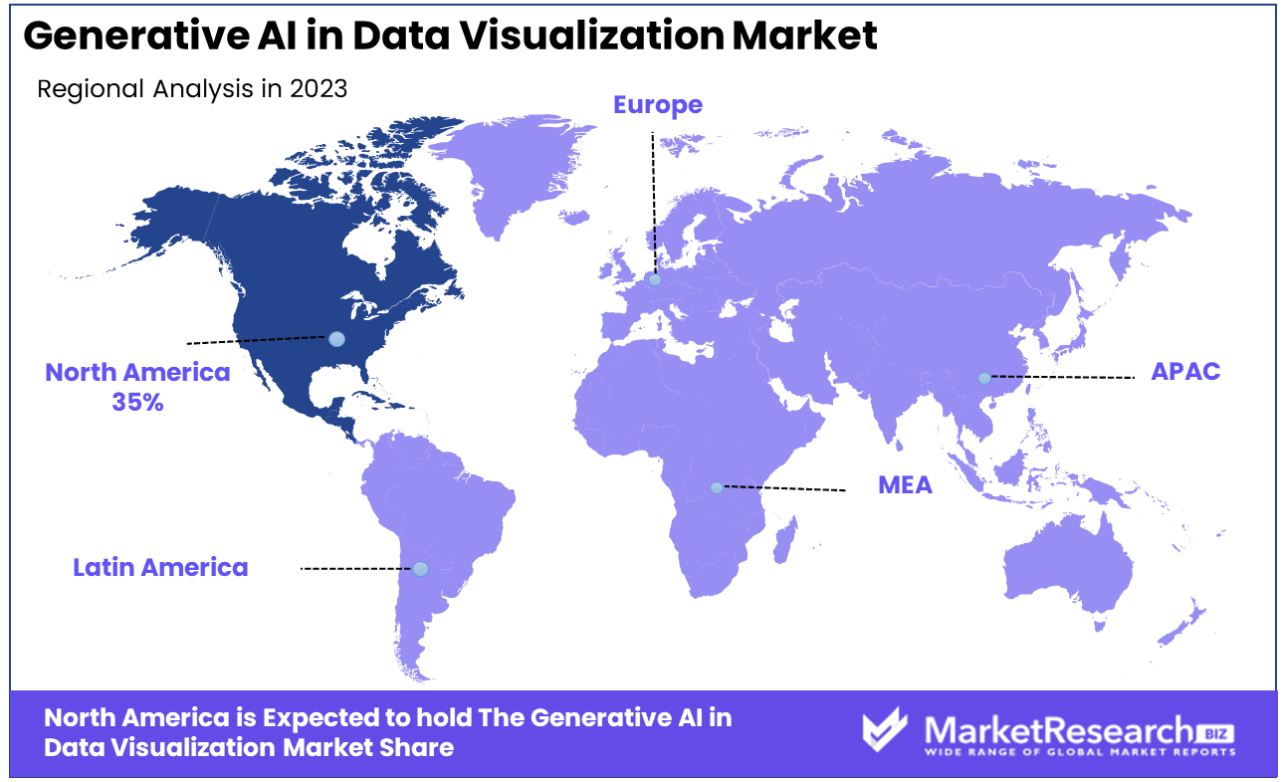
North America dominated the Generative AI in Data Visualization Market, capturing a 35% market share.
In 2023, North America dominated the Generative AI in Data Visualization Market, capturing a significant market share of around 35%. This dominance is driven by the high adoption rate of advanced AI technologies in data analytics and visualization across various industries. The presence of major tech companies and startups focusing on AI innovation further supports the market. The region benefits from substantial investments in research and development, fostering a conducive environment for the integration of generative AI in data visualization. The increasing demand for insightful data representation tools in sectors such as finance, healthcare, and IT drives market growth in North America.
Europe holds a substantial share in the market, driven by the growing emphasis on data-driven decision-making and the adoption of AI technologies across businesses. Countries like Germany, the UK, and France are at the forefront, with strong support from government initiatives and funding for AI research. The market benefits from the increasing need for sophisticated data visualization tools to enhance operational efficiency and strategic planning.
Asia Pacific is experiencing rapid growth, fueled by the increasing digital transformation and adoption of AI technologies in countries such as China, Japan, and India. The region's large population and expanding industrial sectors create a significant demand for advanced data visualization solutions. Government initiatives and investments in AI development further boost market growth.
Middle East & Africa show promising potential, driven by the growing adoption of AI technologies in sectors like oil & gas, finance, and healthcare. The market is supported by government initiatives to promote digital transformation and enhance data analytics capabilities.
Latin America is emerging as a growing market, with Brazil and Mexico leading the adoption of AI technologies. The increasing focus on improving business intelligence and data management practices drives the demand for generative AI in data visualization.
Key Regions and Countries
North America
- US
- Canada
- Mexico
Western Europe
- Germany
- France
- The UK
- Spain
- Italy
- Portugal
- Ireland
- Austria
- Switzerland
- Benelux
- Nordic
- Rest of Western Europe
Eastern Europe
- Russia
- Poland
- The Czech Republic
- Greece
- Rest of Eastern Europe
APAC
- China
- Japan
- South Korea
- India
- Australia & New Zealand
- Indonesia
- Malaysia
- Philippines
- Singapore
- Thailand
- Vietnam
- Rest of APAC
Latin America
- Brazil
- Colombia
- Chile
- Argentina
- Costa Rica
- Rest of Latin America
Middle East & Africa
- Algeria
- Egypt
- Israel
- Kuwait
- Nigeria
- Saudi Arabia
- South Africa
- Turkey
- United Arab Emirates
- Rest of MEA
Key Players Analysis
The Generative AI in Data Visualization market is poised for significant growth in 2024, driven by key players like OpenAI, IBM Corporation, NVIDIA Corporation, Adobe Inc., Microsoft Corporation, Google LLC, Autodesk Inc., Salesforce.com Inc., Baidu Inc., and Alphabet Inc. (DeepMind). OpenAI continues to lead with its advanced language models that enhance the interpretability and presentation of complex data. IBM Corporation leverages its extensive AI and cloud infrastructure to provide robust generative AI solutions tailored for data visualization. NVIDIA Corporation, with its powerful GPUs and AI frameworks, is essential in accelerating AI-driven data visualization processes.
Adobe Inc. integrates generative AI into its creative software suite, enabling users to generate dynamic and visually appealing data representations. Microsoft Corporation leverages Azure's AI capabilities to offer comprehensive data visualization tools that are both powerful and user-friendly. Google LLC and Alphabet Inc.'s DeepMind division are at the forefront of AI research, contributing significantly to advancements in data visualization through their deep learning and machine learning innovations. Autodesk Inc. brings its expertise in design software, enhancing data visualization in engineering and architecture sectors.
Salesforce.com Inc. utilizes generative AI to provide insightful and interactive dashboards, improving decision-making processes for businesses. Baidu Inc., a leader in AI research in China, offers innovative data visualization solutions leveraging its AI technology. Other key players in the market are also contributing to the rapid development and adoption of generative AI in data visualization, driving the market towards new frontiers in 2024.
Market Key Players
- OpenAI
- IBM Corporation
- NVIDIA Corporation
- Adobe Inc.
- Microsoft Corporation
- Google LLC
- Autodesk Inc.
- Salesforce.com Inc.
- Baidu Inc.
- Alphabet Inc. (DeepMind)
- Other Key Players
Recent Development
- In January 2024, OpenAI introduced a new generative AI tool for data visualization. This tool aims to help businesses quickly generate insightful visual representations of complex datasets, making data more accessible and understandable.
- In May 2024, Microsoft Corporation invested $50 million in a new generative AI project focused on creating dynamic and interactive data visualizations. This investment aims to improve user engagement and data interpretation.
Report Scope
Report Features Description Market Value (2023) USD 23.2 Bn Forecast Revenue (2033) USD 101.1 Bn CAGR (2024-2033) 16.3% Base Year for Estimation 2023 Historic Period 2018-2023 Forecast Period 2024-2033 Report Coverage Revenue Forecast, Market Dynamics, Competitive Landscape, Recent Developments Segments Covered By Deployment Mode (Cloud-based, On-Premises), By Technology (GANs (Generative Adversarial Networks), VAEs (Variational Autoencoders), Other Technologies), By Application (Exploratory Data Analysis, Business Intelligence, Reporting, Other Applications), By Industry Vertical (IT and Telecom, Healthcare, Finance, Retail, Manufacturing, Other Industry Verticals) Regional Analysis North America - The US, Canada, & Mexico; Western Europe - Germany, France, The UK, Spain, Italy, Portugal, Ireland, Austria, Switzerland, Benelux, Nordic, & Rest of Western Europe; Eastern Europe - Russia, Poland, The Czech Republic, Greece, & Rest of Eastern Europe; APAC - China, Japan, South Korea, India, Australia & New Zealand, Indonesia, Malaysia, Philippines, Singapore, Thailand, Vietnam, & Rest of APAC; Latin America - Brazil, Colombia, Chile, Argentina, Costa Rica, & Rest of Latin America; Middle East & Africa - Algeria, Egypt, Israel, Kuwait, Nigeria, Saudi Arabia, South Africa, Turkey, United Arab Emirates, & Rest of MEA Competitive Landscape OpenAI, IBM Corporation, NVIDIA Corporation, Adobe Inc., Microsoft Corporation, Google LLC, Autodesk Inc., Salesforce.com Inc., Baidu Inc., Alphabet Inc. (DeepMind), Other Key Players Customization Scope Customization for segments, region/country-level will be provided. Moreover, additional customization can be done based on the requirements. Purchase Options We have three licenses to opt for: Single User License, Multi-User License (Up to 5 Users), Corporate Use License (Unlimited User and Printable PDF) -
-
Our Clients


View Our Licence Options
