
Generative AI in Capital Market Report By Deployment Mode (On-Premises, Cloud-Based), By Application (Portfolio Optimization, Risk Assessment, Financial Market Data Generation, Market Forecasting, Other Applications), By End-User, By Region and Companies - Industry Segment Outlook, Market Assessment, Competition Scenario, Trends and Forecast 2024-2033
-
39002
-
March 2024
-
137
-


-
This report was compiled by Vishwa Gaul Vishwa is an experienced market research and consulting professional with over 8 years of expertise in the ICT industry, contributing to over 700 reports across telecommunications, software, hardware, and digital solutions. Correspondence Team Lead- ICT Linkedin | Detailed Market research Methodology Our methodology involves a mix of primary research, including interviews with leading mental health experts, and secondary research from reputable medical journals and databases. View Detailed Methodology Page
-
Quick Navigation
Report Overview
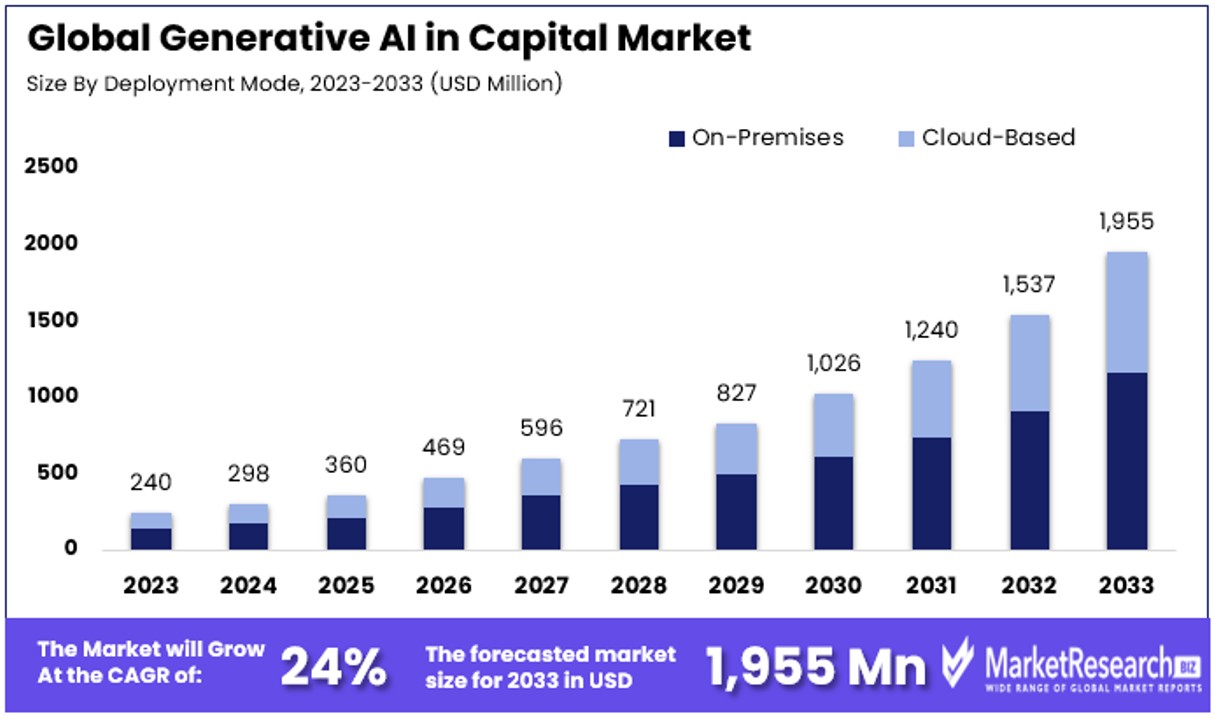
The Global Generative AI in Capital Market size is expected to be worth around USD 1,955 Million by 2033, from USD 240 Million in 2023, growing at a CAGR of 24% during the forecast period from 2024 to 2033.
The surge in demand for the advanced new technologies, high capital investments and rise in monetary transaction in the banking sectors are some of the main key driving factors for the generative AI in capital market.
Generative AI in the Capital Market refers to the advanced application of artificial intelligence that generates new data and insights, transforming decision-making and strategy in finance.
This technology enables firms to create realistic financial models, predict market trends, and automate complex analyses, thereby enhancing investment strategies and operational efficiencies. It offers a competitive edge by providing tailored, data-driven solutions for risk management, trading, and personalized customer services.
Generative AI is rapidly becoming a cornerstone technology in the capital market, heralding a new era of innovation and strategic advantage. This technology's capacity to generate new data, insights, and predictive models is revolutionizing how financial services approach decision-making, risk management, and customer engagement.
According to a study, an overwhelming 80% of CFOs surveyed in 2022 indicated plans to increase their investment in AI technologies over the next two years, signaling a strong confidence in AI's potential to drive efficiency and growth.
Moreover according to an article published by the financial times in December 2022, highlights that venture capital investment in the generative AI has boost 425 % since 2020 to USD 2.1 billion this year.
Additionally, according to an article published by Microsoft in July 2023, highlights that KPMG has conducted a survey which mentions, more than three quarters of the executive which is 77% has witnessed generative AI as by far the most impactful evolving technology they will use, and 71% plan to adapt and use their first gen AI solutions within the two years. Above all, more than three quarters of financial services executives will witness chance to power fraud detections, client experience and risk management.
Generative AI's ability to simulate financial scenarios, forecast market trends, and provide deeper analytical insights positions it as an invaluable tool for capital market firms. It offers a pathway to enhanced decision-making capabilities, enabling companies to stay ahead of market shifts and capitalize on emerging opportunities with greater precision.
As firms increasingly integrate generative AI into their strategic planning and operational frameworks, the potential for personalized investment solutions and innovative financial products grows, marking a pivotal shift towards a more agile, data-driven industry.
Key Takeaways
- Market Value Projection: The Global Generative AI in Capital Market is projected to reach around USD 1,955 Million by 2033, indicating a significant growth trajectory from USD 240 Million in 2023, with a CAGR of 24% during the forecast period from 2024 to 2033.
- Dominant Segments:
- Deployment Mode: On-premises solutions dominate, constituting 59% of the market, favored for enhanced security and control. However, cloud-based solutions, although smaller, offer scalability and cost-efficiency, appealing particularly to smaller firms and startups.
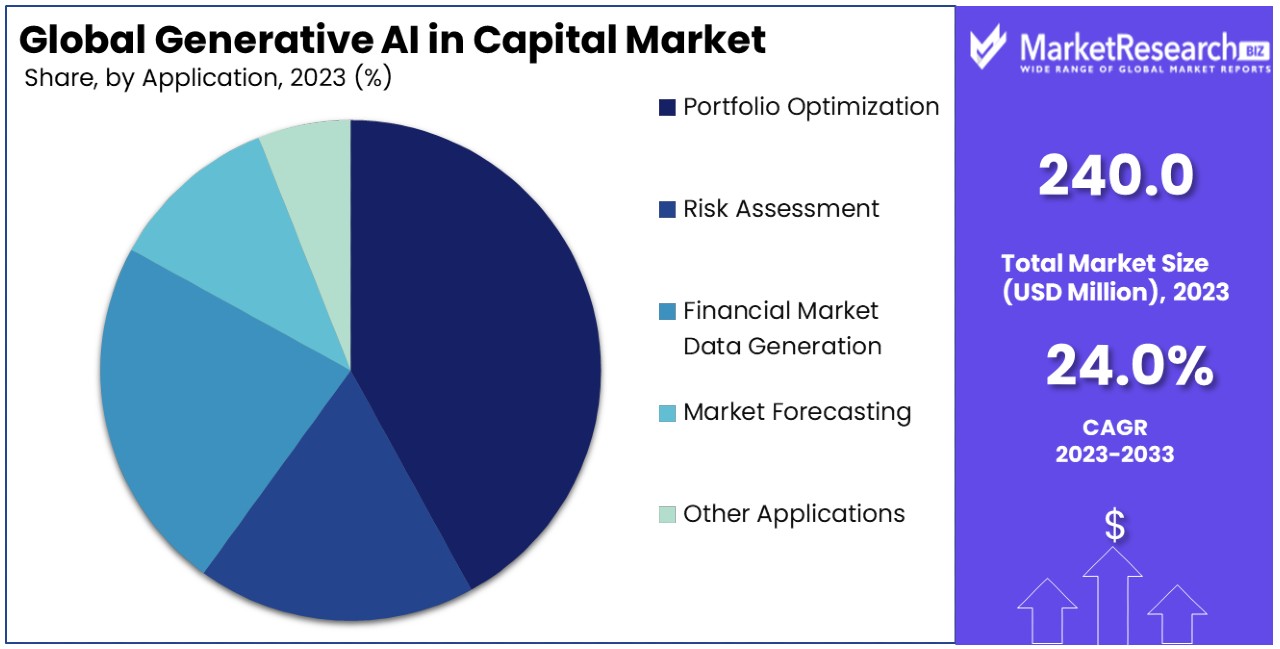
- Application: Portfolio Optimization holds the majority share at 42%, followed by various other applications such as risk assessment, financial market data generation, and market forecasting.
- End-User: Financial Institutions lead the market with 51% share, leveraging generative AI for various applications including customer service and compliance monitoring.
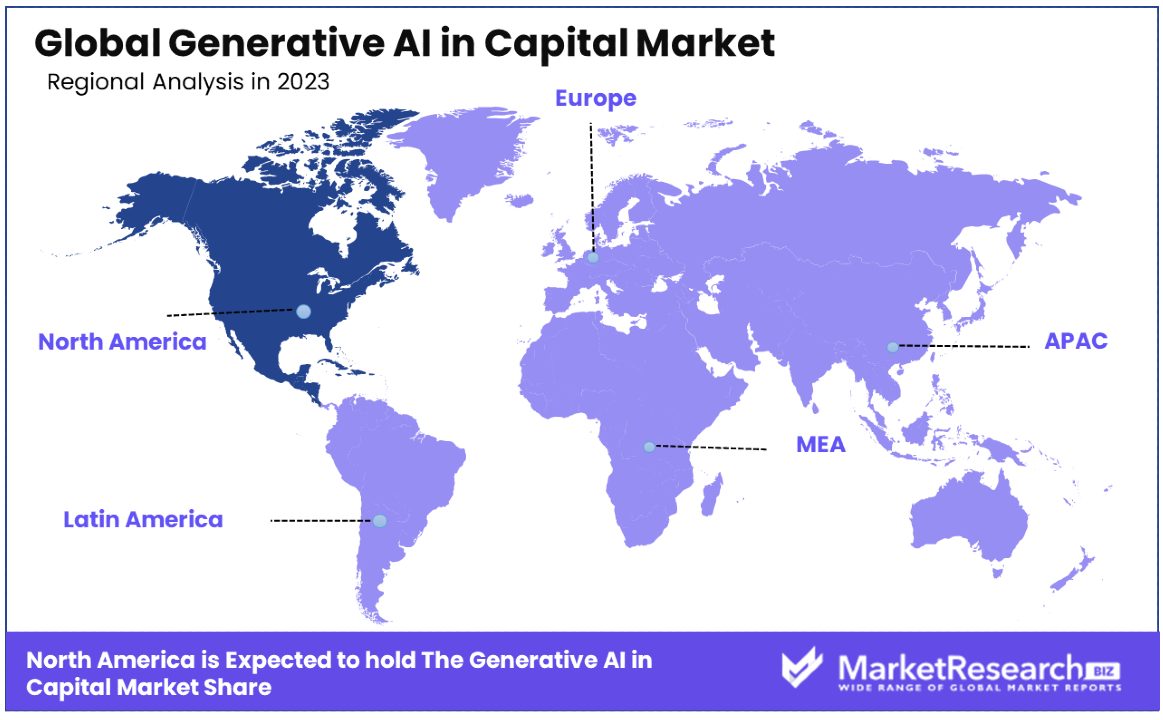
- Regional Analysis: North America dominates with 42% market share, while Europe follows closely, focusing on regulatory compliance and ethical AI integration.
- Key Players: IBM, NVIDIA Corporation, Goldman Sachs, JPMorgan Chase, BlackRock, Citadel, Bloomberg, DataRobot, and various other significant contributors to the market's growth and innovation.
- Analyst Viewpoint: The rapid adoption of generative AI technologies by financial leaders signifies optimism regarding its potential to reshape the capital market landscape, offering increased efficiency, enhanced predictive capabilities, and the creation of novel financial instruments.
- Growth Opportunities:
- Democratizing Access to Insights: By democratizing access to advanced analytics and insights, generative AI expands the target market for AI vendors, fosters a competitive financial ecosystem, and stimulates innovation.
- New Revenue Streams from Data Monetization: Generative AI enables firms to transform proprietary data into actionable insights, unlocking new revenue streams through data monetization, and encouraging a data-driven culture within organizations.
Driving Factors
Personalized Insights Drive Market Growth
Generative AI's ability to synthesize vast datasets and language models into personalized insights and recommendations is revolutionizing the capital market. This technology tailors investment ideas and portfolio strategies to each investor's unique objectives, a level of customization previously unattainable.
By leveraging generative AI, financial services can offer bespoke advice, enhancing client satisfaction and engagement, which, in turn, drives market growth. The demand for generative ai in financial solutions is a testament to the evolving expectations of investors, who now seek more tailored advice and strategic insights, pushing firms to adopt generative AI technologies to meet these demands.
Constant Idea Generation Fuels Innovation
The need for perpetual idea generation in the capital market is met head-on by generative AI's capability to produce novel investment hypotheses and trading strategies. By analyzing vast and complex datasets, generative AI enables fund managers to continuously discover new, alpha-generating ideas, keeping their strategies ahead of market curves.
This constant influx of innovation not only enhances competitive advantage but also propels the market forward by ensuring that investment approaches are continuously evolving, reflecting the dynamic nature of financial markets.
Lowering Research Costs Enhances Efficiency
Generative AI significantly reduces the operational costs associated with the time-consuming tasks of data collection and analysis traditionally performed by junior analysts. By automating these repetitive processes, firms can allocate their human resources to more strategic, high-value tasks, thereby improving overall efficiency and productivity.
This reduction in research costs is a critical factor driving the growth of generative AI in the capital market, as it allows for the reallocation of resources towards innovation and development, further fueling market expansion.
Rapid Analysis Accelerates Decision-Making
In the fast-paced environment of the capital market, the ability to quickly analyze earnings transcripts, news, and filings for timely investment recommendations is invaluable. Generative AI's speed in processing and generating actionable insights enables traders and fund managers to make informed, data-backed decisions swiftly.
This capability is crucial for capitalizing on time-sensitive opportunities and mitigating risks, thereby enhancing market responsiveness and agility. The integration of generative AI into decision-making processes marks a significant shift towards more dynamic and efficient market operations, contributing to the industry's growth.
Restraining Factors
Data Privacy and Security Risks Restrain Market Growth
The reliance of generative AI tools on vast amounts of data, encompassing personal and sensitive information, poses significant privacy and security challenges. The technology's potential inability to fully anonymize data raises concerns, as does the risk of data breaches. These risks can make firms cautious about adopting generative AI technologies, fearing reputational damage and regulatory penalties.
The apprehension around data privacy and security not only hampers the willingness of companies to fully integrate generative AI into their operations but also restricts the technology's potential market expansion. Ensuring robust data protection measures is crucial for overcoming these barriers and fostering growth in the capital market sector.
Mistrust of Recommendations Limits Technology Adoption
The opaque nature of generative AI's decision-making process can lead to a mistrust of its recommendations. Traders and decision-makers often seek clarity and understandability in the insights provided, preferring technologies that offer explainable and transparent results. The skepticism towards AI-generated trading signals and investment strategies, due to a lack of transparency, can deter firms from fully embracing generative AI.
This mistrust acts as a significant obstacle to the technology's adoption and, consequently, its growth within the capital market. Addressing these concerns through more transparent and explainable AI models could mitigate resistance and enable broader acceptance and integration of generative AI solutions.
Deployment Mode Analysis
In Generative AI in the Capital Market, deployment mode emerges as a critical segment for analysis, with "On-Premises" solutions currently dominating, accounting for 59% of the market. This preference for on-premises deployment is largely attributed to the enhanced security and control it offers financial institutions, a paramount concern given the sensitive nature of financial data.
Firms opt for on-premises systems to maintain direct oversight of their data management and AI operations, mitigating risks associated with data breaches and unauthorized access that are more prevalent in cloud-based environments.
However, the cloud-based segment, despite being the smaller portion, plays a significant role in the market's growth. It offers scalability, flexibility, and cost-efficiency, appealing particularly to smaller firms and startups in the financial sector that may not have the resources for substantial on-premises infrastructure.
Cloud-based solutions enable these smaller entities to leverage generative AI capabilities, democratizing access to advanced analytical tools and fostering innovation across the market. As cloud security technologies improve and regulatory compliance becomes more streamlined, the cloud-based segment is expected to gain traction, potentially shifting the balance in deployment mode preferences over time.
Application Analysis
Within the application segment of Generative AI in the Capital Market, "Portfolio Optimization" stands out as the dominant sub-segment, capturing 42% of the market. The drive towards portfolio optimization using generative AI stems from the technology's ability to analyze vast datasets, identify patterns and generate predictive models that can inform more nuanced, strategic asset allocation. This capability is invaluable in enhancing returns while managing risk, thus appealing to a wide range of market participants.
Other applications, including risk assessment, financial market data generation, market forecasting, and various other applications, contribute significantly to the technology's adoption. Risk assessment uses generative AI to predict and mitigate potential financial losses, while financial market data generation and market forecasting apply AI to create actionable insights for future market movements.
These segments, though not as dominant as portfolio optimization, are essential in providing a comprehensive suite of tools that empower financial institutions, analysts, private equity and investors to make informed decisions, thereby supporting the overall growth of the generative AI market in capital markets.
End-User Analysis
The "Financial Institutions" segment is the most significant end-user of Generative AI in the Capital Market, accounting for 51% of the market. This dominance is due to the critical role that generative AI plays in transforming traditional banking and investment practices, offering unprecedented efficiency, accuracy, and insight into financial operations.
Financial institutions leverage generative AI for a range of applications from customer service to compliance monitoring, benefiting from the technology's capacity to process and analyze large volumes of data at unparalleled speed.
Other end-users, including financial analysts, institutional investors, and various other stakeholders, also significantly benefit from generative AI. Financial analysts use the technology for deep data analysis and trend prediction, institutional investors for enhanced decision-making processes, and other end-users for a variety of innovative applications tailored to their specific needs.
Though not as dominant as financial institutions, these segments are crucial for the diversified application and continued growth of generative AI in the capital market, driving forward the industry's evolution with new demands and applications of the technology.
Key Market Segments
Based on Deployment Mode
- On-Premises
- Cloud-Based
Based on Application
- Portfolio Optimization
- Risk Assessment
- Financial Market Data Generation
- Market Forecasting
- Other Applications
Based on End-User
- Financial Institutions
- Financial Analysts
- Institutional Investors
- Other End-Users
Growth Opportunities
Democratizing Access to Insights Offers Growth Opportunity
The advent of generative AI in the capital market significantly democratizes access to advanced analytics, language models and insights, traditionally the preserve of larger firms with substantial resources. By making these technologies available and affordable, smaller firms and retail investors can now leverage sophisticated analytical tools to inform their investment decisions.
This democratization not only expands the target market for AI vendors but also fosters a more competitive and inclusive financial ecosystem. As a result, the technology's adoption is poised to accelerate, broadening the customer base and enhancing market penetration for generative AI solutions. This shift not only promises to level the playing field but also stimulates innovation and growth within the industry.
New Revenue Streams from Data Monetization Offers Growth Opportunity
The capability of generative AI to transform proprietary data into actionable insights presents a lucrative opportunity for firms to monetize their data assets. By leveraging generative AI, companies can develop and sell bespoke analytical products and services, creating new revenue streams that were previously untapped.
This approach not only maximizes the value of existing data but also encourages the cultivation of a data-driven culture within organizations, emphasizing the strategic importance of data accumulation and analysis. As more firms recognize and harness the potential of data monetization through generative AI, the capital market is likely to see an influx of innovative products and services, driving further growth and diversification in the sector.
Trending Factors
AI-Native Hedge Funds Are Trending Factors
The emergence of "AI-native" hedge funds marks a significant trend in the capital market, demonstrating a growing appetite for integrating generative AI at the foundational level of investment strategies and operations. These funds, built around AI from their inception, are setting new benchmarks for efficiency, performance, and innovation.
By embedding generative AI deeply into their core processes, these hedge funds are not only optimizing their investment approaches but also signaling a shift towards more technologically advanced and data-driven financial models and analysis. This trend reflects the industry's recognition of generative AI's transformative potential, promising to reshape the landscape of investment management with enhanced analytical capabilities and strategic foresight.
Generative AI for Novel Datasets Are Trending Factors
Utilizing generative AI to explore new and alternative datasets, such as online prices, job postings, and social media feeds, is becoming a trending factor in the capital market. This approach allows firms to gain an information edge by unlocking unique insights that were previously inaccessible or overlooked.
The ability to analyze and derive value from unconventional data sources equips market participants with a more comprehensive view of market dynamics and consumer behavior, leading to more informed decision-making. As a result, generative AI's application in harnessing novel datasets is not just a trend but a strategic advantage, expanding the horizons of financial analysis and investment strategy.
Automated Report and Memo Generation Are Trending Factors
The use of generative AI for automating the generation of performance reports, portfolio commentary, and risk memos represents a significant trending factor in the capital market. This application of AI technology is streamlining administrative tasks, saving considerable time and effort for financial analysts and fund managers.
By automating these processes, firms can allocate more resources to strategic analysis and decision-making, enhancing productivity and operational efficiency. The trend towards automated report and memo generation underscores the broader adoption of AI in optimizing back-office functions and highlights the growing reliance on technology to improve both the speed and quality of financial reporting and documentation.
Regional Analysis
North America Dominates with 42% Market Share
North America's commanding 42% share in the Generative AI in the Capital Market underscores its pivotal role in shaping the industry's global landscape. This dominance is driven by a robust ecosystem of technological innovation, strong investment in AI research and development, and the presence of leading AI companies and startups. The region's advanced financial markets, coupled with a high degree of digital literacy among businesses and consumers, further bolster its leading position.
The key factors contributing to North America's high market share include its early adoption of AI technologies, substantial investments from both private and public sectors, and a strong regulatory framework supporting innovation while ensuring data protection. The region's universities and research institutions also play a critical role in advancing AI technology, making it a hub for talent and innovation.
The market dynamics in North America are characterized by a competitive landscape where firms continuously seek technological advancements to gain an edge. The widespread acceptance of digital transformation across industries, especially in financial services, has made the region a fertile ground for applying generative AI in capital markets.
In comparison, other regions also show promising growth and contributions to the global market:
- Europe follows with a strong focus on regulatory compliance and ethical AI, harnessing its robust financial sector for AI integration.
- Asia Pacific is rapidly catching up, driven by massive digitalization efforts, significant investments in AI, and a booming tech startup ecosystem.
- Middle East & Africa show emerging potential with increasing digital transformation initiatives and strategic investments in AI to diversify away from traditional sectors.
- Latin America, though smaller in market share, is witnessing a growing interest in AI applications within its financial services sector, spurred by digital banking and fintech innovations.
Key Regions and Countries
- North America
- The US
- Canada
- Mexico
- Western Europe
- Germany
- France
- The UK
- Spain
- Italy
- Portugal
- Ireland
- Austria
- Switzerland
- Benelux
- Nordic
- Rest of Western Europe
- Eastern Europe
- Russia
- Poland
- The Czech Republic
- Greece
- Rest of Eastern Europe
- APAC
- China
- Japan
- South Korea
- India
- Australia & New Zealand
- Indonesia
- Malaysia
- Philippines
- Singapore
- Thailand
- Vietnam
- Rest of APAC
- Latin America
- Brazil
- Colombia
- Chile
- Argentina
- Costa Rica
- Rest of Latin America
- Middle East & Africa
- Algeria
- Egypt
- Israel
- Kuwait
- Nigeria
- Saudi Arabia
- South Africa
- Turkey
- United Arab Emirates
- Rest of MEA
Key Players Analysis
The competitive landscape of the generative AI market in the capital markets sector is defined by a mix of technology giants, consultancy powerhouses, and specialized firms, each leveraging their unique expertise to drive innovation and adoption. AlphaSense is a key player focused on providing AI-powered market intelligence solutions. Its platform enables capital market professionals to derive actionable insights from vast datasets, enhancing decision-making in trading and investment. AlphaSense’s emphasis on real-time insights and natural language processing positions it as a leader in AI-driven research tools.
Amazon Web Services, Inc. (AWS) leverages its unparalleled cloud infrastructure and advanced AI solutions, such as AWS SageMaker, to empower financial institutions. AWS enables scalable and efficient deployment of generative AI models, facilitating applications like algorithmic trading, sentiment analysis, and fraud detection. This flexibility is crucial for capital market participants who require tailored AI capabilities.
Birlasoft brings a consulting-driven approach, offering industry-specific AI solutions to optimize processes in areas like portfolio management, risk assessment, and compliance. Its deep integration of AI technologies into existing workflows allows for seamless adoption by capital market firms.
EY (Ernst & Young) plays a vital role as an advisory leader, helping firms implement generative AI for strategic advantages. EY’s focus on compliance, risk management, and operational efficiency ensures organizations leverage AI responsibly while driving growth.
IBM Corporation, with its Watson AI suite, delivers advanced analytics, NLP, and AI-powered insights to transform how capital markets operate. IBM’s focus on hybrid cloud and enterprise-grade AI makes it a trusted partner for large-scale financial institutions.
Linedata caters specifically to asset management and lending markets, integrating generative AI into its software platforms to streamline operations, improve client servicing, and enhance investment strategies.
Microsoft leverages Azure OpenAI Service and its extensive AI research to enable innovation in capital markets. Its solutions empower firms to adopt generative AI for predictive analytics, portfolio optimization, and enhanced customer engagement.
Tata Consultancy Services Limited (TCS) integrates generative AI into its financial services offerings, enabling firms to modernize operations, improve decision-making, and enhance customer experiences. TCS’s deep domain expertise ensures targeted AI applications that align with market needs.
Market Key Players
- Alpha Sense
- Amazon Web Services, Inc.
- Birlasoft
- EY (Ernst & Young)
- IBM Corporation
- Linedata
- Microsoft
- TATA Consultancy Services Limited
Recent Developments
- Recent research by Amnesty International USA and the Business & Human Rights Resource Centre highlights the failure of leading VC firms to implement basic human rights due diligence processes when funding companies developing Generative AI technologies
- CalypsoAI has partnered with Deloitte Middle East to leverage the capabilities of its enterprise-grade AI security and enablement platform, Moderator, in the Middle East region.
- Morgan Stanley has commended Apple's decision to shift its focus from electric vehicles (EVs) to generative AI (GenAI) following the halt of its Project Titan initiative.
Report Scope
Report Features Description Market Value (2023) USD 240 Million Forecast Revenue (2033) USD 1,995 Million CAGR (2024-2033) 24% Base Year for Estimation 2023 Historic Period 2018-2023 Forecast Period 2024-2033 Report Coverage Revenue Forecast, Market Dynamics, Competitive Landscape, Recent Developments Segments Covered By Deployment Mode (On-Premises, Cloud-Based), By Application (Portfolio Optimization, Risk Assessment, Financial Market Data Generation, Market Forecasting, Other Applications), By End-User (Financial Institutions, Financial Analysts, Institutional Investors, Other End-Users) Regional Analysis North America - The US, Canada, & Mexico; Western Europe - Germany, France, The UK, Spain, Italy, Portugal, Ireland, Austria, Switzerland, Benelux, Nordic, & Rest of Western Europe; Eastern Europe - Russia, Poland, The Czech Republic, Greece, & Rest of Eastern Europe; APAC - China, Japan, South Korea, India, Australia & New Zealand, Indonesia, Malaysia, Philippines, Singapore, Thailand, Vietnam, & Rest of APAC; Latin America - Brazil, Colombia, Chile, Argentina, Costa Rica, & Rest of Latin America; Middle East & Africa - Algeria, Egypt, Israel, Kuwait, Nigeria, Saudi Arabia, South Africa, Turkey, United Arab Emirates, & Rest of MEA Competitive Landscape Alpha Sense, Amazon Web Services, Inc., Birlasoft, EY (Ernst & Young), IBM Corporation, Linedata, Microsoft, TATA Consultancy Services Limited Customization Scope Customization for segments, region/country-level will be provided. Moreover, additional customization can be done based on the requirements. Purchase Options We have three licenses to opt for: Single User License, Multi-User License (Up to 5 Users), Corporate Use License (Unlimited User and Printable PDF) -
-
- Alpha Sense
- Amazon Web Services, Inc.
- Birlasoft
- EY (Ernst & Young)
- IBM Corporation
- Linedata
- Microsoft
- TATA Consultancy Services Limited
Our Clients


View Our Licence Options
