Global Shea Butter Market Report By Grade (Grade A (Unrefined or Raw) , Grade B (Refined)), By End Use (Cosmetics & Personal Care , Pharmaceuticals , Food & Beverages , Industrial), By Product Form (Solid Shea Butter , Liquid Shea Butter , Shea Butter Blends), By Distribution Channel (Offline Retail , Online Retail , Direct Sales), By Region and Companies - Industry Segment Outlook, Market Assessment, Competition Scenario, Trends and Forecast 2024-2033
-
1526
-
April 2024
-
280
-


-
This report was compiled by Shreyas Rokade Shreyas Rokade is a seasoned Research Analyst with CMFE, bringing extensive expertise in market research and consulting, with a strong background in Chemical Engineering. Correspondence Team Lead-CMFE Linkedin | Detailed Market research Methodology Our methodology involves a mix of primary research, including interviews with leading mental health experts, and secondary research from reputable medical journals and databases. View Detailed Methodology Page
-
Quick Navigation
Report Overview
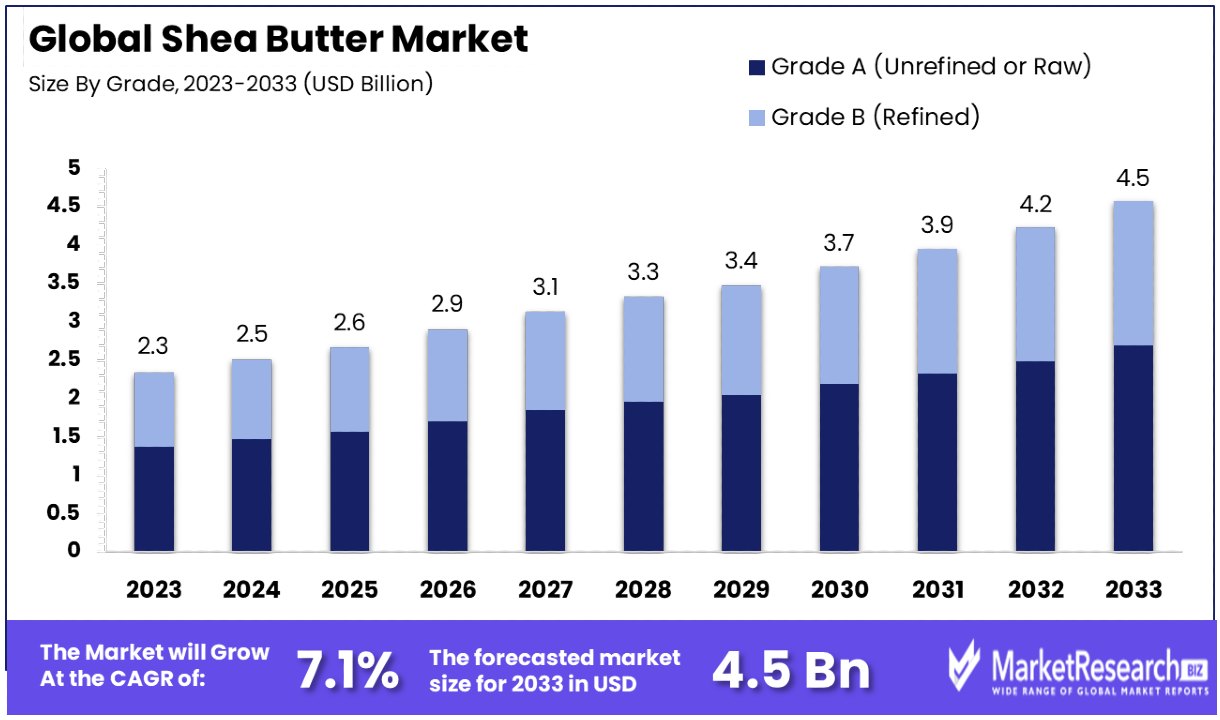
The Global Shea Butter Market size is expected to be worth around USD 4.5 Billion by 2033, from USD 2.3 Billion in 2023, growing at a CAGR of 7.10% during the forecast period from 2024 to 2033.
The surge in demand in the personal care and cosmetic industries, food, and pharmaceutical sectors are some of the main driving factors for the global shea butter market. Shea butter is commonly used in body lotions, face cream, foundation, face concealer, face masks, shampoos, and other personal care items.
Shea butter is rich in minerals, palmitic and linoleic acids, antioxidants, vitamins, fatty acids, and other necessary nutrients that provide smooth, radiant, and clear skin. It protects skin from harmful UV rays, environmental pollution, and dust. Shea butter is also used for treatment purposes such as eczema, psoriasis, and other skin disorders.
According to the Nigerian journal of tropical engineering, there are functional groups and compositions for the formation of shea butter, such as a mixture of stearic, oleic, linoleic, palmitic, and arachidic fatty acids with other bioactive elements that are highly influenced by the climatic conditions of the shea tree, the shea kernel, and the extraction technique of shea butter.
The usage of shea butter is widely seen in pharmaceuticals, cosmetics, and chocolates, which are influenced by the composition and applications of butter. To analyze the composition and functional group of fatty acids, the researchers used Fourier transformation infrared spectroscopy and gas chromatography-mass spectroscopy.
It was observed that shea butter is extracted from shea kernels by using traditional techniques that combine 45.9% stearic and 39.2% oleic acid with some of the other bioactive elements. This analysis and research state that the substantial importance of processing parameters is shaping the shea butter ingredients and composition, which have great importance in the personal care, cosmetics, and food industries.
Shea butter plays a vital role in the food manufacturing industry. It is one of the preferred ingredients in the food industry due to its unique taste and flavor, as well as its several health advantages. It is used in baking, pastry, sauces, confections, ethnic cuisines, and beverages.
Shea butter is used as a substitute for traditional butter for baking cookies or biscuits; as a main ingredient in condiments or in any type of beverage, it has been an ideal choice for consumers due to its health benefits. The market for global shea butter will expand in the coming years due to its exceptional taste and health benefits, as well as consumer demand.
Key Takeaways
Market Value: The Global Shea Butter Market is projected to reach approximately USD 4.5 Billion by 2033, showing significant growth from USD 2.3 Billion in 2023, with a CAGR of 7.10% during the forecast period from 2024 to 2033.
Dominant Segments:
- Grade Analysis: Grade A Shea Butter (Unrefined or Raw) dominates the market, capturing a 58% share. The preference for Grade A is driven by its natural benefits, including superior moisturizing qualities and antioxidant properties, aligning with consumer demand for natural skincare products.
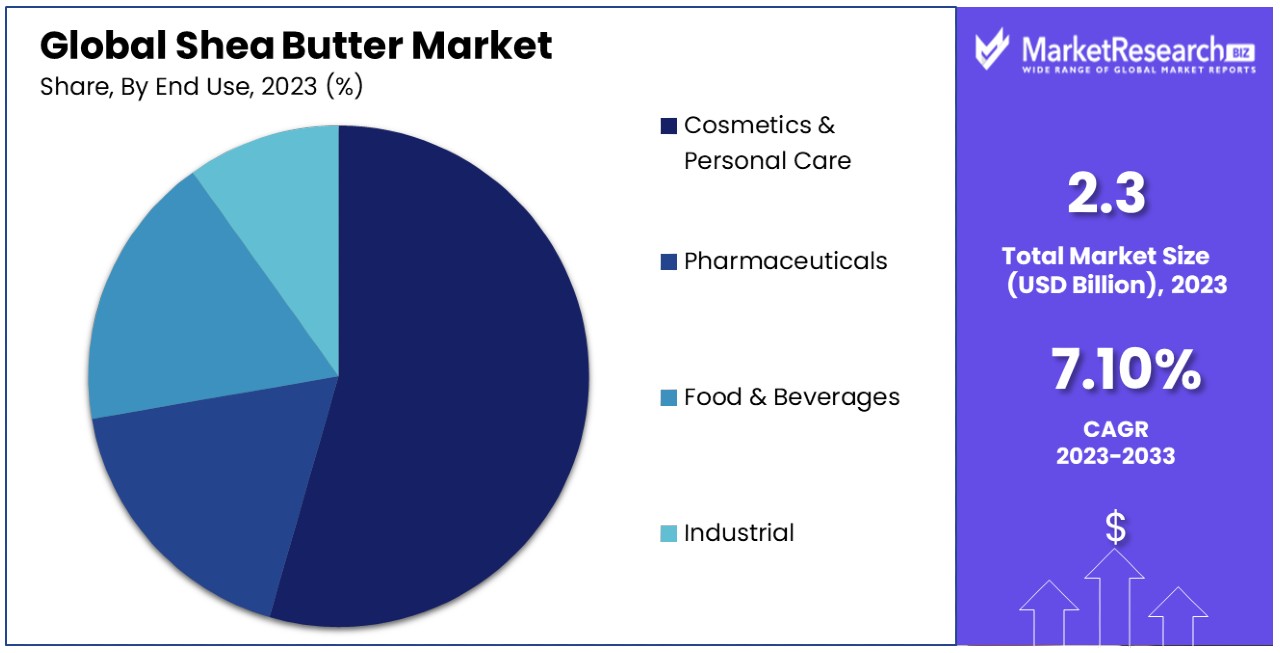
- End Use Analysis: The Cosmetics & Personal Care segment drives market growth, accounting for 55% of the market. Shea butter's natural properties make it a preferred ingredient in skincare products, catering to the increasing demand for natural and organic cosmetics.
- Product Form Analysis: Solid Shea Butter leads the market in product forms, holding a 55% share. Valued for its natural appeal and traditional usage, solid shea butter is favored in cosmetics, pharmaceuticals, and food industries.
- Distribution Channel Analysis: Offline Retail, including supermarkets, specialty stores, and pharmacies, dominates distribution channels. However, Online Retail is rapidly growing due to consumer preference for convenience and the wide range of products available. Direct Sales offer transparency and trust, allowing consumers to purchase directly from producers.
Regional Insights:
- Europe: Dominates the market with a 35.8% share, driven by the growing trend towards natural and organic personal care products and increased awareness of shea butter's benefits.
- North America: Follows closely, with a significant market share of approximately 28.4%, propelled by similar trends towards natural skincare products and consumer awareness of shea butter's advantages.
Analyst Viewpoint: Analysts anticipate continued growth in the shea butter market, fueled by the increasing demand for natural skincare products, consumer awareness of shea butter's benefits, and the growing trend towards sustainability and ethical sourcing.
Driving Factors
Increasing Demand for Natural and Sustainable Cosmetic Ingredients Drives Market Growth
The global cosmetics industry is rapidly evolving, with a significant shift towards natural and sustainable ingredients. This transformation is primarily driven by consumer preferences leaning heavily towards eco-friendly and vegan products. Shea butter, with its origins in the nuts of the shea tree, stands out as a prime example of this trend. Its inherent moisturizing, anti-inflammatory, and antioxidant properties make it an invaluable ingredient in the formulation of cosmetics and personal care products.
Statistics reveal that major cosmetic brands like L'Occitane and The Body Shop, recognizing the growing consumer demand, have integrated shea butter into numerous product lines, thus propelling the market forward. The adoption of shea butter by these brands not only underscores the ingredient's popularity but also its contribution to market growth. This factor is interconnected with the broader market dynamics, where the demand for natural ingredients stimulates innovation and diversification in product offerings, reinforcing the market's expansion trajectory.
Rising Popularity of Shea Butter in the Food and Confectionery Industry Fuels Market Expansion
Shea butter's ascent in the food and confectionery sector marks a notable trend in consumer preferences towards natural and healthy ingredients. Its distinctive nutty flavor and high smoke point render it an excellent choice for baked goods, chocolates, and other confectioneries. Companies like Cargill and AAK have recognized this potential, incorporating shea butter into their food products, which in turn contributes to the market's growth.
The integration of shea butter in the food industry not only diversifies its applications but also complements the growing consumer inclination towards healthier, natural food options. This trend is expected to continue, with the food industry's innovative use of shea butter playing a critical role in the market's expansion, driven by both consumer demand and the ingredient's versatile properties.
Expansion of the Pharmaceutical and Healthcare Industry Boosts Shea Butter Market
The therapeutic properties of shea butter, including its anti-inflammatory and healing qualities, have catalyzed its adoption in the pharmaceutical and healthcare industries. Its application in skincare products, ointments, and creams for treating various skin conditions such as eczema and dermatitis highlights its therapeutic value. This expansion into healthcare has significantly contributed to the growth of the shea butter market.
The intersection of shea butter's properties with the industry's needs showcases a broader trend towards natural and effective ingredients in healthcare products. As the pharmaceutical and healthcare sectors continue to grow, the demand for shea butter is expected to rise correspondingly, underscoring its role in market expansion.
Growth of the Organic and Fair Trade Movements Elevates Shea Butter Market
The organic and fair trade movements have had a profound impact on the shea butter market. Produced traditionally and sustainably by rural communities in West Africa, shea butter embodies the principles of these movements. The increasing consumer demand for organic and ethically sourced products has driven significant growth in the market for shea butter from certified and responsible sources.
This shift reflects a broader consumer trend towards sustainability and ethical consumption, influencing market dynamics across various industries. The synergy between shea butter's production and the values of the organic and fair trade movements not only enhances its market appeal but also contributes to the sustainable development of the communities involved in its production, thus supporting the market's growth in a socially responsible manner.
Restraining Factors
Dependence on Traditional and Unreliable Supply Chains Restrains Market Growth
The global shea butter market faces significant challenges due to its reliance on traditional and often unreliable supply chains. Originating in rural West African communities, the production of shea butter is susceptible to various unpredictable factors such as adverse weather conditions, political instability, and inconsistent yields.
These elements contribute to supply disruptions, resulting in price volatility and potential shortages of shea nuts. Such instability in the supply chain poses a major hurdle for the market's steady growth, as it impacts the reliability and predictability that buyers and manufacturers depend on. Without a consistent supply, it becomes difficult for the market to maintain growth momentum, directly affecting the pricing and availability of shea butter on the global stage.
Limited Availability of Organic and Fair Trade Certified Shea Butter Limits Market Expansion
The growing consumer demand for organic and fair trade certified shea butter highlights a significant gap in the market: the limited availability of such certified products. Despite the rising consumer preference for ethically sourced and organic products, small-scale producers, particularly those in rural areas, face challenges in obtaining certification. The process is often complex and costly, creating a barrier for these producers to enter the market fully.
This discrepancy between demand and supply restricts market growth and undermines the potential for producers to leverage the organic and fair trade movements to their advantage. As a result, even though the demand for certified shea butter is increasing, the market's expansion is hindered by the lack of readily available certified products, impacting both producers and consumers seeking ethical and sustainable choices.
Grade Analysis
Grade A Shea Butter Dominates Market, Accounting for 58% Share, with Natural Benefits and Consumer Preference
In the Global Shea Butter Market, the classification by grade plays a pivotal role in understanding market dynamics. The dominant sub-segment here is Grade A (Unrefined or Raw) shea butter, which accounts for 58% of the market. This preference for Grade A shea butter is largely due to its minimal processing, which retains most of its natural vitamins, minerals, and other beneficial properties. Consumers and manufacturers favor Grade A shea butter for its superior moisturizing qualities, antioxidants, and anti-inflammatory compounds, making it highly sought after in cosmetics, personal care products, and even in pharmaceutical applications for skin care treatments.
The trend towards natural and organic skincare and food products has significantly contributed to the dominance of Grade A shea butter. As consumers become more informed about the ingredients in their products, there is a growing demand for unrefined, sustainably sourced ingredients that offer health benefits without the use of chemicals or additives. This consumer preference is supported by research indicating the effectiveness of natural ingredients like shea butter in hydrating the skin, reducing inflammation, and improving skin conditions such as eczema and dermatitis.
On the other hand, Grade B (Refined) shea butter, while not as dominant, still plays a crucial role in the market, particularly in applications where the odor and color of unrefined shea butter might be undesirable, such as in certain cosmetics and industrial applications. Refined shea butter undergoes processing to remove impurities, resulting in a more uniform product with a longer shelf life but fewer natural nutrients. The demand for Grade B shea butter highlights the market's diversity and the range of consumer preferences and application requirements. However, the push towards more natural and less processed products could potentially limit the growth of this segment.
End Use Analysis
Cosmetics & Personal Care Drive 55% Growth in Global Shea Butter Market with Natural Ingredients Trend
The segmentation by end use reveals Cosmetics & Personal Care as the dominant sub-segment within the Global Shea Butter Market, accounting for 55% of the market. This predominance is attributed to the extensive use of shea butter in a wide range of products, including moisturizers, lotions, lip balms, and hair care products. The natural properties of shea butter, such as its high concentrations of fatty acids and vitamins, make it an ideal ingredient for moisturizing and repairing skin. Moreover, its anti-inflammatory and antioxidant properties align with the increasing consumer demand for natural and beneficial ingredients in their skincare routines.
The cosmetic and personal care industry's growth is further propelled by the global awareness of the benefits of using natural ingredients over synthetic alternatives. Consumers are increasingly seeking products that are not only effective but also environmentally friendly and ethically sourced. Shea butter's versatility and the ability to be incorporated into various formulations without the need for synthetic additives make it highly appealing to both consumers and manufacturers.
While the Cosmetics & Personal Care segment leads the market, the Pharmaceuticals, Food & Beverages, and Industrial segments also contribute significantly to the market's diversity and growth. In Pharmaceuticals, shea butter is utilized for its therapeutic properties, especially in products designed for skin care and treatment. The Food & Beverages segment capitalizes on shea butter's nutritional value and its use as a cocoa butter substitute, while the Industrial segment finds value in shea butter's applications in candles, soaps, and lubricants.
Product Form Analysis
Solid Shea Butter Leads Product Forms Market with Tradition and Natural Appeal, Holding 55% Share
The Shea Butter Market, distinguished by its versatile product forms, offers Solid Shea Butter, Liquid Shea Butter, and Shea Butter Blends, each catering to different consumer preferences and application requirements. Solid Shea Butter emerges as the dominant sub-segment, attributed to its extensive application in cosmetics, pharmaceuticals, and food industries.
Esteemed for its natural properties, including high concentrations of vitamins and fatty acids, solid shea butter is a preferred ingredient in products aiming for moisturization, skin healing, and anti-inflammatory benefits. The dominance of solid shea butter is underlined by its traditional usage and the consumer's perception of its pure and unaltered state, which aligns with the growing demand for natural and organic products.
Despite the prominence of solid shea butter, Liquid Shea Butter and Shea Butter Blends play significant roles in the market's growth. Liquid Shea Butter, appreciated for its convenience and ease of application, particularly in hair care and liquid cosmetic formulations, is gaining traction. Its fluid form allows for innovative product development and application, catering to a niche yet growing consumer base looking for lightweight and easy-to-absorb products.
Shea Butter Blends, combining shea butter with other oils or butters, are designed to enhance functional properties or to adjust the product's sensory attributes. These blends are becoming popular in both personal care and food industries, offering customized solutions that leverage shea butter's benefits while addressing specific consumer needs or preferences.
Distribution Channel Analysis
Offline Retail Takes Center Stage in Shea Butter Distribution, Online Retail Gains Momentum, Accounting for 55% of Sales
In the distribution channels for the Global Shea Butter Market, Offline Retail and Online Retail, along with Direct Sales, serve as primary conduits for reaching consumers. Offline Retail, comprising Supermarkets, Specialty Stores, and Pharmacies, stands as the dominant distribution channel. This predominance is due to the widespread availability and consumer trust in purchasing through these traditional outlets. Consumers value the tactile experience of evaluating products firsthand and the immediate availability that offline retail offers. Specialty stores, in particular, provide a platform for premium shea butter products, catering to consumers seeking organic, fair-trade, or specialty formulations.
Online Retail, however, is rapidly gaining ground, reflecting broader trends in consumer behavior towards convenience and the wide range of products available through e-commerce platforms. This channel allows for easy access to a broad array of shea butter products, from raw, unrefined butters to sophisticated blends and formulations. The growth of online retail is fueled by the increasing comfort of consumers with online shopping, driven by detailed product information, reviews, and the ease of home delivery.
Direct Sales, including Company-owned stores and farmers markets, offer a unique value proposition by providing consumers with the opportunity to purchase directly from producers. This channel promotes transparency and trust, allowing consumers to learn about the sourcing, production processes, and benefits of shea butter products directly from the source. While smaller in scale compared to offline and online retail, direct sales play a crucial role in building brand loyalty and educating consumers, particularly those prioritizing ethical sourcing and supporting small-scale producers.
Key Market Segments
By Grade
- Grade A (Unrefined or Raw)
- Grade B (Refined)
By End Use
- Cosmetics & Personal Care
- Pharmaceuticals
- Food & Beverages
- Industrial (e.g., candles, soaps, lubricants)
By Product Form
- Solid Shea Butter
- Liquid Shea Butter
- Shea Butter Blends
By Distribution Channel
- Offline Retail
- Online Retail
- Direct Sales
Growth Opportunities
Product Diversification and Value-Added Products Offer Growth Opportunity
The evolution of the Global Shea Butter Market is significantly bolstered by product diversification and the introduction of value-added shea butter products. This strategy encompasses the enhancement of basic shea butter into specialized formulations tailored to distinct consumer needs and preferences, ranging from whipped shea butter for cosmetics to shea butter-enriched skincare and hair care products. This approach not only broadens the market's appeal across different consumer segments but also elevates the perceived value of shea butter products.
Brands like L'Occitane and SheaMoisture are leading examples, having expanded their product lines to include a variety of shea butter-based offerings that cater to a wide range of consumer demands. This strategy taps into the growing consumer inclination towards natural and multifunctional beauty products, presenting a substantial opportunity for market growth. By continuously innovating and diversifying product offerings, manufacturers can capture a larger market share and meet the increasing consumer demand for personalized and effective natural beauty solutions.
Expansion into Emerging Markets Offers Growth Opportunity
Emerging markets across Asia, Latin America, and the Middle East are ripe with growth opportunities for the shea butter industry. As disposable incomes increase and awareness of the benefits of natural and sustainable products grows in these regions, the demand for shea butter is expected to surge. Capitalizing on this potential requires strategic initiatives, including forging local partnerships, tailoring marketing campaigns to regional preferences, and establishing robust distribution networks.
These efforts can help brands to not only penetrate these burgeoning markets but also to build a loyal customer base by aligning with the values and needs of local consumers. The expansion into emerging markets represents a strategic pathway for the global shea butter market to amplify its reach and impact. Leveraging the natural appeal of shea butter and its sustainability credentials, manufacturers can tap into the growing middle-class population in these regions, driving significant market growth and diversification.
Trending Factors
Clean Beauty and Naturals Trend Are Trending Factors
The clean beauty and naturals trend is reshaping the cosmetics and personal care landscape, marking a significant shift towards products formulated with natural, plant-based ingredients. Shea butter, known for its moisturizing and healing properties, stands at the forefront of this movement. Its natural and sustainable characteristics make it an ideal choice for consumers and manufacturers aiming to adhere to clean beauty standards.
The demand for shea butter in product formulations is on the rise as it perfectly encapsulates the essence of the clean beauty movement, fostering its increasing adoption across various skincare and haircare products. This trend underscores the market's growing preference for ingredients that are not only effective but also environmentally friendly and ethically sourced.
Emphasis on Traceability and Transparency Are Trending Factors
The call for traceability and transparency in the supply chain, especially for products like shea butter, highlights a growing consumer demand to understand the origin and ethical credentials of the products they use. This emphasis is driving manufacturers to adopt more transparent practices, showcasing the journey of shea butter from sourcing to the final product.
Such measures not only satisfy consumer curiosity but also build trust and loyalty by ensuring the ethical and sustainable production of shea butter. The trend towards greater transparency and traceability is reshaping the shea butter market, compelling brands to prioritize and communicate their sourcing and production ethics clearly.
Certification and Labeling Trends Are Trending Factors
Certifications and labeling trends are becoming increasingly significant in the shea butter market, reflecting a broader consumer demand for authenticity and quality assurance. Organic, fair trade, and ethical sourcing certifications serve as a badge of honor for shea butter products, assuring consumers of their purity, quality, and ethical production.
This trend has led manufacturers to pursue these certifications more aggressively and to highlight them on product labels. As consumers become more discerning about the products they choose, certifications play a crucial role in influencing purchasing decisions, driving a marked increase in the demand for certified shea butter products. These trends collectively underscore the market's movement towards greater ethical standards, transparency, and consumer trust.
Regional Analysis
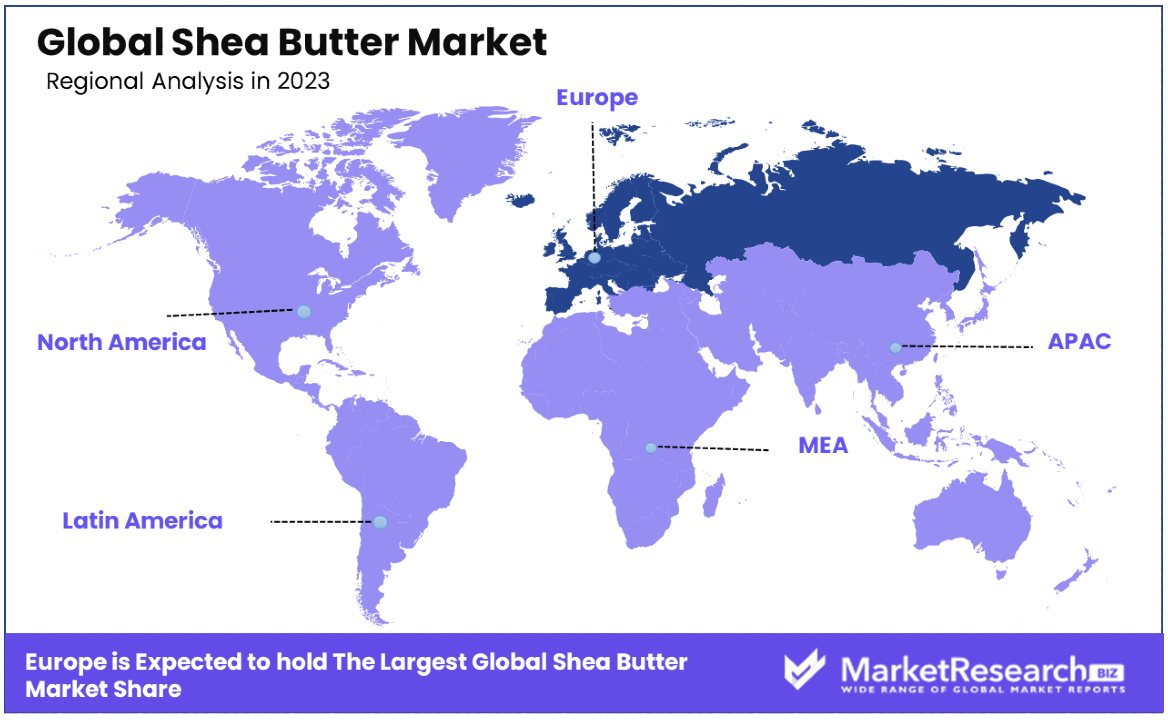
Europe Dominates with 35.8% Market Share
Europe holds a commanding 35.8% share of the Global Shea Butter Market, a testament to the region's robust demand and well-established supply chains. This dominance is underpinned by several key factors, including a strong consumer preference for natural and organic cosmetics and personal care products, stringent regulations favoring sustainable and ethically sourced ingredients, and a well-informed consumer base that values the quality and benefits of shea butter. Europe's market dynamics are characterized by a high level of environmental and social consciousness, driving the demand for products that align with these values.
The region's emphasis on sustainability and ethical sourcing has made it a leading market for shea butter, with consumers willing to pay a premium for products that meet these criteria. The forecast implications suggest that Europe will continue to play a pivotal role in the global shea butter market, especially as consumer awareness and demand for sustainable, natural products grow. European manufacturers and brands are likely to further innovate and expand their range of shea butter-based products, reinforcing the region's influence on market trends and standards.
Market Share in Other Regions:
- North America: North America follows Europe closely, with a significant market share of approximately 28.4%. The region's market is driven by a growing trend towards natural and organic personal care products, alongside a rising awareness of shea butter's benefits.
- Asia Pacific: The Asia Pacific market is rapidly expanding, currently holding around 22.1% of the market share. Factors such as increasing disposable incomes, the influence of Western beauty trends, and a growing middle class are contributing to the surge in demand for shea butter products.
- Middle East & Africa: This region, being the primary source of shea butter, holds about 9.2% of the global market. The market here is expected to grow due to local consumption and the increasing use of shea butter in traditional cosmetics and personal care products.
- Latin America: Latin America, with a smaller share of 4.5%, is seeing a gradual increase in demand for natural cosmetic ingredients, including shea butter, driven by rising consumer awareness and interest in ethical and sustainable products.
Key Regions and Countries
- North America
- The US
- Canada
- Mexico
- Western Europe
- Germany
- France
- The UK
- Spain
- Italy
- Portugal
- Ireland
- Austria
- Switzerland
- Benelux
- Nordic
- Rest of Western Europe
- Eastern Europe
- Russia
- Poland
- The Czech Republic
- Greece
- Rest of Eastern Europe
- APAC
- China
- Japan
- South Korea
- India
- Australia & New Zealand
- Indonesia
- Malaysia
- Philippines
- Singapore
- Thailand
- Vietnam
- Rest of APAC
- Latin America
- Brazil
- Colombia
- Chile
- Argentina
- Costa Rica
- Rest of Latin America
- Middle East & Africa
- Algeria
- Egypt
- Israel
- Kuwait
- Nigeria
- Saudi Arabia
- South Africa
- Turkey
- United Arab Emirates
- Rest of MEA
Key Players Analysis
In the global shea butter market, several key players shape the industry dynamics with their strategic positioning and market influence. Companies like Archer Daniels Midland Company and Bunge Loders Croklaan stand out for their extensive supply chains and international market reach, focusing on both the food and cosmetics sectors.
Producers such as Ghana Nuts Company Ltd. and Savannah Fruits Company leverage their locations in shea-rich regions to ensure a sustainable and high-quality supply, emphasizing ethical sourcing and community support.
European entities like Clariant AG, Vink Chemicals GmbH, and Stern-Wywiol Gruppe GmbH enhance product value through advanced processing technologies and specialization in cosmetic applications, offering premium shea products.
Smaller firms like Suru Chemicals and Karite Shea Butter focus on niche markets, providing artisanal and organic shea butter that caters to eco-conscious consumers. Together, these companies drive the shea butter market, with strategic initiatives around sustainability, quality, and diversified application in beauty and food products defining their market impact.
Market Key Players
- Côte d'Ivoire
- Bunge Loders Croklaan
- Clariant AG
- Suru Chemicals
- Archer Daniels Midland Company
- Ghana Nuts Company Ltd.
- Vink Chemicals GmbH &
- Stern-Wywiol Gruppe GmbH
- Savannah Fruits Company
- Agrobotanicals, LLC
- Karite Shea Butter
Recent Developments
- On March 2024, the Global Shea Alliance (GSA) made a significant commitment during the 2024 Global Shea Conference in Abuja. The GSA pledged to plant and nurture 10 million Shea butter trees by 2030 to ensure the sustainability and future of this valuable product.
- On March 2024, Versed, a skincare brand, introduced a new product called "Press Restart Advanced Retinol Body Butter." This innovative body butter is formulated with advanced retinol to provide effective skincare benefits for the body.
- On March 2024, Niger is poised to elevate its agricultural status as a firm invests $25 million in the production of shea butter, soya, and rice. This significant investment is expected to boost the agricultural sector in Niger, enhancing production capacity and economic growth.
Report Scope
Report Features Description Market Value (2023) USD 2.3 Billion Forecast Revenue (2033) USD 4.5 Billion CAGR (2024-2033) 7.10% Base Year for Estimation 2023 Historic Period 2018-2023 Forecast Period 2024-2033 Report Coverage Revenue Forecast, Market Dynamics, Competitive Landscape, Recent Developments Segments Covered By Grade (Grade A (Unrefined or Raw) , Grade B (Refined)), By End Use (Cosmetics & Personal Care , Pharmaceuticals , Food & Beverages , Industrial), By Product Form (Solid Shea Butter , Liquid Shea Butter , Shea Butter Blends), By Distribution Channel (Offline Retail , Online Retail , Direct Sales) Regional Analysis North America - The US, Canada, & Mexico; Western Europe - Germany, France, The UK, Spain, Italy, Portugal, Ireland, Austria, Switzerland, Benelux, Nordic, & Rest of Western Europe; Eastern Europe - Russia, Poland, The Czech Republic, Greece, & Rest of Eastern Europe; APAC - China, Japan, South Korea, India, Australia & New Zealand, Indonesia, Malaysia, Philippines, Singapore, Thailand, Vietnam, & Rest of APAC; Latin America - Brazil, Colombia, Chile, Argentina, Costa Rica, & Rest of Latin America; Middle East & Africa - Algeria, Egypt, Israel, Kuwait, Nigeria, Saudi Arabia, South Africa, Turkey, United Arab Emirates, & Rest of MEA Competitive Landscape Côte d'Ivoire, Clariant AG, Suru Chemicals, Archer Daniels Midland Company, Ghana Nuts Company Ltd., Vink Chemicals GmbH &, Stern-Wywiol Gruppe GmbH, Savannah Fruits Company, Agrobotanicals, LLC, Karite Shea Butter, Bunge Loders Croklaan Customization Scope Customization for segments, region/country-level will be provided. Moreover, additional customization can be done based on the requirements. Purchase Options We have three licenses to opt for: Single User License, Multi-User License (Up to 5 Users), Corporate Use License (Unlimited User and Printable PDF) -
-
- BASF SE
- Bunge Ltd
- Cargill, Inc.
- Wilmar International
- Ghana Nuts Ltd
- Croda International Plc
- International Oils & Fats Limited
- Suru Chemicals
- Shea Butter H.Q.
- Clariant AG
- VINK Chemicals GmbH & Co. kg
- Other Key Players
Our Clients


View Our Licence Options
