
Global Generative AI in Accounting Market, By Deployment Model (On-Premises Deployment, Cloud Deployment), By Technology (Machine Learning, Natural Language Processing, and Other ), By Region and Companies - Industry Segment Outlook, Market Assessment, Competition Scenario, Trends, and Forecast 2023-2032
-
37632
-
April 2024
-
290
-


-
This report was compiled by Vishwa Gaul Vishwa is an experienced market research and consulting professional with over 8 years of expertise in the ICT industry, contributing to over 700 reports across telecommunications, software, hardware, and digital solutions. Correspondence Team Lead- ICT Linkedin | Detailed Market research Methodology Our methodology involves a mix of primary research, including interviews with leading mental health experts, and secondary research from reputable medical journals and databases. View Detailed Methodology Page
-
Quick Navigation
Report Overview
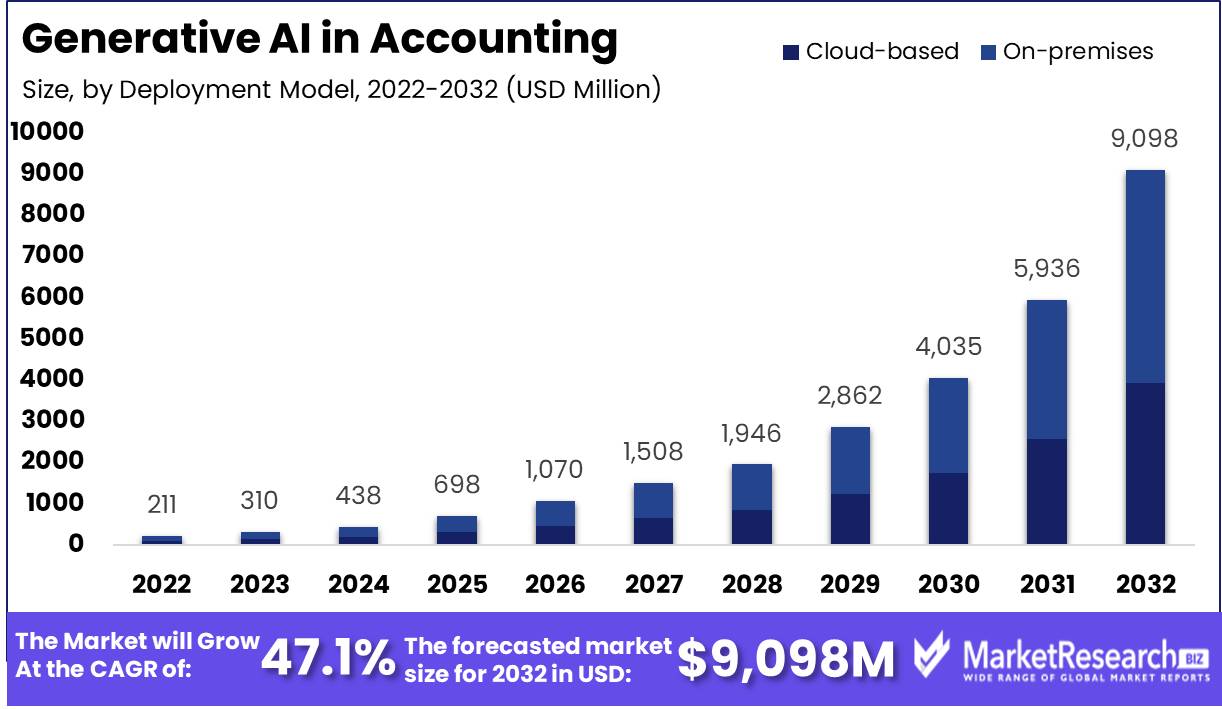
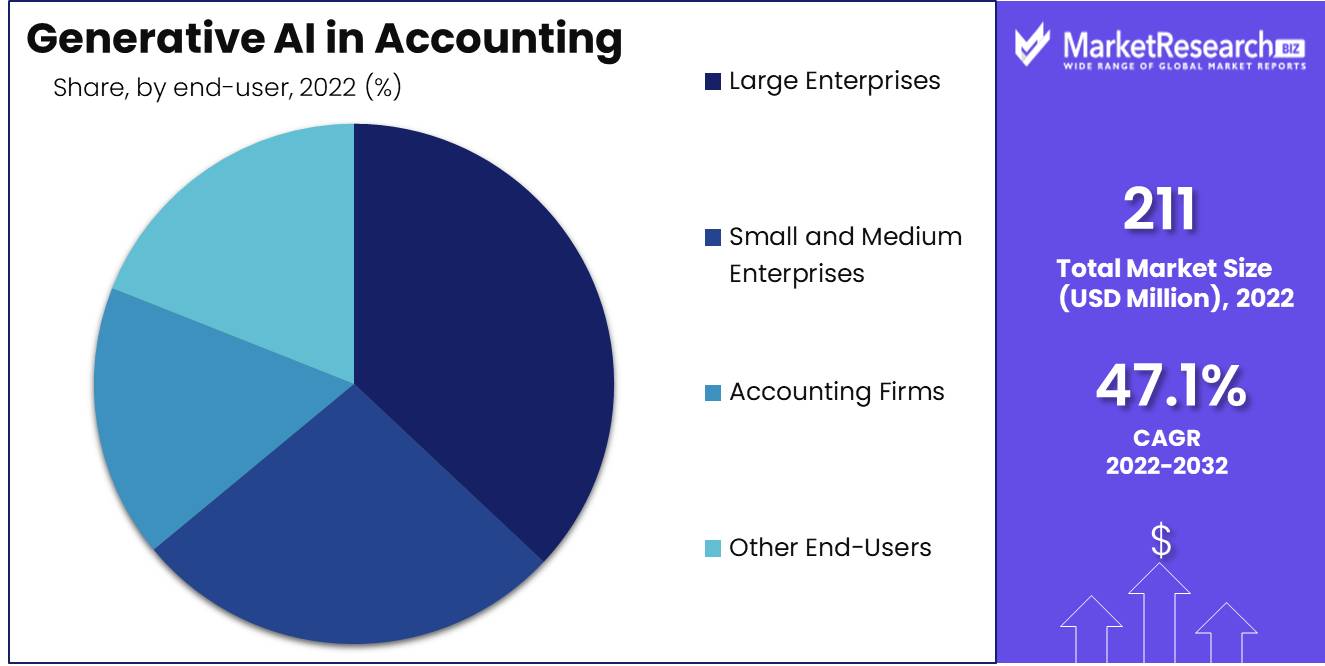
The Global Generative AI in Accounting Market size is expected to be worth around USD 9,098 million by 2032 from USD 211 million in 2022, growing at a CAGR of 47.1% during the forecast period from 2023 to 2032.
The surge in demand for new advanced technologies and natural language processing are some of the main driving factors for generative artificial intelligence in the accounting market. GenAI in accounting is mainly about data and automation.
AI-driven technologies and applications, such as ML, can drive innovative and enhanced practices around data analytics for accounting. It helps in optimizing audits and financial processes. Using GenAI technological tools also helps in saving time and decreasing the risk of human errors.
According to an article published by the CMA Exam Academy in October 2023, it highlights that the World Economic Forum has generated a number of reports related to forecasting how AI will impact jobs globally. During this method, their financial analysts’ forecasts that automation will result in an upswing of 58 million jobs, 2/3 of which will be highly skilled.
Many organizations have been searching for ways to use GenAI to offer competitive advantages. GenAI helps accountants enhance their efficacy and decrease expenses by automating daily content generation tasks like drafting messages or providing better customer service by enhancing the user experience. Big financial and accounting companies have substantially funded GenAI technologies, collaborating with tech firms like Microsoft and OpenAI to use their AI potential and technical expertise.
According to ICAEW in September 2023, PwC’s US company declared a USD 1 billion investment over the next 3 years to scale and extend its AI potentialities. Moreover, KPMG declared a USD 2 billion investment in AI and cloud services.
GenAI is not limited to only big companies with deep technical knowledge. It has the potential to become embedded in vendor-supplied products with some basic applications, like CoPilot products. Cloud-based services and foundation models AI also offers chances for users to easily access GenAI potentialities without developing their own models from the beginning. There are several advantages to using GenAI in accounting, such as that it manages monotonous tasks, eliminates human errors, and helps in inputting data.
Generative AI helps in receipt resolution, the development and sending of invoices, and also tracks expenses. This technology is also used to help with sorting transactions and price changes. The demand for GenAI in accounting will gradually increase due to its requirements in auditing and active insights that help accountants and business leaders get real-time visibility into their finances, which will help in market expansion during the forecasted period.
Key Takeaways
- Market Value: The Generative AI in Accounting Market is poised to reach USD 9,098 million by 2032, exhibiting an impressive CAGR of 47.1% from 2023 to 2032.
- Dominant Segments:
- Deployment Model Analysis: Cloud deployment leads with a 67% market share, driven by scalability, flexibility, and cost-efficiency. On-premises deployment, while significant, caters more to organizations with stringent data security needs.
- Technology Analysis: Machine Learning (ML) dominates the technology segment, facilitating tasks such as predictive analysis and financial forecasting. Other technologies like Deep Learning and Natural Language Processing (NLP) also contribute significantly to the market's growth.
- Application Analysis: Data Entry and Processing emerge as the dominant application, crucial for maintaining accurate financial records. Other applications include Fraud Detection, Financial Forecasting, Compliance, and Decision Support.
- End-User Analysis: Large Enterprises lead in adopting Generative AI in accounting due to their complex operations. However, SMEs, Accounting Firms, and other end-users contribute substantially to market growth.
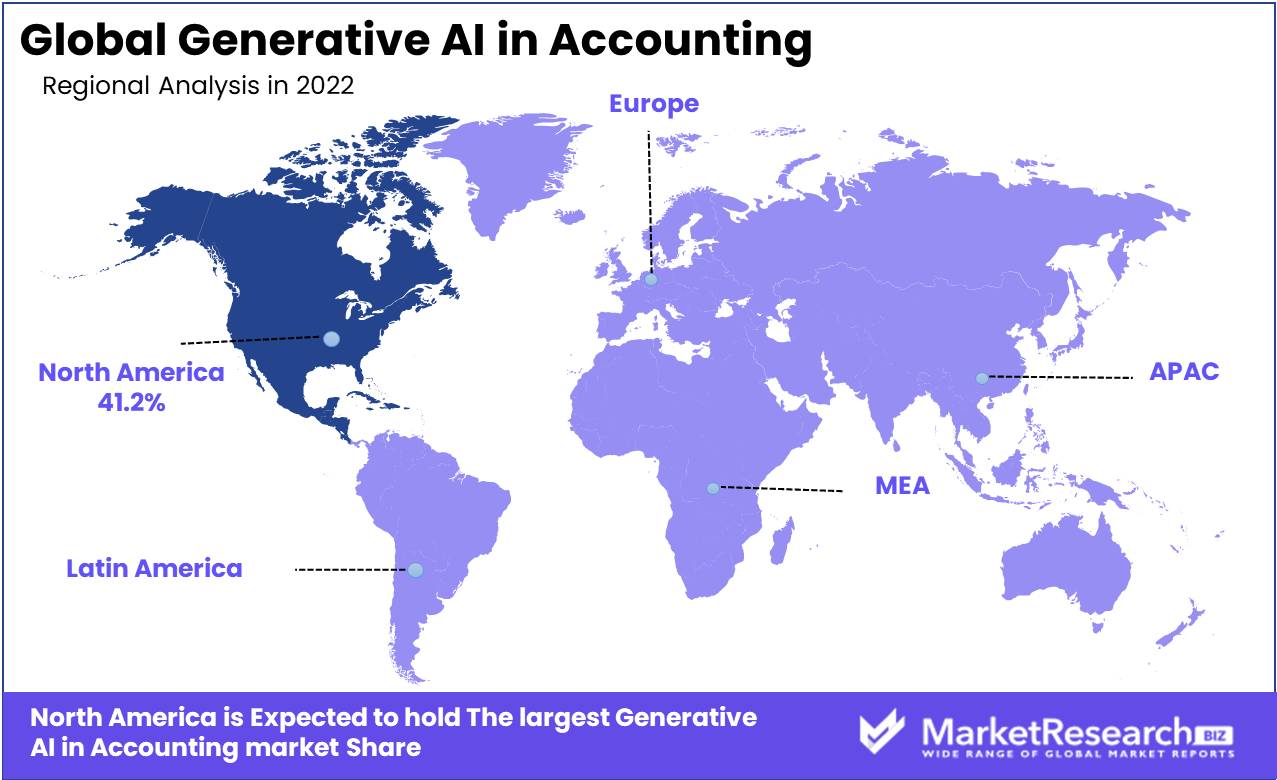
- Regional Dynamics: North America commands a 41.2% market share, with Europe following closely at 29.8%. North America benefits from advanced technological infrastructure, while Europe's strong regulatory environment fosters AI adoption.
- Key Players: Major players include IBM Corporation, KPMG, BlackLine, Inc., SAP SE, and Workday, Inc., among others, driving innovation and adoption in the market.
- Analyst Viewpoint: Analysts foresee significant growth opportunities in Generative AI in Accounting, driven by increasing demand for cloud-based solutions, advancements in ML and NLP technologies, and the need for automation and efficiency in accounting processes.
- Growth Opportunities: Opportunities lie in expanding cloud-based deployment, enhancing AI capabilities with ML and NLP, catering to SMEs and accounting firms, and leveraging AI for fraud detection, financial forecasting, compliance, and decision support. Additionally, tapping into emerging markets and strengthening partnerships with technology providers present avenues for sustained market growth.
Driving Factors
Automation and Efficiency Drives Market Growth
The integration of Generative AI into accounting marks a significant leap towards operational efficiency and precision. A July 2023 announcement from Microsoft and Tata Consultancy Services underscored this shift, revealing their collaboration to expand Azure Open AI capabilities and launch a Generative AI Enterprise Adoption offering. This move is set to catalyze the growth of the Generative AI in Accounting Market by automating mundane tasks like data entry, invoice processing, and reconciliations.
The automation facilitated by Generative AI not only minimizes manual errors but also significantly enhances process efficiency. This efficiency translates into a direct impact on the market, fostering a growth trajectory that is both innovative and transformative. By eliminating time-consuming manual tasks, companies can reallocate resources towards strategic decision-making and innovation, thereby driving further market expansion.
Financial Statement Generation Enhances Market Potential
Generative AI revolutionizes financial statement preparation, a cornerstone of accounting. By training on vast datasets of historical financial data, AI algorithms can generate accurate and reliable financial statements at a pace unattainable by human accountants. This advancement not only saves considerable time and effort but also reduces the likelihood of errors or inconsistencies.
The capability to swiftly produce financial statements is invaluable, especially in today's fast-paced business environment where timely and accurate financial reporting is crucial for decision-making. As such, Generative AI's role in financial statement generation is a pivotal driver of market growth, offering a blend of speed, accuracy, and reliability that significantly enhances the value proposition of accounting services.
Fraud Detection Strengthens Market Integrity
Generative AI's adeptness at fraud detection introduces a new era of financial security within the accounting sector. By analyzing transactional data for anomalies or patterns that suggest fraudulent activity, Generative AI serves as an efficient, proactive guard against financial fraud. This capability not only helps in mitigating potential financial losses for organizations but also reinforces the market's integrity and trustworthiness.
The prevention of financial fraud has far-reaching implications, safeguarding the interests of stakeholders and maintaining the financial health of businesses. In doing so, Generative AI not only contributes to individual firm security but also bolsters the overall growth and stability of the Generative AI in Accounting Market, making it an indispensable tool in the modern accounting landscape.
Restraining Factors
Data Privacy and Security Restrains Market Growth
The deployment of Generative AI in accounting hinges on handling vast quantities of data, spotlighting significant data privacy and security concerns. These concerns act as a primary barrier to the market's growth, as the fear of data breaches or unauthorized access can deter companies from adopting these technologies. In an era where data is as valuable as currency, the apprehension surrounding the safety of sensitive financial information is justified.
Businesses, especially those in sectors with stringent data protection standards, may hesitate to integrate Generative AI into their operations, fearing the potential repercussions of data mishandling. This reluctance hampers the widespread adoption of Generative AI in accounting, thereby limiting market expansion. Without robust mechanisms to guarantee the security and privacy of data, the market's growth potential remains underexploited.
Regulatory Challenges Restrains Market Growth
The integration of Generative AI into accounting faces significant hurdles due to regulatory challenges. Compliance with evolving safety standards and data protection laws emerges as a complex obstacle, particularly in jurisdictions with strict regulations governing the use of AI and data. These regulatory frameworks, designed to safeguard consumer privacy and ensure the reliability of financial reporting, can inadvertently slow down the adoption of Generative AI technologies.
Companies may find the regulatory landscape daunting, as non-compliance carries heavy penalties and risks to reputation. This regulatory complexity not only increases the operational costs for businesses seeking to implement Generative AI solutions but also creates a cautious environment that stifles innovation and market growth. As regulations struggle to keep pace with technological advancements, the gap between potential and actual market expansion widens, presenting a considerable constraint on the growth of the Generative AI in Accounting Market.
Deployment Model Analysis
Cloud Deployment Leads with 70% Dominance in Generative AI Accounting Market
In the Generative AI in Accounting Market, cloud deployment emerges as the dominant segment, fundamentally transforming how accounting services are delivered and consumed. This dominance can be attributed to the cloud's unparalleled scalability, flexibility, and cost-efficiency.
Businesses, from startups to large enterprises, are increasingly leveraging cloud-based Generative AI solutions to enhance their accounting operations, driven by the promise of reduced operational costs and improved efficiency. Cloud deployment allows for seamless updates and maintenance, ensuring that the latest AI models and capabilities are always at the users' disposal without the need for significant hardware investments.
The pivotal role of cloud deployment in market growth is further underscored by its accessibility. Small to medium-sized enterprises (SMEs), in particular, benefit from the lower entry barriers to advanced accounting solutions that cloud deployment offers. This accessibility is crucial in a competitive business environment where timely and accurate financial reporting can significantly influence decision-making processes.
On-premises deployment, while not the dominant segment, still plays a vital role in the market. It caters to organizations with stringent data security and privacy requirements, offering them full control over their data and the physical infrastructure hosting the AI solutions. This segment appeals to sectors such as banking and finance, where regulatory compliance and data sovereignty are paramount. However, the higher initial investment and ongoing maintenance costs associated with on-premises solutions limit their appeal primarily to larger organizations or those with specific regulatory needs.
Technology Analysis
Machine Learning Leads Generative AI in Accounting Market, Deep Learning and NLP Follow
Within the Generative AI in Accounting Market, Machine Learning (ML) technology stands out as the dominant sub-segment, largely due to its ability to process and analyze vast amounts of data with unparalleled accuracy and efficiency. Machine Learning's superiority lies in its adaptability and learning capabilities, which enable it to improve over time based on new data and experiences. This characteristic is especially beneficial in the accounting domain, where the complexity and volume of financial data necessitate sophisticated analysis techniques to ensure accuracy and compliance.
Machine Learning technologies facilitate a range of accounting tasks, from predictive analysis and financial forecasting to anomaly detection and compliance monitoring. By automating these processes, ML not only enhances efficiency but also reduces the likelihood of human error, thereby improving the overall reliability of financial reporting. This automation capability is crucial for businesses looking to optimize their operations and focus on strategic decision-making.
Despite the dominance of Machine Learning, other technologies such as Deep Learning and Natural Language Processing (NLP) also contribute significantly to the market's growth. Deep Learning, a subset of ML, excels in identifying patterns and insights from unstructured data, such as invoices and receipts, making it invaluable for tasks requiring high levels of data interpretation. NLP, on the other hand, enables the extraction of meaningful information from human language, facilitating automated customer service, document analysis, and the generation of narrative financial reports.
Natural Language Processing Technology, while not the dominant sub-segment, plays a crucial role in enhancing user interaction with Generative AI systems and in processing unstructured textual data. Its ability to understand and generate human language makes it indispensable for creating intuitive, user-friendly AI applications that can interact with users in natural language, further driving the adoption of AI in accounting.
Application Analysis
Data Entry and Processing Dominates Generative AI in Accounting Market
Data Entry and Processing stands as the dominant application in the Generative AI in Accounting Market. This dominance is rooted in the fundamental need for accuracy and efficiency in financial transactions, which constitute the backbone of accounting operations. Generative AI significantly automates the process of entering and processing financial data, minimizing human errors, and freeing up valuable time for professionals to focus on more strategic tasks. This automation is crucial for maintaining accurate financial records, essential for decision-making, compliance, and performance evaluation.
However, other applications like Fraud Detection and Risk Assessment, Financial Forecasting and Analysis, Compliance and Audit Support, and Decision Support and Optimization also play pivotal roles in the market's expansion. Fraud Detection utilizes AI to scrutinize transactions for any irregular patterns that could indicate fraudulent activities, thereby protecting businesses from potential financial losses and reputational damage.
Financial Forecasting leverages AI's predictive capabilities to provide businesses with insights into future financial trends, enabling better planning and strategy development. Compliance and Audit Support benefit from AI's ability to ensure that financial records adhere to the constantly evolving regulatory landscape. Lastly, Decision Support and Optimization employ AI to analyze financial data and generate actionable insights, assisting businesses in optimizing their financial strategies and operations.
End-User Analysis
Large Enterprises Lead Generative AI Adoption in Accounting, SMEs and Firms Follow Suit for Enhanced Efficiency and Accuracy
Large Enterprises emerge as the primary beneficiaries of Generative AI in Accounting, leveraging these technologies to enhance their complex accounting operations. The scale at which large enterprises operate requires robust systems capable of handling vast amounts of financial data efficiently and accurately. Generative AI facilitates this by automating routine tasks, providing sophisticated analytics for decision-making, and ensuring compliance with global regulations. The adoption of AI in these organizations not only streamlines operations but also provides a competitive edge by enabling more strategic financial management.
Despite the dominance of Large Enterprises, Small and Medium Enterprises (SMEs), Accounting Firms, and other end-users significantly contribute to the market's growth. SMEs benefit from Generative AI by gaining access to tools and technologies that were previously attainable only by larger corporations, thus leveling the playing field. For accounting firms, AI technologies offer the means to enhance service offerings, improve accuracy, and increase client satisfaction. Other end-users, including non-profit organizations and government agencies, utilize AI to optimize their financial operations and improve transparency and accountability.
Key Market Segments
Based on Deployment Model
- Cloud Deployment
- On-Premises Deployment
Based on Technology
- Deep Learning Technology
- Natural Language Processing Technology
- Machine Learning Technology
- Other Technologies
Based on Application
- Data Entry and Processing
- Fraud Detection and Risk Assessment
- Financial Forecasting and Analysis
- Compliance and Audit Support
- Decision Support and Optimization
- Other Applications
Based on End-User
- Large Enterprises
- Small and Medium Enterprises
- Accounting Firms
- Other End-Users
Growth Opportunities
Enhanced Automation Offers Growth Opportunity
Enhanced Automation through Generative AI significantly propels the accounting market forward by taking over routine tasks such as data entry, document processing, and report generation. This shift not only streamlines workflows but also drastically cuts down on manual errors, boosting overall efficiency.
Accountants can then allocate more time to strategic analysis and advisory roles, enhancing the value they provide to businesses. The automation capabilities of Generative AI are not just about doing things faster; they're about transforming the role of accounting within organizations, allowing for a shift towards more value-added activities. As businesses recognize the efficiency and productivity gains from automation, the demand for Generative AI in accounting is poised for substantial growth, driving market expansion.
Advanced Data Analysis Offers Growth Opportunity
The advent of Generative AI in Advanced Data Analysis heralds a new era in financial management, offering unprecedented growth opportunities in the accounting market. By employing AI algorithms for deep data analysis, pattern recognition, and insight generation, finance professionals can now harness the full potential of their data.
This capability is instrumental for financial forecasting, risk assessment, and informed decision-making. The accuracy and speed with which AI models analyze vast datasets not only provide a competitive edge but also empower businesses with actionable insights, facilitating strategic planning and risk management. This technological leap in data processing and analysis marks a significant step towards more data-driven, strategic financial management, laying the groundwork for market expansion and innovation.
Trending Factors
Technological Advancements Are Trending Factors
Technological advancements are at the forefront of trends within the Generative AI in Accounting Market. The surge in computing power, alongside innovations in machine learning algorithms and cloud infrastructure, has significantly lowered the barriers to adopting AI in accounting. These advancements have made AI tools more efficient, reliable, and accessible to companies of all sizes, catalyzing their integration into various accounting processes.
The result is an acceleration in the adoption of Generative AI solutions, as businesses seek to leverage these technologies to enhance operational efficiency, reduce costs, and gain a competitive edge. This trend is underpinned by the continuous demand for more sophisticated financial analysis and reporting capabilities, driving the market towards rapid expansion and innovation.
Regulatory Compliance Are Trending Factors
The spotlight on regulatory compliance and reporting standards is shaping the Generative AI in Accounting Market as a key trending factor. With regulations becoming more stringent, the demand for AI solutions that can streamline compliance processes, ensure accuracy in financial reporting, and adhere to the latest regulatory guidelines is on the rise.
Generative AI technologies offer the promise of automating complex compliance tasks, reducing the risk of human error, and producing financial statements that meet the required standards with minimal effort. This capability is particularly valuable in an environment where regulatory requirements are constantly evolving, making compliance a significant challenge for many organizations. The ability of AI to address these compliance challenges efficiently is a major reason why it's becoming increasingly integral to accounting processes, signaling a growth trend that aligns with the industry's evolving needs
Regional Analysis
North America Dominates with 41.2% Market Share
North America's commanding 41.2% share of the Generative AI in Accounting Market is not by chance but a result of a confluence of key factors. The region's robust financial ecosystem, coupled with high levels of technological adoption across industries, sets a fertile ground for the integration of Generative AI in accounting practices. Furthermore, the presence of leading technology firms and a culture of innovation have significantly contributed to the development and adoption of AI technologies. Regulatory frameworks that support digital transformation also play a crucial role in this dominance.
The market dynamics in North America are influenced by a proactive approach towards adopting new technologies to enhance efficiency and competitiveness. The region's strong emphasis on research and development activities, particularly in the United States and Canada, fuels continuous improvements in AI technologies, making them more accessible and applicable to accounting.
North America's influence on the global market is expected to persist, with ongoing innovations and the adoption of more sophisticated AI solutions. This trend suggests that North America will continue to be a pivotal player in shaping the future landscape of the Generative AI in Accounting Market.
Other Regions:
- Europe: Holding approximately 29.8% of the market share, Europe benefits from its advanced technological infrastructure and strong regulatory environment, which encourages the adoption of AI in various sectors, including accounting. The region's focus on data protection and privacy laws also drives demand for AI solutions that comply with stringent standards.
- Asia Pacific: This region, with about 18.5% market share, is witnessing rapid growth due to increasing digitalization across emerging economies, growing technological adoption by small and medium-sized enterprises, and significant investments in AI and cloud technologies. The Asia Pacific's market share is expected to rise significantly, driven by the region's expanding tech ecosystem and digital transformation initiatives.
- Middle East & Africa: With a smaller market share of 6.2%, the Middle East & Africa region is gradually adopting Generative AI in accounting, propelled by digital transformation efforts and the need to diversify economies beyond oil. The region's growth is supported by increasing awareness about the benefits of AI in enhancing financial processes and compliance.
- Latin America: Accounting for 4.3% of the market share, Latin America is on a path of steady growth in Generative AI adoption, facilitated by digital advancements and a focus on improving business processes. Despite challenges such as economic variability and regulatory complexities, the region shows potential for increased adoption of AI solutions in accounting.
Key Regions and Countries
- North America
- The US
- Canada
- Mexico
- Western Europe
- Germany
- France
- The UK
- Spain
- Italy
- Portugal
- Ireland
- Austria
- Switzerland
- Benelux
- Nordic
- Rest of Western Europe
- Eastern Europe
- Russia
- Poland
- The Czech Republic
- Greece
- Rest of Eastern Europe
- APAC
- China
- Japan
- South Korea
- India
- Australia & New Zealand
- Indonesia
- Malaysia
- Philippines
- Singapore
- Thailand
- Vietnam
- Rest of APAC
- Latin America
- Brazil
- Colombia
- Chile
- Argentina
- Costa Rica
- Rest of Latin America
- Middle East & Africa
- Algeria
- Egypt
- Israel
- Kuwait
- Nigeria
- Saudi Arabia
- South Africa
- Turkey
- United Arab Emirates
- Rest of MEA
Key Players Analysis
In the rapidly evolving Generative AI in Accounting Market, several key players stand out for their impact, strategic positioning, and market influence. IBM Corporation and NVIDIA Corporation are at the forefront, driving innovation with their advanced AI technologies and computing capabilities, catering to complex accounting needs. Professional services giants like KPMG and Deloitte Touche Tohmatsu Limited leverage Generative AI to enhance their consulting and auditing services, offering clients cutting-edge solutions for financial management and compliance.
Software companies such as SAP SE, Workday, Inc., and Intuit Inc. are pivotal in integrating AI into everyday accounting tasks, simplifying processes like payroll, financial forecasting, and transaction processing for businesses of all sizes. UiPath Inc. and BlackLine, Inc. specialize in automating repetitive tasks, significantly reducing errors and improving efficiency. Hitachi brings to the table its expertise in industrial and IT solutions, applying AI in unique ways to address specific market segments. Microsoft's cloud infrastructure and AI capabilities make it a key enabler for other companies looking to innovate in the accounting space.
These key players are not just advancing the technology itself but are also shaping the market dynamics, driving adoption across industries, and setting the stage for the next wave of innovations in accounting. Their strategic positioning reflects a deep understanding of the market's needs, ensuring their continued influence in shaping the future of accounting with Generative AI.
Market Key Players
- IBM Corporation
- KPMG
- BlackLine, Inc
- SAP SE
- Workday, Inc.
- NVIDIA Corporation
- Intuit Inc.
- UiPath Inc.
- Hitachi
- Microsoft
- Deloitte Touche Tohmatsu Limited
- Other Key Players
Recent Development
- In July 2023, the most renowned artificial intelligence (AI) AI business Data Fabric specialist Stratio BD introduced its tratio Gen-AI. It is the most recent artificial intelligence (AI) generative AI engine designed to address the problem of managing data that organizations face. It provides seamless access to the data and ensures that access is secure.
- On 2023 July issue of Microsoft along with Tata Consultancy Services announced that they had joined forces with the intention of scaling to increase Azure Open AI expertise and to launch a brand new Generative AI Enterprise Adoption offering on Microsoft Cloud to allow customers to start their innovative AI journey to drive their growth and transformation.
Report Scope
Report Features Description Market Value (2022) USD 211 Mn Forecast Revenue (2032) USD 9,098 Mn CAGR (2023-2032) 47.1% Base Year for Estimation 2022 Historic Period 2016-2022 Forecast Period 2023-2032 Report Coverage Revenue Forecast, Market Dynamics, COVID-19 Impact, Competitive Landscape, Recent Developments Segments Covered By Technology, By Deployment Model, By Application, By End-User Regional Analysis North America – The US, Canada, & Mexico; Western Europe – Germany, France, The UK, Spain, Italy, Portugal, Ireland, Austria, Switzerland, Benelux, Nordic, & Rest of Western Europe; Eastern Europe – Russia, Poland, The Czech Republic, Greece, & Rest of Eastern Europe; APAC – China, Japan, South Korea, India, Australia & New Zealand, Indonesia, Malaysia, Philippines, Singapore, Thailand, Vietnam, & Rest of APAC; Latin America – Brazil, Colombia, Chile, Argentina, Costa Rica, & Rest of Latin America; the Middle East & Africa – Algeria, Egypt, Israel, Kuwait, Nigeria, Saudi Arabia, South Africa, Turkey, United Arab Emirates, & Rest of MEA Competitive Landscape IBM Corporation, KPMG, BlackLine, Inc, SAP SE, Workday, Inc., NVIDIA Corporation, Intuit Inc., UiPath Inc., Deloitte Touche Tohmatsu Limited, Other Key Players Customization Scope Customization for segments, region/country-level will be provided. Moreover, additional customization can be done based on the requirements. Purchase Options We have three licenses to opt for: Single User License, Multi-User License (Up to 5 Users), Corporate Use License (Unlimited User and Printable PDF) -
- 1. Executive Summary
- 1.1. Definition
- 1.2. Taxonomy
- 1.3. Research Scope
- 1.4. Key Analysis
- 1.5. Key Findings by Major Segments
- 1.6. Top strategies by Major Players
- 2. Global Generative AI in Accounting Overview
- 2.1. Generative AI in Accounting Dynamics
- 2.1.1. Drivers
- 2.1.2. Opportunities
- 2.1.3. Restraints
- 2.1.4. Challenges
- 2.2. Macro-economic Factors
- 2.3. Regulatory Framework
- 2.4. Market Investment Feasibility Index
- 2.5. PEST Analysis
- 2.6. PORTER’S Five Force Analysis
- 2.7. Drivers & Restraints Impact Analysis
- 2.8. Industry Chain Analysis
- 2.9. Cost Structure Analysis
- 2.10. Marketing Strategy
- 2.11. Russia-Ukraine War Impact Analysis
- 2.12. Opportunity Map Analysis
- 2.13. Market Competition Scenario Analysis
- 2.14. Product Life Cycle Analysis
- 2.15. Opportunity Orbits
- 2.16. Manufacturer Intensity Map
- 2.17. Major Companies sales by Value & Volume
- 2.1. Generative AI in Accounting Dynamics
- 3. Global Generative AI in Accounting Analysis, Opportunity and Forecast, 2016-2032
- 3.1. Global Generative AI in Accounting Analysis, 2016-2021
- 3.2. Global Generative AI in Accounting Opportunity and Forecast, 2023-2032
- 3.3. Global Generative AI in Accounting Analysis, Opportunity and Forecast, By Based On Deployment Model, 2016-2032
- 3.3.1. Global Generative AI in Accounting Analysis by Based On Deployment Model: Introduction
- 3.3.2. Market Size Absolute $ Opportunity Analysis and Forecast, By Based On Deployment Model, 2016-2032
- 3.3.3. Cloud-based
- 3.3.4. On-premises
- 3.4. Global Generative AI in Accounting Analysis, Opportunity and Forecast, By Based On Application, 2016-2032
- 3.4.1. Global Generative AI in Accounting Analysis by Based On Application: Introduction
- 3.4.2. Market Size Absolute $ Opportunity Analysis and Forecast, By Based On Application, 2016-2032
- 3.4.3. Data Entry and Processing
- 3.4.4. Fraud Detection and Risk Assessment
- 3.4.5. Financial Forecasting and Analysis
- 3.4.6. Compliance and Audit Support
- 3.4.7. Decision Support and Optimization
- 3.4.8. Other Applications
- 3.5. Global Generative AI in Accounting Analysis, Opportunity and Forecast, By Based On Technology, 2016-2032
- 3.5.1. Global Generative AI in Accounting Analysis by Based On Technology: Introduction
- 3.5.2. Market Size Absolute $ Opportunity Analysis and Forecast, By Based On Technology, 2016-2032
- 3.5.3. Machine Learning Technology
- 3.5.4. Deep Learning Technology
- 3.5.5. Natural Language Processsing
- 3.5.6. Other Technologies
- 3.6. Global Generative AI in Accounting Analysis, Opportunity and Forecast, By Based On End-User, 2016-2032
- 3.6.1. Global Generative AI in Accounting Analysis by Based On End-User: Introduction
- 3.6.2. Market Size Absolute $ Opportunity Analysis and Forecast, By Based On End-User, 2016-2032
- 3.6.3. Large Enterprises
- 3.6.4. Small and Medium Enterprises
- 3.6.5. Accounting Firms
- 3.6.6. Other End-Users
- 4. North America Generative AI in Accounting Analysis, Opportunity and Forecast, 2016-2032
- 4.1. North America Generative AI in Accounting Analysis, 2016-2021
- 4.2. North America Generative AI in Accounting Opportunity and Forecast, 2023-2032
- 4.3. North America Generative AI in Accounting Analysis, Opportunity and Forecast, By Based On Deployment Model, 2016-2032
- 4.3.1. North America Generative AI in Accounting Analysis by Based On Deployment Model: Introduction
- 4.3.2. Market Size Absolute $ Opportunity Analysis and Forecast, By Based On Deployment Model, 2016-2032
- 4.3.3. Cloud-based
- 4.3.4. On-premises
- 4.4. North America Generative AI in Accounting Analysis, Opportunity and Forecast, By Based On Application, 2016-2032
- 4.4.1. North America Generative AI in Accounting Analysis by Based On Application: Introduction
- 4.4.2. Market Size Absolute $ Opportunity Analysis and Forecast, By Based On Application, 2016-2032
- 4.4.3. Data Entry and Processing
- 4.4.4. Fraud Detection and Risk Assessment
- 4.4.5. Financial Forecasting and Analysis
- 4.4.6. Compliance and Audit Support
- 4.4.7. Decision Support and Optimization
- 4.4.8. Other Applications
- 4.5. North America Generative AI in Accounting Analysis, Opportunity and Forecast, By Based On Technology, 2016-2032
- 4.5.1. North America Generative AI in Accounting Analysis by Based On Technology: Introduction
- 4.5.2. Market Size Absolute $ Opportunity Analysis and Forecast, By Based On Technology, 2016-2032
- 4.5.3. Machine Learning Technology
- 4.5.4. Deep Learning Technology
- 4.5.5. Natural Language Processsing
- 4.5.6. Other Technologies
- 4.6. North America Generative AI in Accounting Analysis, Opportunity and Forecast, By Based On End-User, 2016-2032
- 4.6.1. North America Generative AI in Accounting Analysis by Based On End-User: Introduction
- 4.6.2. Market Size Absolute $ Opportunity Analysis and Forecast, By Based On End-User, 2016-2032
- 4.6.3. Large Enterprises
- 4.6.4. Small and Medium Enterprises
- 4.6.5. Accounting Firms
- 4.6.6. Other End-Users
- 4.7. North America Generative AI in Accounting Analysis, Opportunity and Forecast, By Country , 2016-2032
- 4.7.1. North America Generative AI in Accounting Analysis by Country : Introduction
- 4.7.2. Market Size Absolute $ Opportunity Analysis and Forecast, Country , 2016-2032
- 4.7.2.1. The US
- 4.7.2.2. Canada
- 4.7.2.3. Mexico
- 5. Western Europe Generative AI in Accounting Analysis, Opportunity and Forecast, 2016-2032
- 5.1. Western Europe Generative AI in Accounting Analysis, 2016-2021
- 5.2. Western Europe Generative AI in Accounting Opportunity and Forecast, 2023-2032
- 5.3. Western Europe Generative AI in Accounting Analysis, Opportunity and Forecast, By Based On Deployment Model, 2016-2032
- 5.3.1. Western Europe Generative AI in Accounting Analysis by Based On Deployment Model: Introduction
- 5.3.2. Market Size Absolute $ Opportunity Analysis and Forecast, By Based On Deployment Model, 2016-2032
- 5.3.3. Cloud-based
- 5.3.4. On-premises
- 5.4. Western Europe Generative AI in Accounting Analysis, Opportunity and Forecast, By Based On Application, 2016-2032
- 5.4.1. Western Europe Generative AI in Accounting Analysis by Based On Application: Introduction
- 5.4.2. Market Size Absolute $ Opportunity Analysis and Forecast, By Based On Application, 2016-2032
- 5.4.3. Data Entry and Processing
- 5.4.4. Fraud Detection and Risk Assessment
- 5.4.5. Financial Forecasting and Analysis
- 5.4.6. Compliance and Audit Support
- 5.4.7. Decision Support and Optimization
- 5.4.8. Other Applications
- 5.5. Western Europe Generative AI in Accounting Analysis, Opportunity and Forecast, By Based On Technology, 2016-2032
- 5.5.1. Western Europe Generative AI in Accounting Analysis by Based On Technology: Introduction
- 5.5.2. Market Size Absolute $ Opportunity Analysis and Forecast, By Based On Technology, 2016-2032
- 5.5.3. Machine Learning Technology
- 5.5.4. Deep Learning Technology
- 5.5.5. Natural Language Processsing
- 5.5.6. Other Technologies
- 5.6. Western Europe Generative AI in Accounting Analysis, Opportunity and Forecast, By Based On End-User, 2016-2032
- 5.6.1. Western Europe Generative AI in Accounting Analysis by Based On End-User: Introduction
- 5.6.2. Market Size Absolute $ Opportunity Analysis and Forecast, By Based On End-User, 2016-2032
- 5.6.3. Large Enterprises
- 5.6.4. Small and Medium Enterprises
- 5.6.5. Accounting Firms
- 5.6.6. Other End-Users
- 5.7. Western Europe Generative AI in Accounting Analysis, Opportunity and Forecast, By Country , 2016-2032
- 5.7.1. Western Europe Generative AI in Accounting Analysis by Country : Introduction
- 5.7.2. Market Size Absolute $ Opportunity Analysis and Forecast, Country , 2016-2032
- 5.7.2.1. Germany
- 5.7.2.2. France
- 5.7.2.3. The UK
- 5.7.2.4. Spain
- 5.7.2.5. Italy
- 5.7.2.6. Portugal
- 5.7.2.7. Ireland
- 5.7.2.8. Austria
- 5.7.2.9. Switzerland
- 5.7.2.10. Benelux
- 5.7.2.11. Nordic
- 5.7.2.12. Rest of Western Europe
- 6. Eastern Europe Generative AI in Accounting Analysis, Opportunity and Forecast, 2016-2032
- 6.1. Eastern Europe Generative AI in Accounting Analysis, 2016-2021
- 6.2. Eastern Europe Generative AI in Accounting Opportunity and Forecast, 2023-2032
- 6.3. Eastern Europe Generative AI in Accounting Analysis, Opportunity and Forecast, By Based On Deployment Model, 2016-2032
- 6.3.1. Eastern Europe Generative AI in Accounting Analysis by Based On Deployment Model: Introduction
- 6.3.2. Market Size Absolute $ Opportunity Analysis and Forecast, By Based On Deployment Model, 2016-2032
- 6.3.3. Cloud-based
- 6.3.4. On-premises
- 6.4. Eastern Europe Generative AI in Accounting Analysis, Opportunity and Forecast, By Based On Application, 2016-2032
- 6.4.1. Eastern Europe Generative AI in Accounting Analysis by Based On Application: Introduction
- 6.4.2. Market Size Absolute $ Opportunity Analysis and Forecast, By Based On Application, 2016-2032
- 6.4.3. Data Entry and Processing
- 6.4.4. Fraud Detection and Risk Assessment
- 6.4.5. Financial Forecasting and Analysis
- 6.4.6. Compliance and Audit Support
- 6.4.7. Decision Support and Optimization
- 6.4.8. Other Applications
- 6.5. Eastern Europe Generative AI in Accounting Analysis, Opportunity and Forecast, By Based On Technology, 2016-2032
- 6.5.1. Eastern Europe Generative AI in Accounting Analysis by Based On Technology: Introduction
- 6.5.2. Market Size Absolute $ Opportunity Analysis and Forecast, By Based On Technology, 2016-2032
- 6.5.3. Machine Learning Technology
- 6.5.4. Deep Learning Technology
- 6.5.5. Natural Language Processsing
- 6.5.6. Other Technologies
- 6.6. Eastern Europe Generative AI in Accounting Analysis, Opportunity and Forecast, By Based On End-User, 2016-2032
- 6.6.1. Eastern Europe Generative AI in Accounting Analysis by Based On End-User: Introduction
- 6.6.2. Market Size Absolute $ Opportunity Analysis and Forecast, By Based On End-User, 2016-2032
- 6.6.3. Large Enterprises
- 6.6.4. Small and Medium Enterprises
- 6.6.5. Accounting Firms
- 6.6.6. Other End-Users
- 6.7. Eastern Europe Generative AI in Accounting Analysis, Opportunity and Forecast, By Country , 2016-2032
- 6.7.1. Eastern Europe Generative AI in Accounting Analysis by Country : Introduction
- 6.7.2. Market Size Absolute $ Opportunity Analysis and Forecast, Country , 2016-2032
- 6.7.2.1. Russia
- 6.7.2.2. Poland
- 6.7.2.3. The Czech Republic
- 6.7.2.4. Greece
- 6.7.2.5. Rest of Eastern Europe
- 7. APAC Generative AI in Accounting Analysis, Opportunity and Forecast, 2016-2032
- 7.1. APAC Generative AI in Accounting Analysis, 2016-2021
- 7.2. APAC Generative AI in Accounting Opportunity and Forecast, 2023-2032
- 7.3. APAC Generative AI in Accounting Analysis, Opportunity and Forecast, By Based On Deployment Model, 2016-2032
- 7.3.1. APAC Generative AI in Accounting Analysis by Based On Deployment Model: Introduction
- 7.3.2. Market Size Absolute $ Opportunity Analysis and Forecast, By Based On Deployment Model, 2016-2032
- 7.3.3. Cloud-based
- 7.3.4. On-premises
- 7.4. APAC Generative AI in Accounting Analysis, Opportunity and Forecast, By Based On Application, 2016-2032
- 7.4.1. APAC Generative AI in Accounting Analysis by Based On Application: Introduction
- 7.4.2. Market Size Absolute $ Opportunity Analysis and Forecast, By Based On Application, 2016-2032
- 7.4.3. Data Entry and Processing
- 7.4.4. Fraud Detection and Risk Assessment
- 7.4.5. Financial Forecasting and Analysis
- 7.4.6. Compliance and Audit Support
- 7.4.7. Decision Support and Optimization
- 7.4.8. Other Applications
- 7.5. APAC Generative AI in Accounting Analysis, Opportunity and Forecast, By Based On Technology, 2016-2032
- 7.5.1. APAC Generative AI in Accounting Analysis by Based On Technology: Introduction
- 7.5.2. Market Size Absolute $ Opportunity Analysis and Forecast, By Based On Technology, 2016-2032
- 7.5.3. Machine Learning Technology
- 7.5.4. Deep Learning Technology
- 7.5.5. Natural Language Processsing
- 7.5.6. Other Technologies
- 7.6. APAC Generative AI in Accounting Analysis, Opportunity and Forecast, By Based On End-User, 2016-2032
- 7.6.1. APAC Generative AI in Accounting Analysis by Based On End-User: Introduction
- 7.6.2. Market Size Absolute $ Opportunity Analysis and Forecast, By Based On End-User, 2016-2032
- 7.6.3. Large Enterprises
- 7.6.4. Small and Medium Enterprises
- 7.6.5. Accounting Firms
- 7.6.6. Other End-Users
- 7.7. APAC Generative AI in Accounting Analysis, Opportunity and Forecast, By Country , 2016-2032
- 7.7.1. APAC Generative AI in Accounting Analysis by Country : Introduction
- 7.7.2. Market Size Absolute $ Opportunity Analysis and Forecast, Country , 2016-2032
- 7.7.2.1. China
- 7.7.2.2. Japan
- 7.7.2.3. South Korea
- 7.7.2.4. India
- 7.7.2.5. Australia & New Zeland
- 7.7.2.6. Indonesia
- 7.7.2.7. Malaysia
- 7.7.2.8. Philippines
- 7.7.2.9. Singapore
- 7.7.2.10. Thailand
- 7.7.2.11. Vietnam
- 7.7.2.12. Rest of APAC
- 8. Latin America Generative AI in Accounting Analysis, Opportunity and Forecast, 2016-2032
- 8.1. Latin America Generative AI in Accounting Analysis, 2016-2021
- 8.2. Latin America Generative AI in Accounting Opportunity and Forecast, 2023-2032
- 8.3. Latin America Generative AI in Accounting Analysis, Opportunity and Forecast, By Based On Deployment Model, 2016-2032
- 8.3.1. Latin America Generative AI in Accounting Analysis by Based On Deployment Model: Introduction
- 8.3.2. Market Size Absolute $ Opportunity Analysis and Forecast, By Based On Deployment Model, 2016-2032
- 8.3.3. Cloud-based
- 8.3.4. On-premises
- 8.4. Latin America Generative AI in Accounting Analysis, Opportunity and Forecast, By Based On Application, 2016-2032
- 8.4.1. Latin America Generative AI in Accounting Analysis by Based On Application: Introduction
- 8.4.2. Market Size Absolute $ Opportunity Analysis and Forecast, By Based On Application, 2016-2032
- 8.4.3. Data Entry and Processing
- 8.4.4. Fraud Detection and Risk Assessment
- 8.4.5. Financial Forecasting and Analysis
- 8.4.6. Compliance and Audit Support
- 8.4.7. Decision Support and Optimization
- 8.4.8. Other Applications
- 8.5. Latin America Generative AI in Accounting Analysis, Opportunity and Forecast, By Based On Technology, 2016-2032
- 8.5.1. Latin America Generative AI in Accounting Analysis by Based On Technology: Introduction
- 8.5.2. Market Size Absolute $ Opportunity Analysis and Forecast, By Based On Technology, 2016-2032
- 8.5.3. Machine Learning Technology
- 8.5.4. Deep Learning Technology
- 8.5.5. Natural Language Processsing
- 8.5.6. Other Technologies
- 8.6. Latin America Generative AI in Accounting Analysis, Opportunity and Forecast, By Based On End-User, 2016-2032
- 8.6.1. Latin America Generative AI in Accounting Analysis by Based On End-User: Introduction
- 8.6.2. Market Size Absolute $ Opportunity Analysis and Forecast, By Based On End-User, 2016-2032
- 8.6.3. Large Enterprises
- 8.6.4. Small and Medium Enterprises
- 8.6.5. Accounting Firms
- 8.6.6. Other End-Users
- 8.7. Latin America Generative AI in Accounting Analysis, Opportunity and Forecast, By Country , 2016-2032
- 8.7.1. Latin America Generative AI in Accounting Analysis by Country : Introduction
- 8.7.2. Market Size Absolute $ Opportunity Analysis and Forecast, Country , 2016-2032
- 8.7.2.1. Brazil
- 8.7.2.2. Colombia
- 8.7.2.3. Chile
- 8.7.2.4. Argentina
- 8.7.2.5. Costa Rica
- 8.7.2.6. Rest of Latin America
- 9. Middle East & Africa Generative AI in Accounting Analysis, Opportunity and Forecast, 2016-2032
- 9.1. Middle East & Africa Generative AI in Accounting Analysis, 2016-2021
- 9.2. Middle East & Africa Generative AI in Accounting Opportunity and Forecast, 2023-2032
- 9.3. Middle East & Africa Generative AI in Accounting Analysis, Opportunity and Forecast, By Based On Deployment Model, 2016-2032
- 9.3.1. Middle East & Africa Generative AI in Accounting Analysis by Based On Deployment Model: Introduction
- 9.3.2. Market Size Absolute $ Opportunity Analysis and Forecast, By Based On Deployment Model, 2016-2032
- 9.3.3. Cloud-based
- 9.3.4. On-premises
- 9.4. Middle East & Africa Generative AI in Accounting Analysis, Opportunity and Forecast, By Based On Application, 2016-2032
- 9.4.1. Middle East & Africa Generative AI in Accounting Analysis by Based On Application: Introduction
- 9.4.2. Market Size Absolute $ Opportunity Analysis and Forecast, By Based On Application, 2016-2032
- 9.4.3. Data Entry and Processing
- 9.4.4. Fraud Detection and Risk Assessment
- 9.4.5. Financial Forecasting and Analysis
- 9.4.6. Compliance and Audit Support
- 9.4.7. Decision Support and Optimization
- 9.4.8. Other Applications
- 9.5. Middle East & Africa Generative AI in Accounting Analysis, Opportunity and Forecast, By Based On Technology, 2016-2032
- 9.5.1. Middle East & Africa Generative AI in Accounting Analysis by Based On Technology: Introduction
- 9.5.2. Market Size Absolute $ Opportunity Analysis and Forecast, By Based On Technology, 2016-2032
- 9.5.3. Machine Learning Technology
- 9.5.4. Deep Learning Technology
- 9.5.5. Natural Language Processsing
- 9.5.6. Other Technologies
- 9.6. Middle East & Africa Generative AI in Accounting Analysis, Opportunity and Forecast, By Based On End-User, 2016-2032
- 9.6.1. Middle East & Africa Generative AI in Accounting Analysis by Based On End-User: Introduction
- 9.6.2. Market Size Absolute $ Opportunity Analysis and Forecast, By Based On End-User, 2016-2032
- 9.6.3. Large Enterprises
- 9.6.4. Small and Medium Enterprises
- 9.6.5. Accounting Firms
- 9.6.6. Other End-Users
- 9.7. Middle East & Africa Generative AI in Accounting Analysis, Opportunity and Forecast, By Country , 2016-2032
- 9.7.1. Middle East & Africa Generative AI in Accounting Analysis by Country : Introduction
- 9.7.2. Market Size Absolute $ Opportunity Analysis and Forecast, Country , 2016-2032
- 9.7.2.1. Algeria
- 9.7.2.2. Egypt
- 9.7.2.3. Israel
- 9.7.2.4. Kuwait
- 9.7.2.5. Nigeria
- 9.7.2.6. Saudi Arabia
- 9.7.2.7. South Africa
- 9.7.2.8. Turkey
- 9.7.2.9. The UAE
- 9.7.2.10. Rest of MEA
- 10. Global Generative AI in Accounting Analysis, Opportunity and Forecast, By Region , 2016-2032
- 10.1. Global Generative AI in Accounting Analysis by Region : Introduction
- 10.2. Market Size Absolute $ Opportunity Analysis and Forecast, By Region , 2016-2032
- 10.2.1. North America
- 10.2.2. Western Europe
- 10.2.3. Eastern Europe
- 10.2.4. APAC
- 10.2.5. Latin America
- 10.2.6. Middle East & Africa
- 11. Global Generative AI in Accounting Competitive Landscape, Market Share Analysis, and Company Profiles
- 11.1. Market Share Analysis
- 11.2. Company Profiles
- 11.3. IBM Corporation
- 11.3.1. Company Overview
- 11.3.2. Financial Highlights
- 11.3.3. Product Portfolio
- 11.3.4. SWOT Analysis
- 11.3.5. Key Strategies and Developments
- 11.4. KPMG
- 11.4.1. Company Overview
- 11.4.2. Financial Highlights
- 11.4.3. Product Portfolio
- 11.4.4. SWOT Analysis
- 11.4.5. Key Strategies and Developments
- 11.5. BlackLine, Inc
- 11.5.1. Company Overview
- 11.5.2. Financial Highlights
- 11.5.3. Product Portfolio
- 11.5.4. SWOT Analysis
- 11.5.5. Key Strategies and Developments
- 11.6. SAP SE
- 11.6.1. Company Overview
- 11.6.2. Financial Highlights
- 11.6.3. Product Portfolio
- 11.6.4. SWOT Analysis
- 11.6.5. Key Strategies and Developments
- 11.7. Workday, Inc.
- 11.7.1. Company Overview
- 11.7.2. Financial Highlights
- 11.7.3. Product Portfolio
- 11.7.4. SWOT Analysis
- 11.7.5. Key Strategies and Developments
- 11.8. NVIDIA Corporation
- 11.8.1. Company Overview
- 11.8.2. Financial Highlights
- 11.8.3. Product Portfolio
- 11.8.4. SWOT Analysis
- 11.8.5. Key Strategies and Developments
- 11.9. Intuit Inc.
- 11.9.1. Company Overview
- 11.9.2. Financial Highlights
- 11.9.3. Product Portfolio
- 11.9.4. SWOT Analysis
- 11.9.5. Key Strategies and Developments
- 11.10. UiPath Inc.
- 11.10.1. Company Overview
- 11.10.2. Financial Highlights
- 11.10.3. Product Portfolio
- 11.10.4. SWOT Analysis
- 11.10.5. Key Strategies and Developments
- 11.11. Deloitte Touche Tohmatsu Limited
- 11.11.1. Company Overview
- 11.11.2. Financial Highlights
- 11.11.3. Product Portfolio
- 11.11.4. SWOT Analysis
- 11.11.5. Key Strategies and Developments
- 11.12. Other Key Players
- 11.12.1. Company Overview
- 11.12.2. Financial Highlights
- 11.12.3. Product Portfolio
- 11.12.4. SWOT Analysis
- 11.12.5. Key Strategies and Developments
- 12. Assumptions and Acronyms
- 13. Research Methodology
- 14. Contact
List of Figures
-
- Figure 1: Global Generative AI in Accounting Revenue (US$ Mn) Market Share by Based On Deployment Model in 2022
- Figure 2: Global Generative AI in Accounting Market Attractiveness Analysis by Based On Deployment Model, 2016-2032
- Figure 3: Global Generative AI in Accounting Revenue (US$ Mn) Market Share by Based On Applicationin 2022
- Figure 4: Global Generative AI in Accounting Market Attractiveness Analysis by Based On Application, 2016-2032
- Figure 5: Global Generative AI in Accounting Revenue (US$ Mn) Market Share by Based On Technologyin 2022
- Figure 6: Global Generative AI in Accounting Market Attractiveness Analysis by Based On Technology, 2016-2032
- Figure 7: Global Generative AI in Accounting Revenue (US$ Mn) Market Share by Based On End-Userin 2022
- Figure 8: Global Generative AI in Accounting Market Attractiveness Analysis by Based On End-User, 2016-2032
- Figure 9: Global Generative AI in Accounting Revenue (US$ Mn) Market Share by Region in 2022
- Figure 10: Global Generative AI in Accounting Market Attractiveness Analysis by Region, 2016-2032
- Figure 11: Global Generative AI in Accounting Market Revenue (US$ Mn) (2016-2032)
- Figure 12: Global Generative AI in Accounting Market Revenue (US$ Mn) Comparison by Region (2016-2032)
- Figure 13: Global Generative AI in Accounting Market Revenue (US$ Mn) Comparison by Based On Deployment Model (2016-2032)
- Figure 14: Global Generative AI in Accounting Market Revenue (US$ Mn) Comparison by Based On Application (2016-2032)
- Figure 15: Global Generative AI in Accounting Market Revenue (US$ Mn) Comparison by Based On Technology (2016-2032)
- Figure 16: Global Generative AI in Accounting Market Revenue (US$ Mn) Comparison by Based On End-User (2016-2032)
- Figure 17: Global Generative AI in Accounting Market Y-o-Y Growth Rate Comparison by Region (2016-2032)
- Figure 18: Global Generative AI in Accounting Market Y-o-Y Growth Rate Comparison by Based On Deployment Model (2016-2032)
- Figure 19: Global Generative AI in Accounting Market Y-o-Y Growth Rate Comparison by Based On Application (2016-2032)
- Figure 20: Global Generative AI in Accounting Market Y-o-Y Growth Rate Comparison by Based On Technology (2016-2032)
- Figure 21: Global Generative AI in Accounting Market Y-o-Y Growth Rate Comparison by Based On End-User (2016-2032)
- Figure 22: Global Generative AI in Accounting Market Share Comparison by Region (2016-2032)
- Figure 23: Global Generative AI in Accounting Market Share Comparison by Based On Deployment Model (2016-2032)
- Figure 24: Global Generative AI in Accounting Market Share Comparison by Based On Application (2016-2032)
- Figure 25: Global Generative AI in Accounting Market Share Comparison by Based On Technology (2016-2032)
- Figure 26: Global Generative AI in Accounting Market Share Comparison by Based On End-User (2016-2032)
- Figure 27: North America Generative AI in Accounting Revenue (US$ Mn) Market Share by Based On Deployment Modelin 2022
- Figure 28: North America Generative AI in Accounting Market Attractiveness Analysis by Based On Deployment Model, 2016-2032
- Figure 29: North America Generative AI in Accounting Revenue (US$ Mn) Market Share by Based On Applicationin 2022
- Figure 30: North America Generative AI in Accounting Market Attractiveness Analysis by Based On Application, 2016-2032
- Figure 31: North America Generative AI in Accounting Revenue (US$ Mn) Market Share by Based On Technologyin 2022
- Figure 32: North America Generative AI in Accounting Market Attractiveness Analysis by Based On Technology, 2016-2032
- Figure 33: North America Generative AI in Accounting Revenue (US$ Mn) Market Share by Based On End-Userin 2022
- Figure 34: North America Generative AI in Accounting Market Attractiveness Analysis by Based On End-User, 2016-2032
- Figure 35: North America Generative AI in Accounting Revenue (US$ Mn) Market Share by Country in 2022
- Figure 36: North America Generative AI in Accounting Market Attractiveness Analysis by Country, 2016-2032
- Figure 37: North America Generative AI in Accounting Market Revenue (US$ Mn) (2016-2032)
- Figure 38: North America Generative AI in Accounting Market Revenue (US$ Mn) Comparison by Country (2016-2032)
- Figure 39: North America Generative AI in Accounting Market Revenue (US$ Mn) Comparison by Based On Deployment Model (2016-2032)
- Figure 40: North America Generative AI in Accounting Market Revenue (US$ Mn) Comparison by Based On Application (2016-2032)
- Figure 41: North America Generative AI in Accounting Market Revenue (US$ Mn) Comparison by Based On Technology (2016-2032)
- Figure 42: North America Generative AI in Accounting Market Revenue (US$ Mn) Comparison by Based On End-User (2016-2032)
- Figure 43: North America Generative AI in Accounting Market Y-o-Y Growth Rate Comparison by Country (2016-2032)
- Figure 44: North America Generative AI in Accounting Market Y-o-Y Growth Rate Comparison by Based On Deployment Model (2016-2032)
- Figure 45: North America Generative AI in Accounting Market Y-o-Y Growth Rate Comparison by Based On Application (2016-2032)
- Figure 46: North America Generative AI in Accounting Market Y-o-Y Growth Rate Comparison by Based On Technology (2016-2032)
- Figure 47: North America Generative AI in Accounting Market Y-o-Y Growth Rate Comparison by Based On End-User (2016-2032)
- Figure 48: North America Generative AI in Accounting Market Share Comparison by Country (2016-2032)
- Figure 49: North America Generative AI in Accounting Market Share Comparison by Based On Deployment Model (2016-2032)
- Figure 50: North America Generative AI in Accounting Market Share Comparison by Based On Application (2016-2032)
- Figure 51: North America Generative AI in Accounting Market Share Comparison by Based On Technology (2016-2032)
- Figure 52: North America Generative AI in Accounting Market Share Comparison by Based On End-User (2016-2032)
- Figure 53: Western Europe Generative AI in Accounting Revenue (US$ Mn) Market Share by Based On Deployment Modelin 2022
- Figure 54: Western Europe Generative AI in Accounting Market Attractiveness Analysis by Based On Deployment Model, 2016-2032
- Figure 55: Western Europe Generative AI in Accounting Revenue (US$ Mn) Market Share by Based On Applicationin 2022
- Figure 56: Western Europe Generative AI in Accounting Market Attractiveness Analysis by Based On Application, 2016-2032
- Figure 57: Western Europe Generative AI in Accounting Revenue (US$ Mn) Market Share by Based On Technologyin 2022
- Figure 58: Western Europe Generative AI in Accounting Market Attractiveness Analysis by Based On Technology, 2016-2032
- Figure 59: Western Europe Generative AI in Accounting Revenue (US$ Mn) Market Share by Based On End-Userin 2022
- Figure 60: Western Europe Generative AI in Accounting Market Attractiveness Analysis by Based On End-User, 2016-2032
- Figure 61: Western Europe Generative AI in Accounting Revenue (US$ Mn) Market Share by Country in 2022
- Figure 62: Western Europe Generative AI in Accounting Market Attractiveness Analysis by Country, 2016-2032
- Figure 63: Western Europe Generative AI in Accounting Market Revenue (US$ Mn) (2016-2032)
- Figure 64: Western Europe Generative AI in Accounting Market Revenue (US$ Mn) Comparison by Country (2016-2032)
- Figure 65: Western Europe Generative AI in Accounting Market Revenue (US$ Mn) Comparison by Based On Deployment Model (2016-2032)
- Figure 66: Western Europe Generative AI in Accounting Market Revenue (US$ Mn) Comparison by Based On Application (2016-2032)
- Figure 67: Western Europe Generative AI in Accounting Market Revenue (US$ Mn) Comparison by Based On Technology (2016-2032)
- Figure 68: Western Europe Generative AI in Accounting Market Revenue (US$ Mn) Comparison by Based On End-User (2016-2032)
- Figure 69: Western Europe Generative AI in Accounting Market Y-o-Y Growth Rate Comparison by Country (2016-2032)
- Figure 70: Western Europe Generative AI in Accounting Market Y-o-Y Growth Rate Comparison by Based On Deployment Model (2016-2032)
- Figure 71: Western Europe Generative AI in Accounting Market Y-o-Y Growth Rate Comparison by Based On Application (2016-2032)
- Figure 72: Western Europe Generative AI in Accounting Market Y-o-Y Growth Rate Comparison by Based On Technology (2016-2032)
- Figure 73: Western Europe Generative AI in Accounting Market Y-o-Y Growth Rate Comparison by Based On End-User (2016-2032)
- Figure 74: Western Europe Generative AI in Accounting Market Share Comparison by Country (2016-2032)
- Figure 75: Western Europe Generative AI in Accounting Market Share Comparison by Based On Deployment Model (2016-2032)
- Figure 76: Western Europe Generative AI in Accounting Market Share Comparison by Based On Application (2016-2032)
- Figure 77: Western Europe Generative AI in Accounting Market Share Comparison by Based On Technology (2016-2032)
- Figure 78: Western Europe Generative AI in Accounting Market Share Comparison by Based On End-User (2016-2032)
- Figure 79: Eastern Europe Generative AI in Accounting Revenue (US$ Mn) Market Share by Based On Deployment Modelin 2022
- Figure 80: Eastern Europe Generative AI in Accounting Market Attractiveness Analysis by Based On Deployment Model, 2016-2032
- Figure 81: Eastern Europe Generative AI in Accounting Revenue (US$ Mn) Market Share by Based On Applicationin 2022
- Figure 82: Eastern Europe Generative AI in Accounting Market Attractiveness Analysis by Based On Application, 2016-2032
- Figure 83: Eastern Europe Generative AI in Accounting Revenue (US$ Mn) Market Share by Based On Technologyin 2022
- Figure 84: Eastern Europe Generative AI in Accounting Market Attractiveness Analysis by Based On Technology, 2016-2032
- Figure 85: Eastern Europe Generative AI in Accounting Revenue (US$ Mn) Market Share by Based On End-Userin 2022
- Figure 86: Eastern Europe Generative AI in Accounting Market Attractiveness Analysis by Based On End-User, 2016-2032
- Figure 87: Eastern Europe Generative AI in Accounting Revenue (US$ Mn) Market Share by Country in 2022
- Figure 88: Eastern Europe Generative AI in Accounting Market Attractiveness Analysis by Country, 2016-2032
- Figure 89: Eastern Europe Generative AI in Accounting Market Revenue (US$ Mn) (2016-2032)
- Figure 90: Eastern Europe Generative AI in Accounting Market Revenue (US$ Mn) Comparison by Country (2016-2032)
- Figure 91: Eastern Europe Generative AI in Accounting Market Revenue (US$ Mn) Comparison by Based On Deployment Model (2016-2032)
- Figure 92: Eastern Europe Generative AI in Accounting Market Revenue (US$ Mn) Comparison by Based On Application (2016-2032)
- Figure 93: Eastern Europe Generative AI in Accounting Market Revenue (US$ Mn) Comparison by Based On Technology (2016-2032)
- Figure 94: Eastern Europe Generative AI in Accounting Market Revenue (US$ Mn) Comparison by Based On End-User (2016-2032)
- Figure 95: Eastern Europe Generative AI in Accounting Market Y-o-Y Growth Rate Comparison by Country (2016-2032)
- Figure 96: Eastern Europe Generative AI in Accounting Market Y-o-Y Growth Rate Comparison by Based On Deployment Model (2016-2032)
- Figure 97: Eastern Europe Generative AI in Accounting Market Y-o-Y Growth Rate Comparison by Based On Application (2016-2032)
- Figure 98: Eastern Europe Generative AI in Accounting Market Y-o-Y Growth Rate Comparison by Based On Technology (2016-2032)
- Figure 99: Eastern Europe Generative AI in Accounting Market Y-o-Y Growth Rate Comparison by Based On End-User (2016-2032)
- Figure 100: Eastern Europe Generative AI in Accounting Market Share Comparison by Country (2016-2032)
- Figure 101: Eastern Europe Generative AI in Accounting Market Share Comparison by Based On Deployment Model (2016-2032)
- Figure 102: Eastern Europe Generative AI in Accounting Market Share Comparison by Based On Application (2016-2032)
- Figure 103: Eastern Europe Generative AI in Accounting Market Share Comparison by Based On Technology (2016-2032)
- Figure 104: Eastern Europe Generative AI in Accounting Market Share Comparison by Based On End-User (2016-2032)
- Figure 105: APAC Generative AI in Accounting Revenue (US$ Mn) Market Share by Based On Deployment Modelin 2022
- Figure 106: APAC Generative AI in Accounting Market Attractiveness Analysis by Based On Deployment Model, 2016-2032
- Figure 107: APAC Generative AI in Accounting Revenue (US$ Mn) Market Share by Based On Applicationin 2022
- Figure 108: APAC Generative AI in Accounting Market Attractiveness Analysis by Based On Application, 2016-2032
- Figure 109: APAC Generative AI in Accounting Revenue (US$ Mn) Market Share by Based On Technologyin 2022
- Figure 110: APAC Generative AI in Accounting Market Attractiveness Analysis by Based On Technology, 2016-2032
- Figure 111: APAC Generative AI in Accounting Revenue (US$ Mn) Market Share by Based On End-Userin 2022
- Figure 112: APAC Generative AI in Accounting Market Attractiveness Analysis by Based On End-User, 2016-2032
- Figure 113: APAC Generative AI in Accounting Revenue (US$ Mn) Market Share by Country in 2022
- Figure 114: APAC Generative AI in Accounting Market Attractiveness Analysis by Country, 2016-2032
- Figure 115: APAC Generative AI in Accounting Market Revenue (US$ Mn) (2016-2032)
- Figure 116: APAC Generative AI in Accounting Market Revenue (US$ Mn) Comparison by Country (2016-2032)
- Figure 117: APAC Generative AI in Accounting Market Revenue (US$ Mn) Comparison by Based On Deployment Model (2016-2032)
- Figure 118: APAC Generative AI in Accounting Market Revenue (US$ Mn) Comparison by Based On Application (2016-2032)
- Figure 119: APAC Generative AI in Accounting Market Revenue (US$ Mn) Comparison by Based On Technology (2016-2032)
- Figure 120: APAC Generative AI in Accounting Market Revenue (US$ Mn) Comparison by Based On End-User (2016-2032)
- Figure 121: APAC Generative AI in Accounting Market Y-o-Y Growth Rate Comparison by Country (2016-2032)
- Figure 122: APAC Generative AI in Accounting Market Y-o-Y Growth Rate Comparison by Based On Deployment Model (2016-2032)
- Figure 123: APAC Generative AI in Accounting Market Y-o-Y Growth Rate Comparison by Based On Application (2016-2032)
- Figure 124: APAC Generative AI in Accounting Market Y-o-Y Growth Rate Comparison by Based On Technology (2016-2032)
- Figure 125: APAC Generative AI in Accounting Market Y-o-Y Growth Rate Comparison by Based On End-User (2016-2032)
- Figure 126: APAC Generative AI in Accounting Market Share Comparison by Country (2016-2032)
- Figure 127: APAC Generative AI in Accounting Market Share Comparison by Based On Deployment Model (2016-2032)
- Figure 128: APAC Generative AI in Accounting Market Share Comparison by Based On Application (2016-2032)
- Figure 129: APAC Generative AI in Accounting Market Share Comparison by Based On Technology (2016-2032)
- Figure 130: APAC Generative AI in Accounting Market Share Comparison by Based On End-User (2016-2032)
- Figure 131: Latin America Generative AI in Accounting Revenue (US$ Mn) Market Share by Based On Deployment Modelin 2022
- Figure 132: Latin America Generative AI in Accounting Market Attractiveness Analysis by Based On Deployment Model, 2016-2032
- Figure 133: Latin America Generative AI in Accounting Revenue (US$ Mn) Market Share by Based On Applicationin 2022
- Figure 134: Latin America Generative AI in Accounting Market Attractiveness Analysis by Based On Application, 2016-2032
- Figure 135: Latin America Generative AI in Accounting Revenue (US$ Mn) Market Share by Based On Technologyin 2022
- Figure 136: Latin America Generative AI in Accounting Market Attractiveness Analysis by Based On Technology, 2016-2032
- Figure 137: Latin America Generative AI in Accounting Revenue (US$ Mn) Market Share by Based On End-Userin 2022
- Figure 138: Latin America Generative AI in Accounting Market Attractiveness Analysis by Based On End-User, 2016-2032
- Figure 139: Latin America Generative AI in Accounting Revenue (US$ Mn) Market Share by Country in 2022
- Figure 140: Latin America Generative AI in Accounting Market Attractiveness Analysis by Country, 2016-2032
- Figure 141: Latin America Generative AI in Accounting Market Revenue (US$ Mn) (2016-2032)
- Figure 142: Latin America Generative AI in Accounting Market Revenue (US$ Mn) Comparison by Country (2016-2032)
- Figure 143: Latin America Generative AI in Accounting Market Revenue (US$ Mn) Comparison by Based On Deployment Model (2016-2032)
- Figure 144: Latin America Generative AI in Accounting Market Revenue (US$ Mn) Comparison by Based On Application (2016-2032)
- Figure 145: Latin America Generative AI in Accounting Market Revenue (US$ Mn) Comparison by Based On Technology (2016-2032)
- Figure 146: Latin America Generative AI in Accounting Market Revenue (US$ Mn) Comparison by Based On End-User (2016-2032)
- Figure 147: Latin America Generative AI in Accounting Market Y-o-Y Growth Rate Comparison by Country (2016-2032)
- Figure 148: Latin America Generative AI in Accounting Market Y-o-Y Growth Rate Comparison by Based On Deployment Model (2016-2032)
- Figure 149: Latin America Generative AI in Accounting Market Y-o-Y Growth Rate Comparison by Based On Application (2016-2032)
- Figure 150: Latin America Generative AI in Accounting Market Y-o-Y Growth Rate Comparison by Based On Technology (2016-2032)
- Figure 151: Latin America Generative AI in Accounting Market Y-o-Y Growth Rate Comparison by Based On End-User (2016-2032)
- Figure 152: Latin America Generative AI in Accounting Market Share Comparison by Country (2016-2032)
- Figure 153: Latin America Generative AI in Accounting Market Share Comparison by Based On Deployment Model (2016-2032)
- Figure 154: Latin America Generative AI in Accounting Market Share Comparison by Based On Application (2016-2032)
- Figure 155: Latin America Generative AI in Accounting Market Share Comparison by Based On Technology (2016-2032)
- Figure 156: Latin America Generative AI in Accounting Market Share Comparison by Based On End-User (2016-2032)
- Figure 157: Middle East & Africa Generative AI in Accounting Revenue (US$ Mn) Market Share by Based On Deployment Modelin 2022
- Figure 158: Middle East & Africa Generative AI in Accounting Market Attractiveness Analysis by Based On Deployment Model, 2016-2032
- Figure 159: Middle East & Africa Generative AI in Accounting Revenue (US$ Mn) Market Share by Based On Applicationin 2022
- Figure 160: Middle East & Africa Generative AI in Accounting Market Attractiveness Analysis by Based On Application, 2016-2032
- Figure 161: Middle East & Africa Generative AI in Accounting Revenue (US$ Mn) Market Share by Based On Technologyin 2022
- Figure 162: Middle East & Africa Generative AI in Accounting Market Attractiveness Analysis by Based On Technology, 2016-2032
- Figure 163: Middle East & Africa Generative AI in Accounting Revenue (US$ Mn) Market Share by Based On End-Userin 2022
- Figure 164: Middle East & Africa Generative AI in Accounting Market Attractiveness Analysis by Based On End-User, 2016-2032
- Figure 165: Middle East & Africa Generative AI in Accounting Revenue (US$ Mn) Market Share by Country in 2022
- Figure 166: Middle East & Africa Generative AI in Accounting Market Attractiveness Analysis by Country, 2016-2032
- Figure 167: Middle East & Africa Generative AI in Accounting Market Revenue (US$ Mn) (2016-2032)
- Figure 168: Middle East & Africa Generative AI in Accounting Market Revenue (US$ Mn) Comparison by Country (2016-2032)
- Figure 169: Middle East & Africa Generative AI in Accounting Market Revenue (US$ Mn) Comparison by Based On Deployment Model (2016-2032)
- Figure 170: Middle East & Africa Generative AI in Accounting Market Revenue (US$ Mn) Comparison by Based On Application (2016-2032)
- Figure 171: Middle East & Africa Generative AI in Accounting Market Revenue (US$ Mn) Comparison by Based On Technology (2016-2032)
- Figure 172: Middle East & Africa Generative AI in Accounting Market Revenue (US$ Mn) Comparison by Based On End-User (2016-2032)
- Figure 173: Middle East & Africa Generative AI in Accounting Market Y-o-Y Growth Rate Comparison by Country (2016-2032)
- Figure 174: Middle East & Africa Generative AI in Accounting Market Y-o-Y Growth Rate Comparison by Based On Deployment Model (2016-2032)
- Figure 175: Middle East & Africa Generative AI in Accounting Market Y-o-Y Growth Rate Comparison by Based On Application (2016-2032)
- Figure 176: Middle East & Africa Generative AI in Accounting Market Y-o-Y Growth Rate Comparison by Based On Technology (2016-2032)
- Figure 177: Middle East & Africa Generative AI in Accounting Market Y-o-Y Growth Rate Comparison by Based On End-User (2016-2032)
- Figure 178: Middle East & Africa Generative AI in Accounting Market Share Comparison by Country (2016-2032)
- Figure 179: Middle East & Africa Generative AI in Accounting Market Share Comparison by Based On Deployment Model (2016-2032)
- Figure 180: Middle East & Africa Generative AI in Accounting Market Share Comparison by Based On Application (2016-2032)
- Figure 181: Middle East & Africa Generative AI in Accounting Market Share Comparison by Based On Technology (2016-2032)
- Figure 182: Middle East & Africa Generative AI in Accounting Market Share Comparison by Based On End-User (2016-2032)
List of Tables
- Table 1: Global Generative AI in Accounting Market Comparison by Based On Deployment Model (2016-2032)
- Table 2: Global Generative AI in Accounting Market Comparison by Based On Application (2016-2032)
- Table 3: Global Generative AI in Accounting Market Comparison by Based On Technology (2016-2032)
- Table 4: Global Generative AI in Accounting Market Comparison by Based On End-User (2016-2032)
- Table 5: Global Generative AI in Accounting Revenue (US$ Mn) Comparison by Region (2016-2032)
- Table 6: Global Generative AI in Accounting Market Revenue (US$ Mn) (2016-2032)
- Table 7: Global Generative AI in Accounting Market Revenue (US$ Mn) Comparison by Region (2016-2032)
- Table 8: Global Generative AI in Accounting Market Revenue (US$ Mn) Comparison by Based On Deployment Model (2016-2032)
- Table 9: Global Generative AI in Accounting Market Revenue (US$ Mn) Comparison by Based On Application (2016-2032)
- Table 10: Global Generative AI in Accounting Market Revenue (US$ Mn) Comparison by Based On Technology (2016-2032)
- Table 11: Global Generative AI in Accounting Market Revenue (US$ Mn) Comparison by Based On End-User (2016-2032)
- Table 12: Global Generative AI in Accounting Market Y-o-Y Growth Rate Comparison by Region (2016-2032)
- Table 13: Global Generative AI in Accounting Market Y-o-Y Growth Rate Comparison by Based On Deployment Model (2016-2032)
- Table 14: Global Generative AI in Accounting Market Y-o-Y Growth Rate Comparison by Based On Application (2016-2032)
- Table 15: Global Generative AI in Accounting Market Y-o-Y Growth Rate Comparison by Based On Technology (2016-2032)
- Table 16: Global Generative AI in Accounting Market Y-o-Y Growth Rate Comparison by Based On End-User (2016-2032)
- Table 17: Global Generative AI in Accounting Market Share Comparison by Region (2016-2032)
- Table 18: Global Generative AI in Accounting Market Share Comparison by Based On Deployment Model (2016-2032)
- Table 19: Global Generative AI in Accounting Market Share Comparison by Based On Application (2016-2032)
- Table 20: Global Generative AI in Accounting Market Share Comparison by Based On Technology (2016-2032)
- Table 21: Global Generative AI in Accounting Market Share Comparison by Based On End-User (2016-2032)
- Table 22: North America Generative AI in Accounting Market Comparison by Based On Application (2016-2032)
- Table 23: North America Generative AI in Accounting Market Comparison by Based On Technology (2016-2032)
- Table 24: North America Generative AI in Accounting Market Comparison by Based On End-User (2016-2032)
- Table 25: North America Generative AI in Accounting Revenue (US$ Mn) Comparison by Country (2016-2032)
- Table 26: North America Generative AI in Accounting Market Revenue (US$ Mn) (2016-2032)
- Table 27: North America Generative AI in Accounting Market Revenue (US$ Mn) Comparison by Country (2016-2032)
- Table 28: North America Generative AI in Accounting Market Revenue (US$ Mn) Comparison by Based On Deployment Model (2016-2032)
- Table 29: North America Generative AI in Accounting Market Revenue (US$ Mn) Comparison by Based On Application (2016-2032)
- Table 30: North America Generative AI in Accounting Market Revenue (US$ Mn) Comparison by Based On Technology (2016-2032)
- Table 31: North America Generative AI in Accounting Market Revenue (US$ Mn) Comparison by Based On End-User (2016-2032)
- Table 32: North America Generative AI in Accounting Market Y-o-Y Growth Rate Comparison by Country (2016-2032)
- Table 33: North America Generative AI in Accounting Market Y-o-Y Growth Rate Comparison by Based On Deployment Model (2016-2032)
- Table 34: North America Generative AI in Accounting Market Y-o-Y Growth Rate Comparison by Based On Application (2016-2032)
- Table 35: North America Generative AI in Accounting Market Y-o-Y Growth Rate Comparison by Based On Technology (2016-2032)
- Table 36: North America Generative AI in Accounting Market Y-o-Y Growth Rate Comparison by Based On End-User (2016-2032)
- Table 37: North America Generative AI in Accounting Market Share Comparison by Country (2016-2032)
- Table 38: North America Generative AI in Accounting Market Share Comparison by Based On Deployment Model (2016-2032)
- Table 39: North America Generative AI in Accounting Market Share Comparison by Based On Application (2016-2032)
- Table 40: North America Generative AI in Accounting Market Share Comparison by Based On Technology (2016-2032)
- Table 41: North America Generative AI in Accounting Market Share Comparison by Based On End-User (2016-2032)
- Table 42: Western Europe Generative AI in Accounting Market Comparison by Based On Deployment Model (2016-2032)
- Table 43: Western Europe Generative AI in Accounting Market Comparison by Based On Application (2016-2032)
- Table 44: Western Europe Generative AI in Accounting Market Comparison by Based On Technology (2016-2032)
- Table 45: Western Europe Generative AI in Accounting Market Comparison by Based On End-User (2016-2032)
- Table 46: Western Europe Generative AI in Accounting Revenue (US$ Mn) Comparison by Country (2016-2032)
- Table 47: Western Europe Generative AI in Accounting Market Revenue (US$ Mn) (2016-2032)
- Table 48: Western Europe Generative AI in Accounting Market Revenue (US$ Mn) Comparison by Country (2016-2032)
- Table 49: Western Europe Generative AI in Accounting Market Revenue (US$ Mn) Comparison by Based On Deployment Model (2016-2032)
- Table 50: Western Europe Generative AI in Accounting Market Revenue (US$ Mn) Comparison by Based On Application (2016-2032)
- Table 51: Western Europe Generative AI in Accounting Market Revenue (US$ Mn) Comparison by Based On Technology (2016-2032)
- Table 52: Western Europe Generative AI in Accounting Market Revenue (US$ Mn) Comparison by Based On End-User (2016-2032)
- Table 53: Western Europe Generative AI in Accounting Market Y-o-Y Growth Rate Comparison by Country (2016-2032)
- Table 54: Western Europe Generative AI in Accounting Market Y-o-Y Growth Rate Comparison by Based On Deployment Model (2016-2032)
- Table 55: Western Europe Generative AI in Accounting Market Y-o-Y Growth Rate Comparison by Based On Application (2016-2032)
- Table 56: Western Europe Generative AI in Accounting Market Y-o-Y Growth Rate Comparison by Based On Technology (2016-2032)
- Table 57: Western Europe Generative AI in Accounting Market Y-o-Y Growth Rate Comparison by Based On End-User (2016-2032)
- Table 58: Western Europe Generative AI in Accounting Market Share Comparison by Country (2016-2032)
- Table 59: Western Europe Generative AI in Accounting Market Share Comparison by Based On Deployment Model (2016-2032)
- Table 60: Western Europe Generative AI in Accounting Market Share Comparison by Based On Application (2016-2032)
- Table 61: Western Europe Generative AI in Accounting Market Share Comparison by Based On Technology (2016-2032)
- Table 62: Western Europe Generative AI in Accounting Market Share Comparison by Based On End-User (2016-2032)
- Table 63: Eastern Europe Generative AI in Accounting Market Comparison by Based On Deployment Model (2016-2032)
- Table 64: Eastern Europe Generative AI in Accounting Market Comparison by Based On Application (2016-2032)
- Table 65: Eastern Europe Generative AI in Accounting Market Comparison by Based On Technology (2016-2032)
- Table 66: Eastern Europe Generative AI in Accounting Market Comparison by Based On End-User (2016-2032)
- Table 67: Eastern Europe Generative AI in Accounting Revenue (US$ Mn) Comparison by Country (2016-2032)
- Table 68: Eastern Europe Generative AI in Accounting Market Revenue (US$ Mn) (2016-2032)
- Table 69: Eastern Europe Generative AI in Accounting Market Revenue (US$ Mn) Comparison by Country (2016-2032)
- Table 70: Eastern Europe Generative AI in Accounting Market Revenue (US$ Mn) Comparison by Based On Deployment Model (2016-2032)
- Table 71: Eastern Europe Generative AI in Accounting Market Revenue (US$ Mn) Comparison by Based On Application (2016-2032)
- Table 72: Eastern Europe Generative AI in Accounting Market Revenue (US$ Mn) Comparison by Based On Technology (2016-2032)
- Table 73: Eastern Europe Generative AI in Accounting Market Revenue (US$ Mn) Comparison by Based On End-User (2016-2032)
- Table 74: Eastern Europe Generative AI in Accounting Market Y-o-Y Growth Rate Comparison by Country (2016-2032)
- Table 75: Eastern Europe Generative AI in Accounting Market Y-o-Y Growth Rate Comparison by Based On Deployment Model (2016-2032)
- Table 76: Eastern Europe Generative AI in Accounting Market Y-o-Y Growth Rate Comparison by Based On Application (2016-2032)
- Table 77: Eastern Europe Generative AI in Accounting Market Y-o-Y Growth Rate Comparison by Based On Technology (2016-2032)
- Table 78: Eastern Europe Generative AI in Accounting Market Y-o-Y Growth Rate Comparison by Based On End-User (2016-2032)
- Table 79: Eastern Europe Generative AI in Accounting Market Share Comparison by Country (2016-2032)
- Table 80: Eastern Europe Generative AI in Accounting Market Share Comparison by Based On Deployment Model (2016-2032)
- Table 81: Eastern Europe Generative AI in Accounting Market Share Comparison by Based On Application (2016-2032)
- Table 82: Eastern Europe Generative AI in Accounting Market Share Comparison by Based On Technology (2016-2032)
- Table 83: Eastern Europe Generative AI in Accounting Market Share Comparison by Based On End-User (2016-2032)
- Table 84: APAC Generative AI in Accounting Market Comparison by Based On Deployment Model (2016-2032)
- Table 85: APAC Generative AI in Accounting Market Comparison by Based On Application (2016-2032)
- Table 86: APAC Generative AI in Accounting Market Comparison by Based On Technology (2016-2032)
- Table 87: APAC Generative AI in Accounting Market Comparison by Based On End-User (2016-2032)
- Table 88: APAC Generative AI in Accounting Revenue (US$ Mn) Comparison by Country (2016-2032)
- Table 89: APAC Generative AI in Accounting Market Revenue (US$ Mn) (2016-2032)
- Table 90: APAC Generative AI in Accounting Market Revenue (US$ Mn) Comparison by Country (2016-2032)
- Table 91: APAC Generative AI in Accounting Market Revenue (US$ Mn) Comparison by Based On Deployment Model (2016-2032)
- Table 92: APAC Generative AI in Accounting Market Revenue (US$ Mn) Comparison by Based On Application (2016-2032)
- Table 93: APAC Generative AI in Accounting Market Revenue (US$ Mn) Comparison by Based On Technology (2016-2032)
- Table 94: APAC Generative AI in Accounting Market Revenue (US$ Mn) Comparison by Based On End-User (2016-2032)
- Table 95: APAC Generative AI in Accounting Market Y-o-Y Growth Rate Comparison by Country (2016-2032)
- Table 96: APAC Generative AI in Accounting Market Y-o-Y Growth Rate Comparison by Based On Deployment Model (2016-2032)
- Table 97: APAC Generative AI in Accounting Market Y-o-Y Growth Rate Comparison by Based On Application (2016-2032)
- Table 98: APAC Generative AI in Accounting Market Y-o-Y Growth Rate Comparison by Based On Technology (2016-2032)
- Table 99: APAC Generative AI in Accounting Market Y-o-Y Growth Rate Comparison by Based On End-User (2016-2032)
- Table 100: APAC Generative AI in Accounting Market Share Comparison by Country (2016-2032)
- Table 101: APAC Generative AI in Accounting Market Share Comparison by Based On Deployment Model (2016-2032)
- Table 102: APAC Generative AI in Accounting Market Share Comparison by Based On Application (2016-2032)
- Table 103: APAC Generative AI in Accounting Market Share Comparison by Based On Technology (2016-2032)
- Table 104: APAC Generative AI in Accounting Market Share Comparison by Based On End-User (2016-2032)
- Table 105: Latin America Generative AI in Accounting Market Comparison by Based On Deployment Model (2016-2032)
- Table 106: Latin America Generative AI in Accounting Market Comparison by Based On Application (2016-2032)
- Table 107: Latin America Generative AI in Accounting Market Comparison by Based On Technology (2016-2032)
- Table 108: Latin America Generative AI in Accounting Market Comparison by Based On End-User (2016-2032)
- Table 109: Latin America Generative AI in Accounting Revenue (US$ Mn) Comparison by Country (2016-2032)
- Table 110: Latin America Generative AI in Accounting Market Revenue (US$ Mn) (2016-2032)
- Table 111: Latin America Generative AI in Accounting Market Revenue (US$ Mn) Comparison by Country (2016-2032)
- Table 112: Latin America Generative AI in Accounting Market Revenue (US$ Mn) Comparison by Based On Deployment Model (2016-2032)
- Table 113: Latin America Generative AI in Accounting Market Revenue (US$ Mn) Comparison by Based On Application (2016-2032)
- Table 114: Latin America Generative AI in Accounting Market Revenue (US$ Mn) Comparison by Based On Technology (2016-2032)
- Table 115: Latin America Generative AI in Accounting Market Revenue (US$ Mn) Comparison by Based On End-User (2016-2032)
- Table 116: Latin America Generative AI in Accounting Market Y-o-Y Growth Rate Comparison by Country (2016-2032)
- Table 117: Latin America Generative AI in Accounting Market Y-o-Y Growth Rate Comparison by Based On Deployment Model (2016-2032)
- Table 118: Latin America Generative AI in Accounting Market Y-o-Y Growth Rate Comparison by Based On Application (2016-2032)
- Table 119: Latin America Generative AI in Accounting Market Y-o-Y Growth Rate Comparison by Based On Technology (2016-2032)
- Table 120: Latin America Generative AI in Accounting Market Y-o-Y Growth Rate Comparison by Based On End-User (2016-2032)
- Table 121: Latin America Generative AI in Accounting Market Share Comparison by Country (2016-2032)
- Table 122: Latin America Generative AI in Accounting Market Share Comparison by Based On Deployment Model (2016-2032)
- Table 123: Latin America Generative AI in Accounting Market Share Comparison by Based On Application (2016-2032)
- Table 124: Latin America Generative AI in Accounting Market Share Comparison by Based On Technology (2016-2032)
- Table 125: Latin America Generative AI in Accounting Market Share Comparison by Based On End-User (2016-2032)
- Table 126: Middle East & Africa Generative AI in Accounting Market Comparison by Based On Deployment Model (2016-2032)
- Table 127: Middle East & Africa Generative AI in Accounting Market Comparison by Based On Application (2016-2032)
- Table 128: Middle East & Africa Generative AI in Accounting Market Comparison by Based On Technology (2016-2032)
- Table 129: Middle East & Africa Generative AI in Accounting Market Comparison by Based On End-User (2016-2032)
- Table 130: Middle East & Africa Generative AI in Accounting Revenue (US$ Mn) Comparison by Country (2016-2032)
- Table 131: Middle East & Africa Generative AI in Accounting Market Revenue (US$ Mn) (2016-2032)
- Table 132: Middle East & Africa Generative AI in Accounting Market Revenue (US$ Mn) Comparison by Country (2016-2032)
- Table 133: Middle East & Africa Generative AI in Accounting Market Revenue (US$ Mn) Comparison by Based On Deployment Model (2016-2032)
- Table 134: Middle East & Africa Generative AI in Accounting Market Revenue (US$ Mn) Comparison by Based On Application (2016-2032)
- Table 135: Middle East & Africa Generative AI in Accounting Market Revenue (US$ Mn) Comparison by Based On Technology (2016-2032)
- Table 136: Middle East & Africa Generative AI in Accounting Market Revenue (US$ Mn) Comparison by Based On End-User (2016-2032)
- Table 137: Middle East & Africa Generative AI in Accounting Market Y-o-Y Growth Rate Comparison by Country (2016-2032)
- Table 138: Middle East & Africa Generative AI in Accounting Market Y-o-Y Growth Rate Comparison by Based On Deployment Model (2016-2032)
- Table 139: Middle East & Africa Generative AI in Accounting Market Y-o-Y Growth Rate Comparison by Based On Application (2016-2032)
- Table 140: Middle East & Africa Generative AI in Accounting Market Y-o-Y Growth Rate Comparison by Based On Technology (2016-2032)
- Table 141: Middle East & Africa Generative AI in Accounting Market Y-o-Y Growth Rate Comparison by Based On End-User (2016-2032)
- Table 142: Middle East & Africa Generative AI in Accounting Market Share Comparison by Country (2016-2032)
- Table 143: Middle East & Africa Generative AI in Accounting Market Share Comparison by Based On Deployment Model (2016-2032)
- Table 144: Middle East & Africa Generative AI in Accounting Market Share Comparison by Based On Application (2016-2032)
- Table 145: Middle East & Africa Generative AI in Accounting Market Share Comparison by Based On Technology (2016-2032)
- Table 146: Middle East & Africa Generative AI in Accounting Market Share Comparison by Based On End-User (2016-2032)
- 1. Executive Summary
-
- IBM Corporation
- KPMG
- BlackLine, Inc
- SAP SE
- Workday, Inc.
- NVIDIA Corporation
- Intuit Inc.
- UiPath Inc.
- Deloitte Touche Tohmatsu Limited
- Other Key Players
Our Clients


View Our Licence Options
