
Coconut Derivatives Market Report By Type of Derivative (Coconut Oil, Coconut Water, Desiccated Coconut, Coconut Milk and Cream, Coconut Flour, Coconut Sugar, Coconut Vinegar, Others), By Application (Food and Beverage [Dairy and Frozen Desserts, Bakery and Confectionery, Beverages, Snacks, Others], Cosmetics and Personal Care, Pharmaceuticals, Industrial), By End User, By Region and Companies - Industry Segment Outlook, Market Assessment, Competition Scenario, Trends and Forecast 2024-2033
-
14744
-
July 2024
-
321
-


-
This report was compiled by Shreyas Rokade Shreyas Rokade is a seasoned Research Analyst with CMFE, bringing extensive expertise in market research and consulting, with a strong background in Chemical Engineering. Correspondence Team Lead-CMFE Linkedin | Detailed Market research Methodology Our methodology involves a mix of primary research, including interviews with leading mental health experts, and secondary research from reputable medical journals and databases. View Detailed Methodology Page
-
Quick Navigation
Report Overview
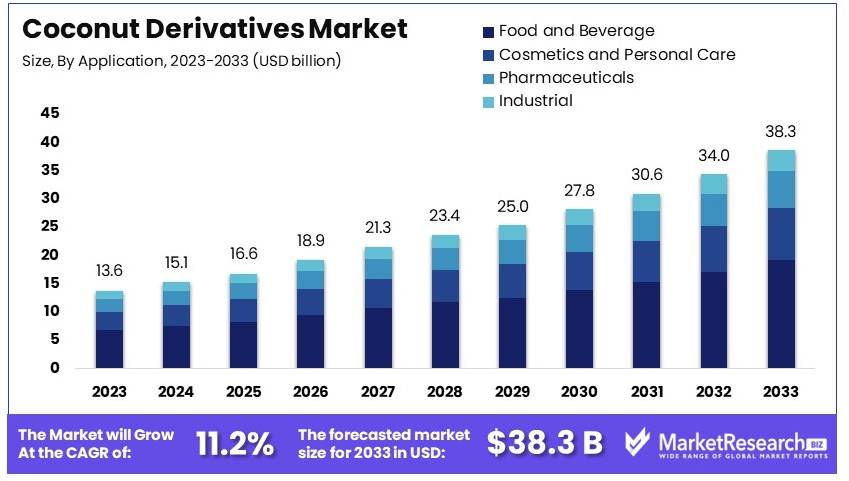
The Global Coconut Derivatives Market size is expected to be worth around USD 38.3 Billion by 2033, from USD 13.6 Billion in 2023, growing at a CAGR of 11.2% during the forecast period from 2024 to 2033.
The Coconut Derivatives market involves products derived from coconuts, such as coconut oil, milk, water, and flour. These derivatives are widely used in food and beverage, cosmetics, and personal care industries. The market is driven by growing consumer demand for natural and organic products.
Coconut oil is valued for its health benefits and versatility in cooking and skincare. Coconut water is popular as a natural hydrating beverage. Coconut milk and flour cater to the rising demand for plant-based and gluten-free products.
Sustainability concerns and the shift towards plant-based diets are boosting the coconut derivatives market. Producers are focusing on sustainable farming practices and innovative product formulations to meet consumer preferences. The market is expected to grow as more industries adopt coconut derivatives for their health benefits and eco-friendly appeal.
The Coconut Derivatives Market is experiencing robust growth, fueled by increasing production and global demand. Coconut derivatives, including oil, milk, and water, are in high demand due to their health benefits and diverse applications in food, beverages, and personal care products. This market trend is supported by significant production increases in major coconut-producing countries.
India, one of the top producers, has seen its coconut production rise dramatically, from 3,281.7 million nuts in 1950-51 to 20,535.88 million nuts in 2022-2023. This growth underscores India's expanding role in the global coconut market. Indonesia and the Philippines, alongside India, account for approximately 72% of the world's total coconut production. In 2020, Indonesia led global production with about 17 million metric tons of coconuts, highlighting its dominance in the market.
The demand for coconut derivatives is also reflected in global import patterns. In 2019, the United States, China, the United Arab Emirates, the European Union, and Japan were the top importers of fresh or dried coconuts. This high demand from diverse regions indicates a broad consumer base and the widespread acceptance of coconut products.
The growth in coconut production and the strong import demand suggest a positive outlook for the Coconut Derivatives Market. Producers in major coconut-growing regions are well-positioned to meet the rising global demand. This growth is driven by consumer preferences for natural and health-oriented products, positioning coconut derivatives as a key segment in the global market. The market is set to expand further, supported by consistent production increases and growing consumer awareness of the benefits of coconut-based products.
Key Takeaways
- Market Value: The Coconut Derivatives Market was valued at USD 13.6 billion in 2023, and is expected to reach USD 38.3 billion by 2033, with a CAGR of 11.2%.
- Type of Derivative Analysis: Coconut Oil dominated with 35%; it is essential for its wide applications in various industries.
- Application Analysis: Food and Beverage dominated with 50%; it signifies the major use of coconut derivatives in food products.
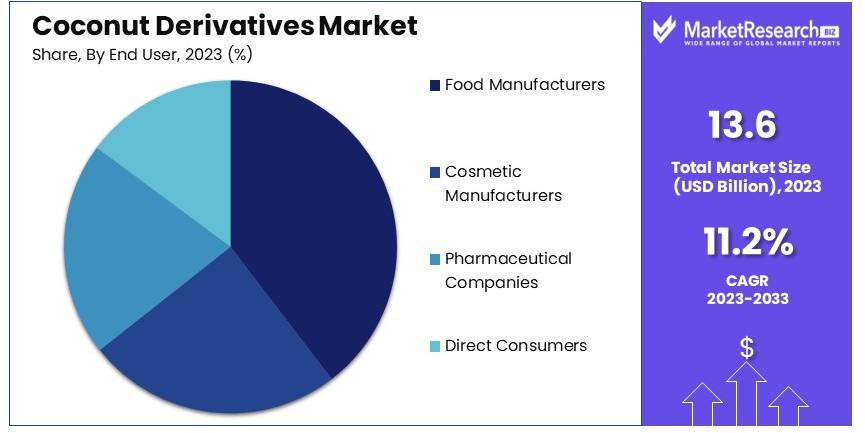
- End User Analysis: Food Manufacturers dominated with 40%; highlighting the importance of coconut derivatives in food production.
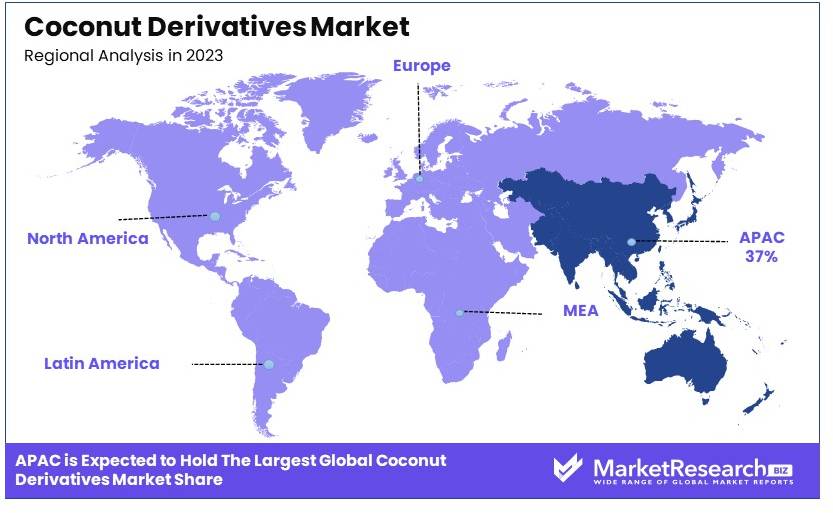
- Dominant Region: Asia Pacific ~37%; signifies high production and consumption in this region.
- High Growth Region: North America ~28%; growing interest in natural and healthy products.
- Analyst Viewpoint: The market is growing rapidly with significant competition among key players, driven by health trends and increasing demand for natural products.
- Growth Opportunities: Key players can leverage innovations in product development and expand into emerging markets to stand out.
Driving Factors
Increasing Health Awareness and Preference for Natural Products Drive Market Growth
The global trend towards healthier lifestyles and natural product consumption significantly drives the coconut derivatives market. Consumers are increasingly aware of the health benefits associated with coconut products, such as coconut oil, milk, and coconut water, which are rich in essential nutrients, antioxidants, and healthy fats. For instance, coconut oil has gained popularity for its use in cooking, skincare, and hair care due to its moisturizing properties and potential to improve heart health.
This growing preference for organic and natural products over synthetic alternatives is bolstering the demand for coconut derivatives across various sectors, including food and beverages, cosmetics, and pharmaceuticals. Additionally, the shift towards natural and organic foods aligns with broader health and wellness trends, further amplifying market growth. As more consumers seek to integrate healthier and more sustainable products into their daily routines, the coconut derivatives market is poised for continuous expansion.
Rising Demand in the Food and Beverage Industry Drives Market Growth
The food and beverage industry is a significant driver of the coconut derivatives market. Coconut products are increasingly being incorporated into various food items, such as dairy-free beverages, plant-based snacks, and gluten-free products, to cater to the growing demand for vegan and lactose-intolerant options. For example, coconut milk and coconut water are now staples in many households and are used in a variety of recipes and beverages.
The versatility of coconut derivatives in enhancing flavor, texture, and nutritional value in food products is a major factor contributing to market growth. Additionally, the increasing consumer interest in exotic and tropical flavors has led to greater incorporation of coconut ingredients in innovative culinary applications. The combination of these factors highlights the dynamic role of the food and beverage industry in driving the demand for coconut derivatives. As the industry continues to evolve and diversify its product offerings, the market for coconut-based ingredients is expected to see sustained growth.
Expansion in the Cosmetics and Personal Care Industry Drives Market Growth
The cosmetics and personal care industry has witnessed a surge in the use of coconut-based ingredients due to their beneficial properties. Coconut oil, for instance, is widely used in the formulation of skin moisturizers, hair conditioners, and other personal care products because of its hydrating and antimicrobial properties. Companies like The Body Shop and L'Oréal have launched product lines that prominently feature coconut derivatives, catering to consumer demand for natural and effective skincare solutions.
This trend is expected to continue, driving further growth in the market as consumers increasingly seek out products with natural and sustainable ingredients. Furthermore, the growing awareness of the harmful effects of synthetic chemicals in beauty products has propelled the shift towards natural alternatives, reinforcing the market expansion. The integration of coconut derivatives into high-demand product categories within the cosmetics and personal care industry underscores the sector's critical role in shaping market trends and fostering continued growth.
Restraining Factors
Limited Coconut Production and Supply Chain Challenges Restrain Market Growth
The coconut derivatives market is limited by production and supply chain challenges. Coconut production is highly dependent on specific geographic regions, mainly tropical countries like the Philippines, Indonesia, and India. Adverse weather conditions, such as typhoons and droughts, can significantly impact crop yields. Natural disasters and disease outbreaks, such as the coconut beetle infestation, further exacerbate these challenges.
Supply chain issues also hinder market growth. Disruptions in transportation and logistics can lead to inconsistent availability and higher prices for coconut derivatives. The concentration of production in limited areas makes the supply chain vulnerable. For instance, a severe storm in a major producing country can cause a substantial decrease in supply, leading to price volatility. Fluctuations in coconut supply have led to price increases of up to 20% in recent years, impacting the affordability and attractiveness of coconut derivatives.
Competition from Alternative Sources Restrains Market Growth
The coconut derivatives market faces stiff competition from alternative sources. Plant-based oils, such as palm oil and soybean oil, are significant competitors to coconut oil. These alternatives are often cheaper and more widely available, making them attractive substitutes. For example, palm oil production is more widespread and less susceptible to the geographic limitations of coconut cultivation.
In addition, synthetic and animal-derived ingredients compete with coconut derivatives in various industries. For instance, in the cosmetics and food industries, synthetic ingredients can offer similar functionalities at a lower cost. This competition can reduce the market share of coconut derivatives and affect pricing dynamics. According to industry analysis, the availability of alternative oils has kept the price growth of coconut oil in check, with market share growth for coconut derivatives.
Type of Derivative Analysis
Coconut Oil Dominates with 35% due to Its Versatility and Health Benefits
The coconut derivatives market is diverse, with coconut oil emerging as the dominant sub-segment. Coconut oil holds approximately 35% of the market share, attributed to its versatility and wide range of applications. It is used extensively in the food and beverage industry for cooking and baking due to its health benefits, including its content of medium-chain triglycerides (MCTs) which are known to boost metabolism and support weight management.
The cosmetics and personal care industry also significantly contributes to the demand for coconut oil, leveraging its moisturizing properties and use in products like lotions, hair conditioners, and soaps. The rising consumer awareness regarding the health benefits of natural ingredients further propels the demand for coconut oil.
Coconut oil's role in pharmaceuticals is growing as well, particularly in formulations for topical applications and as a carrier oil for various medications. The industrial segment also utilizes coconut oil in the production of biofuels and lubricants, reflecting its broad utility across different sectors. According to recent data, the global coconut oil market is projected to grow at a CAGR of 8% from 2023 to 2030, driven by the increasing demand in emerging economies and the trend towards natural and organic products.
Other derivatives, such as coconut water, desiccated coconut, coconut milk and cream, coconut flour, coconut sugar, and coconut vinegar, also play significant roles in the market. Coconut water is popular for its hydration properties and is a key player in the beverage industry. Desiccated coconut is widely used in bakery and confectionery items, while coconut milk and cream are essential in dairy alternatives and cooking. Coconut flour and coconut sugar cater to the growing demand for gluten-free and low-glycemic-index foods. Coconut vinegar is gaining traction as a healthy alternative to traditional vinegars.
Application Analysis
Food and Beverage Dominates with 50% due to High Consumer Demand for Natural Products
The food and beverage industry is the largest application segment for coconut derivatives, accounting for approximately 50% of the market. The demand in this segment is driven by the increasing consumer preference for natural and organic products. Coconut oil is widely used in cooking and baking, while coconut water is popular as a refreshing and hydrating beverage. The sub-segments of dairy and frozen desserts, bakery and confectionery, beverages, and snacks are major contributors to the growth of the food and beverage sector.The dairy and frozen desserts sub-segment benefits from the lactose-free and vegan attributes of coconut milk and cream, making them popular among consumers with dietary restrictions or preferences. In bakery and confectionery, desiccated coconut and coconut oil are essential ingredients, providing texture and flavor. The beverages sub-segment is fueled by the popularity of coconut water as a natural electrolyte drink. Snacks and other food items utilize coconut derivatives for their nutritional benefits and natural sweetness.
Cosmetics and personal care, pharmaceuticals, and industrial applications also contribute to the market growth. In cosmetics and personal care, coconut derivatives are valued for their moisturizing and anti-inflammatory properties. In pharmaceuticals, they are used in various formulations for their health benefits. The industrial segment uses coconut derivatives in biofuels, lubricants, and other applications due to their sustainability and environmental benefits.
End User Analysis
Food Manufacturers Dominate with 40% due to Extensive Use of Coconut Ingredients
Food manufacturers are the leading end users of coconut derivatives, holding around 40% of the market share. The extensive use of coconut ingredients in a wide range of food products drives this dominance. Coconut oil, milk, cream, flour, and sugar are integral to the production of various food items, from baked goods to dairy alternatives. The health benefits of these ingredients and their appeal to health-conscious consumers fuel their demand among food manufacturers.Cosmetic manufacturers are significant users of coconut derivatives as well, utilizing coconut oil, water, and other derivatives in skincare, haircare, and personal care products. The trend towards natural and organic beauty products boosts the demand in this segment. Pharmaceutical companies also use coconut derivatives in medicinal and therapeutic products, appreciating their natural properties and health benefits.
Direct consumers form a growing segment, driven by the increasing availability of coconut products in retail and online stores. The rising awareness of the health benefits of coconut derivatives and their use in home cooking and personal care contribute to the growth of this end-user segment.
In summary, the coconut derivatives market is segmented into various types, applications, and end users, with coconut oil, food and beverage applications, and food manufacturers dominating their respective segments due to their versatility, high consumer demand, and extensive use of coconut ingredients. The market is expected to continue growing, driven by trends towards natural and organic products and the diverse applications of coconut derivatives across different industries.
Key Market Segments
By Type of Derivative
- Coconut Oil
- Coconut Water
- Desiccated Coconut
- Coconut Milk and Cream
- Coconut Flour
- Coconut Sugar
- Coconut Vinegar
- Others
By Application
- Food and Beverage
- Dairy and Frozen Desserts
- Bakery and Confectionery
- Beverages
- Snacks
- Others
- Cosmetics and Personal Care
- Pharmaceuticals
- Industrial
By End User
- Food Manufacturers
- Cosmetic Manufacturers
- Pharmaceutical Companies
- Direct Consumers
Growth Opportunities
Product Innovation and Diversification Offer Growth Opportunity
Continuous product innovation and diversification provide significant growth opportunities for the coconut derivatives market. Manufacturers can explore new applications and create innovative formulations to meet evolving consumer preferences. For example, developing new coconut-based beverages, snacks, and personal care products can attract emerging market segments and drive growth.
The launch of unique products like coconut-infused skincare items and healthy snacks can tap into the growing demand for natural and functional foods. According to recent market data, the introduction of new coconut-based products has led to an increase in market share over the past two years. This trend underscores the potential for sustained growth through innovation and diversification.
Expansion into Emerging Markets Offers Growth Opportunity
Emerging markets represent a significant growth opportunity for the coconut derivatives market. These economies have growing populations and rising disposable incomes, which boost consumer spending. As awareness of the health benefits of coconut-derived products increases, demand is expected to surge.
Manufacturers can expand their presence and distribution networks strategically to capitalize on these opportunities. For instance, markets in Asia-Pacific and Latin America are experiencing a rapid increase in demand for natural and organic products, including coconut derivatives.
Trending Factors
Coconut Water and Coconut Milk Are Trending Factors
Coconut water and coconut milk are becoming popular as functional beverages due to their health benefits and hydrating properties. These products are marketed as natural and nutrient-rich alternatives to traditional beverages, aligning with the trend towards healthy and mindful consumption.
The demand for coconut water and milk has seen a significant rise, with market growth rates of 15% and 12% respectively over the past year. This trend is fueled by consumers seeking natural hydration options and dairy alternatives. The growing preference for plant-based diets and functional foods further supports the popularity of coconut water and milk in the market.
Coconut-Based Personal Care and Cosmetic Products Are Trending Factors
Coconut-based personal care and cosmetic products are gaining traction in the market. Coconut oil, coconut water, and other derivatives are increasingly used in hair care, skincare, and cosmetic products due to their moisturizing and nourishing properties. These products appeal to consumers seeking natural and eco-friendly alternatives.
The use of coconut ingredients in beauty products has resulted in a 20% increase in market share in the cosmetics sector over the past year. This trend reflects the growing consumer interest in natural and sustainable beauty products, driven by the demand for effective and environmentally friendly solutions.
Regional Analysis
Asia Pacific Dominates with 37% Market Share
Asia Pacific leads the coconut derivatives market with a 37% share. Key factors include the region's favorable climate for coconut cultivation and the availability of raw materials. Major producers like the Philippines, Indonesia, and India contribute significantly. High consumer demand for natural and organic products in these countries further drives market growth. Additionally, strong export activities boost market presence globally.
The tropical climate of Asia Pacific ensures year-round coconut production, supporting consistent supply. The established agricultural infrastructure and labor availability in this region facilitate efficient production and processing. Regional policies promoting agricultural exports enhance the industry's performance. Moreover, the growing middle-class population increases demand for health-conscious and organic products, supporting market expansion.
Asia Pacific's market presence is expected to strengthen, driven by rising consumer awareness and disposable incomes. The market is projected to grow at a CAGR of 9% over the next five years. Innovations in product offerings and expanding export markets will further bolster growth. Continued investment in agricultural technologies and infrastructure will enhance production efficiency, ensuring sustained market dominance.
Regional Market Share
North America: North America holds a 20% market share. High demand for organic and natural products drives growth. The region's strong retail network supports the distribution of coconut derivatives. The market is expected to grow at a CAGR of 8%, reflecting the increasing consumer preference for health-focused products.
Europe: Europe accounts for 25% of the market share. The region's stringent regulations on organic products and high consumer awareness contribute to its market position. The demand for coconut-based beauty and personal care products is particularly strong. Europe is projected to grow at a CAGR of 7%, driven by the trend towards natural ingredients.
Middle East & Africa: The Middle East & Africa region has a 10% market share. The demand is driven by the growing awareness of the health benefits of coconut derivatives. Market growth is supported by increasing imports of coconut products. The market is expected to grow at a CAGR of 6%, with rising disposable incomes and health-consciousness boosting demand.
Latin America: Latin America represents 8% of the market share. The region's growth is supported by the rising popularity of natural and organic foods. Brazil and Mexico are key markets, with increasing consumer preference for coconut products. The market is projected to grow at a CAGR of 7%, driven by expanding retail networks and product availability.Key Regions and Countries
- North America
- The US
- Canada
- Mexico
- Western Europe
- Germany
- France
- The UK
- Spain
- Italy
- Portugal
- Ireland
- Austria
- Switzerland
- Benelux
- Nordic
- Rest of Western Europe
- Eastern Europe
- Russia
- Poland
- The Czech Republic
- Greece
- Rest of Eastern Europe
- APAC
- China
- Japan
- South Korea
- India
- Australia & New Zealand
- Indonesia
- Malaysia
- Philippines
- Singapore
- Thailand
- Vietnam
- Rest of APAC
- Latin America
- Brazil
- Colombia
- Chile
- Argentina
- Costa Rica
- Rest of Latin America
- Middle East & Africa
- Algeria
- Egypt
- Israel
- Kuwait
- Nigeria
- Saudi Arabia
- South Africa
- Turkey
- United Arab Emirates
- Rest of MEA
Key Players Analysis
The Coconut Derivatives Market features prominent players like Cargill, Incorporated, Vita Coco, and others, each playing a crucial role in market dynamics.
Cargill, Incorporated and Vita Coco lead the market. Cargill's extensive distribution network and Vita Coco's strong brand presence strategically position them as market influencers. They drive innovation in coconut derivatives, impacting market growth.
KLF Nirmal Industries Pvt. Ltd. and Marico Limited contribute significantly with their diverse product offerings. Their market strategies focus on high-quality coconut products, enhancing their market influence.
Bunge Limited and Groupe Danone S.A. leverage their global presence and advanced processing technologies. Their strategic positioning in the coconut derivatives market allows them to impact market trends effectively.
Pepsico, Inc. and The Coca-Cola Company are key players with their strong market presence and extensive distribution networks. Their introduction of coconut-based beverages boosts market demand.
Kerry Group plc and Nestlé S.A. bring innovation and quality to the market. Their focus on sustainable sourcing and product development enhances their strategic positioning.
Hain Celestial Group, Inc. and Theppadungporn Coconut Co., Ltd. are essential contributors with their organic and high-quality coconut products. Their strategic market approaches influence consumer preferences.
Celebes Coconut Corporation and SC Global Coco Products, Inc. focus on diverse coconut derivatives, strengthening their market influence through innovation and quality.
PT. Sambu Group also plays a vital role. Its extensive product range and strong market presence contribute to the growth and development of the coconut derivatives market.
In summary, these companies drive the Coconut Derivatives Market through strategic positioning, innovative products, and strong market influence. Their contributions shape market trends and foster growth in the industry.
Market Key Players
- Cargill, Incorporated
- Vita Coco
- KLF Nirmal Industries Pvt. Ltd.
- Marico Limited
- Bunge Limited
- Groupe Danone S.A.
- PepsiCo, Inc.
- The Coca-Cola Company
- Kerry Group plc
- Nestlé S.A.
- Hain Celestial Group, Inc.
- Theppadungporn Coconut Co., Ltd.
- Celebes Coconut Corporation
- SC Global Coco Products, Inc.
- PT. Sambu Group
Recent Developments
- January 2022: Agro Tech Foods Ltd. launched Sundrop Duo, a coconut-centered product line entering the chocolate confectionary segment. This launch is anticipated to elevate the demand for coconut products in the coming years.
- July 2024: UK artisan vegan cheesemaker Julienne Bruno celebrated two significant wins for its Superstraccia®, a soy and coconut-based fermented cheese designed for pizzas and salads. The product has been added to the menus of pizza chain Pizza Pilgrims and has received a gold award in the Cheese category.
Report Scope
Report Features Description Market Value (2023) USD 13.6 Billion Forecast Revenue (2033) USD 38.3 Billion CAGR (2024-2033) 11.2% Base Year for Estimation 2023 Historic Period 2018-2023 Forecast Period 2024-2033 Report Coverage Revenue Forecast, Market Dynamics, Competitive Landscape, Recent Developments Segments Covered By Type of Derivative (Coconut Oil, Coconut Water, Desiccated Coconut, Coconut Milk and Cream, Coconut Flour, Coconut Sugar, Coconut Vinegar, Others), By Application (Food and Beverage [Dairy and Frozen Desserts, Bakery and Confectionery, Beverages, Snacks, Others], Cosmetics and Personal Care, Pharmaceuticals, Industrial), By End User (Food Manufacturers, Cosmetic Manufacturers, Pharmaceutical Companies, Direct Consumers) Regional Analysis North America - The US, Canada, & Mexico; Western Europe - Germany, France, The UK, Spain, Italy, Portugal, Ireland, Austria, Switzerland, Benelux, Nordic, & Rest of Western Europe; Eastern Europe - Russia, Poland, The Czech Republic, Greece, & Rest of Eastern Europe; APAC - China, Japan, South Korea, India, Australia & New Zealand, Indonesia, Malaysia, Philippines, Singapore, Thailand, Vietnam, & Rest of APAC; Latin America - Brazil, Colombia, Chile, Argentina, Costa Rica, & Rest of Latin America; Middle East & Africa - Algeria, Egypt, Israel, Kuwait, Nigeria, Saudi Arabia, South Africa, Turkey, United Arab Emirates, & Rest of MEA Competitive Landscape Cargill, Incorporated, Vita Coco, KLF Nirmal Industries Pvt. Ltd., Marico Limited, Bunge Limited, Groupe Danone S.A., Pepsico, Inc., The Coca-Cola Company, Kerry Group plc, Nestlé S.A., Hain Celestial Group, Inc., Theppadungporn Coconut Co., Ltd., Celebes Coconut Corporation, SC Global Coco Products, Inc., PT. Sambu Group Customization Scope Customization for segments, region/country-level will be provided. Moreover, additional customization can be done based on the requirements. Purchase Options We have three licenses to opt for: Single User License, Multi-User License (Up to 5 Users), Corporate Use License (Unlimited User and Printable PDF) -
- 1. Executive Summary
- 1.1. Definition
- 1.2. Taxonomy
- 1.3. Research Scope
- 1.4. Key Analysis
- 1.5. Key Findings by Major Segments
- 1.6. Top strategies by Major Players
- 2. Global More Electric Aircraft Market Overview
- 2.1. More Electric Aircraft Market Dynamics
- 2.1.1. Drivers
- 2.1.2. Opportunities
- 2.1.3. Restraints
- 2.1.4. Challenges
- 2.2. Macro-economic Factors
- 2.3. Regulatory Framework
- 2.4. Market Investment Feasibility Index
- 2.5. PEST Analysis
- 2.6. PORTER’S Five Force Analysis
- 2.7. Drivers & Restraints Impact Analysis
- 2.8. Industry Chain Analysis
- 2.9. Cost Structure Analysis
- 2.10. Marketing Strategy
- 2.11. Russia-Ukraine War Impact Analysis
- 2.12. Opportunity Map Analysis
- 2.13. Market Competition Scenario Analysis
- 2.14. Product Life Cycle Analysis
- 2.15. Opportunity Orbits
- 2.16. Manufacturer Intensity Map
- 2.17. Major Companies sales by Value & Volume
- 2.1. More Electric Aircraft Market Dynamics
- 3. Global More Electric Aircraft Market Analysis, Opportunity and Forecast, 2016-2033
- 3.1. Global More Electric Aircraft Market Analysis, 2016-2021
- 3.2. Global More Electric Aircraft Market Opportunity and Forecast, 2023-2033
- 3.3. Global More Electric Aircraft Market Analysis, Opportunity and Forecast, By Aircraft Type, 2016-2033
- 3.3.1. Global More Electric Aircraft Market Analysis by Aircraft Type: Introduction
- 3.3.2. Market Size Absolute $ Opportunity Analysis and Forecast, By Aircraft Type, 2016-2033
- 3.3.3. Fixed-wing Aircraft
- 3.3.4. Rotary-wing Aircraft
- 3.4. Global More Electric Aircraft Market Analysis, Opportunity and Forecast, By System Type, 2016-2033
- 3.4.1. Global More Electric Aircraft Market Analysis by System Type: Introduction
- 3.4.2. Market Size Absolute $ Opportunity Analysis and Forecast, By System Type, 2016-2033
- 3.4.3. Power Generation
- 3.4.4. Power Distribution
- 3.4.5. Power Conversion
- 3.5. Global More Electric Aircraft Market Analysis, Opportunity and Forecast, By Component Type, 2016-2033
- 3.5.1. Global More Electric Aircraft Market Analysis by Component Type: Introduction
- 3.5.2. Market Size Absolute $ Opportunity Analysis and Forecast, By Component Type, 2016-2033
- 3.5.3. Electric Actuators
- 3.5.4. Electric Motors
- 3.5.5. Electric Power Systems
- 3.5.6. Energy Storage Devices (Batteries, Supercapacitors)
- 3.5.7. Power Electronics
- 3.5.8. Others
- 3.6. Global More Electric Aircraft Market Analysis, Opportunity and Forecast, By Application, 2016-2033
- 3.6.1. Global More Electric Aircraft Market Analysis by Application: Introduction
- 3.6.2. Market Size Absolute $ Opportunity Analysis and Forecast, By Application, 2016-2033
- 3.6.3. Propulsion Systems
- 3.6.4. Flight Control Systems
- 3.6.5. Utility Systems (Hydraulic and Pneumatic Replacement)
- 3.6.6. Avionics
- 4. North America More Electric Aircraft Market Analysis, Opportunity and Forecast, 2016-2033
- 4.1. North America More Electric Aircraft Market Analysis, 2016-2021
- 4.2. North America More Electric Aircraft Market Opportunity and Forecast, 2023-2033
- 4.3. North America More Electric Aircraft Market Analysis, Opportunity and Forecast, By Aircraft Type, 2016-2033
- 4.3.1. North America More Electric Aircraft Market Analysis by Aircraft Type: Introduction
- 4.3.2. Market Size Absolute $ Opportunity Analysis and Forecast, By Aircraft Type, 2016-2033
- 4.3.3. Fixed-wing Aircraft
- 4.3.4. Rotary-wing Aircraft
- 4.4. North America More Electric Aircraft Market Analysis, Opportunity and Forecast, By System Type, 2016-2033
- 4.4.1. North America More Electric Aircraft Market Analysis by System Type: Introduction
- 4.4.2. Market Size Absolute $ Opportunity Analysis and Forecast, By System Type, 2016-2033
- 4.4.3. Power Generation
- 4.4.4. Power Distribution
- 4.4.5. Power Conversion
- 4.5. North America More Electric Aircraft Market Analysis, Opportunity and Forecast, By Component Type, 2016-2033
- 4.5.1. North America More Electric Aircraft Market Analysis by Component Type: Introduction
- 4.5.2. Market Size Absolute $ Opportunity Analysis and Forecast, By Component Type, 2016-2033
- 4.5.3. Electric Actuators
- 4.5.4. Electric Motors
- 4.5.5. Electric Power Systems
- 4.5.6. Energy Storage Devices (Batteries, Supercapacitors)
- 4.5.7. Power Electronics
- 4.5.8. Others
- 4.6. North America More Electric Aircraft Market Analysis, Opportunity and Forecast, By Application, 2016-2033
- 4.6.1. North America More Electric Aircraft Market Analysis by Application: Introduction
- 4.6.2. Market Size Absolute $ Opportunity Analysis and Forecast, By Application, 2016-2033
- 4.6.3. Propulsion Systems
- 4.6.4. Flight Control Systems
- 4.6.5. Utility Systems (Hydraulic and Pneumatic Replacement)
- 4.6.6. Avionics
- 4.7. North America More Electric Aircraft Market Analysis, Opportunity and Forecast, By Country , 2016-2033
- 4.7.1. North America More Electric Aircraft Market Analysis by Country : Introduction
- 4.7.2. Market Size Absolute $ Opportunity Analysis and Forecast, Country , 2016-2033
- 4.7.2.1. The US
- 4.7.2.2. Canada
- 4.7.2.3. Mexico
- 5. Western Europe More Electric Aircraft Market Analysis, Opportunity and Forecast, 2016-2033
- 5.1. Western Europe More Electric Aircraft Market Analysis, 2016-2021
- 5.2. Western Europe More Electric Aircraft Market Opportunity and Forecast, 2023-2033
- 5.3. Western Europe More Electric Aircraft Market Analysis, Opportunity and Forecast, By Aircraft Type, 2016-2033
- 5.3.1. Western Europe More Electric Aircraft Market Analysis by Aircraft Type: Introduction
- 5.3.2. Market Size Absolute $ Opportunity Analysis and Forecast, By Aircraft Type, 2016-2033
- 5.3.3. Fixed-wing Aircraft
- 5.3.4. Rotary-wing Aircraft
- 5.4. Western Europe More Electric Aircraft Market Analysis, Opportunity and Forecast, By System Type, 2016-2033
- 5.4.1. Western Europe More Electric Aircraft Market Analysis by System Type: Introduction
- 5.4.2. Market Size Absolute $ Opportunity Analysis and Forecast, By System Type, 2016-2033
- 5.4.3. Power Generation
- 5.4.4. Power Distribution
- 5.4.5. Power Conversion
- 5.5. Western Europe More Electric Aircraft Market Analysis, Opportunity and Forecast, By Component Type, 2016-2033
- 5.5.1. Western Europe More Electric Aircraft Market Analysis by Component Type: Introduction
- 5.5.2. Market Size Absolute $ Opportunity Analysis and Forecast, By Component Type, 2016-2033
- 5.5.3. Electric Actuators
- 5.5.4. Electric Motors
- 5.5.5. Electric Power Systems
- 5.5.6. Energy Storage Devices (Batteries, Supercapacitors)
- 5.5.7. Power Electronics
- 5.5.8. Others
- 5.6. Western Europe More Electric Aircraft Market Analysis, Opportunity and Forecast, By Application, 2016-2033
- 5.6.1. Western Europe More Electric Aircraft Market Analysis by Application: Introduction
- 5.6.2. Market Size Absolute $ Opportunity Analysis and Forecast, By Application, 2016-2033
- 5.6.3. Propulsion Systems
- 5.6.4. Flight Control Systems
- 5.6.5. Utility Systems (Hydraulic and Pneumatic Replacement)
- 5.6.6. Avionics
- 5.7. Western Europe More Electric Aircraft Market Analysis, Opportunity and Forecast, By Country , 2016-2033
- 5.7.1. Western Europe More Electric Aircraft Market Analysis by Country : Introduction
- 5.7.2. Market Size Absolute $ Opportunity Analysis and Forecast, Country , 2016-2033
- 5.7.2.1. Germany
- 5.7.2.2. France
- 5.7.2.3. The UK
- 5.7.2.4. Spain
- 5.7.2.5. Italy
- 5.7.2.6. Portugal
- 5.7.2.7. Ireland
- 5.7.2.8. Austria
- 5.7.2.9. Switzerland
- 5.7.2.10. Benelux
- 5.7.2.11. Nordic
- 5.7.2.12. Rest of Western Europe
- 6. Eastern Europe More Electric Aircraft Market Analysis, Opportunity and Forecast, 2016-2033
- 6.1. Eastern Europe More Electric Aircraft Market Analysis, 2016-2021
- 6.2. Eastern Europe More Electric Aircraft Market Opportunity and Forecast, 2023-2033
- 6.3. Eastern Europe More Electric Aircraft Market Analysis, Opportunity and Forecast, By Aircraft Type, 2016-2033
- 6.3.1. Eastern Europe More Electric Aircraft Market Analysis by Aircraft Type: Introduction
- 6.3.2. Market Size Absolute $ Opportunity Analysis and Forecast, By Aircraft Type, 2016-2033
- 6.3.3. Fixed-wing Aircraft
- 6.3.4. Rotary-wing Aircraft
- 6.4. Eastern Europe More Electric Aircraft Market Analysis, Opportunity and Forecast, By System Type, 2016-2033
- 6.4.1. Eastern Europe More Electric Aircraft Market Analysis by System Type: Introduction
- 6.4.2. Market Size Absolute $ Opportunity Analysis and Forecast, By System Type, 2016-2033
- 6.4.3. Power Generation
- 6.4.4. Power Distribution
- 6.4.5. Power Conversion
- 6.5. Eastern Europe More Electric Aircraft Market Analysis, Opportunity and Forecast, By Component Type, 2016-2033
- 6.5.1. Eastern Europe More Electric Aircraft Market Analysis by Component Type: Introduction
- 6.5.2. Market Size Absolute $ Opportunity Analysis and Forecast, By Component Type, 2016-2033
- 6.5.3. Electric Actuators
- 6.5.4. Electric Motors
- 6.5.5. Electric Power Systems
- 6.5.6. Energy Storage Devices (Batteries, Supercapacitors)
- 6.5.7. Power Electronics
- 6.5.8. Others
- 6.6. Eastern Europe More Electric Aircraft Market Analysis, Opportunity and Forecast, By Application, 2016-2033
- 6.6.1. Eastern Europe More Electric Aircraft Market Analysis by Application: Introduction
- 6.6.2. Market Size Absolute $ Opportunity Analysis and Forecast, By Application, 2016-2033
- 6.6.3. Propulsion Systems
- 6.6.4. Flight Control Systems
- 6.6.5. Utility Systems (Hydraulic and Pneumatic Replacement)
- 6.6.6. Avionics
- 6.7. Eastern Europe More Electric Aircraft Market Analysis, Opportunity and Forecast, By Country , 2016-2033
- 6.7.1. Eastern Europe More Electric Aircraft Market Analysis by Country : Introduction
- 6.7.2. Market Size Absolute $ Opportunity Analysis and Forecast, Country , 2016-2033
- 6.7.2.1. Russia
- 6.7.2.2. Poland
- 6.7.2.3. The Czech Republic
- 6.7.2.4. Greece
- 6.7.2.5. Rest of Eastern Europe
- 7. APAC More Electric Aircraft Market Analysis, Opportunity and Forecast, 2016-2033
- 7.1. APAC More Electric Aircraft Market Analysis, 2016-2021
- 7.2. APAC More Electric Aircraft Market Opportunity and Forecast, 2023-2033
- 7.3. APAC More Electric Aircraft Market Analysis, Opportunity and Forecast, By Aircraft Type, 2016-2033
- 7.3.1. APAC More Electric Aircraft Market Analysis by Aircraft Type: Introduction
- 7.3.2. Market Size Absolute $ Opportunity Analysis and Forecast, By Aircraft Type, 2016-2033
- 7.3.3. Fixed-wing Aircraft
- 7.3.4. Rotary-wing Aircraft
- 7.4. APAC More Electric Aircraft Market Analysis, Opportunity and Forecast, By System Type, 2016-2033
- 7.4.1. APAC More Electric Aircraft Market Analysis by System Type: Introduction
- 7.4.2. Market Size Absolute $ Opportunity Analysis and Forecast, By System Type, 2016-2033
- 7.4.3. Power Generation
- 7.4.4. Power Distribution
- 7.4.5. Power Conversion
- 7.5. APAC More Electric Aircraft Market Analysis, Opportunity and Forecast, By Component Type, 2016-2033
- 7.5.1. APAC More Electric Aircraft Market Analysis by Component Type: Introduction
- 7.5.2. Market Size Absolute $ Opportunity Analysis and Forecast, By Component Type, 2016-2033
- 7.5.3. Electric Actuators
- 7.5.4. Electric Motors
- 7.5.5. Electric Power Systems
- 7.5.6. Energy Storage Devices (Batteries, Supercapacitors)
- 7.5.7. Power Electronics
- 7.5.8. Others
- 7.6. APAC More Electric Aircraft Market Analysis, Opportunity and Forecast, By Application, 2016-2033
- 7.6.1. APAC More Electric Aircraft Market Analysis by Application: Introduction
- 7.6.2. Market Size Absolute $ Opportunity Analysis and Forecast, By Application, 2016-2033
- 7.6.3. Propulsion Systems
- 7.6.4. Flight Control Systems
- 7.6.5. Utility Systems (Hydraulic and Pneumatic Replacement)
- 7.6.6. Avionics
- 7.7. APAC More Electric Aircraft Market Analysis, Opportunity and Forecast, By Country , 2016-2033
- 7.7.1. APAC More Electric Aircraft Market Analysis by Country : Introduction
- 7.7.2. Market Size Absolute $ Opportunity Analysis and Forecast, Country , 2016-2033
- 7.7.2.1. China
- 7.7.2.2. Japan
- 7.7.2.3. South Korea
- 7.7.2.4. India
- 7.7.2.5. Australia & New Zeland
- 7.7.2.6. Indonesia
- 7.7.2.7. Malaysia
- 7.7.2.8. Philippines
- 7.7.2.9. Singapore
- 7.7.2.10. Thailand
- 7.7.2.11. Vietnam
- 7.7.2.12. Rest of APAC
- 8. Latin America More Electric Aircraft Market Analysis, Opportunity and Forecast, 2016-2033
- 8.1. Latin America More Electric Aircraft Market Analysis, 2016-2021
- 8.2. Latin America More Electric Aircraft Market Opportunity and Forecast, 2023-2033
- 8.3. Latin America More Electric Aircraft Market Analysis, Opportunity and Forecast, By Aircraft Type, 2016-2033
- 8.3.1. Latin America More Electric Aircraft Market Analysis by Aircraft Type: Introduction
- 8.3.2. Market Size Absolute $ Opportunity Analysis and Forecast, By Aircraft Type, 2016-2033
- 8.3.3. Fixed-wing Aircraft
- 8.3.4. Rotary-wing Aircraft
- 8.4. Latin America More Electric Aircraft Market Analysis, Opportunity and Forecast, By System Type, 2016-2033
- 8.4.1. Latin America More Electric Aircraft Market Analysis by System Type: Introduction
- 8.4.2. Market Size Absolute $ Opportunity Analysis and Forecast, By System Type, 2016-2033
- 8.4.3. Power Generation
- 8.4.4. Power Distribution
- 8.4.5. Power Conversion
- 8.5. Latin America More Electric Aircraft Market Analysis, Opportunity and Forecast, By Component Type, 2016-2033
- 8.5.1. Latin America More Electric Aircraft Market Analysis by Component Type: Introduction
- 8.5.2. Market Size Absolute $ Opportunity Analysis and Forecast, By Component Type, 2016-2033
- 8.5.3. Electric Actuators
- 8.5.4. Electric Motors
- 8.5.5. Electric Power Systems
- 8.5.6. Energy Storage Devices (Batteries, Supercapacitors)
- 8.5.7. Power Electronics
- 8.5.8. Others
- 8.6. Latin America More Electric Aircraft Market Analysis, Opportunity and Forecast, By Application, 2016-2033
- 8.6.1. Latin America More Electric Aircraft Market Analysis by Application: Introduction
- 8.6.2. Market Size Absolute $ Opportunity Analysis and Forecast, By Application, 2016-2033
- 8.6.3. Propulsion Systems
- 8.6.4. Flight Control Systems
- 8.6.5. Utility Systems (Hydraulic and Pneumatic Replacement)
- 8.6.6. Avionics
- 8.7. Latin America More Electric Aircraft Market Analysis, Opportunity and Forecast, By Country , 2016-2033
- 8.7.1. Latin America More Electric Aircraft Market Analysis by Country : Introduction
- 8.7.2. Market Size Absolute $ Opportunity Analysis and Forecast, Country , 2016-2033
- 8.7.2.1. Brazil
- 8.7.2.2. Colombia
- 8.7.2.3. Chile
- 8.7.2.4. Argentina
- 8.7.2.5. Costa Rica
- 8.7.2.6. Rest of Latin America
- 9. Middle East & Africa More Electric Aircraft Market Analysis, Opportunity and Forecast, 2016-2033
- 9.1. Middle East & Africa More Electric Aircraft Market Analysis, 2016-2021
- 9.2. Middle East & Africa More Electric Aircraft Market Opportunity and Forecast, 2023-2033
- 9.3. Middle East & Africa More Electric Aircraft Market Analysis, Opportunity and Forecast, By Aircraft Type, 2016-2033
- 9.3.1. Middle East & Africa More Electric Aircraft Market Analysis by Aircraft Type: Introduction
- 9.3.2. Market Size Absolute $ Opportunity Analysis and Forecast, By Aircraft Type, 2016-2033
- 9.3.3. Fixed-wing Aircraft
- 9.3.4. Rotary-wing Aircraft
- 9.4. Middle East & Africa More Electric Aircraft Market Analysis, Opportunity and Forecast, By System Type, 2016-2033
- 9.4.1. Middle East & Africa More Electric Aircraft Market Analysis by System Type: Introduction
- 9.4.2. Market Size Absolute $ Opportunity Analysis and Forecast, By System Type, 2016-2033
- 9.4.3. Power Generation
- 9.4.4. Power Distribution
- 9.4.5. Power Conversion
- 9.5. Middle East & Africa More Electric Aircraft Market Analysis, Opportunity and Forecast, By Component Type, 2016-2033
- 9.5.1. Middle East & Africa More Electric Aircraft Market Analysis by Component Type: Introduction
- 9.5.2. Market Size Absolute $ Opportunity Analysis and Forecast, By Component Type, 2016-2033
- 9.5.3. Electric Actuators
- 9.5.4. Electric Motors
- 9.5.5. Electric Power Systems
- 9.5.6. Energy Storage Devices (Batteries, Supercapacitors)
- 9.5.7. Power Electronics
- 9.5.8. Others
- 9.6. Middle East & Africa More Electric Aircraft Market Analysis, Opportunity and Forecast, By Application, 2016-2033
- 9.6.1. Middle East & Africa More Electric Aircraft Market Analysis by Application: Introduction
- 9.6.2. Market Size Absolute $ Opportunity Analysis and Forecast, By Application, 2016-2033
- 9.6.3. Propulsion Systems
- 9.6.4. Flight Control Systems
- 9.6.5. Utility Systems (Hydraulic and Pneumatic Replacement)
- 9.6.6. Avionics
- 9.7. Middle East & Africa More Electric Aircraft Market Analysis, Opportunity and Forecast, By Country , 2016-2033
- 9.7.1. Middle East & Africa More Electric Aircraft Market Analysis by Country : Introduction
- 9.7.2. Market Size Absolute $ Opportunity Analysis and Forecast, Country , 2016-2033
- 9.7.2.1. Algeria
- 9.7.2.2. Egypt
- 9.7.2.3. Israel
- 9.7.2.4. Kuwait
- 9.7.2.5. Nigeria
- 9.7.2.6. Saudi Arabia
- 9.7.2.7. South Africa
- 9.7.2.8. Turkey
- 9.7.2.9. The UAE
- 9.7.2.10. Rest of MEA
- 10. Global More Electric Aircraft Market Analysis, Opportunity and Forecast, By Region , 2016-2033
- 10.1. Global More Electric Aircraft Market Analysis by Region : Introduction
- 10.2. Market Size Absolute $ Opportunity Analysis and Forecast, By Region , 2016-2033
- 10.2.1. North America
- 10.2.2. Western Europe
- 10.2.3. Eastern Europe
- 10.2.4. APAC
- 10.2.5. Latin America
- 10.2.6. Middle East & Africa
- 11. Global More Electric Aircraft Market Competitive Landscape, Market Share Analysis, and Company Profiles
- 11.1. Market Share Analysis
- 11.2. Company Profiles
- 11.3. Airbus SE
- 11.3.1. Company Overview
- 11.3.2. Financial Highlights
- 11.3.3. Product Portfolio
- 11.3.4. SWOT Analysis
- 11.3.5. Key Strategies and Developments
- 11.4. The Boeing Company
- 11.4.1. Company Overview
- 11.4.2. Financial Highlights
- 11.4.3. Product Portfolio
- 11.4.4. SWOT Analysis
- 11.4.5. Key Strategies and Developments
- 11.5. Rolls-Royce Holdings plc
- 11.5.1. Company Overview
- 11.5.2. Financial Highlights
- 11.5.3. Product Portfolio
- 11.5.4. SWOT Analysis
- 11.5.5. Key Strategies and Developments
- 11.6. Safran S.A.
- 11.6.1. Company Overview
- 11.6.2. Financial Highlights
- 11.6.3. Product Portfolio
- 11.6.4. SWOT Analysis
- 11.6.5. Key Strategies and Developments
- 11.7. Raytheon Technologies Corporation
- 11.7.1. Company Overview
- 11.7.2. Financial Highlights
- 11.7.3. Product Portfolio
- 11.7.4. SWOT Analysis
- 11.7.5. Key Strategies and Developments
- 11.8. General Electric Company
- 11.8.1. Company Overview
- 11.8.2. Financial Highlights
- 11.8.3. Product Portfolio
- 11.8.4. SWOT Analysis
- 11.8.5. Key Strategies and Developments
- 11.9. Honeywell International Inc.
- 11.9.1. Company Overview
- 11.9.2. Financial Highlights
- 11.9.3. Product Portfolio
- 11.9.4. SWOT Analysis
- 11.9.5. Key Strategies and Developments
- 11.10. Thales Group
- 11.10.1. Company Overview
- 11.10.2. Financial Highlights
- 11.10.3. Product Portfolio
- 11.10.4. SWOT Analysis
- 11.10.5. Key Strategies and Developments
- 11.11. Meggitt PLC
- 11.11.1. Company Overview
- 11.11.2. Financial Highlights
- 11.11.3. Product Portfolio
- 11.11.4. SWOT Analysis
- 11.11.5. Key Strategies and Developments
- 11.12. BAE Systems plc
- 11.12.1. Company Overview
- 11.12.2. Financial Highlights
- 11.12.3. Product Portfolio
- 11.12.4. SWOT Analysis
- 11.12.5. Key Strategies and Developments
- 11.13.1. Company Overview
- 11.13.2. Financial Highlights
- 11.13.3. Product Portfolio
- 11.13.4. SWOT Analysis
- 11.13.5. Key Strategies and Developments
- 11.14. (US$ Mn & Units)ed Technologies Corporation
- 11.14.1. Company Overview
- 11.14.2. Financial Highlights
- 11.14.3. Product Portfolio
- 11.14.4. SWOT Analysis
- 11.14.5. Key Strategies and Developments
- 11.15. Embraer S.A.
- 11.15.1. Company Overview
- 11.15.2. Financial Highlights
- 11.15.3. Product Portfolio
- 11.15.4. SWOT Analysis
- 11.15.5. Key Strategies and Developments
- 11.16. Leonardo S.p.A.
- 11.16.1. Company Overview
- 11.16.2. Financial Highlights
- 11.16.3. Product Portfolio
- 11.16.4. SWOT Analysis
- 11.16.5. Key Strategies and Developments
- 11.17. Northrop Grumman Corporation
- 11.17.1. Company Overview
- 11.17.2. Financial Highlights
- 11.17.3. Product Portfolio
- 11.17.4. SWOT Analysis
- 11.17.5. Key Strategies and Developments
- 12. Assumptions and Acronyms
- 13. Research Methodology
- 14. Contact
"
- List of Figures
- "
- Figure 1: Global More Electric Aircraft Market Revenue (US$ Mn) Market Share by Aircraft Type in 2022
- Figure 2: Global More Electric Aircraft Market Attractiveness Analysis by Aircraft Type, 2016-2033
- Figure 3: Global More Electric Aircraft Market Revenue (US$ Mn) Market Share by System Typein 2022
- Figure 4: Global More Electric Aircraft Market Attractiveness Analysis by System Type, 2016-2033
- Figure 5: Global More Electric Aircraft Market Revenue (US$ Mn) Market Share by Component Typein 2022
- Figure 6: Global More Electric Aircraft Market Attractiveness Analysis by Component Type, 2016-2033
- Figure 7: Global More Electric Aircraft Market Revenue (US$ Mn) Market Share by Applicationin 2022
- Figure 8: Global More Electric Aircraft Market Attractiveness Analysis by Application, 2016-2033
- Figure 9: Global More Electric Aircraft Market Revenue (US$ Mn) Market Share by Region in 2022
- Figure 10: Global More Electric Aircraft Market Attractiveness Analysis by Region, 2016-2033
- Figure 11: Global More Electric Aircraft Market Revenue (US$ Mn) (2016-2033)
- Figure 12: Global More Electric Aircraft Market Revenue (US$ Mn) Comparison by Region (2016-2033)
- Figure 13: Global More Electric Aircraft Market Revenue (US$ Mn) Comparison by Aircraft Type (2016-2033)
- Figure 14: Global More Electric Aircraft Market Revenue (US$ Mn) Comparison by System Type (2016-2033)
- Figure 15: Global More Electric Aircraft Market Revenue (US$ Mn) Comparison by Component Type (2016-2033)
- Figure 16: Global More Electric Aircraft Market Revenue (US$ Mn) Comparison by Application (2016-2033)
- Figure 17: Global More Electric Aircraft Market Y-o-Y Growth Rate Comparison by Region (2016-2033)
- Figure 18: Global More Electric Aircraft Market Y-o-Y Growth Rate Comparison by Aircraft Type (2016-2033)
- Figure 19: Global More Electric Aircraft Market Y-o-Y Growth Rate Comparison by System Type (2016-2033)
- Figure 20: Global More Electric Aircraft Market Y-o-Y Growth Rate Comparison by Component Type (2016-2033)
- Figure 21: Global More Electric Aircraft Market Y-o-Y Growth Rate Comparison by Application (2016-2033)
- Figure 22: Global More Electric Aircraft Market Share Comparison by Region (2016-2033)
- Figure 23: Global More Electric Aircraft Market Share Comparison by Aircraft Type (2016-2033)
- Figure 24: Global More Electric Aircraft Market Share Comparison by System Type (2016-2033)
- Figure 25: Global More Electric Aircraft Market Share Comparison by Component Type (2016-2033)
- Figure 26: Global More Electric Aircraft Market Share Comparison by Application (2016-2033)
- Figure 27: North America More Electric Aircraft Market Revenue (US$ Mn) Market Share by Aircraft Typein 2022
- Figure 28: North America More Electric Aircraft Market Attractiveness Analysis by Aircraft Type, 2016-2033
- Figure 29: North America More Electric Aircraft Market Revenue (US$ Mn) Market Share by System Typein 2022
- Figure 30: North America More Electric Aircraft Market Attractiveness Analysis by System Type, 2016-2033
- Figure 31: North America More Electric Aircraft Market Revenue (US$ Mn) Market Share by Component Typein 2022
- Figure 32: North America More Electric Aircraft Market Attractiveness Analysis by Component Type, 2016-2033
- Figure 33: North America More Electric Aircraft Market Revenue (US$ Mn) Market Share by Applicationin 2022
- Figure 34: North America More Electric Aircraft Market Attractiveness Analysis by Application, 2016-2033
- Figure 35: North America More Electric Aircraft Market Revenue (US$ Mn) Market Share by Country in 2022
- Figure 36: North America More Electric Aircraft Market Attractiveness Analysis by Country, 2016-2033
- Figure 37: North America More Electric Aircraft Market Revenue (US$ Mn) (2016-2033)
- Figure 38: North America More Electric Aircraft Market Revenue (US$ Mn) Comparison by Country (2016-2033)
- Figure 39: North America More Electric Aircraft Market Revenue (US$ Mn) Comparison by Aircraft Type (2016-2033)
- Figure 40: North America More Electric Aircraft Market Revenue (US$ Mn) Comparison by System Type (2016-2033)
- Figure 41: North America More Electric Aircraft Market Revenue (US$ Mn) Comparison by Component Type (2016-2033)
- Figure 42: North America More Electric Aircraft Market Revenue (US$ Mn) Comparison by Application (2016-2033)
- Figure 43: North America More Electric Aircraft Market Y-o-Y Growth Rate Comparison by Country (2016-2033)
- Figure 44: North America More Electric Aircraft Market Y-o-Y Growth Rate Comparison by Aircraft Type (2016-2033)
- Figure 45: North America More Electric Aircraft Market Y-o-Y Growth Rate Comparison by System Type (2016-2033)
- Figure 46: North America More Electric Aircraft Market Y-o-Y Growth Rate Comparison by Component Type (2016-2033)
- Figure 47: North America More Electric Aircraft Market Y-o-Y Growth Rate Comparison by Application (2016-2033)
- Figure 48: North America More Electric Aircraft Market Share Comparison by Country (2016-2033)
- Figure 49: North America More Electric Aircraft Market Share Comparison by Aircraft Type (2016-2033)
- Figure 50: North America More Electric Aircraft Market Share Comparison by System Type (2016-2033)
- Figure 51: North America More Electric Aircraft Market Share Comparison by Component Type (2016-2033)
- Figure 52: North America More Electric Aircraft Market Share Comparison by Application (2016-2033)
- Figure 53: Western Europe More Electric Aircraft Market Revenue (US$ Mn) Market Share by Aircraft Typein 2022
- Figure 54: Western Europe More Electric Aircraft Market Attractiveness Analysis by Aircraft Type, 2016-2033
- Figure 55: Western Europe More Electric Aircraft Market Revenue (US$ Mn) Market Share by System Typein 2022
- Figure 56: Western Europe More Electric Aircraft Market Attractiveness Analysis by System Type, 2016-2033
- Figure 57: Western Europe More Electric Aircraft Market Revenue (US$ Mn) Market Share by Component Typein 2022
- Figure 58: Western Europe More Electric Aircraft Market Attractiveness Analysis by Component Type, 2016-2033
- Figure 59: Western Europe More Electric Aircraft Market Revenue (US$ Mn) Market Share by Applicationin 2022
- Figure 60: Western Europe More Electric Aircraft Market Attractiveness Analysis by Application, 2016-2033
- Figure 61: Western Europe More Electric Aircraft Market Revenue (US$ Mn) Market Share by Country in 2022
- Figure 62: Western Europe More Electric Aircraft Market Attractiveness Analysis by Country, 2016-2033
- Figure 63: Western Europe More Electric Aircraft Market Revenue (US$ Mn) (2016-2033)
- Figure 64: Western Europe More Electric Aircraft Market Revenue (US$ Mn) Comparison by Country (2016-2033)
- Figure 65: Western Europe More Electric Aircraft Market Revenue (US$ Mn) Comparison by Aircraft Type (2016-2033)
- Figure 66: Western Europe More Electric Aircraft Market Revenue (US$ Mn) Comparison by System Type (2016-2033)
- Figure 67: Western Europe More Electric Aircraft Market Revenue (US$ Mn) Comparison by Component Type (2016-2033)
- Figure 68: Western Europe More Electric Aircraft Market Revenue (US$ Mn) Comparison by Application (2016-2033)
- Figure 69: Western Europe More Electric Aircraft Market Y-o-Y Growth Rate Comparison by Country (2016-2033)
- Figure 70: Western Europe More Electric Aircraft Market Y-o-Y Growth Rate Comparison by Aircraft Type (2016-2033)
- Figure 71: Western Europe More Electric Aircraft Market Y-o-Y Growth Rate Comparison by System Type (2016-2033)
- Figure 72: Western Europe More Electric Aircraft Market Y-o-Y Growth Rate Comparison by Component Type (2016-2033)
- Figure 73: Western Europe More Electric Aircraft Market Y-o-Y Growth Rate Comparison by Application (2016-2033)
- Figure 74: Western Europe More Electric Aircraft Market Share Comparison by Country (2016-2033)
- Figure 75: Western Europe More Electric Aircraft Market Share Comparison by Aircraft Type (2016-2033)
- Figure 76: Western Europe More Electric Aircraft Market Share Comparison by System Type (2016-2033)
- Figure 77: Western Europe More Electric Aircraft Market Share Comparison by Component Type (2016-2033)
- Figure 78: Western Europe More Electric Aircraft Market Share Comparison by Application (2016-2033)
- Figure 79: Eastern Europe More Electric Aircraft Market Revenue (US$ Mn) Market Share by Aircraft Typein 2022
- Figure 80: Eastern Europe More Electric Aircraft Market Attractiveness Analysis by Aircraft Type, 2016-2033
- Figure 81: Eastern Europe More Electric Aircraft Market Revenue (US$ Mn) Market Share by System Typein 2022
- Figure 82: Eastern Europe More Electric Aircraft Market Attractiveness Analysis by System Type, 2016-2033
- Figure 83: Eastern Europe More Electric Aircraft Market Revenue (US$ Mn) Market Share by Component Typein 2022
- Figure 84: Eastern Europe More Electric Aircraft Market Attractiveness Analysis by Component Type, 2016-2033
- Figure 85: Eastern Europe More Electric Aircraft Market Revenue (US$ Mn) Market Share by Applicationin 2022
- Figure 86: Eastern Europe More Electric Aircraft Market Attractiveness Analysis by Application, 2016-2033
- Figure 87: Eastern Europe More Electric Aircraft Market Revenue (US$ Mn) Market Share by Country in 2022
- Figure 88: Eastern Europe More Electric Aircraft Market Attractiveness Analysis by Country, 2016-2033
- Figure 89: Eastern Europe More Electric Aircraft Market Revenue (US$ Mn) (2016-2033)
- Figure 90: Eastern Europe More Electric Aircraft Market Revenue (US$ Mn) Comparison by Country (2016-2033)
- Figure 91: Eastern Europe More Electric Aircraft Market Revenue (US$ Mn) Comparison by Aircraft Type (2016-2033)
- Figure 92: Eastern Europe More Electric Aircraft Market Revenue (US$ Mn) Comparison by System Type (2016-2033)
- Figure 93: Eastern Europe More Electric Aircraft Market Revenue (US$ Mn) Comparison by Component Type (2016-2033)
- Figure 94: Eastern Europe More Electric Aircraft Market Revenue (US$ Mn) Comparison by Application (2016-2033)
- Figure 95: Eastern Europe More Electric Aircraft Market Y-o-Y Growth Rate Comparison by Country (2016-2033)
- Figure 96: Eastern Europe More Electric Aircraft Market Y-o-Y Growth Rate Comparison by Aircraft Type (2016-2033)
- Figure 97: Eastern Europe More Electric Aircraft Market Y-o-Y Growth Rate Comparison by System Type (2016-2033)
- Figure 98: Eastern Europe More Electric Aircraft Market Y-o-Y Growth Rate Comparison by Component Type (2016-2033)
- Figure 99: Eastern Europe More Electric Aircraft Market Y-o-Y Growth Rate Comparison by Application (2016-2033)
- Figure 100: Eastern Europe More Electric Aircraft Market Share Comparison by Country (2016-2033)
- Figure 101: Eastern Europe More Electric Aircraft Market Share Comparison by Aircraft Type (2016-2033)
- Figure 102: Eastern Europe More Electric Aircraft Market Share Comparison by System Type (2016-2033)
- Figure 103: Eastern Europe More Electric Aircraft Market Share Comparison by Component Type (2016-2033)
- Figure 104: Eastern Europe More Electric Aircraft Market Share Comparison by Application (2016-2033)
- Figure 105: APAC More Electric Aircraft Market Revenue (US$ Mn) Market Share by Aircraft Typein 2022
- Figure 106: APAC More Electric Aircraft Market Attractiveness Analysis by Aircraft Type, 2016-2033
- Figure 107: APAC More Electric Aircraft Market Revenue (US$ Mn) Market Share by System Typein 2022
- Figure 108: APAC More Electric Aircraft Market Attractiveness Analysis by System Type, 2016-2033
- Figure 109: APAC More Electric Aircraft Market Revenue (US$ Mn) Market Share by Component Typein 2022
- Figure 110: APAC More Electric Aircraft Market Attractiveness Analysis by Component Type, 2016-2033
- Figure 111: APAC More Electric Aircraft Market Revenue (US$ Mn) Market Share by Applicationin 2022
- Figure 112: APAC More Electric Aircraft Market Attractiveness Analysis by Application, 2016-2033
- Figure 113: APAC More Electric Aircraft Market Revenue (US$ Mn) Market Share by Country in 2022
- Figure 114: APAC More Electric Aircraft Market Attractiveness Analysis by Country, 2016-2033
- Figure 115: APAC More Electric Aircraft Market Revenue (US$ Mn) (2016-2033)
- Figure 116: APAC More Electric Aircraft Market Revenue (US$ Mn) Comparison by Country (2016-2033)
- Figure 117: APAC More Electric Aircraft Market Revenue (US$ Mn) Comparison by Aircraft Type (2016-2033)
- Figure 118: APAC More Electric Aircraft Market Revenue (US$ Mn) Comparison by System Type (2016-2033)
- Figure 119: APAC More Electric Aircraft Market Revenue (US$ Mn) Comparison by Component Type (2016-2033)
- Figure 120: APAC More Electric Aircraft Market Revenue (US$ Mn) Comparison by Application (2016-2033)
- Figure 121: APAC More Electric Aircraft Market Y-o-Y Growth Rate Comparison by Country (2016-2033)
- Figure 122: APAC More Electric Aircraft Market Y-o-Y Growth Rate Comparison by Aircraft Type (2016-2033)
- Figure 123: APAC More Electric Aircraft Market Y-o-Y Growth Rate Comparison by System Type (2016-2033)
- Figure 124: APAC More Electric Aircraft Market Y-o-Y Growth Rate Comparison by Component Type (2016-2033)
- Figure 125: APAC More Electric Aircraft Market Y-o-Y Growth Rate Comparison by Application (2016-2033)
- Figure 126: APAC More Electric Aircraft Market Share Comparison by Country (2016-2033)
- Figure 127: APAC More Electric Aircraft Market Share Comparison by Aircraft Type (2016-2033)
- Figure 128: APAC More Electric Aircraft Market Share Comparison by System Type (2016-2033)
- Figure 129: APAC More Electric Aircraft Market Share Comparison by Component Type (2016-2033)
- Figure 130: APAC More Electric Aircraft Market Share Comparison by Application (2016-2033)
- Figure 131: Latin America More Electric Aircraft Market Revenue (US$ Mn) Market Share by Aircraft Typein 2022
- Figure 132: Latin America More Electric Aircraft Market Attractiveness Analysis by Aircraft Type, 2016-2033
- Figure 133: Latin America More Electric Aircraft Market Revenue (US$ Mn) Market Share by System Typein 2022
- Figure 134: Latin America More Electric Aircraft Market Attractiveness Analysis by System Type, 2016-2033
- Figure 135: Latin America More Electric Aircraft Market Revenue (US$ Mn) Market Share by Component Typein 2022
- Figure 136: Latin America More Electric Aircraft Market Attractiveness Analysis by Component Type, 2016-2033
- Figure 137: Latin America More Electric Aircraft Market Revenue (US$ Mn) Market Share by Applicationin 2022
- Figure 138: Latin America More Electric Aircraft Market Attractiveness Analysis by Application, 2016-2033
- Figure 139: Latin America More Electric Aircraft Market Revenue (US$ Mn) Market Share by Country in 2022
- Figure 140: Latin America More Electric Aircraft Market Attractiveness Analysis by Country, 2016-2033
- Figure 141: Latin America More Electric Aircraft Market Revenue (US$ Mn) (2016-2033)
- Figure 142: Latin America More Electric Aircraft Market Revenue (US$ Mn) Comparison by Country (2016-2033)
- Figure 143: Latin America More Electric Aircraft Market Revenue (US$ Mn) Comparison by Aircraft Type (2016-2033)
- Figure 144: Latin America More Electric Aircraft Market Revenue (US$ Mn) Comparison by System Type (2016-2033)
- Figure 145: Latin America More Electric Aircraft Market Revenue (US$ Mn) Comparison by Component Type (2016-2033)
- Figure 146: Latin America More Electric Aircraft Market Revenue (US$ Mn) Comparison by Application (2016-2033)
- Figure 147: Latin America More Electric Aircraft Market Y-o-Y Growth Rate Comparison by Country (2016-2033)
- Figure 148: Latin America More Electric Aircraft Market Y-o-Y Growth Rate Comparison by Aircraft Type (2016-2033)
- Figure 149: Latin America More Electric Aircraft Market Y-o-Y Growth Rate Comparison by System Type (2016-2033)
- Figure 150: Latin America More Electric Aircraft Market Y-o-Y Growth Rate Comparison by Component Type (2016-2033)
- Figure 151: Latin America More Electric Aircraft Market Y-o-Y Growth Rate Comparison by Application (2016-2033)
- Figure 152: Latin America More Electric Aircraft Market Share Comparison by Country (2016-2033)
- Figure 153: Latin America More Electric Aircraft Market Share Comparison by Aircraft Type (2016-2033)
- Figure 154: Latin America More Electric Aircraft Market Share Comparison by System Type (2016-2033)
- Figure 155: Latin America More Electric Aircraft Market Share Comparison by Component Type (2016-2033)
- Figure 156: Latin America More Electric Aircraft Market Share Comparison by Application (2016-2033)
- Figure 157: Middle East & Africa More Electric Aircraft Market Revenue (US$ Mn) Market Share by Aircraft Typein 2022
- Figure 158: Middle East & Africa More Electric Aircraft Market Attractiveness Analysis by Aircraft Type, 2016-2033
- Figure 159: Middle East & Africa More Electric Aircraft Market Revenue (US$ Mn) Market Share by System Typein 2022
- Figure 160: Middle East & Africa More Electric Aircraft Market Attractiveness Analysis by System Type, 2016-2033
- Figure 161: Middle East & Africa More Electric Aircraft Market Revenue (US$ Mn) Market Share by Component Typein 2022
- Figure 162: Middle East & Africa More Electric Aircraft Market Attractiveness Analysis by Component Type, 2016-2033
- Figure 163: Middle East & Africa More Electric Aircraft Market Revenue (US$ Mn) Market Share by Applicationin 2022
- Figure 164: Middle East & Africa More Electric Aircraft Market Attractiveness Analysis by Application, 2016-2033
- Figure 165: Middle East & Africa More Electric Aircraft Market Revenue (US$ Mn) Market Share by Country in 2022
- Figure 166: Middle East & Africa More Electric Aircraft Market Attractiveness Analysis by Country, 2016-2033
- Figure 167: Middle East & Africa More Electric Aircraft Market Revenue (US$ Mn) (2016-2033)
- Figure 168: Middle East & Africa More Electric Aircraft Market Revenue (US$ Mn) Comparison by Country (2016-2033)
- Figure 169: Middle East & Africa More Electric Aircraft Market Revenue (US$ Mn) Comparison by Aircraft Type (2016-2033)
- Figure 170: Middle East & Africa More Electric Aircraft Market Revenue (US$ Mn) Comparison by System Type (2016-2033)
- Figure 171: Middle East & Africa More Electric Aircraft Market Revenue (US$ Mn) Comparison by Component Type (2016-2033)
- Figure 172: Middle East & Africa More Electric Aircraft Market Revenue (US$ Mn) Comparison by Application (2016-2033)
- Figure 173: Middle East & Africa More Electric Aircraft Market Y-o-Y Growth Rate Comparison by Country (2016-2033)
- Figure 174: Middle East & Africa More Electric Aircraft Market Y-o-Y Growth Rate Comparison by Aircraft Type (2016-2033)
- Figure 175: Middle East & Africa More Electric Aircraft Market Y-o-Y Growth Rate Comparison by System Type (2016-2033)
- Figure 176: Middle East & Africa More Electric Aircraft Market Y-o-Y Growth Rate Comparison by Component Type (2016-2033)
- Figure 177: Middle East & Africa More Electric Aircraft Market Y-o-Y Growth Rate Comparison by Application (2016-2033)
- Figure 178: Middle East & Africa More Electric Aircraft Market Share Comparison by Country (2016-2033)
- Figure 179: Middle East & Africa More Electric Aircraft Market Share Comparison by Aircraft Type (2016-2033)
- Figure 180: Middle East & Africa More Electric Aircraft Market Share Comparison by System Type (2016-2033)
- Figure 181: Middle East & Africa More Electric Aircraft Market Share Comparison by Component Type (2016-2033)
- Figure 182: Middle East & Africa More Electric Aircraft Market Share Comparison by Application (2016-2033)
"
- List of Tables
- "
- Table 1: Global More Electric Aircraft Market Comparison by Aircraft Type (2016-2033)
- Table 2: Global More Electric Aircraft Market Comparison by System Type (2016-2033)
- Table 3: Global More Electric Aircraft Market Comparison by Component Type (2016-2033)
- Table 4: Global More Electric Aircraft Market Comparison by Application (2016-2033)
- Table 5: Global More Electric Aircraft Market Revenue (US$ Mn) Comparison by Region (2016-2033)
- Table 6: Global More Electric Aircraft Market Revenue (US$ Mn) (2016-2033)
- Table 7: Global More Electric Aircraft Market Revenue (US$ Mn) Comparison by Region (2016-2033)
- Table 8: Global More Electric Aircraft Market Revenue (US$ Mn) Comparison by Aircraft Type (2016-2033)
- Table 9: Global More Electric Aircraft Market Revenue (US$ Mn) Comparison by System Type (2016-2033)
- Table 10: Global More Electric Aircraft Market Revenue (US$ Mn) Comparison by Component Type (2016-2033)
- Table 11: Global More Electric Aircraft Market Revenue (US$ Mn) Comparison by Application (2016-2033)
- Table 12: Global More Electric Aircraft Market Y-o-Y Growth Rate Comparison by Region (2016-2033)
- Table 13: Global More Electric Aircraft Market Y-o-Y Growth Rate Comparison by Aircraft Type (2016-2033)
- Table 14: Global More Electric Aircraft Market Y-o-Y Growth Rate Comparison by System Type (2016-2033)
- Table 15: Global More Electric Aircraft Market Y-o-Y Growth Rate Comparison by Component Type (2016-2033)
- Table 16: Global More Electric Aircraft Market Y-o-Y Growth Rate Comparison by Application (2016-2033)
- Table 17: Global More Electric Aircraft Market Share Comparison by Region (2016-2033)
- Table 18: Global More Electric Aircraft Market Share Comparison by Aircraft Type (2016-2033)
- Table 19: Global More Electric Aircraft Market Share Comparison by System Type (2016-2033)
- Table 20: Global More Electric Aircraft Market Share Comparison by Component Type (2016-2033)
- Table 21: Global More Electric Aircraft Market Share Comparison by Application (2016-2033)
- Table 22: North America More Electric Aircraft Market Comparison by System Type (2016-2033)
- Table 23: North America More Electric Aircraft Market Comparison by Component Type (2016-2033)
- Table 24: North America More Electric Aircraft Market Comparison by Application (2016-2033)
- Table 25: North America More Electric Aircraft Market Revenue (US$ Mn) Comparison by Country (2016-2033)
- Table 26: North America More Electric Aircraft Market Revenue (US$ Mn) (2016-2033)
- Table 27: North America More Electric Aircraft Market Revenue (US$ Mn) Comparison by Country (2016-2033)
- Table 28: North America More Electric Aircraft Market Revenue (US$ Mn) Comparison by Aircraft Type (2016-2033)
- Table 29: North America More Electric Aircraft Market Revenue (US$ Mn) Comparison by System Type (2016-2033)
- Table 30: North America More Electric Aircraft Market Revenue (US$ Mn) Comparison by Component Type (2016-2033)
- Table 31: North America More Electric Aircraft Market Revenue (US$ Mn) Comparison by Application (2016-2033)
- Table 32: North America More Electric Aircraft Market Y-o-Y Growth Rate Comparison by Country (2016-2033)
- Table 33: North America More Electric Aircraft Market Y-o-Y Growth Rate Comparison by Aircraft Type (2016-2033)
- Table 34: North America More Electric Aircraft Market Y-o-Y Growth Rate Comparison by System Type (2016-2033)
- Table 35: North America More Electric Aircraft Market Y-o-Y Growth Rate Comparison by Component Type (2016-2033)
- Table 36: North America More Electric Aircraft Market Y-o-Y Growth Rate Comparison by Application (2016-2033)
- Table 37: North America More Electric Aircraft Market Share Comparison by Country (2016-2033)
- Table 38: North America More Electric Aircraft Market Share Comparison by Aircraft Type (2016-2033)
- Table 39: North America More Electric Aircraft Market Share Comparison by System Type (2016-2033)
- Table 40: North America More Electric Aircraft Market Share Comparison by Component Type (2016-2033)
- Table 41: North America More Electric Aircraft Market Share Comparison by Application (2016-2033)
- Table 42: Western Europe More Electric Aircraft Market Comparison by Aircraft Type (2016-2033)
- Table 43: Western Europe More Electric Aircraft Market Comparison by System Type (2016-2033)
- Table 44: Western Europe More Electric Aircraft Market Comparison by Component Type (2016-2033)
- Table 45: Western Europe More Electric Aircraft Market Comparison by Application (2016-2033)
- Table 46: Western Europe More Electric Aircraft Market Revenue (US$ Mn) Comparison by Country (2016-2033)
- Table 47: Western Europe More Electric Aircraft Market Revenue (US$ Mn) (2016-2033)
- Table 48: Western Europe More Electric Aircraft Market Revenue (US$ Mn) Comparison by Country (2016-2033)
- Table 49: Western Europe More Electric Aircraft Market Revenue (US$ Mn) Comparison by Aircraft Type (2016-2033)
- Table 50: Western Europe More Electric Aircraft Market Revenue (US$ Mn) Comparison by System Type (2016-2033)
- Table 51: Western Europe More Electric Aircraft Market Revenue (US$ Mn) Comparison by Component Type (2016-2033)
- Table 52: Western Europe More Electric Aircraft Market Revenue (US$ Mn) Comparison by Application (2016-2033)
- Table 53: Western Europe More Electric Aircraft Market Y-o-Y Growth Rate Comparison by Country (2016-2033)
- Table 54: Western Europe More Electric Aircraft Market Y-o-Y Growth Rate Comparison by Aircraft Type (2016-2033)
- Table 55: Western Europe More Electric Aircraft Market Y-o-Y Growth Rate Comparison by System Type (2016-2033)
- Table 56: Western Europe More Electric Aircraft Market Y-o-Y Growth Rate Comparison by Component Type (2016-2033)
- Table 57: Western Europe More Electric Aircraft Market Y-o-Y Growth Rate Comparison by Application (2016-2033)
- Table 58: Western Europe More Electric Aircraft Market Share Comparison by Country (2016-2033)
- Table 59: Western Europe More Electric Aircraft Market Share Comparison by Aircraft Type (2016-2033)
- Table 60: Western Europe More Electric Aircraft Market Share Comparison by System Type (2016-2033)
- Table 61: Western Europe More Electric Aircraft Market Share Comparison by Component Type (2016-2033)
- Table 62: Western Europe More Electric Aircraft Market Share Comparison by Application (2016-2033)
- Table 63: Eastern Europe More Electric Aircraft Market Comparison by Aircraft Type (2016-2033)
- Table 64: Eastern Europe More Electric Aircraft Market Comparison by System Type (2016-2033)
- Table 65: Eastern Europe More Electric Aircraft Market Comparison by Component Type (2016-2033)
- Table 66: Eastern Europe More Electric Aircraft Market Comparison by Application (2016-2033)
- Table 67: Eastern Europe More Electric Aircraft Market Revenue (US$ Mn) Comparison by Country (2016-2033)
- Table 68: Eastern Europe More Electric Aircraft Market Revenue (US$ Mn) (2016-2033)
- Table 69: Eastern Europe More Electric Aircraft Market Revenue (US$ Mn) Comparison by Country (2016-2033)
- Table 70: Eastern Europe More Electric Aircraft Market Revenue (US$ Mn) Comparison by Aircraft Type (2016-2033)
- Table 71: Eastern Europe More Electric Aircraft Market Revenue (US$ Mn) Comparison by System Type (2016-2033)
- Table 72: Eastern Europe More Electric Aircraft Market Revenue (US$ Mn) Comparison by Component Type (2016-2033)
- Table 73: Eastern Europe More Electric Aircraft Market Revenue (US$ Mn) Comparison by Application (2016-2033)
- Table 74: Eastern Europe More Electric Aircraft Market Y-o-Y Growth Rate Comparison by Country (2016-2033)
- Table 75: Eastern Europe More Electric Aircraft Market Y-o-Y Growth Rate Comparison by Aircraft Type (2016-2033)
- Table 76: Eastern Europe More Electric Aircraft Market Y-o-Y Growth Rate Comparison by System Type (2016-2033)
- Table 77: Eastern Europe More Electric Aircraft Market Y-o-Y Growth Rate Comparison by Component Type (2016-2033)
- Table 78: Eastern Europe More Electric Aircraft Market Y-o-Y Growth Rate Comparison by Application (2016-2033)
- Table 79: Eastern Europe More Electric Aircraft Market Share Comparison by Country (2016-2033)
- Table 80: Eastern Europe More Electric Aircraft Market Share Comparison by Aircraft Type (2016-2033)
- Table 81: Eastern Europe More Electric Aircraft Market Share Comparison by System Type (2016-2033)
- Table 82: Eastern Europe More Electric Aircraft Market Share Comparison by Component Type (2016-2033)
- Table 83: Eastern Europe More Electric Aircraft Market Share Comparison by Application (2016-2033)
- Table 84: APAC More Electric Aircraft Market Comparison by Aircraft Type (2016-2033)
- Table 85: APAC More Electric Aircraft Market Comparison by System Type (2016-2033)
- Table 86: APAC More Electric Aircraft Market Comparison by Component Type (2016-2033)
- Table 87: APAC More Electric Aircraft Market Comparison by Application (2016-2033)
- Table 88: APAC More Electric Aircraft Market Revenue (US$ Mn) Comparison by Country (2016-2033)
- Table 89: APAC More Electric Aircraft Market Revenue (US$ Mn) (2016-2033)
- Table 90: APAC More Electric Aircraft Market Revenue (US$ Mn) Comparison by Country (2016-2033)
- Table 91: APAC More Electric Aircraft Market Revenue (US$ Mn) Comparison by Aircraft Type (2016-2033)
- Table 92: APAC More Electric Aircraft Market Revenue (US$ Mn) Comparison by System Type (2016-2033)
- Table 93: APAC More Electric Aircraft Market Revenue (US$ Mn) Comparison by Component Type (2016-2033)
- Table 94: APAC More Electric Aircraft Market Revenue (US$ Mn) Comparison by Application (2016-2033)
- Table 95: APAC More Electric Aircraft Market Y-o-Y Growth Rate Comparison by Country (2016-2033)
- Table 96: APAC More Electric Aircraft Market Y-o-Y Growth Rate Comparison by Aircraft Type (2016-2033)
- Table 97: APAC More Electric Aircraft Market Y-o-Y Growth Rate Comparison by System Type (2016-2033)
- Table 98: APAC More Electric Aircraft Market Y-o-Y Growth Rate Comparison by Component Type (2016-2033)
- Table 99: APAC More Electric Aircraft Market Y-o-Y Growth Rate Comparison by Application (2016-2033)
- Table 100: APAC More Electric Aircraft Market Share Comparison by Country (2016-2033)
- Table 101: APAC More Electric Aircraft Market Share Comparison by Aircraft Type (2016-2033)
- Table 102: APAC More Electric Aircraft Market Share Comparison by System Type (2016-2033)
- Table 103: APAC More Electric Aircraft Market Share Comparison by Component Type (2016-2033)
- Table 104: APAC More Electric Aircraft Market Share Comparison by Application (2016-2033)
- Table 105: Latin America More Electric Aircraft Market Comparison by Aircraft Type (2016-2033)
- Table 106: Latin America More Electric Aircraft Market Comparison by System Type (2016-2033)
- Table 107: Latin America More Electric Aircraft Market Comparison by Component Type (2016-2033)
- Table 108: Latin America More Electric Aircraft Market Comparison by Application (2016-2033)
- Table 109: Latin America More Electric Aircraft Market Revenue (US$ Mn) Comparison by Country (2016-2033)
- Table 110: Latin America More Electric Aircraft Market Revenue (US$ Mn) (2016-2033)
- Table 111: Latin America More Electric Aircraft Market Revenue (US$ Mn) Comparison by Country (2016-2033)
- Table 112: Latin America More Electric Aircraft Market Revenue (US$ Mn) Comparison by Aircraft Type (2016-2033)
- Table 113: Latin America More Electric Aircraft Market Revenue (US$ Mn) Comparison by System Type (2016-2033)
- Table 114: Latin America More Electric Aircraft Market Revenue (US$ Mn) Comparison by Component Type (2016-2033)
- Table 115: Latin America More Electric Aircraft Market Revenue (US$ Mn) Comparison by Application (2016-2033)
- Table 116: Latin America More Electric Aircraft Market Y-o-Y Growth Rate Comparison by Country (2016-2033)
- Table 117: Latin America More Electric Aircraft Market Y-o-Y Growth Rate Comparison by Aircraft Type (2016-2033)
- Table 118: Latin America More Electric Aircraft Market Y-o-Y Growth Rate Comparison by System Type (2016-2033)
- Table 119: Latin America More Electric Aircraft Market Y-o-Y Growth Rate Comparison by Component Type (2016-2033)
- Table 120: Latin America More Electric Aircraft Market Y-o-Y Growth Rate Comparison by Application (2016-2033)
- Table 121: Latin America More Electric Aircraft Market Share Comparison by Country (2016-2033)
- Table 122: Latin America More Electric Aircraft Market Share Comparison by Aircraft Type (2016-2033)
- Table 123: Latin America More Electric Aircraft Market Share Comparison by System Type (2016-2033)
- Table 124: Latin America More Electric Aircraft Market Share Comparison by Component Type (2016-2033)
- Table 125: Latin America More Electric Aircraft Market Share Comparison by Application (2016-2033)
- Table 126: Middle East & Africa More Electric Aircraft Market Comparison by Aircraft Type (2016-2033)
- Table 127: Middle East & Africa More Electric Aircraft Market Comparison by System Type (2016-2033)
- Table 128: Middle East & Africa More Electric Aircraft Market Comparison by Component Type (2016-2033)
- Table 129: Middle East & Africa More Electric Aircraft Market Comparison by Application (2016-2033)
- Table 130: Middle East & Africa More Electric Aircraft Market Revenue (US$ Mn) Comparison by Country (2016-2033)
- Table 131: Middle East & Africa More Electric Aircraft Market Revenue (US$ Mn) (2016-2033)
- Table 132: Middle East & Africa More Electric Aircraft Market Revenue (US$ Mn) Comparison by Country (2016-2033)
- Table 133: Middle East & Africa More Electric Aircraft Market Revenue (US$ Mn) Comparison by Aircraft Type (2016-2033)
- Table 134: Middle East & Africa More Electric Aircraft Market Revenue (US$ Mn) Comparison by System Type (2016-2033)
- Table 135: Middle East & Africa More Electric Aircraft Market Revenue (US$ Mn) Comparison by Component Type (2016-2033)
- Table 136: Middle East & Africa More Electric Aircraft Market Revenue (US$ Mn) Comparison by Application (2016-2033)
- Table 137: Middle East & Africa More Electric Aircraft Market Y-o-Y Growth Rate Comparison by Country (2016-2033)
- Table 138: Middle East & Africa More Electric Aircraft Market Y-o-Y Growth Rate Comparison by Aircraft Type (2016-2033)
- Table 139: Middle East & Africa More Electric Aircraft Market Y-o-Y Growth Rate Comparison by System Type (2016-2033)
- Table 140: Middle East & Africa More Electric Aircraft Market Y-o-Y Growth Rate Comparison by Component Type (2016-2033)
- Table 141: Middle East & Africa More Electric Aircraft Market Y-o-Y Growth Rate Comparison by Application (2016-2033)
- Table 142: Middle East & Africa More Electric Aircraft Market Share Comparison by Country (2016-2033)
- Table 143: Middle East & Africa More Electric Aircraft Market Share Comparison by Aircraft Type (2016-2033)
- Table 144: Middle East & Africa More Electric Aircraft Market Share Comparison by System Type (2016-2033)
- Table 145: Middle East & Africa More Electric Aircraft Market Share Comparison by Component Type (2016-2033)
- Table 146: Middle East & Africa More Electric Aircraft Market Share Comparison by Application (2016-2033)
- 1. Executive Summary
-
- Cargill, Incorporated
- Vita Coco
- KLF Nirmal Industries Pvt. Ltd.
- Marico Limited
- Bunge Limited
- Groupe Danone S.A.
- PepsiCo, Inc.
- The Coca-Cola Company
- Kerry Group plc
- Nestlé S.A.
- Hain Celestial Group, Inc.
- Theppadungporn Coconut Co., Ltd.
- Celebes Coconut Corporation
- SC Global Coco Products, Inc.
- PT. Sambu Group
Our Clients


View Our Licence Options
