
CNG Powertrain Market By Drive Type(All-wheel Drive, Rear Wheel Drive, Front Wheel Drive), By Fuel Type(Mono Fuel, Bi-fuel), By Vehicle Type(Passenger Vehicle, Commercial Vehicle), By Region And Companies - Industry Segment Outlook, Market Assessment, Competition Scenario, Trends, And Forecast 2023-2032
-
42416
-
Feb 2022
-
173
-


-
This report was compiled by Kalyani Khudsange Kalyani Khudsange is a Research Analyst at Prudour Pvt. Ltd. with 2.5 years of experience in market research and a strong technical background in Chemical Engineering and manufacturing. Correspondence Sr. Research Analyst Linkedin | Detailed Market research Methodology Our methodology involves a mix of primary research, including interviews with leading mental health experts, and secondary research from reputable medical journals and databases. View Detailed Methodology Page
-
Quick Navigation
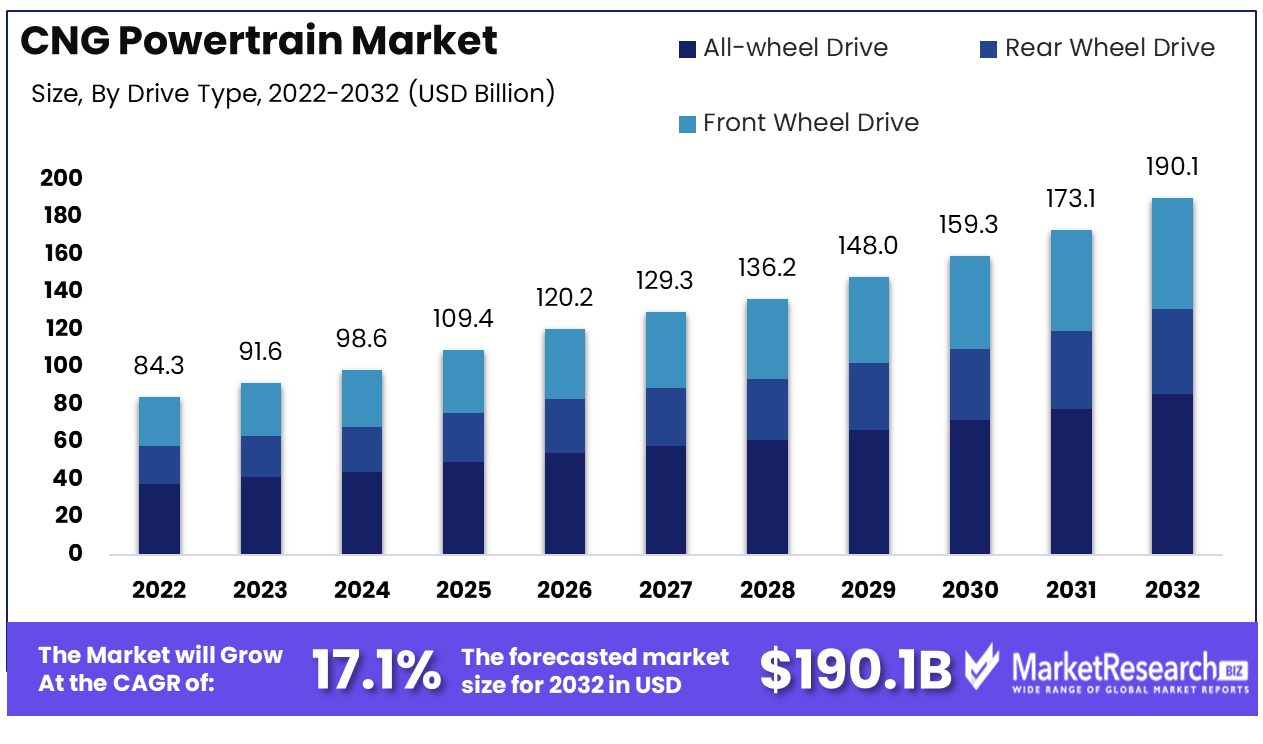
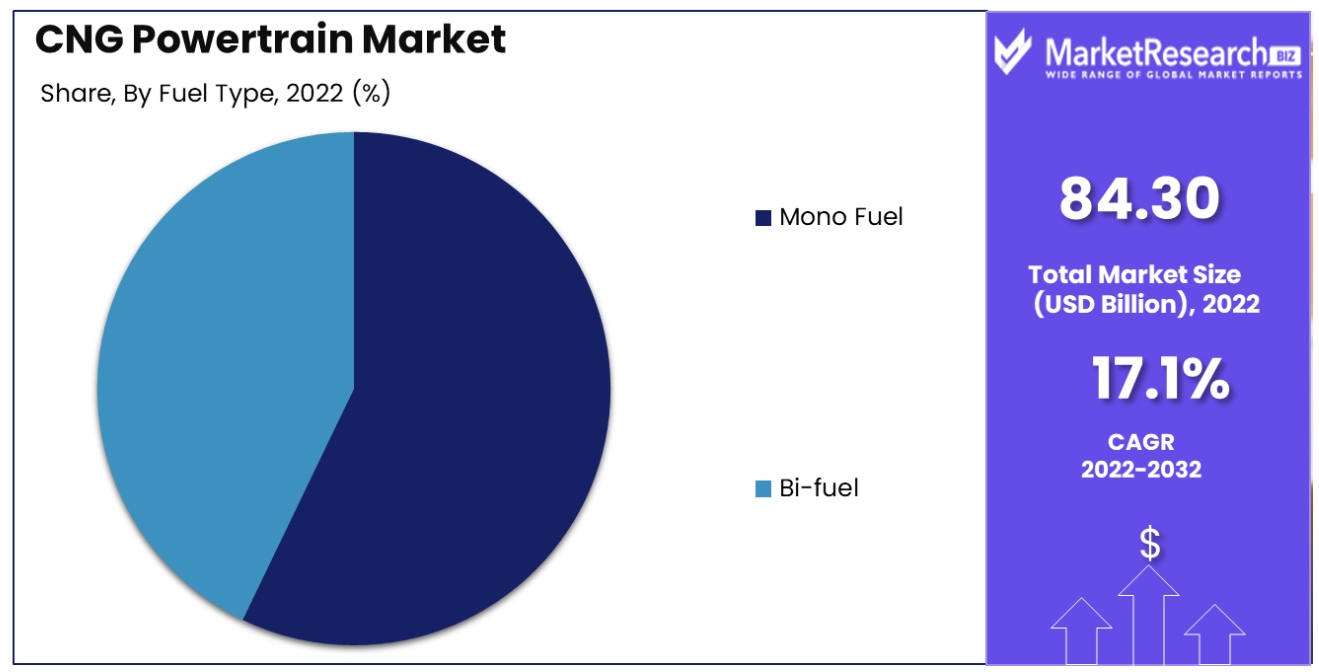
CNG Powertrain Market size is predicted to reach approximately USD 190.1Bn by 2032, from a valuation of USD 84.30 Bn in 2022, growing at a CAGR of 17.1% during the forecast period from 2023 to 2032.
CNG (compressed natural gas) powertrain technology is increasingly being used in vehicles as an alternative to traditional gasoline or diesel engines. It consists of a CNG fuel system that delivers CNG from storage tanks to the engine. CNG engines can either be specifically designed to run on this gaseous fuel source, or modified using a conversion kit to allow combustion of it.
CNG powertrains are growing increasingly popular as they produce far fewer emissions compared to gasoline or diesel. Fleets with central refueling infrastructure, like buses, refuse trucks, and delivery vehicles, are finding the most use from CNG technology as they are refueling from a central location regularly. Using CNG allows these high-mileage fleets to reduce emissions and take advantage of a lower-cost fuel.
The CNG Powertrain Market is expected to experience significant growth in the coming years driven by several key factors. One major driver is the push towards lower emissions and more environmentally friendly vehicles.
Compressed natural gas (CNG) vehicles offer lower greenhouse gas emissions compared to conventional gasoline or diesel vehicles. This helps to meet government regulations in Europe and Asia that mandate lower emissions with higher fuel economy. This has driven the adoption of CNG vehicles and growth for the CNG Powertrain Market.
Maruti Suzuki has launched the S-CNG powertrain option for the Fronx in India. The company has focused on CNG powertrains, moving away from diesel engines. The CNG variant comes equipped with a five-speed manual gearbox. Maruti Suzuki's launch marks part of its plan to provide CNG vehicles to Indian consumers.
Cummins Inc. has introduced a new heavy-duty powertrain for natural gas customers, featuring the ISX12N+Endurant HD N powertrain from its Integrated power portfolio. This integrated natural gas powertrain, combining the ISX12N near-zero natural gas engine with the Endurant HD N 12-speed automated transmission, is aimed at heavy-duty regional haul fleets seeking to reduce emissions and enhance sustainability.
Another major factor is the abundant supply and lower cost of natural gas, especially in regions like North America. Natural gas is domestically produced in many countries and provides an affordable alternative fuel.
Fleets and consumers are incentivized to switch to CNG vehicles due to the cost savings over gasoline and diesel. As more refueling infrastructure is built to support CNG vehicles, adoption rates should increase, benefiting the CNG Powertrain Market.
Overall, environmental regulations, abundant natural gas supplies, infrastructure development, and cost savings are providing growth momentum for the CNG Powertrain Market globally. If these trends continue as expected, the CNG Powertrain Market is poised for solid expansion over the coming decade.
Driving Factors
Cost Efficiency Boosts CNG Powertrain Adoption
CNG powertrains are increasingly popular due to their lower running costs compared to traditional fuel options. For consumers and businesses alike, the economic benefits of using CNG, such as lower fuel prices and reduced maintenance costs, make it an attractive alternative. This cost efficiency is driving the adoption of CNG vehicles, particularly in sectors where cost savings are a priority.
The trend towards CNG powertrains is reinforced by the growing awareness of their economic advantages, suggesting a market shift towards more cost-effective fuel solutions. As fuel prices continue to fluctuate, the appeal of CNG as a more stable and affordable option is likely to drive further growth in the CNG powertrain market.
Abundant Natural Gas Resources Propel Market Growth
The availability of abundant natural gas resources significantly contributes to the growth of the CNG powertrain market. This abundant supply ensures a consistent and cost-effective fuel source, making CNG a viable long-term solution for transportation needs.
The reliability of natural gas as a fuel source not only provides stability to the market but also encourages investment and development in CNG infrastructure and technology. As natural gas continues to be an accessible resource, its role in powering CNG vehicles will likely remain a key driver for the expansion of the CNG powertrain market, offering an environmentally and economically viable alternative to traditional fuels.
Advancements in CNG Technology Enhance Market Appeal
Ongoing advancements in CNG powertrain technology are improving the efficiency and performance of CNG vehicles, making them more appealing to both consumers and businesses. These technological improvements include enhanced fuel storage systems, optimized engine performance, and increased range.
As CNG vehicles become more efficient and comparable in performance to their gasoline counterparts, consumer hesitation towards adopting CNG technology is diminishing. This evolution in technology is not only addressing previous limitations of CNG vehicles but is also setting the stage for a more competitive market. The continuous enhancement of CNG powertrain technology suggests a future where CNG vehicles are a mainstream option, driven by their improved efficiency, performance, and environmental benefits.
Restraining Factors
Market Consolidation Restrains CNG Powertrain Market Growth
The consolidation of the Compressed Natural Gas (CNG) powertrain market, dominated by a few key players, creates challenges in standardization and widespread implementation. This market concentration can lead to a lack of diversity in product offerings and innovation, as a few companies control the market trends and technological advancements.
The dominance of these major players may also hinder the entry of new competitors, potentially stifling innovation and market expansion. Additionally, the standardization of CNG powertrain technology across different regions becomes challenging when controlled by a limited number of companies, impacting the global adoption and integration of CNG technologies in the automotive sector.
Shift Towards Electric Vehicles Challenges CNG Powertrain Market Growth
The growing trend and shift towards electric vehicles (EVs) present a significant challenge to the CNG powertrain market. As the automotive industry increasingly focuses on electric mobility, driven by environmental concerns and governmental policies promoting sustainable transportation, EVs are gaining prominence. In the CNG Powertrain Market, Net Zero Solutions pioneers eco-friendly innovations, significantly reducing carbon footprints and enhancing efficiency.
This shift diverts both consumer interest and investment away from CNG vehicles to electric alternatives. The burgeoning EV market, with its advancements in battery technology and charging infrastructure, is becoming more appealing to consumers and manufacturers alike. This transition poses a competitive threat to the CNG powertrain market, potentially limiting its growth as the industry gravitates towards electrification.
CNG Powertrain Market Segmentation Analysis
Drive Type
All-wheel drive (AWD) systems dominate the CNG powertrain market. This preference stems from their enhanced stability, traction, and performance, especially under varied and challenging driving conditions. AWD systems distribute power to all four wheels, providing better handling and safety, which is particularly advantageous for vehicles operating in regions with adverse weather conditions. The growing consumer demand for vehicles equipped with AWD for improved driving dynamics, combined with the environmental benefits of CNG, significantly contributes to this segment's growth.
Rear-wheel drive (RWD) and front-wheel drive (FWD) systems are also prevalent in the CNG powertrain market, each offering specific advantages like cost-effectiveness (FWD) and better power distribution for heavy loads (RWD). However, they don’t match the all-terrain versatility of AWD systems.
Fuel Type
Mono-fuel CNG powertrains, using exclusively CNG as a fuel source, lead this segment. Their dominance is attributed to the increasing shift towards cleaner fuel alternatives due to environmental concerns and stringent emission regulations. Mono-fuel CNG vehicles offer reduced emissions compared to traditional gasoline or diesel engines, making them a preferred choice for eco-conscious consumers and in regions with strict environmental policies.
Bi-fuel CNG powertrains, which can alternate between CNG and another fuel type, provide flexibility and are beneficial in areas where CNG refueling infrastructure is limited. However, they are secondary to mono-fuel systems in market share. As advancements in bi-fuel technology continue, addressing concerns related to infrastructure and range, their market presence is expected to grow, especially in regions transitioning to a diverse and multi-fuel transportation landscape.
Vehicle Type
Passenger vehicles represent the largest segment in the CNG powertrain market. This dominance is fueled by the increasing demand for personal vehicles with lower emissions and operational costs. The rising consumer awareness of environmental issues and the economic benefits of CNG vehicles, coupled with improving CNG distribution infrastructure, are key drivers for this segment’s growth.
Commercial vehicles, including buses and trucks, also significantly contribute to the CNG powertrain market, particularly in public transportation and logistics. However, their market share is smaller compared to passenger vehicles. The adoption of CNG powertrains in commercial fleets is gaining traction, driven by cost savings, government incentives, and the positive environmental impact associated with reduced emissions in high-mileage applications.
CNG Powertrain Industry Key Segments
By Drive Type
- All-wheel Drive
- Rear Wheel Drive
- Front Wheel Drive
By Fuel Type
- Mono Fuel
- Bi-fuel
By Vehicle Type
- Passenger Vehicle
- Commercial Vehicle
CNG Powertrain Market Growth Opportunities
Growing Demand for Transitional Fuels Positions CNG as Principal Energy Source in Net-Zero Drive
The escalating demand for alternative transitional fuels, in pursuit of achieving net-zero carbon emissions, positions Compressed Natural Gas (CNG) as a principal energy source in the powertrain market. CNG, being cleaner and more environmentally friendly compared to traditional fossil fuels, aligns with global initiatives for reducing carbon footprints.
This growing environmental awareness and regulatory push for greener fuels are significantly driving the adoption of CNG vehicles. Recent trends indicate an increasing preference for CNG as a transitional fuel, suggesting a substantial market expansion potential as nations and industries work towards their carbon neutrality goals.
Engine Efficiency Enhancements in CNG Vehicles Fuel Market Expansion
Manufacturers' focus on increasing engine efficiency, particularly through advancements like superior CNG (s-CNG) technology in passenger vehicles, is a key factor driving market growth. These technological enhancements aim to improve fuel economy and overall vehicle performance.
The development of more efficient CNG engines, offering better mileage and reduced emissions, caters to the growing consumer demand for performance-oriented yet eco-friendly vehicles. The ongoing innovations in CNG technology, enhancing engine efficiency, are not only elevating the appeal of CNG vehicles but also significantly contributing to the expansion of the CNG powertrain market.
CNG Powertrain Market Regional Analysis
Asia-Pacific Dominates with 38.90% Market Share
Asia-Pacific's significant 38.90% share in the global CNG Powertrain Market is driven by the region's increasing focus on reducing carbon emissions and improving air quality. Countries like China and India, facing severe air pollution challenges, are actively promoting the use of cleaner fuels like Compressed Natural Gas (CNG).
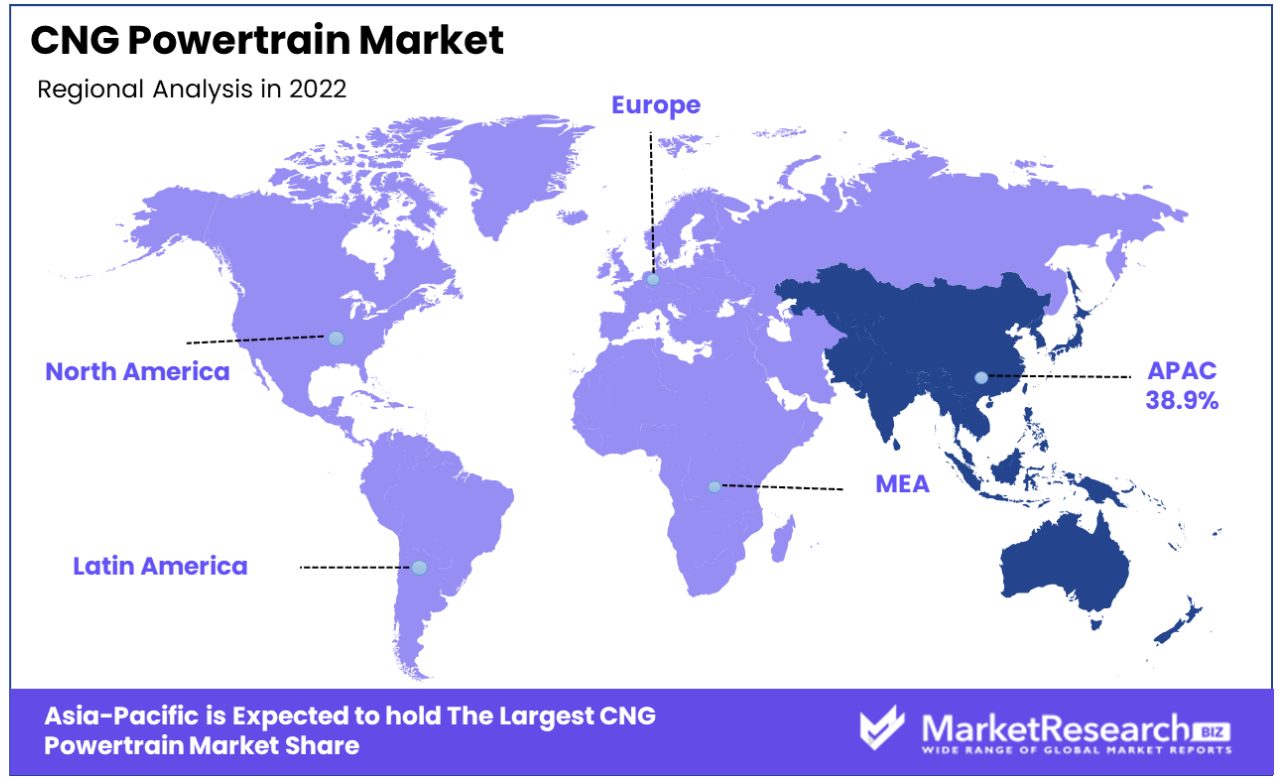
The region's large automotive market, coupled with governmental incentives and stringent emission regulations, significantly contributes to the adoption of CNG powertrains. Additionally, the abundant availability of natural gas in several Asia-Pacific countries provides a cost-effective and sustainable fuel alternative, bolstering the market growth.
The market dynamics in Asia-Pacific are characterized by the increasing development and production of CNG vehicles by local and international automakers. The region’s growing infrastructure for CNG refueling stations and the rising demand for cost-effective and efficient transportation solutions further enhance market prospects. Furthermore, the shift in consumer preference towards eco-friendly vehicles, supported by governmental policies and subsidies, plays a crucial role in driving the CNG powertrain market in the region.
Europe's Strong Commitment to Emission Reduction
Europe’s CNG powertrain market is driven by the region's strong commitment to reducing greenhouse gas emissions and promoting sustainable mobility solutions. The European Union’s stringent emission standards and supportive policies for alternative fuels like CNG encourage the adoption of CNG vehicles. The growing network of CNG refueling stations and the focus on energy diversification contribute to the market's growth in Europe.
North America's Growing Environmental Awareness and Market Potential
In North America, the CNG powertrain market is expanding, driven by growing environmental awareness and the need for emission reduction in the transportation sector. The United States and Canada have significant natural gas reserves, providing a solid foundation for the CNG market. The region’s developing infrastructure for CNG refueling and the increasing interest in alternative fuel vehicles present significant growth potential for the CNG powertrain market.
CNG Powertrain Industry By Region
North America
- The US
- Canada
Europe
- Germany
- France
- The UK
- Spain
- Italy
- Russia
- Netherlands
- Rest of Europe
Asia-Pacific
- China
- Japan
- South Korea
- India
- New Zealand
- Singapore
- Thailand
- Vietnam
- Rest of Asia Pacific
Latin America
- Brazil
- Mexico
- Rest of Latin America
Middle East & Africa
- South Africa
- Saudi Arabia
- UAE
- Rest of the Middle East & Africa
CNG Powertrain Market Key Player Analysis
In the CNG Powertrain Market, a sector increasingly important for sustainable transportation solutions, the companies listed are pivotal players shaping its future. Cummins Inc. and AB Volvo, with their extensive experience in heavy-duty powertrain systems, lead in the development and supply of CNG engines and components, emphasizing the market's shift towards cleaner, alternative fuel technologies for commercial vehicles.
Robert Bosch GmbH and FPT Industrial S.P.A., renowned for their engineering expertise and technological innovations, play crucial roles in advancing CNG powertrain efficiency and performance, catering to both commercial and passenger vehicles. Ford Motor Company and General Motors, as major automotive manufacturers, contribute to the market by integrating CNG systems into their vehicle lineups, demonstrating the growing acceptance of CNG as a viable alternative to traditional fuels in the consumer market.
Maruti Suzuki and Hyundai, with significant market shares in regions with high CNG vehicle adoption, underscore the importance of catering to local market needs and regulatory environments. Their strategies reflect the industry's adaptability to different geographic demands and fuel infrastructure.
Honda, known for its commitment to environmentally friendly technologies, has been instrumental in developing CNG-compatible passenger vehicles, catering to a growing segment of eco-conscious consumers. Iveco and Volvo, focusing on commercial vehicles, highlight the market's emphasis on heavy-duty applications where CNG powertrains offer a significant advantage in terms of emissions and fuel efficiency.
Collectively, these companies not only drive innovation in the CNG Powertrain Market but also represent a spectrum of strategies, from advancing engine technology to adapting vehicle designs, crucial for the adoption and expansion of CNG as a sustainable fuel alternative in the automotive industry.
Key Players
- Google LLC
- IBM Corp
- Microsoft Corporation
- Hyundai Motor Company
- Intel Corporation
- Siemens AG
- General Electric Company
- Cisco Systems, Inc.
- Oracle Corporation
- NVIDIA Corporation
- Accenture plc
- Honda Motor Company
Recent Development
May 2023 - Shell Plc would utilize the AI-based technology of big-data analytics company SparkCognition in its deep sea exploration and production to boost offshore oil output. According to this partnership, SparkCognition's artificial intelligence (AI) algorithms would process and evaluate a significant amount of seismic data for Shell's search for new oil reservoirs.
May 2023 - UNIST, a national university of South Korea, has announced a strategic partnership with ADNOC, the largest oil company in the UAE, to take the lead in the global digital carbon-neutral market. This partnership intends to lead the development of a decarbonization optimization system for large-scale oil refining and petrochemical processes by utilizing the power of artificial intelligence.
-
- 1. Executive Summary
- 1.1. Definition
- 1.2. Taxonomy
- 1.3. Research Scope
- 1.4. Key Analysis
- 1.5. Key Findings by Major Segments
- 1.6. Top strategies by Major Players
- 2. Global CNG Powertrain Market Overview
- 2.1. CNG Powertrain Market Dynamics
- 2.1.1. Drivers
- 2.1.2. Opportunities
- 2.1.3. Restraints
- 2.1.4. Challenges
- 2.2. Macro-economic Factors
- 2.3. Regulatory Framework
- 2.4. Market Investment Feasibility Index
- 2.5. PEST Analysis
- 2.6. PORTER’S Five Force Analysis
- 2.7. Drivers & Restraints Impact Analysis
- 2.8. Industry Chain Analysis
- 2.9. Cost Structure Analysis
- 2.10. Marketing Strategy
- 2.11. Russia-Ukraine War Impact Analysis
- 2.12. Opportunity Map Analysis
- 2.13. Market Competition Scenario Analysis
- 2.14. Product Life Cycle Analysis
- 2.15. Opportunity Orbits
- 2.16. Manufacturer Intensity Map
- 2.17. Major Companies sales by Value & Volume
- 2.1. CNG Powertrain Market Dynamics
- 3. Global CNG Powertrain Market Analysis, Opportunity and Forecast, 2016-2032
- 3.1. Global CNG Powertrain Market Analysis, 2016-2021
- 3.2. Global CNG Powertrain Market Opportunity and Forecast, 2023-2032
- 3.3. Global CNG Powertrain Market Analysis, Opportunity and Forecast, By By Drive Type, 2016-2032
- 3.3.1. Global CNG Powertrain Market Analysis by By Drive Type: Introduction
- 3.3.2. Market Size Absolute $ Opportunity Analysis and Forecast, By By Drive Type, 2016-2032
- 3.3.3. All-wheel Drive
- 3.3.4. Rear Wheel Drive
- 3.3.5. Front Wheel Drive
- 3.4. Global CNG Powertrain Market Analysis, Opportunity and Forecast, By By Fuel Type, 2016-2032
- 3.4.1. Global CNG Powertrain Market Analysis by By Fuel Type: Introduction
- 3.4.2. Market Size Absolute $ Opportunity Analysis and Forecast, By By Fuel Type, 2016-2032
- 3.4.3. Mono Fuel
- 3.4.4. Bi-fuel
- 3.5. Global CNG Powertrain Market Analysis, Opportunity and Forecast, By By Vehicle Type, 2016-2032
- 3.5.1. Global CNG Powertrain Market Analysis by By Vehicle Type: Introduction
- 3.5.2. Market Size Absolute $ Opportunity Analysis and Forecast, By By Vehicle Type, 2016-2032
- 3.5.3. Passenger Vehicle
- 3.5.4. Commercial Vehicle
- 4. North America CNG Powertrain Market Analysis, Opportunity and Forecast, 2016-2032
- 4.1. North America CNG Powertrain Market Analysis, 2016-2021
- 4.2. North America CNG Powertrain Market Opportunity and Forecast, 2023-2032
- 4.3. North America CNG Powertrain Market Analysis, Opportunity and Forecast, By By Drive Type, 2016-2032
- 4.3.1. North America CNG Powertrain Market Analysis by By Drive Type: Introduction
- 4.3.2. Market Size Absolute $ Opportunity Analysis and Forecast, By By Drive Type, 2016-2032
- 4.3.3. All-wheel Drive
- 4.3.4. Rear Wheel Drive
- 4.3.5. Front Wheel Drive
- 4.4. North America CNG Powertrain Market Analysis, Opportunity and Forecast, By By Fuel Type, 2016-2032
- 4.4.1. North America CNG Powertrain Market Analysis by By Fuel Type: Introduction
- 4.4.2. Market Size Absolute $ Opportunity Analysis and Forecast, By By Fuel Type, 2016-2032
- 4.4.3. Mono Fuel
- 4.4.4. Bi-fuel
- 4.5. North America CNG Powertrain Market Analysis, Opportunity and Forecast, By By Vehicle Type, 2016-2032
- 4.5.1. North America CNG Powertrain Market Analysis by By Vehicle Type: Introduction
- 4.5.2. Market Size Absolute $ Opportunity Analysis and Forecast, By By Vehicle Type, 2016-2032
- 4.5.3. Passenger Vehicle
- 4.5.4. Commercial Vehicle
- 4.6. North America CNG Powertrain Market Analysis, Opportunity and Forecast, By Country , 2016-2032
- 4.6.1. North America CNG Powertrain Market Analysis by Country : Introduction
- 4.6.2. Market Size Absolute $ Opportunity Analysis and Forecast, Country , 2016-2032
- 4.6.2.1. The US
- 4.6.2.2. Canada
- 4.6.2.3. Mexico
- 5. Western Europe CNG Powertrain Market Analysis, Opportunity and Forecast, 2016-2032
- 5.1. Western Europe CNG Powertrain Market Analysis, 2016-2021
- 5.2. Western Europe CNG Powertrain Market Opportunity and Forecast, 2023-2032
- 5.3. Western Europe CNG Powertrain Market Analysis, Opportunity and Forecast, By By Drive Type, 2016-2032
- 5.3.1. Western Europe CNG Powertrain Market Analysis by By Drive Type: Introduction
- 5.3.2. Market Size Absolute $ Opportunity Analysis and Forecast, By By Drive Type, 2016-2032
- 5.3.3. All-wheel Drive
- 5.3.4. Rear Wheel Drive
- 5.3.5. Front Wheel Drive
- 5.4. Western Europe CNG Powertrain Market Analysis, Opportunity and Forecast, By By Fuel Type, 2016-2032
- 5.4.1. Western Europe CNG Powertrain Market Analysis by By Fuel Type: Introduction
- 5.4.2. Market Size Absolute $ Opportunity Analysis and Forecast, By By Fuel Type, 2016-2032
- 5.4.3. Mono Fuel
- 5.4.4. Bi-fuel
- 5.5. Western Europe CNG Powertrain Market Analysis, Opportunity and Forecast, By By Vehicle Type, 2016-2032
- 5.5.1. Western Europe CNG Powertrain Market Analysis by By Vehicle Type: Introduction
- 5.5.2. Market Size Absolute $ Opportunity Analysis and Forecast, By By Vehicle Type, 2016-2032
- 5.5.3. Passenger Vehicle
- 5.5.4. Commercial Vehicle
- 5.6. Western Europe CNG Powertrain Market Analysis, Opportunity and Forecast, By Country , 2016-2032
- 5.6.1. Western Europe CNG Powertrain Market Analysis by Country : Introduction
- 5.6.2. Market Size Absolute $ Opportunity Analysis and Forecast, Country , 2016-2032
- 5.6.2.1. Germany
- 5.6.2.2. France
- 5.6.2.3. The UK
- 5.6.2.4. Spain
- 5.6.2.5. Italy
- 5.6.2.6. Portugal
- 5.6.2.7. Ireland
- 5.6.2.8. Austria
- 5.6.2.9. Switzerland
- 5.6.2.10. Benelux
- 5.6.2.11. Nordic
- 5.6.2.12. Rest of Western Europe
- 6. Eastern Europe CNG Powertrain Market Analysis, Opportunity and Forecast, 2016-2032
- 6.1. Eastern Europe CNG Powertrain Market Analysis, 2016-2021
- 6.2. Eastern Europe CNG Powertrain Market Opportunity and Forecast, 2023-2032
- 6.3. Eastern Europe CNG Powertrain Market Analysis, Opportunity and Forecast, By By Drive Type, 2016-2032
- 6.3.1. Eastern Europe CNG Powertrain Market Analysis by By Drive Type: Introduction
- 6.3.2. Market Size Absolute $ Opportunity Analysis and Forecast, By By Drive Type, 2016-2032
- 6.3.3. All-wheel Drive
- 6.3.4. Rear Wheel Drive
- 6.3.5. Front Wheel Drive
- 6.4. Eastern Europe CNG Powertrain Market Analysis, Opportunity and Forecast, By By Fuel Type, 2016-2032
- 6.4.1. Eastern Europe CNG Powertrain Market Analysis by By Fuel Type: Introduction
- 6.4.2. Market Size Absolute $ Opportunity Analysis and Forecast, By By Fuel Type, 2016-2032
- 6.4.3. Mono Fuel
- 6.4.4. Bi-fuel
- 6.5. Eastern Europe CNG Powertrain Market Analysis, Opportunity and Forecast, By By Vehicle Type, 2016-2032
- 6.5.1. Eastern Europe CNG Powertrain Market Analysis by By Vehicle Type: Introduction
- 6.5.2. Market Size Absolute $ Opportunity Analysis and Forecast, By By Vehicle Type, 2016-2032
- 6.5.3. Passenger Vehicle
- 6.5.4. Commercial Vehicle
- 6.6. Eastern Europe CNG Powertrain Market Analysis, Opportunity and Forecast, By Country , 2016-2032
- 6.6.1. Eastern Europe CNG Powertrain Market Analysis by Country : Introduction
- 6.6.2. Market Size Absolute $ Opportunity Analysis and Forecast, Country , 2016-2032
- 6.6.2.1. Russia
- 6.6.2.2. Poland
- 6.6.2.3. The Czech Republic
- 6.6.2.4. Greece
- 6.6.2.5. Rest of Eastern Europe
- 7. APAC CNG Powertrain Market Analysis, Opportunity and Forecast, 2016-2032
- 7.1. APAC CNG Powertrain Market Analysis, 2016-2021
- 7.2. APAC CNG Powertrain Market Opportunity and Forecast, 2023-2032
- 7.3. APAC CNG Powertrain Market Analysis, Opportunity and Forecast, By By Drive Type, 2016-2032
- 7.3.1. APAC CNG Powertrain Market Analysis by By Drive Type: Introduction
- 7.3.2. Market Size Absolute $ Opportunity Analysis and Forecast, By By Drive Type, 2016-2032
- 7.3.3. All-wheel Drive
- 7.3.4. Rear Wheel Drive
- 7.3.5. Front Wheel Drive
- 7.4. APAC CNG Powertrain Market Analysis, Opportunity and Forecast, By By Fuel Type, 2016-2032
- 7.4.1. APAC CNG Powertrain Market Analysis by By Fuel Type: Introduction
- 7.4.2. Market Size Absolute $ Opportunity Analysis and Forecast, By By Fuel Type, 2016-2032
- 7.4.3. Mono Fuel
- 7.4.4. Bi-fuel
- 7.5. APAC CNG Powertrain Market Analysis, Opportunity and Forecast, By By Vehicle Type, 2016-2032
- 7.5.1. APAC CNG Powertrain Market Analysis by By Vehicle Type: Introduction
- 7.5.2. Market Size Absolute $ Opportunity Analysis and Forecast, By By Vehicle Type, 2016-2032
- 7.5.3. Passenger Vehicle
- 7.5.4. Commercial Vehicle
- 7.6. APAC CNG Powertrain Market Analysis, Opportunity and Forecast, By Country , 2016-2032
- 7.6.1. APAC CNG Powertrain Market Analysis by Country : Introduction
- 7.6.2. Market Size Absolute $ Opportunity Analysis and Forecast, Country , 2016-2032
- 7.6.2.1. China
- 7.6.2.2. Japan
- 7.6.2.3. South Korea
- 7.6.2.4. India
- 7.6.2.5. Australia & New Zeland
- 7.6.2.6. Indonesia
- 7.6.2.7. Malaysia
- 7.6.2.8. Philippines
- 7.6.2.9. Singapore
- 7.6.2.10. Thailand
- 7.6.2.11. Vietnam
- 7.6.2.12. Rest of APAC
- 8. Latin America CNG Powertrain Market Analysis, Opportunity and Forecast, 2016-2032
- 8.1. Latin America CNG Powertrain Market Analysis, 2016-2021
- 8.2. Latin America CNG Powertrain Market Opportunity and Forecast, 2023-2032
- 8.3. Latin America CNG Powertrain Market Analysis, Opportunity and Forecast, By By Drive Type, 2016-2032
- 8.3.1. Latin America CNG Powertrain Market Analysis by By Drive Type: Introduction
- 8.3.2. Market Size Absolute $ Opportunity Analysis and Forecast, By By Drive Type, 2016-2032
- 8.3.3. All-wheel Drive
- 8.3.4. Rear Wheel Drive
- 8.3.5. Front Wheel Drive
- 8.4. Latin America CNG Powertrain Market Analysis, Opportunity and Forecast, By By Fuel Type, 2016-2032
- 8.4.1. Latin America CNG Powertrain Market Analysis by By Fuel Type: Introduction
- 8.4.2. Market Size Absolute $ Opportunity Analysis and Forecast, By By Fuel Type, 2016-2032
- 8.4.3. Mono Fuel
- 8.4.4. Bi-fuel
- 8.5. Latin America CNG Powertrain Market Analysis, Opportunity and Forecast, By By Vehicle Type, 2016-2032
- 8.5.1. Latin America CNG Powertrain Market Analysis by By Vehicle Type: Introduction
- 8.5.2. Market Size Absolute $ Opportunity Analysis and Forecast, By By Vehicle Type, 2016-2032
- 8.5.3. Passenger Vehicle
- 8.5.4. Commercial Vehicle
- 8.6. Latin America CNG Powertrain Market Analysis, Opportunity and Forecast, By Country , 2016-2032
- 8.6.1. Latin America CNG Powertrain Market Analysis by Country : Introduction
- 8.6.2. Market Size Absolute $ Opportunity Analysis and Forecast, Country , 2016-2032
- 8.6.2.1. Brazil
- 8.6.2.2. Colombia
- 8.6.2.3. Chile
- 8.6.2.4. Argentina
- 8.6.2.5. Costa Rica
- 8.6.2.6. Rest of Latin America
- 9. Middle East & Africa CNG Powertrain Market Analysis, Opportunity and Forecast, 2016-2032
- 9.1. Middle East & Africa CNG Powertrain Market Analysis, 2016-2021
- 9.2. Middle East & Africa CNG Powertrain Market Opportunity and Forecast, 2023-2032
- 9.3. Middle East & Africa CNG Powertrain Market Analysis, Opportunity and Forecast, By By Drive Type, 2016-2032
- 9.3.1. Middle East & Africa CNG Powertrain Market Analysis by By Drive Type: Introduction
- 9.3.2. Market Size Absolute $ Opportunity Analysis and Forecast, By By Drive Type, 2016-2032
- 9.3.3. All-wheel Drive
- 9.3.4. Rear Wheel Drive
- 9.3.5. Front Wheel Drive
- 9.4. Middle East & Africa CNG Powertrain Market Analysis, Opportunity and Forecast, By By Fuel Type, 2016-2032
- 9.4.1. Middle East & Africa CNG Powertrain Market Analysis by By Fuel Type: Introduction
- 9.4.2. Market Size Absolute $ Opportunity Analysis and Forecast, By By Fuel Type, 2016-2032
- 9.4.3. Mono Fuel
- 9.4.4. Bi-fuel
- 9.5. Middle East & Africa CNG Powertrain Market Analysis, Opportunity and Forecast, By By Vehicle Type, 2016-2032
- 9.5.1. Middle East & Africa CNG Powertrain Market Analysis by By Vehicle Type: Introduction
- 9.5.2. Market Size Absolute $ Opportunity Analysis and Forecast, By By Vehicle Type, 2016-2032
- 9.5.3. Passenger Vehicle
- 9.5.4. Commercial Vehicle
- 9.6. Middle East & Africa CNG Powertrain Market Analysis, Opportunity and Forecast, By Country , 2016-2032
- 9.6.1. Middle East & Africa CNG Powertrain Market Analysis by Country : Introduction
- 9.6.2. Market Size Absolute $ Opportunity Analysis and Forecast, Country , 2016-2032
- 9.6.2.1. Algeria
- 9.6.2.2. Egypt
- 9.6.2.3. Israel
- 9.6.2.4. Kuwait
- 9.6.2.5. Nigeria
- 9.6.2.6. Saudi Arabia
- 9.6.2.7. South Africa
- 9.6.2.8. Turkey
- 9.6.2.9. The UAE
- 9.6.2.10. Rest of MEA
- 10. Global CNG Powertrain Market Analysis, Opportunity and Forecast, By Region , 2016-2032
- 10.1. Global CNG Powertrain Market Analysis by Region : Introduction
- 10.2. Market Size Absolute $ Opportunity Analysis and Forecast, By Region , 2016-2032
- 10.2.1. North America
- 10.2.2. Western Europe
- 10.2.3. Eastern Europe
- 10.2.4. APAC
- 10.2.5. Latin America
- 10.2.6. Middle East & Africa
- 11. Global CNG Powertrain Market Competitive Landscape, Market Share Analysis, and Company Profiles
- 11.1. Market Share Analysis
- 11.2. Company Profiles
- 11.3. Google LLC
- 11.3.1. Company Overview
- 11.3.2. Financial Highlights
- 11.3.3. Product Portfolio
- 11.3.4. SWOT Analysis
- 11.3.5. Key Strategies and Developments
- 11.4. IBM Corp
- 11.4.1. Company Overview
- 11.4.2. Financial Highlights
- 11.4.3. Product Portfolio
- 11.4.4. SWOT Analysis
- 11.4.5. Key Strategies and Developments
- 11.5. Microsoft Corporation
- 11.5.1. Company Overview
- 11.5.2. Financial Highlights
- 11.5.3. Product Portfolio
- 11.5.4. SWOT Analysis
- 11.5.5. Key Strategies and Developments
- 11.6. Hyundai Motor Company
- 11.6.1. Company Overview
- 11.6.2. Financial Highlights
- 11.6.3. Product Portfolio
- 11.6.4. SWOT Analysis
- 11.6.5. Key Strategies and Developments
- 11.7. Intel Corporation
- 11.7.1. Company Overview
- 11.7.2. Financial Highlights
- 11.7.3. Product Portfolio
- 11.7.4. SWOT Analysis
- 11.7.5. Key Strategies and Developments
- 11.8. Siemens AG
- 11.8.1. Company Overview
- 11.8.2. Financial Highlights
- 11.8.3. Product Portfolio
- 11.8.4. SWOT Analysis
- 11.8.5. Key Strategies and Developments
- 11.9. General Electric Company
- 11.9.1. Company Overview
- 11.9.2. Financial Highlights
- 11.9.3. Product Portfolio
- 11.9.4. SWOT Analysis
- 11.9.5. Key Strategies and Developments
- 11.10. Cisco Systems, Inc.
- 11.10.1. Company Overview
- 11.10.2. Financial Highlights
- 11.10.3. Product Portfolio
- 11.10.4. SWOT Analysis
- 11.10.5. Key Strategies and Developments
- 11.11. Oracle Corporation
- 11.11.1. Company Overview
- 11.11.2. Financial Highlights
- 11.11.3. Product Portfolio
- 11.11.4. SWOT Analysis
- 11.11.5. Key Strategies and Developments
- 11.12. NVIDIA Corporation
- 11.12.1. Company Overview
- 11.12.2. Financial Highlights
- 11.12.3. Product Portfolio
- 11.12.4. SWOT Analysis
- 11.12.5. Key Strategies and Developments
- 11.13.1. Company Overview
- 11.13.2. Financial Highlights
- 11.13.3. Product Portfolio
- 11.13.4. SWOT Analysis
- 11.13.5. Key Strategies and Developments
- 11.14. Accenture plc
- 11.14.1. Company Overview
- 11.14.2. Financial Highlights
- 11.14.3. Product Portfolio
- 11.14.4. SWOT Analysis
- 11.14.5. Key Strategies and Developments
- 12. Assumptions and Acronyms
- 13. Research Methodology
- 14. Contact
"
- List of Figures
- "
- Figure 1: Global CNG Powertrain Market Revenue (US$ Mn) Market Share by By Drive Type in 2022
- Figure 2: Global CNG Powertrain Market Market Attractiveness Analysis by By Drive Type, 2016-2032
- Figure 3: Global CNG Powertrain Market Revenue (US$ Mn) Market Share by By Fuel Typein 2022
- Figure 4: Global CNG Powertrain Market Market Attractiveness Analysis by By Fuel Type, 2016-2032
- Figure 5: Global CNG Powertrain Market Revenue (US$ Mn) Market Share by By Vehicle Typein 2022
- Figure 6: Global CNG Powertrain Market Market Attractiveness Analysis by By Vehicle Type, 2016-2032
- Figure 7: Global CNG Powertrain Market Revenue (US$ Mn) Market Share by Region in 2022
- Figure 8: Global CNG Powertrain Market Market Attractiveness Analysis by Region, 2016-2032
- Figure 9: Global CNG Powertrain Market Market Revenue (US$ Mn) (2016-2032)
- Figure 10: Global CNG Powertrain Market Market Revenue (US$ Mn) Comparison by Region (2016-2032)
- Figure 11: Global CNG Powertrain Market Market Revenue (US$ Mn) Comparison by By Drive Type (2016-2032)
- Figure 12: Global CNG Powertrain Market Market Revenue (US$ Mn) Comparison by By Fuel Type (2016-2032)
- Figure 13: Global CNG Powertrain Market Market Revenue (US$ Mn) Comparison by By Vehicle Type (2016-2032)
- Figure 14: Global CNG Powertrain Market Market Y-o-Y Growth Rate Comparison by Region (2016-2032)
- Figure 15: Global CNG Powertrain Market Market Y-o-Y Growth Rate Comparison by By Drive Type (2016-2032)
- Figure 16: Global CNG Powertrain Market Market Y-o-Y Growth Rate Comparison by By Fuel Type (2016-2032)
- Figure 17: Global CNG Powertrain Market Market Y-o-Y Growth Rate Comparison by By Vehicle Type (2016-2032)
- Figure 18: Global CNG Powertrain Market Market Share Comparison by Region (2016-2032)
- Figure 19: Global CNG Powertrain Market Market Share Comparison by By Drive Type (2016-2032)
- Figure 20: Global CNG Powertrain Market Market Share Comparison by By Fuel Type (2016-2032)
- Figure 21: Global CNG Powertrain Market Market Share Comparison by By Vehicle Type (2016-2032)
- Figure 22: North America CNG Powertrain Market Revenue (US$ Mn) Market Share by By Drive Typein 2022
- Figure 23: North America CNG Powertrain Market Market Attractiveness Analysis by By Drive Type, 2016-2032
- Figure 24: North America CNG Powertrain Market Revenue (US$ Mn) Market Share by By Fuel Typein 2022
- Figure 25: North America CNG Powertrain Market Market Attractiveness Analysis by By Fuel Type, 2016-2032
- Figure 26: North America CNG Powertrain Market Revenue (US$ Mn) Market Share by By Vehicle Typein 2022
- Figure 27: North America CNG Powertrain Market Market Attractiveness Analysis by By Vehicle Type, 2016-2032
- Figure 28: North America CNG Powertrain Market Revenue (US$ Mn) Market Share by Country in 2022
- Figure 29: North America CNG Powertrain Market Market Attractiveness Analysis by Country, 2016-2032
- Figure 30: North America CNG Powertrain Market Market Revenue (US$ Mn) (2016-2032)
- Figure 31: North America CNG Powertrain Market Market Revenue (US$ Mn) Comparison by Country (2016-2032)
- Figure 32: North America CNG Powertrain Market Market Revenue (US$ Mn) Comparison by By Drive Type (2016-2032)
- Figure 33: North America CNG Powertrain Market Market Revenue (US$ Mn) Comparison by By Fuel Type (2016-2032)
- Figure 34: North America CNG Powertrain Market Market Revenue (US$ Mn) Comparison by By Vehicle Type (2016-2032)
- Figure 35: North America CNG Powertrain Market Market Y-o-Y Growth Rate Comparison by Country (2016-2032)
- Figure 36: North America CNG Powertrain Market Market Y-o-Y Growth Rate Comparison by By Drive Type (2016-2032)
- Figure 37: North America CNG Powertrain Market Market Y-o-Y Growth Rate Comparison by By Fuel Type (2016-2032)
- Figure 38: North America CNG Powertrain Market Market Y-o-Y Growth Rate Comparison by By Vehicle Type (2016-2032)
- Figure 39: North America CNG Powertrain Market Market Share Comparison by Country (2016-2032)
- Figure 40: North America CNG Powertrain Market Market Share Comparison by By Drive Type (2016-2032)
- Figure 41: North America CNG Powertrain Market Market Share Comparison by By Fuel Type (2016-2032)
- Figure 42: North America CNG Powertrain Market Market Share Comparison by By Vehicle Type (2016-2032)
- Figure 43: Western Europe CNG Powertrain Market Revenue (US$ Mn) Market Share by By Drive Typein 2022
- Figure 44: Western Europe CNG Powertrain Market Market Attractiveness Analysis by By Drive Type, 2016-2032
- Figure 45: Western Europe CNG Powertrain Market Revenue (US$ Mn) Market Share by By Fuel Typein 2022
- Figure 46: Western Europe CNG Powertrain Market Market Attractiveness Analysis by By Fuel Type, 2016-2032
- Figure 47: Western Europe CNG Powertrain Market Revenue (US$ Mn) Market Share by By Vehicle Typein 2022
- Figure 48: Western Europe CNG Powertrain Market Market Attractiveness Analysis by By Vehicle Type, 2016-2032
- Figure 49: Western Europe CNG Powertrain Market Revenue (US$ Mn) Market Share by Country in 2022
- Figure 50: Western Europe CNG Powertrain Market Market Attractiveness Analysis by Country, 2016-2032
- Figure 51: Western Europe CNG Powertrain Market Market Revenue (US$ Mn) (2016-2032)
- Figure 52: Western Europe CNG Powertrain Market Market Revenue (US$ Mn) Comparison by Country (2016-2032)
- Figure 53: Western Europe CNG Powertrain Market Market Revenue (US$ Mn) Comparison by By Drive Type (2016-2032)
- Figure 54: Western Europe CNG Powertrain Market Market Revenue (US$ Mn) Comparison by By Fuel Type (2016-2032)
- Figure 55: Western Europe CNG Powertrain Market Market Revenue (US$ Mn) Comparison by By Vehicle Type (2016-2032)
- Figure 56: Western Europe CNG Powertrain Market Market Y-o-Y Growth Rate Comparison by Country (2016-2032)
- Figure 57: Western Europe CNG Powertrain Market Market Y-o-Y Growth Rate Comparison by By Drive Type (2016-2032)
- Figure 58: Western Europe CNG Powertrain Market Market Y-o-Y Growth Rate Comparison by By Fuel Type (2016-2032)
- Figure 59: Western Europe CNG Powertrain Market Market Y-o-Y Growth Rate Comparison by By Vehicle Type (2016-2032)
- Figure 60: Western Europe CNG Powertrain Market Market Share Comparison by Country (2016-2032)
- Figure 61: Western Europe CNG Powertrain Market Market Share Comparison by By Drive Type (2016-2032)
- Figure 62: Western Europe CNG Powertrain Market Market Share Comparison by By Fuel Type (2016-2032)
- Figure 63: Western Europe CNG Powertrain Market Market Share Comparison by By Vehicle Type (2016-2032)
- Figure 64: Eastern Europe CNG Powertrain Market Revenue (US$ Mn) Market Share by By Drive Typein 2022
- Figure 65: Eastern Europe CNG Powertrain Market Market Attractiveness Analysis by By Drive Type, 2016-2032
- Figure 66: Eastern Europe CNG Powertrain Market Revenue (US$ Mn) Market Share by By Fuel Typein 2022
- Figure 67: Eastern Europe CNG Powertrain Market Market Attractiveness Analysis by By Fuel Type, 2016-2032
- Figure 68: Eastern Europe CNG Powertrain Market Revenue (US$ Mn) Market Share by By Vehicle Typein 2022
- Figure 69: Eastern Europe CNG Powertrain Market Market Attractiveness Analysis by By Vehicle Type, 2016-2032
- Figure 70: Eastern Europe CNG Powertrain Market Revenue (US$ Mn) Market Share by Country in 2022
- Figure 71: Eastern Europe CNG Powertrain Market Market Attractiveness Analysis by Country, 2016-2032
- Figure 72: Eastern Europe CNG Powertrain Market Market Revenue (US$ Mn) (2016-2032)
- Figure 73: Eastern Europe CNG Powertrain Market Market Revenue (US$ Mn) Comparison by Country (2016-2032)
- Figure 74: Eastern Europe CNG Powertrain Market Market Revenue (US$ Mn) Comparison by By Drive Type (2016-2032)
- Figure 75: Eastern Europe CNG Powertrain Market Market Revenue (US$ Mn) Comparison by By Fuel Type (2016-2032)
- Figure 76: Eastern Europe CNG Powertrain Market Market Revenue (US$ Mn) Comparison by By Vehicle Type (2016-2032)
- Figure 77: Eastern Europe CNG Powertrain Market Market Y-o-Y Growth Rate Comparison by Country (2016-2032)
- Figure 78: Eastern Europe CNG Powertrain Market Market Y-o-Y Growth Rate Comparison by By Drive Type (2016-2032)
- Figure 79: Eastern Europe CNG Powertrain Market Market Y-o-Y Growth Rate Comparison by By Fuel Type (2016-2032)
- Figure 80: Eastern Europe CNG Powertrain Market Market Y-o-Y Growth Rate Comparison by By Vehicle Type (2016-2032)
- Figure 81: Eastern Europe CNG Powertrain Market Market Share Comparison by Country (2016-2032)
- Figure 82: Eastern Europe CNG Powertrain Market Market Share Comparison by By Drive Type (2016-2032)
- Figure 83: Eastern Europe CNG Powertrain Market Market Share Comparison by By Fuel Type (2016-2032)
- Figure 84: Eastern Europe CNG Powertrain Market Market Share Comparison by By Vehicle Type (2016-2032)
- Figure 85: APAC CNG Powertrain Market Revenue (US$ Mn) Market Share by By Drive Typein 2022
- Figure 86: APAC CNG Powertrain Market Market Attractiveness Analysis by By Drive Type, 2016-2032
- Figure 87: APAC CNG Powertrain Market Revenue (US$ Mn) Market Share by By Fuel Typein 2022
- Figure 88: APAC CNG Powertrain Market Market Attractiveness Analysis by By Fuel Type, 2016-2032
- Figure 89: APAC CNG Powertrain Market Revenue (US$ Mn) Market Share by By Vehicle Typein 2022
- Figure 90: APAC CNG Powertrain Market Market Attractiveness Analysis by By Vehicle Type, 2016-2032
- Figure 91: APAC CNG Powertrain Market Revenue (US$ Mn) Market Share by Country in 2022
- Figure 92: APAC CNG Powertrain Market Market Attractiveness Analysis by Country, 2016-2032
- Figure 93: APAC CNG Powertrain Market Market Revenue (US$ Mn) (2016-2032)
- Figure 94: APAC CNG Powertrain Market Market Revenue (US$ Mn) Comparison by Country (2016-2032)
- Figure 95: APAC CNG Powertrain Market Market Revenue (US$ Mn) Comparison by By Drive Type (2016-2032)
- Figure 96: APAC CNG Powertrain Market Market Revenue (US$ Mn) Comparison by By Fuel Type (2016-2032)
- Figure 97: APAC CNG Powertrain Market Market Revenue (US$ Mn) Comparison by By Vehicle Type (2016-2032)
- Figure 98: APAC CNG Powertrain Market Market Y-o-Y Growth Rate Comparison by Country (2016-2032)
- Figure 99: APAC CNG Powertrain Market Market Y-o-Y Growth Rate Comparison by By Drive Type (2016-2032)
- Figure 100: APAC CNG Powertrain Market Market Y-o-Y Growth Rate Comparison by By Fuel Type (2016-2032)
- Figure 101: APAC CNG Powertrain Market Market Y-o-Y Growth Rate Comparison by By Vehicle Type (2016-2032)
- Figure 102: APAC CNG Powertrain Market Market Share Comparison by Country (2016-2032)
- Figure 103: APAC CNG Powertrain Market Market Share Comparison by By Drive Type (2016-2032)
- Figure 104: APAC CNG Powertrain Market Market Share Comparison by By Fuel Type (2016-2032)
- Figure 105: APAC CNG Powertrain Market Market Share Comparison by By Vehicle Type (2016-2032)
- Figure 106: Latin America CNG Powertrain Market Revenue (US$ Mn) Market Share by By Drive Typein 2022
- Figure 107: Latin America CNG Powertrain Market Market Attractiveness Analysis by By Drive Type, 2016-2032
- Figure 108: Latin America CNG Powertrain Market Revenue (US$ Mn) Market Share by By Fuel Typein 2022
- Figure 109: Latin America CNG Powertrain Market Market Attractiveness Analysis by By Fuel Type, 2016-2032
- Figure 110: Latin America CNG Powertrain Market Revenue (US$ Mn) Market Share by By Vehicle Typein 2022
- Figure 111: Latin America CNG Powertrain Market Market Attractiveness Analysis by By Vehicle Type, 2016-2032
- Figure 112: Latin America CNG Powertrain Market Revenue (US$ Mn) Market Share by Country in 2022
- Figure 113: Latin America CNG Powertrain Market Market Attractiveness Analysis by Country, 2016-2032
- Figure 114: Latin America CNG Powertrain Market Market Revenue (US$ Mn) (2016-2032)
- Figure 115: Latin America CNG Powertrain Market Market Revenue (US$ Mn) Comparison by Country (2016-2032)
- Figure 116: Latin America CNG Powertrain Market Market Revenue (US$ Mn) Comparison by By Drive Type (2016-2032)
- Figure 117: Latin America CNG Powertrain Market Market Revenue (US$ Mn) Comparison by By Fuel Type (2016-2032)
- Figure 118: Latin America CNG Powertrain Market Market Revenue (US$ Mn) Comparison by By Vehicle Type (2016-2032)
- Figure 119: Latin America CNG Powertrain Market Market Y-o-Y Growth Rate Comparison by Country (2016-2032)
- Figure 120: Latin America CNG Powertrain Market Market Y-o-Y Growth Rate Comparison by By Drive Type (2016-2032)
- Figure 121: Latin America CNG Powertrain Market Market Y-o-Y Growth Rate Comparison by By Fuel Type (2016-2032)
- Figure 122: Latin America CNG Powertrain Market Market Y-o-Y Growth Rate Comparison by By Vehicle Type (2016-2032)
- Figure 123: Latin America CNG Powertrain Market Market Share Comparison by Country (2016-2032)
- Figure 124: Latin America CNG Powertrain Market Market Share Comparison by By Drive Type (2016-2032)
- Figure 125: Latin America CNG Powertrain Market Market Share Comparison by By Fuel Type (2016-2032)
- Figure 126: Latin America CNG Powertrain Market Market Share Comparison by By Vehicle Type (2016-2032)
- Figure 127: Middle East & Africa CNG Powertrain Market Revenue (US$ Mn) Market Share by By Drive Typein 2022
- Figure 128: Middle East & Africa CNG Powertrain Market Market Attractiveness Analysis by By Drive Type, 2016-2032
- Figure 129: Middle East & Africa CNG Powertrain Market Revenue (US$ Mn) Market Share by By Fuel Typein 2022
- Figure 130: Middle East & Africa CNG Powertrain Market Market Attractiveness Analysis by By Fuel Type, 2016-2032
- Figure 131: Middle East & Africa CNG Powertrain Market Revenue (US$ Mn) Market Share by By Vehicle Typein 2022
- Figure 132: Middle East & Africa CNG Powertrain Market Market Attractiveness Analysis by By Vehicle Type, 2016-2032
- Figure 133: Middle East & Africa CNG Powertrain Market Revenue (US$ Mn) Market Share by Country in 2022
- Figure 134: Middle East & Africa CNG Powertrain Market Market Attractiveness Analysis by Country, 2016-2032
- Figure 135: Middle East & Africa CNG Powertrain Market Market Revenue (US$ Mn) (2016-2032)
- Figure 136: Middle East & Africa CNG Powertrain Market Market Revenue (US$ Mn) Comparison by Country (2016-2032)
- Figure 137: Middle East & Africa CNG Powertrain Market Market Revenue (US$ Mn) Comparison by By Drive Type (2016-2032)
- Figure 138: Middle East & Africa CNG Powertrain Market Market Revenue (US$ Mn) Comparison by By Fuel Type (2016-2032)
- Figure 139: Middle East & Africa CNG Powertrain Market Market Revenue (US$ Mn) Comparison by By Vehicle Type (2016-2032)
- Figure 140: Middle East & Africa CNG Powertrain Market Market Y-o-Y Growth Rate Comparison by Country (2016-2032)
- Figure 141: Middle East & Africa CNG Powertrain Market Market Y-o-Y Growth Rate Comparison by By Drive Type (2016-2032)
- Figure 142: Middle East & Africa CNG Powertrain Market Market Y-o-Y Growth Rate Comparison by By Fuel Type (2016-2032)
- Figure 143: Middle East & Africa CNG Powertrain Market Market Y-o-Y Growth Rate Comparison by By Vehicle Type (2016-2032)
- Figure 144: Middle East & Africa CNG Powertrain Market Market Share Comparison by Country (2016-2032)
- Figure 145: Middle East & Africa CNG Powertrain Market Market Share Comparison by By Drive Type (2016-2032)
- Figure 146: Middle East & Africa CNG Powertrain Market Market Share Comparison by By Fuel Type (2016-2032)
- Figure 147: Middle East & Africa CNG Powertrain Market Market Share Comparison by By Vehicle Type (2016-2032)
"
- List of Tables
- "
- Table 1: Global CNG Powertrain Market Market Comparison by By Drive Type (2016-2032)
- Table 2: Global CNG Powertrain Market Market Comparison by By Fuel Type (2016-2032)
- Table 3: Global CNG Powertrain Market Market Comparison by By Vehicle Type (2016-2032)
- Table 4: Global CNG Powertrain Market Revenue (US$ Mn) Comparison by Region (2016-2032)
- Table 5: Global CNG Powertrain Market Market Revenue (US$ Mn) (2016-2032)
- Table 6: Global CNG Powertrain Market Market Revenue (US$ Mn) Comparison by Region (2016-2032)
- Table 7: Global CNG Powertrain Market Market Revenue (US$ Mn) Comparison by By Drive Type (2016-2032)
- Table 8: Global CNG Powertrain Market Market Revenue (US$ Mn) Comparison by By Fuel Type (2016-2032)
- Table 9: Global CNG Powertrain Market Market Revenue (US$ Mn) Comparison by By Vehicle Type (2016-2032)
- Table 10: Global CNG Powertrain Market Market Y-o-Y Growth Rate Comparison by Region (2016-2032)
- Table 11: Global CNG Powertrain Market Market Y-o-Y Growth Rate Comparison by By Drive Type (2016-2032)
- Table 12: Global CNG Powertrain Market Market Y-o-Y Growth Rate Comparison by By Fuel Type (2016-2032)
- Table 13: Global CNG Powertrain Market Market Y-o-Y Growth Rate Comparison by By Vehicle Type (2016-2032)
- Table 14: Global CNG Powertrain Market Market Share Comparison by Region (2016-2032)
- Table 15: Global CNG Powertrain Market Market Share Comparison by By Drive Type (2016-2032)
- Table 16: Global CNG Powertrain Market Market Share Comparison by By Fuel Type (2016-2032)
- Table 17: Global CNG Powertrain Market Market Share Comparison by By Vehicle Type (2016-2032)
- Table 18: North America CNG Powertrain Market Market Comparison by By Fuel Type (2016-2032)
- Table 19: North America CNG Powertrain Market Market Comparison by By Vehicle Type (2016-2032)
- Table 20: North America CNG Powertrain Market Revenue (US$ Mn) Comparison by Country (2016-2032)
- Table 21: North America CNG Powertrain Market Market Revenue (US$ Mn) (2016-2032)
- Table 22: North America CNG Powertrain Market Market Revenue (US$ Mn) Comparison by Country (2016-2032)
- Table 23: North America CNG Powertrain Market Market Revenue (US$ Mn) Comparison by By Drive Type (2016-2032)
- Table 24: North America CNG Powertrain Market Market Revenue (US$ Mn) Comparison by By Fuel Type (2016-2032)
- Table 25: North America CNG Powertrain Market Market Revenue (US$ Mn) Comparison by By Vehicle Type (2016-2032)
- Table 26: North America CNG Powertrain Market Market Y-o-Y Growth Rate Comparison by Country (2016-2032)
- Table 27: North America CNG Powertrain Market Market Y-o-Y Growth Rate Comparison by By Drive Type (2016-2032)
- Table 28: North America CNG Powertrain Market Market Y-o-Y Growth Rate Comparison by By Fuel Type (2016-2032)
- Table 29: North America CNG Powertrain Market Market Y-o-Y Growth Rate Comparison by By Vehicle Type (2016-2032)
- Table 30: North America CNG Powertrain Market Market Share Comparison by Country (2016-2032)
- Table 31: North America CNG Powertrain Market Market Share Comparison by By Drive Type (2016-2032)
- Table 32: North America CNG Powertrain Market Market Share Comparison by By Fuel Type (2016-2032)
- Table 33: North America CNG Powertrain Market Market Share Comparison by By Vehicle Type (2016-2032)
- Table 34: Western Europe CNG Powertrain Market Market Comparison by By Drive Type (2016-2032)
- Table 35: Western Europe CNG Powertrain Market Market Comparison by By Fuel Type (2016-2032)
- Table 36: Western Europe CNG Powertrain Market Market Comparison by By Vehicle Type (2016-2032)
- Table 37: Western Europe CNG Powertrain Market Revenue (US$ Mn) Comparison by Country (2016-2032)
- Table 38: Western Europe CNG Powertrain Market Market Revenue (US$ Mn) (2016-2032)
- Table 39: Western Europe CNG Powertrain Market Market Revenue (US$ Mn) Comparison by Country (2016-2032)
- Table 40: Western Europe CNG Powertrain Market Market Revenue (US$ Mn) Comparison by By Drive Type (2016-2032)
- Table 41: Western Europe CNG Powertrain Market Market Revenue (US$ Mn) Comparison by By Fuel Type (2016-2032)
- Table 42: Western Europe CNG Powertrain Market Market Revenue (US$ Mn) Comparison by By Vehicle Type (2016-2032)
- Table 43: Western Europe CNG Powertrain Market Market Y-o-Y Growth Rate Comparison by Country (2016-2032)
- Table 44: Western Europe CNG Powertrain Market Market Y-o-Y Growth Rate Comparison by By Drive Type (2016-2032)
- Table 45: Western Europe CNG Powertrain Market Market Y-o-Y Growth Rate Comparison by By Fuel Type (2016-2032)
- Table 46: Western Europe CNG Powertrain Market Market Y-o-Y Growth Rate Comparison by By Vehicle Type (2016-2032)
- Table 47: Western Europe CNG Powertrain Market Market Share Comparison by Country (2016-2032)
- Table 48: Western Europe CNG Powertrain Market Market Share Comparison by By Drive Type (2016-2032)
- Table 49: Western Europe CNG Powertrain Market Market Share Comparison by By Fuel Type (2016-2032)
- Table 50: Western Europe CNG Powertrain Market Market Share Comparison by By Vehicle Type (2016-2032)
- Table 51: Eastern Europe CNG Powertrain Market Market Comparison by By Drive Type (2016-2032)
- Table 52: Eastern Europe CNG Powertrain Market Market Comparison by By Fuel Type (2016-2032)
- Table 53: Eastern Europe CNG Powertrain Market Market Comparison by By Vehicle Type (2016-2032)
- Table 54: Eastern Europe CNG Powertrain Market Revenue (US$ Mn) Comparison by Country (2016-2032)
- Table 55: Eastern Europe CNG Powertrain Market Market Revenue (US$ Mn) (2016-2032)
- Table 56: Eastern Europe CNG Powertrain Market Market Revenue (US$ Mn) Comparison by Country (2016-2032)
- Table 57: Eastern Europe CNG Powertrain Market Market Revenue (US$ Mn) Comparison by By Drive Type (2016-2032)
- Table 58: Eastern Europe CNG Powertrain Market Market Revenue (US$ Mn) Comparison by By Fuel Type (2016-2032)
- Table 59: Eastern Europe CNG Powertrain Market Market Revenue (US$ Mn) Comparison by By Vehicle Type (2016-2032)
- Table 60: Eastern Europe CNG Powertrain Market Market Y-o-Y Growth Rate Comparison by Country (2016-2032)
- Table 61: Eastern Europe CNG Powertrain Market Market Y-o-Y Growth Rate Comparison by By Drive Type (2016-2032)
- Table 62: Eastern Europe CNG Powertrain Market Market Y-o-Y Growth Rate Comparison by By Fuel Type (2016-2032)
- Table 63: Eastern Europe CNG Powertrain Market Market Y-o-Y Growth Rate Comparison by By Vehicle Type (2016-2032)
- Table 64: Eastern Europe CNG Powertrain Market Market Share Comparison by Country (2016-2032)
- Table 65: Eastern Europe CNG Powertrain Market Market Share Comparison by By Drive Type (2016-2032)
- Table 66: Eastern Europe CNG Powertrain Market Market Share Comparison by By Fuel Type (2016-2032)
- Table 67: Eastern Europe CNG Powertrain Market Market Share Comparison by By Vehicle Type (2016-2032)
- Table 68: APAC CNG Powertrain Market Market Comparison by By Drive Type (2016-2032)
- Table 69: APAC CNG Powertrain Market Market Comparison by By Fuel Type (2016-2032)
- Table 70: APAC CNG Powertrain Market Market Comparison by By Vehicle Type (2016-2032)
- Table 71: APAC CNG Powertrain Market Revenue (US$ Mn) Comparison by Country (2016-2032)
- Table 72: APAC CNG Powertrain Market Market Revenue (US$ Mn) (2016-2032)
- Table 73: APAC CNG Powertrain Market Market Revenue (US$ Mn) Comparison by Country (2016-2032)
- Table 74: APAC CNG Powertrain Market Market Revenue (US$ Mn) Comparison by By Drive Type (2016-2032)
- Table 75: APAC CNG Powertrain Market Market Revenue (US$ Mn) Comparison by By Fuel Type (2016-2032)
- Table 76: APAC CNG Powertrain Market Market Revenue (US$ Mn) Comparison by By Vehicle Type (2016-2032)
- Table 77: APAC CNG Powertrain Market Market Y-o-Y Growth Rate Comparison by Country (2016-2032)
- Table 78: APAC CNG Powertrain Market Market Y-o-Y Growth Rate Comparison by By Drive Type (2016-2032)
- Table 79: APAC CNG Powertrain Market Market Y-o-Y Growth Rate Comparison by By Fuel Type (2016-2032)
- Table 80: APAC CNG Powertrain Market Market Y-o-Y Growth Rate Comparison by By Vehicle Type (2016-2032)
- Table 81: APAC CNG Powertrain Market Market Share Comparison by Country (2016-2032)
- Table 82: APAC CNG Powertrain Market Market Share Comparison by By Drive Type (2016-2032)
- Table 83: APAC CNG Powertrain Market Market Share Comparison by By Fuel Type (2016-2032)
- Table 84: APAC CNG Powertrain Market Market Share Comparison by By Vehicle Type (2016-2032)
- Table 85: Latin America CNG Powertrain Market Market Comparison by By Drive Type (2016-2032)
- Table 86: Latin America CNG Powertrain Market Market Comparison by By Fuel Type (2016-2032)
- Table 87: Latin America CNG Powertrain Market Market Comparison by By Vehicle Type (2016-2032)
- Table 88: Latin America CNG Powertrain Market Revenue (US$ Mn) Comparison by Country (2016-2032)
- Table 89: Latin America CNG Powertrain Market Market Revenue (US$ Mn) (2016-2032)
- Table 90: Latin America CNG Powertrain Market Market Revenue (US$ Mn) Comparison by Country (2016-2032)
- Table 91: Latin America CNG Powertrain Market Market Revenue (US$ Mn) Comparison by By Drive Type (2016-2032)
- Table 92: Latin America CNG Powertrain Market Market Revenue (US$ Mn) Comparison by By Fuel Type (2016-2032)
- Table 93: Latin America CNG Powertrain Market Market Revenue (US$ Mn) Comparison by By Vehicle Type (2016-2032)
- Table 94: Latin America CNG Powertrain Market Market Y-o-Y Growth Rate Comparison by Country (2016-2032)
- Table 95: Latin America CNG Powertrain Market Market Y-o-Y Growth Rate Comparison by By Drive Type (2016-2032)
- Table 96: Latin America CNG Powertrain Market Market Y-o-Y Growth Rate Comparison by By Fuel Type (2016-2032)
- Table 97: Latin America CNG Powertrain Market Market Y-o-Y Growth Rate Comparison by By Vehicle Type (2016-2032)
- Table 98: Latin America CNG Powertrain Market Market Share Comparison by Country (2016-2032)
- Table 99: Latin America CNG Powertrain Market Market Share Comparison by By Drive Type (2016-2032)
- Table 100: Latin America CNG Powertrain Market Market Share Comparison by By Fuel Type (2016-2032)
- Table 101: Latin America CNG Powertrain Market Market Share Comparison by By Vehicle Type (2016-2032)
- Table 102: Middle East & Africa CNG Powertrain Market Market Comparison by By Drive Type (2016-2032)
- Table 103: Middle East & Africa CNG Powertrain Market Market Comparison by By Fuel Type (2016-2032)
- Table 104: Middle East & Africa CNG Powertrain Market Market Comparison by By Vehicle Type (2016-2032)
- Table 105: Middle East & Africa CNG Powertrain Market Revenue (US$ Mn) Comparison by Country (2016-2032)
- Table 106: Middle East & Africa CNG Powertrain Market Market Revenue (US$ Mn) (2016-2032)
- Table 107: Middle East & Africa CNG Powertrain Market Market Revenue (US$ Mn) Comparison by Country (2016-2032)
- Table 108: Middle East & Africa CNG Powertrain Market Market Revenue (US$ Mn) Comparison by By Drive Type (2016-2032)
- Table 109: Middle East & Africa CNG Powertrain Market Market Revenue (US$ Mn) Comparison by By Fuel Type (2016-2032)
- Table 110: Middle East & Africa CNG Powertrain Market Market Revenue (US$ Mn) Comparison by By Vehicle Type (2016-2032)
- Table 111: Middle East & Africa CNG Powertrain Market Market Y-o-Y Growth Rate Comparison by Country (2016-2032)
- Table 112: Middle East & Africa CNG Powertrain Market Market Y-o-Y Growth Rate Comparison by By Drive Type (2016-2032)
- Table 113: Middle East & Africa CNG Powertrain Market Market Y-o-Y Growth Rate Comparison by By Fuel Type (2016-2032)
- Table 114: Middle East & Africa CNG Powertrain Market Market Y-o-Y Growth Rate Comparison by By Vehicle Type (2016-2032)
- Table 115: Middle East & Africa CNG Powertrain Market Market Share Comparison by Country (2016-2032)
- Table 116: Middle East & Africa CNG Powertrain Market Market Share Comparison by By Drive Type (2016-2032)
- Table 117: Middle East & Africa CNG Powertrain Market Market Share Comparison by By Fuel Type (2016-2032)
- Table 118: Middle East & Africa CNG Powertrain Market Market Share Comparison by By Vehicle Type (2016-2032)
- 1. Executive Summary
-
- Google LLC
- IBM Corp
- Microsoft Corporation
- Hyundai Motor Company
- Intel Corporation
- Siemens AG
- General Electric Company
- Cisco Systems, Inc.
- Oracle Corporation
- NVIDIA Corporation
- Accenture plc
- Honda Motor Company
Our Clients


View Our Licence Options
