
Acral Lentiginous Melanoma Market Report By Diagnostic Stage (Early-Stage ALM, Advanced-Stage ALM), By Treatment Modality (Surgery, Radiation Therapy, Chemotherapy, Immunotherapy (e.g., PD-1 Inhibitors, CTLA-4 Inhibitors), Targeted Therapy (e.g., BRAF Inhibitors, MEK Inhibitors), Combination Therapies), By End Users, By Region and Companies - Industry Segment Outlook, Market Assessment, Competition Scenario, Trends and Forecast 2024-2033
-
45324
-
May 2024
-
285
-


-
This report was compiled by Trishita Deb Trishita Deb is an experienced market research and consulting professional with over 7 years of expertise across healthcare, consumer goods, and materials, contributing to over 400 healthcare-related reports. Correspondence Team Lead- Healthcare Linkedin | Detailed Market research Methodology Our methodology involves a mix of primary research, including interviews with leading mental health experts, and secondary research from reputable medical journals and databases. View Detailed Methodology Page
-
Quick Navigation
Report Overview
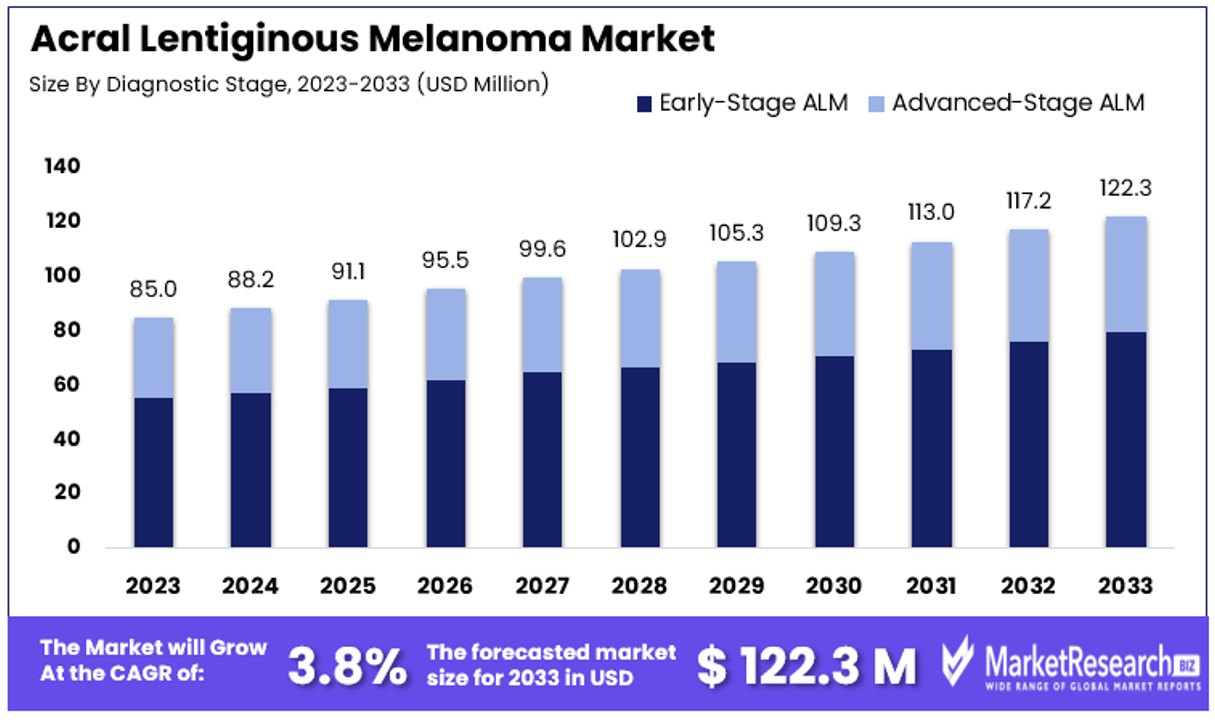
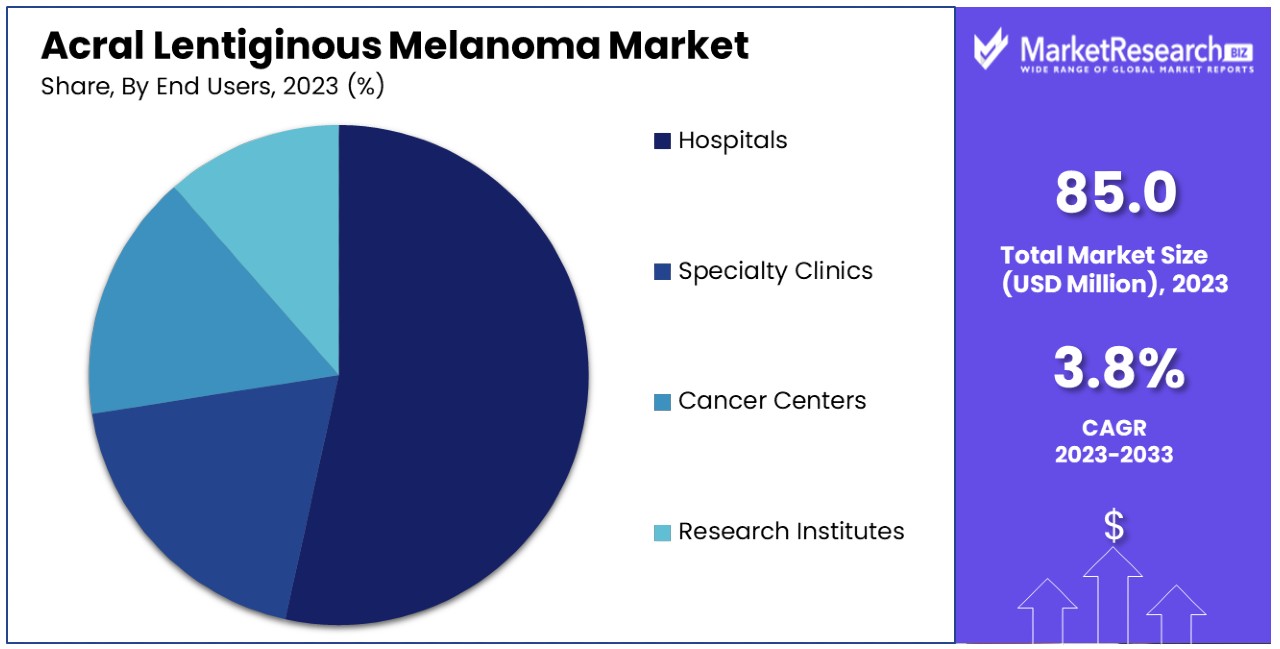
The Global Acral Lentiginous Melanoma Market size is expected to be worth around USD 122.3 Million by 2033, from USD 85 Million in 2023, growing at a CAGR of 3.80% during the forecast period from 2024 to 2033.
Acral Lentiginous Melanoma (ALM) Market refers to the specific segment within the oncology industry focused on a rare form of melanoma that predominantly affects the palms, soles, and under the nails. This market encompasses the development, production, and distribution of diagnostic tools, treatments, and potentially preventative strategies specifically for ALM.
The market's growth is driven by advances in medical technology, increasing awareness of ALM symptoms, and the rising incidence of melanoma globally. Key stakeholders, including biopharmaceutical firms, healthcare providers, and regulatory bodies, play significant roles in shaping market dynamics through innovation and strategic partnerships. This sector is of particular interest to executives and product managers aiming to address critical healthcare needs and tap into niche medical markets.
The Acral Lentiginous Melanoma (ALM) market is a specialized sector within the broader dermatological oncology field. In 2023, approximately 97,610 new cases of melanoma are expected to be diagnosed in the United States. This data highlights a growing concern, as melanoma remains the deadliest form of skin cancer and has shown a significant increase in diagnosis over the last three decades, particularly among young adults aged 25 to 39.
Although ALM is a rare subtype, with an age-adjusted incidence rate of about 1.8 to 2.0 per million person-years, its impact is noteworthy, especially given its higher prevalence among African American, Hispanic, and Asian populations.
Despite its rarity, the ALM market is crucial due to the subtype’s poorer prognosis and higher mortality rates compared to other forms of melanoma. These factors drive a persistent demand for advanced diagnostic tools, effective treatment options, and tailored healthcare strategies that address the unique challenges associated with ALM. The market is further influenced by increasing awareness and the need for specialized care, which propels research and development efforts.
The ALM market presents a dual opportunity: first, to enhance outcomes for a demographic that is disproportionately affected; and second, to innovate in areas of unmet medical need. Stakeholders, including biopharmaceutical companies, healthcare providers, and policy makers, are thus incentivized to invest in this niche yet significant market.
Strategic partnerships and investments in research could lead to breakthroughs in treatment methodologies and diagnostic technologies, potentially expanding the market and improving patient prognosis. This area remains ripe for development, with a focus on increasing survival rates and improving quality of life for affected individuals.
Key Takeaways
- Market Value: The Global Acral Lentiginous Melanoma Market is anticipated to reach a substantial value by 2033, growing from USD 85 million in 2023, with a CAGR of 3.80% during the forecast period from 2024 to 2033.
- Diagnostic Stage Analysis: Early-Stage ALM dominates with 65% share due to its association with higher survival rates, emphasizing the importance of early detection and screening initiatives.
- Treatment Modality Analysis: Immunotherapy leads with 50% share, offering superior efficacy in prolonging survival and enhancing the quality of life for melanoma patients.
- End Users Analysis: Hospitals dominate with 70% share, providing comprehensive care facilities and serving as primary treatment centers for ALM patients.
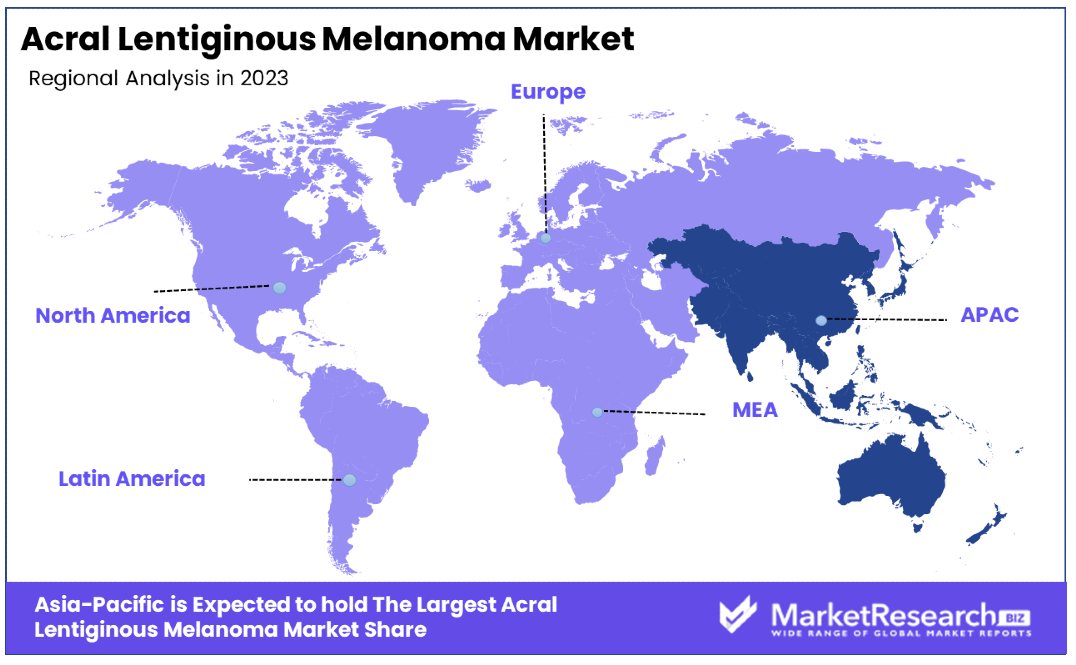
- APAC: Dominates with 55% market share, reflecting significant patient population and increasing awareness about melanoma diagnosis and treatment options.
- North America: Holds a substantial market share of approximately 25%, driven by advanced healthcare infrastructure, high healthcare spending, and active patient advocacy groups.
- Analyst Viewpoint: Emphasis on early detection and screening programs is crucial in improving ALM patient outcomes and reducing treatment costs, highlighting the importance of investing in diagnostic technologies and initiatives. Immunotherapy's dominance underscores its transformative impact on melanoma treatment, driving the need for further research and development in this therapeutic area.
Driving Factors
Increasing Incidence of Acral Lentiginous Melanoma Drives Market Growth
The growing incidence of Acral Lentiginous Melanoma (ALM) significantly influences the expansion of its market. ALM, a rare subtype of melanoma primarily affecting the palms, soles, and nail beds, is distinguished from other melanoma types by its lack of strong association with UV exposure. This characteristic makes it more prevalent among populations with darker skin tones, such as Asian and African American groups.
According to research in the Journal of the American Academy of Dermatology, ALM can represent up to 60% of melanoma cases in these populations. The global increase in population and aging demographics are projected to raise the incidence of ALM further, thus enhancing the demand for effective treatments. This uptick in cases necessitates advancements in medical research and healthcare provisioning, propelling the development of targeted therapies tailored to meet the unique needs of ALM patients.
Advancements in Targeted Therapies and Immunotherapies Enhance Market Dynamics
The introduction of targeted therapies and immunotherapies has been pivotal in transforming the treatment landscape for melanoma, including ALM. These therapies offer more precise treatment options that improve patient outcomes. For instance, the combination of encorafenib, a BRAF inhibitor, and binimetinib, a MEK inhibitor, has been approved by the FDA for treating BRAF-mutated melanoma, which includes some ALM cases.
This advancement reflects a broader trend in oncology that focuses on understanding the genetic and molecular underpinnings of cancers to develop more effective treatments. As ongoing research uncovers more about ALM’s specific pathways, the market is likely to see an influx of new, innovative treatments that can more accurately target the disease, thereby driving growth within the sector.
Increased Focus on Rare and Underserved Cancers Spurs Market Development
A heightened focus on rare and underserved cancers like ALM is reshaping priorities within the pharmaceutical industry and research communities. This shift is driven by several factors, including orphan drug incentives, which offer financial benefits for developing treatments for rare diseases, robust patient advocacy, and the potential for substantial returns on investment due to the high need for effective treatments in underserved markets.
These dynamics are encouraging more investments into research and development specifically for ALM. Initiatives like the Melanoma Research Alliance’s Acral Lentiginous Melanoma Working Group exemplify efforts to enhance research funding and patient support, thus fostering a conducive environment for market growth. As more resources are allocated to understanding and treating ALM, the market is likely to expand, leading to enhanced patient outcomes and increased availability of tailored treatment options.
Restraining Factors
Rarity of Acral Lentiginous Melanoma Restrains Market Growth
The rarity of Acral Lentiginous Melanoma (ALM) significantly limits its market growth. As a rare subtype, ALM accounts for only a minor fraction of all melanoma cases, which complicates the execution of large-scale clinical trials and affects the robustness of research findings.
For instance, a Phase 3 clinical trial by Amgen for taletrectinib in ALM patients had to be discontinued due to slower-than-expected patient enrollment. The limited number of patients not only challenges the accumulation of sufficient data but also affects the feasibility and cost-effectiveness of developing new therapies. Consequently, pharmaceutical companies may be less inclined to invest in research and development for treatments targeting ALM, considering the potential constraints on market size and profitability.
Lack of Comprehensive Understanding of ALM Biology Restrains Market Growth
The incomplete understanding of the biological mechanisms underlying Acral Lentiginous Melanoma poses another barrier to market growth. Despite advancements in melanoma research, significant gaps remain in the knowledge of ALM's genetic and molecular drivers. This lack of clarity hampers the development of targeted therapies and precise biomarkers necessary for effective patient selection and treatment monitoring.
The heterogeneity of ALM, with its unique mutational profiles and varied clinical presentations, further complicates therapeutic developments. For example, studies have identified distinct genetic mutations in ALM compared to other melanoma subtypes, necessitating specialized research tailored specifically to this group. This complexity not only delays the introduction of innovative treatments but also limits the overall expansion of the ALM market.
Diagnostic Stage Analysis
Early-Stage ALM dominates with 65% due to earlier detection and increased survival rates.
The diagnostic stage of Acral Lentiginous Melanoma (ALM) significantly influences treatment approaches and market dynamics. Early-Stage ALM, where the cancer is detected at a less advanced stage, currently dominates this segment. This dominance is largely attributed to the growing emphasis on early detection and screening within the healthcare community. Early detection is linked to significantly higher survival rates and less invasive treatments, which are more cost-effective and lead to better patient outcomes. As a result, there is a strong push for technologies and programs that can diagnose melanoma at its earliest stage.
Conversely, Advanced-Stage ALM represents a smaller portion of the market but is critical due to the complexity and urgency of treatment required. Patients diagnosed at a later stage often undergo more aggressive treatments, which can be less effective and more costly. This sub-segment drives demand for advanced therapeutics and innovative treatment modalities, pushing research and development efforts to focus on more effective late-stage interventions. The role of advanced-stage diagnosis in driving technological advancement and treatment efficacy remains crucial, despite its smaller market share.
Treatment Modality Analysis
Immunotherapy dominates with 50% due to its effectiveness in prolonging survival in melanoma patients.
In the treatment of Acral Lentiginous Melanoma, various modalities are employed, each addressing different needs based on the disease's progression and individual patient factors. Among these, Immunotherapy has emerged as the dominant sub-segment, particularly through agents like PD-1 and CTLA-4 inhibitors. These therapies have revolutionized treatment, offering prolonged survival rates and better quality of life by enabling the immune system to recognize and combat cancer cells more effectively. The success of immunotherapy has been supported by substantial clinical evidence demonstrating its superiority over traditional treatments in many cases.
Other important treatment modalities include Surgery, Radiation Therapy, Chemotherapy, Targeted Therapy, and Combination Therapies. Surgery remains a foundational treatment approach, especially for early-stage ALM, effectively removing tumors before they spread. Radiation therapy and chemotherapy are typically reserved for more advanced cases or when surgery is not viable.
Meanwhile, Targeted Therapy, particularly treatments involving BRAF and MEK inhibitors, has become critical for patients with specific genetic mutations. The development and utilization of Combination Therapies, which involve using two or more treatment methods together, have also shown promise in improving outcomes by attacking the cancer on multiple fronts. Each of these treatments plays a vital role in the comprehensive care of ALM patients, supporting the overall market growth through diversified therapeutic offerings.
End Users Analysis
Hospitals dominate with 70% due to their comprehensive care facilities and high patient influx.
The end-user segment of the Acral Lentiginous Melanoma market significantly impacts its distribution and accessibility. Hospitals, as the primary care setting for most ALM patients, dominate this market segment. This dominance is attributed to their ability to provide comprehensive care, including diagnosis, treatment, and follow-up in a single location. Hospitals are typically equipped with the latest technologies and staffed by specialist teams that can manage the complexities of melanoma treatment, making them a preferred choice for many patients.
Specialty Clinics, Cancer Centers, and Research Institutes also play critical roles in the ALM market. Specialty Clinics offer focused care, particularly for patients needing personalized treatment plans, while Cancer Centers are pivotal in providing specialized treatments and access to clinical trials that might not be available elsewhere. Research Institutes contribute by pushing the boundaries of what is currently known about ALM through ongoing studies and trials, which can lead to new treatment modalities and strategies. Although Hospitals are the dominant segment due to their extensive resources and patient volume, the other end users collectively enhance the market's dynamic by offering specialized services that address the diverse needs of the ALM patient population.
Key Market Segments
By Diagnostic Stage
- Early-Stage ALM
- Advanced-Stage ALM
By Treatment Modality
- Surgery
- Radiation Therapy
- Chemotherapy
- Immunotherapy (e.g., PD-1 Inhibitors, CTLA-4 Inhibitors)
- Targeted Therapy (e.g., BRAF Inhibitors, MEK Inhibitors)
- Combination Therapies
By End Users
- Hospitals
- Specialty Clinics
- Cancer Centers
- Research Institutes
Growth Opportunities
Development of Biomarker-Driven Targeted Therapies Offers Growth Opportunity
The evolution of genetic and molecular understanding in Acral Lentiginous Melanoma (ALM) presents significant opportunities for the development of biomarker-driven targeted therapies. By pinpointing specific genetic mutations or molecular pathways that are distinctive to ALM, such therapies can offer more precise and individualized treatment solutions. This method builds on the proven success of targeted therapies in other melanoma subtypes and aims to address the unique biological characteristics of ALM.
For instance, research from the University of California, San Francisco highlighted recurrent mutations in the BRAF and NF1 genes, which are promising targets for precision medicine strategies in ALM. The increasing precision in targeting these molecular anomalies represents a substantial market opportunity, as it can lead to the development of more effective treatments that can significantly improve patient outcomes.
Combination Therapy Approaches Offer Growth Opportunity
The inherent complexity and heterogeneity of Acral Lentiginous Melanoma provide fertile ground for exploring combination therapy approaches. These strategies, which involve the concurrent use of multiple therapeutic agents like targeted therapies and immunotherapies, are designed to target various molecular pathways simultaneously or to achieve synergistic effects.
This approach could potentially circumvent resistance mechanisms often seen with single-agent treatments and enhance overall treatment efficacy. For example, current clinical trials are assessing the efficacy of combining BRAF/MEK inhibitors with immune checkpoint inhibitors in patients harboring BRAF mutations in ALM. These combination regimens aim to boost the effectiveness and durability of the treatment responses, indicating a robust growth opportunity in this segment of the ALM market.
Trending Factors
Increasing Focus on Rare and Neglected Diseases Are Trending Factors
The pharmaceutical industry and research community are increasingly concentrating on rare and neglected diseases, such as Acral Lentiginous Melanoma (ALM). This trend is propelled by a combination of patient advocacy, the allure of high returns on investment through orphan drug incentives, and the pursuit of addressing unmet medical needs.
As awareness grows and funding increases, there is a marked expansion in research and development efforts specifically targeting ALM. This shift not only fuels market growth but also stimulates innovation, providing hope for better treatment solutions for this underserved patient population. This strategic focus is expected to continue, driven by the potential for significant advancements in therapeutic options and patient care for rare cancers like ALM.
Advancements in Precision Medicine and Genomic Profiling Are Trending Factors
Precision medicine and genomic profiling are rapidly evolving fields that are shaping the future of cancer treatment, particularly for subtypes like Acral Lentiginous Melanoma. Significant strides in identifying genetic mutations and molecular biomarkers specific to ALM are enhancing the development of targeted therapies.
This trend is crucial for ALM, which exhibits unique genetic and molecular characteristics compared to more common melanoma types. By utilizing genomic data to tailor treatments, researchers and pharmaceutical companies can provide more effective, personalized therapy options. This approach not only improves patient outcomes but also represents a significant growth area within the ALM market, reflecting broader trends towards individualized cancer treatment strategies.
Regional Analysis
APAC Dominates with 55% Market Share
Asia Pacific (APAC) holds the majority market share in the Acral Lentiginous Melanoma (ALM) market, primarily due to its large and diverse population, which increases the prevalence of varied melanoma cases, including rare subtypes like ALM. Additionally, rising healthcare expenditures and improvements in healthcare infrastructure contribute to enhanced diagnostic and treatment capabilities across the region. Significant investments in medical research and the presence of high-growth economies like China and India also drive the adoption of advanced oncology treatments.
The dominance of APAC in the ALM market is further supported by the region's focus on innovative healthcare solutions and growing awareness about skin cancer. The region benefits from government initiatives promoting early detection and treatment of cancers, coupled with an increasing number of specialized cancer care centers. These factors create a robust environment for the growth of the ALM market, encouraging continuous investment from global and regional pharmaceutical companies.
APAC’s influence on the global ALM market is expected to grow even further. With ongoing advancements in healthcare and a growing middle class that can access and afford more comprehensive medical care, the demand for specialized and advanced melanoma treatments in the region will likely increase. This could lead to more targeted research initiatives and potentially more breakthroughs in ALM treatments, reinforcing APAC’s leading position in the market.
Regional Market Share:
- North America: North America holds a significant market share, accounting for approximately 25%. The region’s advanced healthcare infrastructure, high healthcare spending, and active patient advocacy groups drive its substantial role in the global ALM market.
- Europe: Europe commands around 15% of the market share, supported by its strong healthcare systems, widespread awareness of melanoma, and substantial research funding.
- Middle East & Africa: This region accounts for about 3% of the market. Despite lower market share, there is potential for growth driven by improving healthcare infrastructure and increasing awareness.
- Latin America: Holding 2% of the market, Latin America faces challenges due to varying levels of healthcare access and awareness but shows promise with gradual healthcare improvements and increased government focus on cancer prevention.
Key Regions and Countries
- North America
- The US
- Canada
- Mexico
- Western Europe
- Germany
- France
- The UK
- Spain
- Italy
- Portugal
- Ireland
- Austria
- Switzerland
- Benelux
- Nordic
- Rest of Western Europe
- Eastern Europe
- Russia
- Poland
- The Czech Republic
- Greece
- Rest of Eastern Europe
- APAC
- China
- Japan
- South Korea
- India
- Australia & New Zealand
- Indonesia
- Malaysia
- Philippines
- Singapore
- Thailand
- Vietnam
- Rest of APAC
- Latin America
- Brazil
- Colombia
- Chile
- Argentina
- Costa Rica
- Rest of Latin America
- Middle East & Africa
- Algeria
- Egypt
- Israel
- Kuwait
- Nigeria
- Saudi Arabia
- South Africa
- Turkey
- United Arab Emirates
- Rest of MEA
Key Players Analysis
In the Acral Lentiginous Melanoma Market, Novartis AG, Bristol-Myers Squibb Company, and Amgen Inc. have emerged as influential leaders due to their advanced therapeutic offerings and significant investment in oncology research. These companies focus on developing targeted therapies that improve survival rates and quality of life for patients with this aggressive form of melanoma. Their strategic positioning is strengthened by robust global networks and extensive market penetration, which allow them to quickly adapt and distribute new treatments.
AbbVie Inc. and Eli Lilly and Company also play critical roles by incorporating innovative biotechnologies to develop drugs that are more effective and have fewer side effects. Their efforts are complemented by companies like Regeneron Pharmaceuticals Inc. and GlaxoSmithKline PLC, which are known for their pioneering work in immunotherapies, potentially transforming the standard care for acral lentiginous melanoma.
Furthermore, Bayer AG and Prometheus Laboratories stand out for their diagnostic and prognostic solutions that support early detection and personalized treatment approaches. The combined efforts of these companies not only push the boundaries of existing treatments but also ensure a comprehensive approach to managing acral lentiginous melanoma, thus enhancing patient outcomes and driving growth in this specialized market sector.
Market Key Players
- Novartis AG
- AbbVie Inc.
- Prometheus Laboratories
- Bristol-Myers Squibb Company
- Bayer AG
- Regeneron Pharmaceuticals Inc.
- Amgen Inc.
- GlaxoSmithKline PLC
- Eli Lilly and Company
Recent Developments
- On March 2024, the U.S. Food and Drug Administration approved Amtagvi (lifileucel), the first cellular therapy for adult patients with unresectable or metastatic melanoma. This approval signifies a significant advancement in treating this aggressive form of skin cancer.
- On March 2024, Allegheny Health Network (AHN) launched a state-of-the-art Melanoma and Skin Cancer Center, focusing on cutting-edge technology like the VECTRA WB360 imaging system to enhance early lesion detection and improve patient outcomes.
Report Scope
Report Features Description Market Value (2023) USD 85 Million Forecast Revenue (2033) USD 122.3 Million CAGR (2024-2033) 3.80% Base Year for Estimation 2023 Historic Period 2018-2023 Forecast Period 2024-2033 Report Coverage Revenue Forecast, Market Dynamics, Competitive Landscape, Recent Developments Segments Covered By Diagnostic Stage (Early-Stage ALM, Advanced-Stage ALM), By Treatment Modality (Surgery, Radiation Therapy, Chemotherapy, Immunotherapy (e.g., PD-1 Inhibitors, CTLA-4 Inhibitors), Targeted Therapy (e.g., BRAF Inhibitors, MEK Inhibitors), Combination Therapies), By End Users (Hospitals, Specialty Clinics, Cancer Centers, Research Institutes) Regional Analysis North America - The US, Canada, & Mexico; Western Europe - Germany, France, The UK, Spain, Italy, Portugal, Ireland, Austria, Switzerland, Benelux, Nordic, & Rest of Western Europe; Eastern Europe - Russia, Poland, The Czech Republic, Greece, & Rest of Eastern Europe; APAC - China, Japan, South Korea, India, Australia & New Zealand, Indonesia, Malaysia, Philippines, Singapore, Thailand, Vietnam, & Rest of APAC; Latin America - Brazil, Colombia, Chile, Argentina, Costa Rica, & Rest of Latin America; Middle East & Africa - Algeria, Egypt, Israel, Kuwait, Nigeria, Saudi Arabia, South Africa, Turkey, United Arab Emirates, & Rest of MEA Competitive Landscape Novartis AG, AbbVie Inc., Prometheus Laboratories, Bristol-Myers Squibb Company, Bayer AG, Regeneron Pharmaceuticals Inc., Amgen Inc., GlaxoSmithKline PLC, Eli Lilly and Company Customization Scope Customization for segments, region/country-level will be provided. Moreover, additional customization can be done based on the requirements. Purchase Options We have three licenses to opt for: Single User License, Multi-User License (Up to 5 Users), Corporate Use License (Unlimited User and Printable PDF) -
- 1. Executive Summary
- 1.1. Definition
- 1.2. Taxonomy
- 1.3. Research Scope
- 1.4. Key Analysis
- 1.5. Key Findings by Major Segments
- 1.6. Top strategies by Major Players
- 2. Global Acral Lentiginous Melanoma Market Overview
- 2.1. Acral Lentiginous Melanoma Market Dynamics
- 2.1.1. Drivers
- 2.1.2. Opportunities
- 2.1.3. Restraints
- 2.1.4. Challenges
- 2.2. Macro-economic Factors
- 2.3. Regulatory Framework
- 2.4. Market Investment Feasibility Index
- 2.5. PEST Analysis
- 2.6. PORTER’S Five Force Analysis
- 2.7. Drivers & Restraints Impact Analysis
- 2.8. Industry Chain Analysis
- 2.9. Cost Structure Analysis
- 2.10. Marketing Strategy
- 2.11. Russia-Ukraine War Impact Analysis
- 2.12. Opportunity Map Analysis
- 2.13. Market Competition Scenario Analysis
- 2.14. Product Life Cycle Analysis
- 2.15. Opportunity Orbits
- 2.16. Manufacturer Intensity Map
- 2.17. Major Companies sales by Value & Volume
- 2.1. Acral Lentiginous Melanoma Market Dynamics
- 3. Global Acral Lentiginous Melanoma Market Analysis, Opportunity and Forecast, 2016-2032
- 3.1. Global Acral Lentiginous Melanoma Market Analysis, 2016-2021
- 3.2. Global Acral Lentiginous Melanoma Market Opportunity and Forecast, 2023-2032
- 3.3. Global Acral Lentiginous Melanoma Market Analysis, Opportunity and Forecast, By Diagnostic Stage, 2016-2032
- 3.3.1. Global Acral Lentiginous Melanoma Market Analysis by Diagnostic Stage: Introduction
- 3.3.2. Market Size Absolute $ Opportunity Analysis and Forecast, By Diagnostic Stage, 2016-2032
- 3.3.3. Early-Stage ALM
- 3.3.4. Advanced-Stage ALM
- 3.4. Global Acral Lentiginous Melanoma Market Analysis, Opportunity and Forecast, By Treatment Modality, 2016-2032
- 3.4.1. Global Acral Lentiginous Melanoma Market Analysis by Treatment Modality: Introduction
- 3.4.2. Market Size Absolute $ Opportunity Analysis and Forecast, By Treatment Modality, 2016-2032
- 3.4.3. Surgery
- 3.4.4. Radiation Therapy
- 3.4.5. Chemotherapy
- 3.4.6. Immunotherapy
- 3.4.7. Targeted Therapy
- 3.4.8. Combination Therapies
- 3.5. Global Acral Lentiginous Melanoma Market Analysis, Opportunity and Forecast, By End Users, 2016-2032
- 3.5.1. Global Acral Lentiginous Melanoma Market Analysis by End Users: Introduction
- 3.5.2. Market Size Absolute $ Opportunity Analysis and Forecast, By End Users, 2016-2032
- 3.5.3. Hospitals
- 3.5.4. Specialty Clinics
- 3.5.5. Cancer Centers
- 3.5.6. Research Institutes
- 4. North America Acral Lentiginous Melanoma Market Analysis, Opportunity and Forecast, 2016-2032
- 4.1. North America Acral Lentiginous Melanoma Market Analysis, 2016-2021
- 4.2. North America Acral Lentiginous Melanoma Market Opportunity and Forecast, 2023-2032
- 4.3. North America Acral Lentiginous Melanoma Market Analysis, Opportunity and Forecast, By Diagnostic Stage, 2016-2032
- 4.3.1. North America Acral Lentiginous Melanoma Market Analysis by Diagnostic Stage: Introduction
- 4.3.2. Market Size Absolute $ Opportunity Analysis and Forecast, By Diagnostic Stage, 2016-2032
- 4.3.3. Early-Stage ALM
- 4.3.4. Advanced-Stage ALM
- 4.4. North America Acral Lentiginous Melanoma Market Analysis, Opportunity and Forecast, By Treatment Modality, 2016-2032
- 4.4.1. North America Acral Lentiginous Melanoma Market Analysis by Treatment Modality: Introduction
- 4.4.2. Market Size Absolute $ Opportunity Analysis and Forecast, By Treatment Modality, 2016-2032
- 4.4.3. Surgery
- 4.4.4. Radiation Therapy
- 4.4.5. Chemotherapy
- 4.4.6. Immunotherapy
- 4.4.7. Targeted Therapy
- 4.4.8. Combination Therapies
- 4.5. North America Acral Lentiginous Melanoma Market Analysis, Opportunity and Forecast, By End Users, 2016-2032
- 4.5.1. North America Acral Lentiginous Melanoma Market Analysis by End Users: Introduction
- 4.5.2. Market Size Absolute $ Opportunity Analysis and Forecast, By End Users, 2016-2032
- 4.5.3. Hospitals
- 4.5.4. Specialty Clinics
- 4.5.5. Cancer Centers
- 4.5.6. Research Institutes
- 4.6. North America Acral Lentiginous Melanoma Market Analysis, Opportunity and Forecast, By Country , 2016-2032
- 4.6.1. North America Acral Lentiginous Melanoma Market Analysis by Country : Introduction
- 4.6.2. Market Size Absolute $ Opportunity Analysis and Forecast, Country , 2016-2032
- 4.6.2.1. The US
- 4.6.2.2. Canada
- 4.6.2.3. Mexico
- 5. Western Europe Acral Lentiginous Melanoma Market Analysis, Opportunity and Forecast, 2016-2032
- 5.1. Western Europe Acral Lentiginous Melanoma Market Analysis, 2016-2021
- 5.2. Western Europe Acral Lentiginous Melanoma Market Opportunity and Forecast, 2023-2032
- 5.3. Western Europe Acral Lentiginous Melanoma Market Analysis, Opportunity and Forecast, By Diagnostic Stage, 2016-2032
- 5.3.1. Western Europe Acral Lentiginous Melanoma Market Analysis by Diagnostic Stage: Introduction
- 5.3.2. Market Size Absolute $ Opportunity Analysis and Forecast, By Diagnostic Stage, 2016-2032
- 5.3.3. Early-Stage ALM
- 5.3.4. Advanced-Stage ALM
- 5.4. Western Europe Acral Lentiginous Melanoma Market Analysis, Opportunity and Forecast, By Treatment Modality, 2016-2032
- 5.4.1. Western Europe Acral Lentiginous Melanoma Market Analysis by Treatment Modality: Introduction
- 5.4.2. Market Size Absolute $ Opportunity Analysis and Forecast, By Treatment Modality, 2016-2032
- 5.4.3. Surgery
- 5.4.4. Radiation Therapy
- 5.4.5. Chemotherapy
- 5.4.6. Immunotherapy
- 5.4.7. Targeted Therapy
- 5.4.8. Combination Therapies
- 5.5. Western Europe Acral Lentiginous Melanoma Market Analysis, Opportunity and Forecast, By End Users, 2016-2032
- 5.5.1. Western Europe Acral Lentiginous Melanoma Market Analysis by End Users: Introduction
- 5.5.2. Market Size Absolute $ Opportunity Analysis and Forecast, By End Users, 2016-2032
- 5.5.3. Hospitals
- 5.5.4. Specialty Clinics
- 5.5.5. Cancer Centers
- 5.5.6. Research Institutes
- 5.6. Western Europe Acral Lentiginous Melanoma Market Analysis, Opportunity and Forecast, By Country , 2016-2032
- 5.6.1. Western Europe Acral Lentiginous Melanoma Market Analysis by Country : Introduction
- 5.6.2. Market Size Absolute $ Opportunity Analysis and Forecast, Country , 2016-2032
- 5.6.2.1. Germany
- 5.6.2.2. France
- 5.6.2.3. The UK
- 5.6.2.4. Spain
- 5.6.2.5. Italy
- 5.6.2.6. Portugal
- 5.6.2.7. Ireland
- 5.6.2.8. Austria
- 5.6.2.9. Switzerland
- 5.6.2.10. Benelux
- 5.6.2.11. Nordic
- 5.6.2.12. Rest of Western Europe
- 6. Eastern Europe Acral Lentiginous Melanoma Market Analysis, Opportunity and Forecast, 2016-2032
- 6.1. Eastern Europe Acral Lentiginous Melanoma Market Analysis, 2016-2021
- 6.2. Eastern Europe Acral Lentiginous Melanoma Market Opportunity and Forecast, 2023-2032
- 6.3. Eastern Europe Acral Lentiginous Melanoma Market Analysis, Opportunity and Forecast, By Diagnostic Stage, 2016-2032
- 6.3.1. Eastern Europe Acral Lentiginous Melanoma Market Analysis by Diagnostic Stage: Introduction
- 6.3.2. Market Size Absolute $ Opportunity Analysis and Forecast, By Diagnostic Stage, 2016-2032
- 6.3.3. Early-Stage ALM
- 6.3.4. Advanced-Stage ALM
- 6.4. Eastern Europe Acral Lentiginous Melanoma Market Analysis, Opportunity and Forecast, By Treatment Modality, 2016-2032
- 6.4.1. Eastern Europe Acral Lentiginous Melanoma Market Analysis by Treatment Modality: Introduction
- 6.4.2. Market Size Absolute $ Opportunity Analysis and Forecast, By Treatment Modality, 2016-2032
- 6.4.3. Surgery
- 6.4.4. Radiation Therapy
- 6.4.5. Chemotherapy
- 6.4.6. Immunotherapy
- 6.4.7. Targeted Therapy
- 6.4.8. Combination Therapies
- 6.5. Eastern Europe Acral Lentiginous Melanoma Market Analysis, Opportunity and Forecast, By End Users, 2016-2032
- 6.5.1. Eastern Europe Acral Lentiginous Melanoma Market Analysis by End Users: Introduction
- 6.5.2. Market Size Absolute $ Opportunity Analysis and Forecast, By End Users, 2016-2032
- 6.5.3. Hospitals
- 6.5.4. Specialty Clinics
- 6.5.5. Cancer Centers
- 6.5.6. Research Institutes
- 6.6. Eastern Europe Acral Lentiginous Melanoma Market Analysis, Opportunity and Forecast, By Country , 2016-2032
- 6.6.1. Eastern Europe Acral Lentiginous Melanoma Market Analysis by Country : Introduction
- 6.6.2. Market Size Absolute $ Opportunity Analysis and Forecast, Country , 2016-2032
- 6.6.2.1. Russia
- 6.6.2.2. Poland
- 6.6.2.3. The Czech Republic
- 6.6.2.4. Greece
- 6.6.2.5. Rest of Eastern Europe
- 7. APAC Acral Lentiginous Melanoma Market Analysis, Opportunity and Forecast, 2016-2032
- 7.1. APAC Acral Lentiginous Melanoma Market Analysis, 2016-2021
- 7.2. APAC Acral Lentiginous Melanoma Market Opportunity and Forecast, 2023-2032
- 7.3. APAC Acral Lentiginous Melanoma Market Analysis, Opportunity and Forecast, By Diagnostic Stage, 2016-2032
- 7.3.1. APAC Acral Lentiginous Melanoma Market Analysis by Diagnostic Stage: Introduction
- 7.3.2. Market Size Absolute $ Opportunity Analysis and Forecast, By Diagnostic Stage, 2016-2032
- 7.3.3. Early-Stage ALM
- 7.3.4. Advanced-Stage ALM
- 7.4. APAC Acral Lentiginous Melanoma Market Analysis, Opportunity and Forecast, By Treatment Modality, 2016-2032
- 7.4.1. APAC Acral Lentiginous Melanoma Market Analysis by Treatment Modality: Introduction
- 7.4.2. Market Size Absolute $ Opportunity Analysis and Forecast, By Treatment Modality, 2016-2032
- 7.4.3. Surgery
- 7.4.4. Radiation Therapy
- 7.4.5. Chemotherapy
- 7.4.6. Immunotherapy
- 7.4.7. Targeted Therapy
- 7.4.8. Combination Therapies
- 7.5. APAC Acral Lentiginous Melanoma Market Analysis, Opportunity and Forecast, By End Users, 2016-2032
- 7.5.1. APAC Acral Lentiginous Melanoma Market Analysis by End Users: Introduction
- 7.5.2. Market Size Absolute $ Opportunity Analysis and Forecast, By End Users, 2016-2032
- 7.5.3. Hospitals
- 7.5.4. Specialty Clinics
- 7.5.5. Cancer Centers
- 7.5.6. Research Institutes
- 7.6. APAC Acral Lentiginous Melanoma Market Analysis, Opportunity and Forecast, By Country , 2016-2032
- 7.6.1. APAC Acral Lentiginous Melanoma Market Analysis by Country : Introduction
- 7.6.2. Market Size Absolute $ Opportunity Analysis and Forecast, Country , 2016-2032
- 7.6.2.1. China
- 7.6.2.2. Japan
- 7.6.2.3. South Korea
- 7.6.2.4. India
- 7.6.2.5. Australia & New Zeland
- 7.6.2.6. Indonesia
- 7.6.2.7. Malaysia
- 7.6.2.8. Philippines
- 7.6.2.9. Singapore
- 7.6.2.10. Thailand
- 7.6.2.11. Vietnam
- 7.6.2.12. Rest of APAC
- 8. Latin America Acral Lentiginous Melanoma Market Analysis, Opportunity and Forecast, 2016-2032
- 8.1. Latin America Acral Lentiginous Melanoma Market Analysis, 2016-2021
- 8.2. Latin America Acral Lentiginous Melanoma Market Opportunity and Forecast, 2023-2032
- 8.3. Latin America Acral Lentiginous Melanoma Market Analysis, Opportunity and Forecast, By Diagnostic Stage, 2016-2032
- 8.3.1. Latin America Acral Lentiginous Melanoma Market Analysis by Diagnostic Stage: Introduction
- 8.3.2. Market Size Absolute $ Opportunity Analysis and Forecast, By Diagnostic Stage, 2016-2032
- 8.3.3. Early-Stage ALM
- 8.3.4. Advanced-Stage ALM
- 8.4. Latin America Acral Lentiginous Melanoma Market Analysis, Opportunity and Forecast, By Treatment Modality, 2016-2032
- 8.4.1. Latin America Acral Lentiginous Melanoma Market Analysis by Treatment Modality: Introduction
- 8.4.2. Market Size Absolute $ Opportunity Analysis and Forecast, By Treatment Modality, 2016-2032
- 8.4.3. Surgery
- 8.4.4. Radiation Therapy
- 8.4.5. Chemotherapy
- 8.4.6. Immunotherapy
- 8.4.7. Targeted Therapy
- 8.4.8. Combination Therapies
- 8.5. Latin America Acral Lentiginous Melanoma Market Analysis, Opportunity and Forecast, By End Users, 2016-2032
- 8.5.1. Latin America Acral Lentiginous Melanoma Market Analysis by End Users: Introduction
- 8.5.2. Market Size Absolute $ Opportunity Analysis and Forecast, By End Users, 2016-2032
- 8.5.3. Hospitals
- 8.5.4. Specialty Clinics
- 8.5.5. Cancer Centers
- 8.5.6. Research Institutes
- 8.6. Latin America Acral Lentiginous Melanoma Market Analysis, Opportunity and Forecast, By Country , 2016-2032
- 8.6.1. Latin America Acral Lentiginous Melanoma Market Analysis by Country : Introduction
- 8.6.2. Market Size Absolute $ Opportunity Analysis and Forecast, Country , 2016-2032
- 8.6.2.1. Brazil
- 8.6.2.2. Colombia
- 8.6.2.3. Chile
- 8.6.2.4. Argentina
- 8.6.2.5. Costa Rica
- 8.6.2.6. Rest of Latin America
- 9. Middle East & Africa Acral Lentiginous Melanoma Market Analysis, Opportunity and Forecast, 2016-2032
- 9.1. Middle East & Africa Acral Lentiginous Melanoma Market Analysis, 2016-2021
- 9.2. Middle East & Africa Acral Lentiginous Melanoma Market Opportunity and Forecast, 2023-2032
- 9.3. Middle East & Africa Acral Lentiginous Melanoma Market Analysis, Opportunity and Forecast, By Diagnostic Stage, 2016-2032
- 9.3.1. Middle East & Africa Acral Lentiginous Melanoma Market Analysis by Diagnostic Stage: Introduction
- 9.3.2. Market Size Absolute $ Opportunity Analysis and Forecast, By Diagnostic Stage, 2016-2032
- 9.3.3. Early-Stage ALM
- 9.3.4. Advanced-Stage ALM
- 9.4. Middle East & Africa Acral Lentiginous Melanoma Market Analysis, Opportunity and Forecast, By Treatment Modality, 2016-2032
- 9.4.1. Middle East & Africa Acral Lentiginous Melanoma Market Analysis by Treatment Modality: Introduction
- 9.4.2. Market Size Absolute $ Opportunity Analysis and Forecast, By Treatment Modality, 2016-2032
- 9.4.3. Surgery
- 9.4.4. Radiation Therapy
- 9.4.5. Chemotherapy
- 9.4.6. Immunotherapy
- 9.4.7. Targeted Therapy
- 9.4.8. Combination Therapies
- 9.5. Middle East & Africa Acral Lentiginous Melanoma Market Analysis, Opportunity and Forecast, By End Users, 2016-2032
- 9.5.1. Middle East & Africa Acral Lentiginous Melanoma Market Analysis by End Users: Introduction
- 9.5.2. Market Size Absolute $ Opportunity Analysis and Forecast, By End Users, 2016-2032
- 9.5.3. Hospitals
- 9.5.4. Specialty Clinics
- 9.5.5. Cancer Centers
- 9.5.6. Research Institutes
- 9.6. Middle East & Africa Acral Lentiginous Melanoma Market Analysis, Opportunity and Forecast, By Country , 2016-2032
- 9.6.1. Middle East & Africa Acral Lentiginous Melanoma Market Analysis by Country : Introduction
- 9.6.2. Market Size Absolute $ Opportunity Analysis and Forecast, Country , 2016-2032
- 9.6.2.1. Algeria
- 9.6.2.2. Egypt
- 9.6.2.3. Israel
- 9.6.2.4. Kuwait
- 9.6.2.5. Nigeria
- 9.6.2.6. Saudi Arabia
- 9.6.2.7. South Africa
- 9.6.2.8. Turkey
- 9.6.2.9. The UAE
- 9.6.2.10. Rest of MEA
- 10. Global Acral Lentiginous Melanoma Market Analysis, Opportunity and Forecast, By Region , 2016-2032
- 10.1. Global Acral Lentiginous Melanoma Market Analysis by Region : Introduction
- 10.2. Market Size Absolute $ Opportunity Analysis and Forecast, By Region , 2016-2032
- 10.2.1. North America
- 10.2.2. Western Europe
- 10.2.3. Eastern Europe
- 10.2.4. APAC
- 10.2.5. Latin America
- 10.2.6. Middle East & Africa
- 11. Global Acral Lentiginous Melanoma Market Competitive Landscape, Market Share Analysis, and Company Profiles
- 11.1. Market Share Analysis
- 11.2. Company Profiles
- 11.3. Novartis AG
- 11.3.1. Company Overview
- 11.3.2. Financial Highlights
- 11.3.3. Product Portfolio
- 11.3.4. SWOT Analysis
- 11.3.5. Key Strategies and Developments
- 11.4. AbbVie Inc.
- 11.4.1. Company Overview
- 11.4.2. Financial Highlights
- 11.4.3. Product Portfolio
- 11.4.4. SWOT Analysis
- 11.4.5. Key Strategies and Developments
- 11.5. Prometheus Laboratories
- 11.5.1. Company Overview
- 11.5.2. Financial Highlights
- 11.5.3. Product Portfolio
- 11.5.4. SWOT Analysis
- 11.5.5. Key Strategies and Developments
- 11.6. Bristol-Myers Squibb Company
- 11.6.1. Company Overview
- 11.6.2. Financial Highlights
- 11.6.3. Product Portfolio
- 11.6.4. SWOT Analysis
- 11.6.5. Key Strategies and Developments
- 11.7. Bayer AG
- 11.7.1. Company Overview
- 11.7.2. Financial Highlights
- 11.7.3. Product Portfolio
- 11.7.4. SWOT Analysis
- 11.7.5. Key Strategies and Developments
- 11.8. Regeneron Pharmaceuticals Inc.
- 11.8.1. Company Overview
- 11.8.2. Financial Highlights
- 11.8.3. Product Portfolio
- 11.8.4. SWOT Analysis
- 11.8.5. Key Strategies and Developments
- 11.9. Amgen Inc.
- 11.9.1. Company Overview
- 11.9.2. Financial Highlights
- 11.9.3. Product Portfolio
- 11.9.4. SWOT Analysis
- 11.9.5. Key Strategies and Developments
- 11.10. GlaxoSmithKline PLC
- 11.10.1. Company Overview
- 11.10.2. Financial Highlights
- 11.10.3. Product Portfolio
- 11.10.4. SWOT Analysis
- 11.10.5. Key Strategies and Developments
- 11.11. Eli Lilly and Company
- 11.11.1. Company Overview
- 11.11.2. Financial Highlights
- 11.11.3. Product Portfolio
- 11.11.4. SWOT Analysis
- 11.11.5. Key Strategies and Developments
- 11.13.1. Company Overview
- 11.13.2. Financial Highlights
- 11.13.3. Product Portfolio
- 11.13.4. SWOT Analysis
- 11.13.5. Key Strategies and Developments
- 12. Assumptions and Acronyms
- 13. Research Methodology
- 14. Contact
- List of Figures
- Figure 1: Global Acral Lentiginous Melanoma Market Revenue (US$ Mn) Market Share by Diagnostic Stage in 2022
- Figure 2: Global Acral Lentiginous Melanoma Market Attractiveness Analysis by Diagnostic Stage, 2016-2032
- Figure 3: Global Acral Lentiginous Melanoma Market Revenue (US$ Mn) Market Share by Treatment Modalityin 2022
- Figure 4: Global Acral Lentiginous Melanoma Market Attractiveness Analysis by Treatment Modality, 2016-2032
- Figure 5: Global Acral Lentiginous Melanoma Market Revenue (US$ Mn) Market Share by End Usersin 2022
- Figure 6: Global Acral Lentiginous Melanoma Market Attractiveness Analysis by End Users, 2016-2032
- Figure 7: Global Acral Lentiginous Melanoma Market Revenue (US$ Mn) Market Share by Region in 2022
- Figure 8: Global Acral Lentiginous Melanoma Market Attractiveness Analysis by Region, 2016-2032
- Figure 9: Global Acral Lentiginous Melanoma Market Revenue (US$ Mn) (2016-2032)
- Figure 10: Global Acral Lentiginous Melanoma Market Revenue (US$ Mn) Comparison by Region (2016-2032)
- Figure 11: Global Acral Lentiginous Melanoma Market Revenue (US$ Mn) Comparison by Diagnostic Stage (2016-2032)
- Figure 12: Global Acral Lentiginous Melanoma Market Revenue (US$ Mn) Comparison by Treatment Modality (2016-2032)
- Figure 13: Global Acral Lentiginous Melanoma Market Revenue (US$ Mn) Comparison by End Users (2016-2032)
- Figure 14: Global Acral Lentiginous Melanoma Market Y-o-Y Growth Rate Comparison by Region (2016-2032)
- Figure 15: Global Acral Lentiginous Melanoma Market Y-o-Y Growth Rate Comparison by Diagnostic Stage (2016-2032)
- Figure 16: Global Acral Lentiginous Melanoma Market Y-o-Y Growth Rate Comparison by Treatment Modality (2016-2032)
- Figure 17: Global Acral Lentiginous Melanoma Market Y-o-Y Growth Rate Comparison by End Users (2016-2032)
- Figure 18: Global Acral Lentiginous Melanoma Market Share Comparison by Region (2016-2032)
- Figure 19: Global Acral Lentiginous Melanoma Market Share Comparison by Diagnostic Stage (2016-2032)
- Figure 20: Global Acral Lentiginous Melanoma Market Share Comparison by Treatment Modality (2016-2032)
- Figure 21: Global Acral Lentiginous Melanoma Market Share Comparison by End Users (2016-2032)
- Figure 22: North America Acral Lentiginous Melanoma Market Revenue (US$ Mn) Market Share by Diagnostic Stagein 2022
- Figure 23: North America Acral Lentiginous Melanoma Market Attractiveness Analysis by Diagnostic Stage, 2016-2032
- Figure 24: North America Acral Lentiginous Melanoma Market Revenue (US$ Mn) Market Share by Treatment Modalityin 2022
- Figure 25: North America Acral Lentiginous Melanoma Market Attractiveness Analysis by Treatment Modality, 2016-2032
- Figure 26: North America Acral Lentiginous Melanoma Market Revenue (US$ Mn) Market Share by End Usersin 2022
- Figure 27: North America Acral Lentiginous Melanoma Market Attractiveness Analysis by End Users, 2016-2032
- Figure 28: North America Acral Lentiginous Melanoma Market Revenue (US$ Mn) Market Share by Country in 2022
- Figure 29: North America Acral Lentiginous Melanoma Market Attractiveness Analysis by Country, 2016-2032
- Figure 30: North America Acral Lentiginous Melanoma Market Revenue (US$ Mn) (2016-2032)
- Figure 31: North America Acral Lentiginous Melanoma Market Revenue (US$ Mn) Comparison by Country (2016-2032)
- Figure 32: North America Acral Lentiginous Melanoma Market Revenue (US$ Mn) Comparison by Diagnostic Stage (2016-2032)
- Figure 33: North America Acral Lentiginous Melanoma Market Revenue (US$ Mn) Comparison by Treatment Modality (2016-2032)
- Figure 34: North America Acral Lentiginous Melanoma Market Revenue (US$ Mn) Comparison by End Users (2016-2032)
- Figure 35: North America Acral Lentiginous Melanoma Market Y-o-Y Growth Rate Comparison by Country (2016-2032)
- Figure 36: North America Acral Lentiginous Melanoma Market Y-o-Y Growth Rate Comparison by Diagnostic Stage (2016-2032)
- Figure 37: North America Acral Lentiginous Melanoma Market Y-o-Y Growth Rate Comparison by Treatment Modality (2016-2032)
- Figure 38: North America Acral Lentiginous Melanoma Market Y-o-Y Growth Rate Comparison by End Users (2016-2032)
- Figure 39: North America Acral Lentiginous Melanoma Market Share Comparison by Country (2016-2032)
- Figure 40: North America Acral Lentiginous Melanoma Market Share Comparison by Diagnostic Stage (2016-2032)
- Figure 41: North America Acral Lentiginous Melanoma Market Share Comparison by Treatment Modality (2016-2032)
- Figure 42: North America Acral Lentiginous Melanoma Market Share Comparison by End Users (2016-2032)
- Figure 43: Western Europe Acral Lentiginous Melanoma Market Revenue (US$ Mn) Market Share by Diagnostic Stagein 2022
- Figure 44: Western Europe Acral Lentiginous Melanoma Market Attractiveness Analysis by Diagnostic Stage, 2016-2032
- Figure 45: Western Europe Acral Lentiginous Melanoma Market Revenue (US$ Mn) Market Share by Treatment Modalityin 2022
- Figure 46: Western Europe Acral Lentiginous Melanoma Market Attractiveness Analysis by Treatment Modality, 2016-2032
- Figure 47: Western Europe Acral Lentiginous Melanoma Market Revenue (US$ Mn) Market Share by End Usersin 2022
- Figure 48: Western Europe Acral Lentiginous Melanoma Market Attractiveness Analysis by End Users, 2016-2032
- Figure 49: Western Europe Acral Lentiginous Melanoma Market Revenue (US$ Mn) Market Share by Country in 2022
- Figure 50: Western Europe Acral Lentiginous Melanoma Market Attractiveness Analysis by Country, 2016-2032
- Figure 51: Western Europe Acral Lentiginous Melanoma Market Revenue (US$ Mn) (2016-2032)
- Figure 52: Western Europe Acral Lentiginous Melanoma Market Revenue (US$ Mn) Comparison by Country (2016-2032)
- Figure 53: Western Europe Acral Lentiginous Melanoma Market Revenue (US$ Mn) Comparison by Diagnostic Stage (2016-2032)
- Figure 54: Western Europe Acral Lentiginous Melanoma Market Revenue (US$ Mn) Comparison by Treatment Modality (2016-2032)
- Figure 55: Western Europe Acral Lentiginous Melanoma Market Revenue (US$ Mn) Comparison by End Users (2016-2032)
- Figure 56: Western Europe Acral Lentiginous Melanoma Market Y-o-Y Growth Rate Comparison by Country (2016-2032)
- Figure 57: Western Europe Acral Lentiginous Melanoma Market Y-o-Y Growth Rate Comparison by Diagnostic Stage (2016-2032)
- Figure 58: Western Europe Acral Lentiginous Melanoma Market Y-o-Y Growth Rate Comparison by Treatment Modality (2016-2032)
- Figure 59: Western Europe Acral Lentiginous Melanoma Market Y-o-Y Growth Rate Comparison by End Users (2016-2032)
- Figure 60: Western Europe Acral Lentiginous Melanoma Market Share Comparison by Country (2016-2032)
- Figure 61: Western Europe Acral Lentiginous Melanoma Market Share Comparison by Diagnostic Stage (2016-2032)
- Figure 62: Western Europe Acral Lentiginous Melanoma Market Share Comparison by Treatment Modality (2016-2032)
- Figure 63: Western Europe Acral Lentiginous Melanoma Market Share Comparison by End Users (2016-2032)
- Figure 64: Eastern Europe Acral Lentiginous Melanoma Market Revenue (US$ Mn) Market Share by Diagnostic Stagein 2022
- Figure 65: Eastern Europe Acral Lentiginous Melanoma Market Attractiveness Analysis by Diagnostic Stage, 2016-2032
- Figure 66: Eastern Europe Acral Lentiginous Melanoma Market Revenue (US$ Mn) Market Share by Treatment Modalityin 2022
- Figure 67: Eastern Europe Acral Lentiginous Melanoma Market Attractiveness Analysis by Treatment Modality, 2016-2032
- Figure 68: Eastern Europe Acral Lentiginous Melanoma Market Revenue (US$ Mn) Market Share by End Usersin 2022
- Figure 69: Eastern Europe Acral Lentiginous Melanoma Market Attractiveness Analysis by End Users, 2016-2032
- Figure 70: Eastern Europe Acral Lentiginous Melanoma Market Revenue (US$ Mn) Market Share by Country in 2022
- Figure 71: Eastern Europe Acral Lentiginous Melanoma Market Attractiveness Analysis by Country, 2016-2032
- Figure 72: Eastern Europe Acral Lentiginous Melanoma Market Revenue (US$ Mn) (2016-2032)
- Figure 73: Eastern Europe Acral Lentiginous Melanoma Market Revenue (US$ Mn) Comparison by Country (2016-2032)
- Figure 74: Eastern Europe Acral Lentiginous Melanoma Market Revenue (US$ Mn) Comparison by Diagnostic Stage (2016-2032)
- Figure 75: Eastern Europe Acral Lentiginous Melanoma Market Revenue (US$ Mn) Comparison by Treatment Modality (2016-2032)
- Figure 76: Eastern Europe Acral Lentiginous Melanoma Market Revenue (US$ Mn) Comparison by End Users (2016-2032)
- Figure 77: Eastern Europe Acral Lentiginous Melanoma Market Y-o-Y Growth Rate Comparison by Country (2016-2032)
- Figure 78: Eastern Europe Acral Lentiginous Melanoma Market Y-o-Y Growth Rate Comparison by Diagnostic Stage (2016-2032)
- Figure 79: Eastern Europe Acral Lentiginous Melanoma Market Y-o-Y Growth Rate Comparison by Treatment Modality (2016-2032)
- Figure 80: Eastern Europe Acral Lentiginous Melanoma Market Y-o-Y Growth Rate Comparison by End Users (2016-2032)
- Figure 81: Eastern Europe Acral Lentiginous Melanoma Market Share Comparison by Country (2016-2032)
- Figure 82: Eastern Europe Acral Lentiginous Melanoma Market Share Comparison by Diagnostic Stage (2016-2032)
- Figure 83: Eastern Europe Acral Lentiginous Melanoma Market Share Comparison by Treatment Modality (2016-2032)
- Figure 84: Eastern Europe Acral Lentiginous Melanoma Market Share Comparison by End Users (2016-2032)
- Figure 85: APAC Acral Lentiginous Melanoma Market Revenue (US$ Mn) Market Share by Diagnostic Stagein 2022
- Figure 86: APAC Acral Lentiginous Melanoma Market Attractiveness Analysis by Diagnostic Stage, 2016-2032
- Figure 87: APAC Acral Lentiginous Melanoma Market Revenue (US$ Mn) Market Share by Treatment Modalityin 2022
- Figure 88: APAC Acral Lentiginous Melanoma Market Attractiveness Analysis by Treatment Modality, 2016-2032
- Figure 89: APAC Acral Lentiginous Melanoma Market Revenue (US$ Mn) Market Share by End Usersin 2022
- Figure 90: APAC Acral Lentiginous Melanoma Market Attractiveness Analysis by End Users, 2016-2032
- Figure 91: APAC Acral Lentiginous Melanoma Market Revenue (US$ Mn) Market Share by Country in 2022
- Figure 92: APAC Acral Lentiginous Melanoma Market Attractiveness Analysis by Country, 2016-2032
- Figure 93: APAC Acral Lentiginous Melanoma Market Revenue (US$ Mn) (2016-2032)
- Figure 94: APAC Acral Lentiginous Melanoma Market Revenue (US$ Mn) Comparison by Country (2016-2032)
- Figure 95: APAC Acral Lentiginous Melanoma Market Revenue (US$ Mn) Comparison by Diagnostic Stage (2016-2032)
- Figure 96: APAC Acral Lentiginous Melanoma Market Revenue (US$ Mn) Comparison by Treatment Modality (2016-2032)
- Figure 97: APAC Acral Lentiginous Melanoma Market Revenue (US$ Mn) Comparison by End Users (2016-2032)
- Figure 98: APAC Acral Lentiginous Melanoma Market Y-o-Y Growth Rate Comparison by Country (2016-2032)
- Figure 99: APAC Acral Lentiginous Melanoma Market Y-o-Y Growth Rate Comparison by Diagnostic Stage (2016-2032)
- Figure 100: APAC Acral Lentiginous Melanoma Market Y-o-Y Growth Rate Comparison by Treatment Modality (2016-2032)
- Figure 101: APAC Acral Lentiginous Melanoma Market Y-o-Y Growth Rate Comparison by End Users (2016-2032)
- Figure 102: APAC Acral Lentiginous Melanoma Market Share Comparison by Country (2016-2032)
- Figure 103: APAC Acral Lentiginous Melanoma Market Share Comparison by Diagnostic Stage (2016-2032)
- Figure 104: APAC Acral Lentiginous Melanoma Market Share Comparison by Treatment Modality (2016-2032)
- Figure 105: APAC Acral Lentiginous Melanoma Market Share Comparison by End Users (2016-2032)
- Figure 106: Latin America Acral Lentiginous Melanoma Market Revenue (US$ Mn) Market Share by Diagnostic Stagein 2022
- Figure 107: Latin America Acral Lentiginous Melanoma Market Attractiveness Analysis by Diagnostic Stage, 2016-2032
- Figure 108: Latin America Acral Lentiginous Melanoma Market Revenue (US$ Mn) Market Share by Treatment Modalityin 2022
- Figure 109: Latin America Acral Lentiginous Melanoma Market Attractiveness Analysis by Treatment Modality, 2016-2032
- Figure 110: Latin America Acral Lentiginous Melanoma Market Revenue (US$ Mn) Market Share by End Usersin 2022
- Figure 111: Latin America Acral Lentiginous Melanoma Market Attractiveness Analysis by End Users, 2016-2032
- Figure 112: Latin America Acral Lentiginous Melanoma Market Revenue (US$ Mn) Market Share by Country in 2022
- Figure 113: Latin America Acral Lentiginous Melanoma Market Attractiveness Analysis by Country, 2016-2032
- Figure 114: Latin America Acral Lentiginous Melanoma Market Revenue (US$ Mn) (2016-2032)
- Figure 115: Latin America Acral Lentiginous Melanoma Market Revenue (US$ Mn) Comparison by Country (2016-2032)
- Figure 116: Latin America Acral Lentiginous Melanoma Market Revenue (US$ Mn) Comparison by Diagnostic Stage (2016-2032)
- Figure 117: Latin America Acral Lentiginous Melanoma Market Revenue (US$ Mn) Comparison by Treatment Modality (2016-2032)
- Figure 118: Latin America Acral Lentiginous Melanoma Market Revenue (US$ Mn) Comparison by End Users (2016-2032)
- Figure 119: Latin America Acral Lentiginous Melanoma Market Y-o-Y Growth Rate Comparison by Country (2016-2032)
- Figure 120: Latin America Acral Lentiginous Melanoma Market Y-o-Y Growth Rate Comparison by Diagnostic Stage (2016-2032)
- Figure 121: Latin America Acral Lentiginous Melanoma Market Y-o-Y Growth Rate Comparison by Treatment Modality (2016-2032)
- Figure 122: Latin America Acral Lentiginous Melanoma Market Y-o-Y Growth Rate Comparison by End Users (2016-2032)
- Figure 123: Latin America Acral Lentiginous Melanoma Market Share Comparison by Country (2016-2032)
- Figure 124: Latin America Acral Lentiginous Melanoma Market Share Comparison by Diagnostic Stage (2016-2032)
- Figure 125: Latin America Acral Lentiginous Melanoma Market Share Comparison by Treatment Modality (2016-2032)
- Figure 126: Latin America Acral Lentiginous Melanoma Market Share Comparison by End Users (2016-2032)
- Figure 127: Middle East & Africa Acral Lentiginous Melanoma Market Revenue (US$ Mn) Market Share by Diagnostic Stagein 2022
- Figure 128: Middle East & Africa Acral Lentiginous Melanoma Market Attractiveness Analysis by Diagnostic Stage, 2016-2032
- Figure 129: Middle East & Africa Acral Lentiginous Melanoma Market Revenue (US$ Mn) Market Share by Treatment Modalityin 2022
- Figure 130: Middle East & Africa Acral Lentiginous Melanoma Market Attractiveness Analysis by Treatment Modality, 2016-2032
- Figure 131: Middle East & Africa Acral Lentiginous Melanoma Market Revenue (US$ Mn) Market Share by End Usersin 2022
- Figure 132: Middle East & Africa Acral Lentiginous Melanoma Market Attractiveness Analysis by End Users, 2016-2032
- Figure 133: Middle East & Africa Acral Lentiginous Melanoma Market Revenue (US$ Mn) Market Share by Country in 2022
- Figure 134: Middle East & Africa Acral Lentiginous Melanoma Market Attractiveness Analysis by Country, 2016-2032
- Figure 135: Middle East & Africa Acral Lentiginous Melanoma Market Revenue (US$ Mn) (2016-2032)
- Figure 136: Middle East & Africa Acral Lentiginous Melanoma Market Revenue (US$ Mn) Comparison by Country (2016-2032)
- Figure 137: Middle East & Africa Acral Lentiginous Melanoma Market Revenue (US$ Mn) Comparison by Diagnostic Stage (2016-2032)
- Figure 138: Middle East & Africa Acral Lentiginous Melanoma Market Revenue (US$ Mn) Comparison by Treatment Modality (2016-2032)
- Figure 139: Middle East & Africa Acral Lentiginous Melanoma Market Revenue (US$ Mn) Comparison by End Users (2016-2032)
- Figure 140: Middle East & Africa Acral Lentiginous Melanoma Market Y-o-Y Growth Rate Comparison by Country (2016-2032)
- Figure 141: Middle East & Africa Acral Lentiginous Melanoma Market Y-o-Y Growth Rate Comparison by Diagnostic Stage (2016-2032)
- Figure 142: Middle East & Africa Acral Lentiginous Melanoma Market Y-o-Y Growth Rate Comparison by Treatment Modality (2016-2032)
- Figure 143: Middle East & Africa Acral Lentiginous Melanoma Market Y-o-Y Growth Rate Comparison by End Users (2016-2032)
- Figure 144: Middle East & Africa Acral Lentiginous Melanoma Market Share Comparison by Country (2016-2032)
- Figure 145: Middle East & Africa Acral Lentiginous Melanoma Market Share Comparison by Diagnostic Stage (2016-2032)
- Figure 146: Middle East & Africa Acral Lentiginous Melanoma Market Share Comparison by Treatment Modality (2016-2032)
- Figure 147: Middle East & Africa Acral Lentiginous Melanoma Market Share Comparison by End Users (2016-2032)
- List of Tables
- Table 1: Global Acral Lentiginous Melanoma Market Comparison by Diagnostic Stage (2016-2032)
- Table 2: Global Acral Lentiginous Melanoma Market Comparison by Treatment Modality (2016-2032)
- Table 3: Global Acral Lentiginous Melanoma Market Comparison by End Users (2016-2032)
- Table 4: Global Acral Lentiginous Melanoma Market Revenue (US$ Mn) Comparison by Region (2016-2032)
- Table 5: Global Acral Lentiginous Melanoma Market Revenue (US$ Mn) (2016-2032)
- Table 6: Global Acral Lentiginous Melanoma Market Revenue (US$ Mn) Comparison by Region (2016-2032)
- Table 7: Global Acral Lentiginous Melanoma Market Revenue (US$ Mn) Comparison by Diagnostic Stage (2016-2032)
- Table 8: Global Acral Lentiginous Melanoma Market Revenue (US$ Mn) Comparison by Treatment Modality (2016-2032)
- Table 9: Global Acral Lentiginous Melanoma Market Revenue (US$ Mn) Comparison by End Users (2016-2032)
- Table 10: Global Acral Lentiginous Melanoma Market Y-o-Y Growth Rate Comparison by Region (2016-2032)
- Table 11: Global Acral Lentiginous Melanoma Market Y-o-Y Growth Rate Comparison by Diagnostic Stage (2016-2032)
- Table 12: Global Acral Lentiginous Melanoma Market Y-o-Y Growth Rate Comparison by Treatment Modality (2016-2032)
- Table 13: Global Acral Lentiginous Melanoma Market Y-o-Y Growth Rate Comparison by End Users (2016-2032)
- Table 14: Global Acral Lentiginous Melanoma Market Share Comparison by Region (2016-2032)
- Table 15: Global Acral Lentiginous Melanoma Market Share Comparison by Diagnostic Stage (2016-2032)
- Table 16: Global Acral Lentiginous Melanoma Market Share Comparison by Treatment Modality (2016-2032)
- Table 17: Global Acral Lentiginous Melanoma Market Share Comparison by End Users (2016-2032)
- Table 18: North America Acral Lentiginous Melanoma Market Comparison by Treatment Modality (2016-2032)
- Table 19: North America Acral Lentiginous Melanoma Market Comparison by End Users (2016-2032)
- Table 20: North America Acral Lentiginous Melanoma Market Revenue (US$ Mn) Comparison by Country (2016-2032)
- Table 21: North America Acral Lentiginous Melanoma Market Revenue (US$ Mn) (2016-2032)
- Table 22: North America Acral Lentiginous Melanoma Market Revenue (US$ Mn) Comparison by Country (2016-2032)
- Table 23: North America Acral Lentiginous Melanoma Market Revenue (US$ Mn) Comparison by Diagnostic Stage (2016-2032)
- Table 24: North America Acral Lentiginous Melanoma Market Revenue (US$ Mn) Comparison by Treatment Modality (2016-2032)
- Table 25: North America Acral Lentiginous Melanoma Market Revenue (US$ Mn) Comparison by End Users (2016-2032)
- Table 26: North America Acral Lentiginous Melanoma Market Y-o-Y Growth Rate Comparison by Country (2016-2032)
- Table 27: North America Acral Lentiginous Melanoma Market Y-o-Y Growth Rate Comparison by Diagnostic Stage (2016-2032)
- Table 28: North America Acral Lentiginous Melanoma Market Y-o-Y Growth Rate Comparison by Treatment Modality (2016-2032)
- Table 29: North America Acral Lentiginous Melanoma Market Y-o-Y Growth Rate Comparison by End Users (2016-2032)
- Table 30: North America Acral Lentiginous Melanoma Market Share Comparison by Country (2016-2032)
- Table 31: North America Acral Lentiginous Melanoma Market Share Comparison by Diagnostic Stage (2016-2032)
- Table 32: North America Acral Lentiginous Melanoma Market Share Comparison by Treatment Modality (2016-2032)
- Table 33: North America Acral Lentiginous Melanoma Market Share Comparison by End Users (2016-2032)
- Table 34: Western Europe Acral Lentiginous Melanoma Market Comparison by Diagnostic Stage (2016-2032)
- Table 35: Western Europe Acral Lentiginous Melanoma Market Comparison by Treatment Modality (2016-2032)
- Table 36: Western Europe Acral Lentiginous Melanoma Market Comparison by End Users (2016-2032)
- Table 37: Western Europe Acral Lentiginous Melanoma Market Revenue (US$ Mn) Comparison by Country (2016-2032)
- Table 38: Western Europe Acral Lentiginous Melanoma Market Revenue (US$ Mn) (2016-2032)
- Table 39: Western Europe Acral Lentiginous Melanoma Market Revenue (US$ Mn) Comparison by Country (2016-2032)
- Table 40: Western Europe Acral Lentiginous Melanoma Market Revenue (US$ Mn) Comparison by Diagnostic Stage (2016-2032)
- Table 41: Western Europe Acral Lentiginous Melanoma Market Revenue (US$ Mn) Comparison by Treatment Modality (2016-2032)
- Table 42: Western Europe Acral Lentiginous Melanoma Market Revenue (US$ Mn) Comparison by End Users (2016-2032)
- Table 43: Western Europe Acral Lentiginous Melanoma Market Y-o-Y Growth Rate Comparison by Country (2016-2032)
- Table 44: Western Europe Acral Lentiginous Melanoma Market Y-o-Y Growth Rate Comparison by Diagnostic Stage (2016-2032)
- Table 45: Western Europe Acral Lentiginous Melanoma Market Y-o-Y Growth Rate Comparison by Treatment Modality (2016-2032)
- Table 46: Western Europe Acral Lentiginous Melanoma Market Y-o-Y Growth Rate Comparison by End Users (2016-2032)
- Table 47: Western Europe Acral Lentiginous Melanoma Market Share Comparison by Country (2016-2032)
- Table 48: Western Europe Acral Lentiginous Melanoma Market Share Comparison by Diagnostic Stage (2016-2032)
- Table 49: Western Europe Acral Lentiginous Melanoma Market Share Comparison by Treatment Modality (2016-2032)
- Table 50: Western Europe Acral Lentiginous Melanoma Market Share Comparison by End Users (2016-2032)
- Table 51: Eastern Europe Acral Lentiginous Melanoma Market Comparison by Diagnostic Stage (2016-2032)
- Table 52: Eastern Europe Acral Lentiginous Melanoma Market Comparison by Treatment Modality (2016-2032)
- Table 53: Eastern Europe Acral Lentiginous Melanoma Market Comparison by End Users (2016-2032)
- Table 54: Eastern Europe Acral Lentiginous Melanoma Market Revenue (US$ Mn) Comparison by Country (2016-2032)
- Table 55: Eastern Europe Acral Lentiginous Melanoma Market Revenue (US$ Mn) (2016-2032)
- Table 56: Eastern Europe Acral Lentiginous Melanoma Market Revenue (US$ Mn) Comparison by Country (2016-2032)
- Table 57: Eastern Europe Acral Lentiginous Melanoma Market Revenue (US$ Mn) Comparison by Diagnostic Stage (2016-2032)
- Table 58: Eastern Europe Acral Lentiginous Melanoma Market Revenue (US$ Mn) Comparison by Treatment Modality (2016-2032)
- Table 59: Eastern Europe Acral Lentiginous Melanoma Market Revenue (US$ Mn) Comparison by End Users (2016-2032)
- Table 60: Eastern Europe Acral Lentiginous Melanoma Market Y-o-Y Growth Rate Comparison by Country (2016-2032)
- Table 61: Eastern Europe Acral Lentiginous Melanoma Market Y-o-Y Growth Rate Comparison by Diagnostic Stage (2016-2032)
- Table 62: Eastern Europe Acral Lentiginous Melanoma Market Y-o-Y Growth Rate Comparison by Treatment Modality (2016-2032)
- Table 63: Eastern Europe Acral Lentiginous Melanoma Market Y-o-Y Growth Rate Comparison by End Users (2016-2032)
- Table 64: Eastern Europe Acral Lentiginous Melanoma Market Share Comparison by Country (2016-2032)
- Table 65: Eastern Europe Acral Lentiginous Melanoma Market Share Comparison by Diagnostic Stage (2016-2032)
- Table 66: Eastern Europe Acral Lentiginous Melanoma Market Share Comparison by Treatment Modality (2016-2032)
- Table 67: Eastern Europe Acral Lentiginous Melanoma Market Share Comparison by End Users (2016-2032)
- Table 68: APAC Acral Lentiginous Melanoma Market Comparison by Diagnostic Stage (2016-2032)
- Table 69: APAC Acral Lentiginous Melanoma Market Comparison by Treatment Modality (2016-2032)
- Table 70: APAC Acral Lentiginous Melanoma Market Comparison by End Users (2016-2032)
- Table 71: APAC Acral Lentiginous Melanoma Market Revenue (US$ Mn) Comparison by Country (2016-2032)
- Table 72: APAC Acral Lentiginous Melanoma Market Revenue (US$ Mn) (2016-2032)
- Table 73: APAC Acral Lentiginous Melanoma Market Revenue (US$ Mn) Comparison by Country (2016-2032)
- Table 74: APAC Acral Lentiginous Melanoma Market Revenue (US$ Mn) Comparison by Diagnostic Stage (2016-2032)
- Table 75: APAC Acral Lentiginous Melanoma Market Revenue (US$ Mn) Comparison by Treatment Modality (2016-2032)
- Table 76: APAC Acral Lentiginous Melanoma Market Revenue (US$ Mn) Comparison by End Users (2016-2032)
- Table 77: APAC Acral Lentiginous Melanoma Market Y-o-Y Growth Rate Comparison by Country (2016-2032)
- Table 78: APAC Acral Lentiginous Melanoma Market Y-o-Y Growth Rate Comparison by Diagnostic Stage (2016-2032)
- Table 79: APAC Acral Lentiginous Melanoma Market Y-o-Y Growth Rate Comparison by Treatment Modality (2016-2032)
- Table 80: APAC Acral Lentiginous Melanoma Market Y-o-Y Growth Rate Comparison by End Users (2016-2032)
- Table 81: APAC Acral Lentiginous Melanoma Market Share Comparison by Country (2016-2032)
- Table 82: APAC Acral Lentiginous Melanoma Market Share Comparison by Diagnostic Stage (2016-2032)
- Table 83: APAC Acral Lentiginous Melanoma Market Share Comparison by Treatment Modality (2016-2032)
- Table 84: APAC Acral Lentiginous Melanoma Market Share Comparison by End Users (2016-2032)
- Table 85: Latin America Acral Lentiginous Melanoma Market Comparison by Diagnostic Stage (2016-2032)
- Table 86: Latin America Acral Lentiginous Melanoma Market Comparison by Treatment Modality (2016-2032)
- Table 87: Latin America Acral Lentiginous Melanoma Market Comparison by End Users (2016-2032)
- Table 88: Latin America Acral Lentiginous Melanoma Market Revenue (US$ Mn) Comparison by Country (2016-2032)
- Table 89: Latin America Acral Lentiginous Melanoma Market Revenue (US$ Mn) (2016-2032)
- Table 90: Latin America Acral Lentiginous Melanoma Market Revenue (US$ Mn) Comparison by Country (2016-2032)
- Table 91: Latin America Acral Lentiginous Melanoma Market Revenue (US$ Mn) Comparison by Diagnostic Stage (2016-2032)
- Table 92: Latin America Acral Lentiginous Melanoma Market Revenue (US$ Mn) Comparison by Treatment Modality (2016-2032)
- Table 93: Latin America Acral Lentiginous Melanoma Market Revenue (US$ Mn) Comparison by End Users (2016-2032)
- Table 94: Latin America Acral Lentiginous Melanoma Market Y-o-Y Growth Rate Comparison by Country (2016-2032)
- Table 95: Latin America Acral Lentiginous Melanoma Market Y-o-Y Growth Rate Comparison by Diagnostic Stage (2016-2032)
- Table 96: Latin America Acral Lentiginous Melanoma Market Y-o-Y Growth Rate Comparison by Treatment Modality (2016-2032)
- Table 97: Latin America Acral Lentiginous Melanoma Market Y-o-Y Growth Rate Comparison by End Users (2016-2032)
- Table 98: Latin America Acral Lentiginous Melanoma Market Share Comparison by Country (2016-2032)
- Table 99: Latin America Acral Lentiginous Melanoma Market Share Comparison by Diagnostic Stage (2016-2032)
- Table 100: Latin America Acral Lentiginous Melanoma Market Share Comparison by Treatment Modality (2016-2032)
- Table 101: Latin America Acral Lentiginous Melanoma Market Share Comparison by End Users (2016-2032)
- Table 102: Middle East & Africa Acral Lentiginous Melanoma Market Comparison by Diagnostic Stage (2016-2032)
- Table 103: Middle East & Africa Acral Lentiginous Melanoma Market Comparison by Treatment Modality (2016-2032)
- Table 104: Middle East & Africa Acral Lentiginous Melanoma Market Comparison by End Users (2016-2032)
- Table 105: Middle East & Africa Acral Lentiginous Melanoma Market Revenue (US$ Mn) Comparison by Country (2016-2032)
- Table 106: Middle East & Africa Acral Lentiginous Melanoma Market Revenue (US$ Mn) (2016-2032)
- Table 107: Middle East & Africa Acral Lentiginous Melanoma Market Revenue (US$ Mn) Comparison by Country (2016-2032)
- Table 108: Middle East & Africa Acral Lentiginous Melanoma Market Revenue (US$ Mn) Comparison by Diagnostic Stage (2016-2032)
- Table 109: Middle East & Africa Acral Lentiginous Melanoma Market Revenue (US$ Mn) Comparison by Treatment Modality (2016-2032)
- Table 110: Middle East & Africa Acral Lentiginous Melanoma Market Revenue (US$ Mn) Comparison by End Users (2016-2032)
- Table 111: Middle East & Africa Acral Lentiginous Melanoma Market Y-o-Y Growth Rate Comparison by Country (2016-2032)
- Table 112: Middle East & Africa Acral Lentiginous Melanoma Market Y-o-Y Growth Rate Comparison by Diagnostic Stage (2016-2032)
- Table 113: Middle East & Africa Acral Lentiginous Melanoma Market Y-o-Y Growth Rate Comparison by Treatment Modality (2016-2032)
- Table 114: Middle East & Africa Acral Lentiginous Melanoma Market Y-o-Y Growth Rate Comparison by End Users (2016-2032)
- Table 115: Middle East & Africa Acral Lentiginous Melanoma Market Share Comparison by Country (2016-2032)
- Table 116: Middle East & Africa Acral Lentiginous Melanoma Market Share Comparison by Diagnostic Stage (2016-2032)
- Table 117: Middle East & Africa Acral Lentiginous Melanoma Market Share Comparison by Treatment Modality (2016-2032)
- Table 118: Middle East & Africa Acral Lentiginous Melanoma Market Share Comparison by End Users (2016-2032)
- 1. Executive Summary
-
- Novartis AG
- AbbVie Inc.
- Prometheus Laboratories
- Bristol-Myers Squibb Company
- Bayer AG
- Regeneron Pharmaceuticals Inc.
- Amgen Inc.
- GlaxoSmithKline PLC
- Eli Lilly and Company
Our Clients


View Our Licence Options
