
Weight Loss Market Report By Diet Type (Meals, Beverages, Supplements), By Equipment Type (Fitness Equipment [Cardiovascular Training Equipment, Strength Training Equipment], Surgical Equipment), By Services (Fitness Centers and Health Clubs, Consulting Services, Online Weight Loss Programs, Slimming Centers, Others), By Age Group, By Gender, By Distribution Channel, By Region and Companies - Industry Segment Outlook, Market Assessment, Competition Scenario, Trends and Forecast 2024-2033
-
36168
-
Feb 2025
-
325
-


-
This report was compiled by Trishita Deb Trishita Deb is an experienced market research and consulting professional with over 7 years of expertise across healthcare, consumer goods, and materials, contributing to over 400 healthcare-related reports. Correspondence Team Lead- Healthcare Linkedin | Detailed Market research Methodology Our methodology involves a mix of primary research, including interviews with leading mental health experts, and secondary research from reputable medical journals and databases. View Detailed Methodology Page
-
Quick Navigation
Report Overview
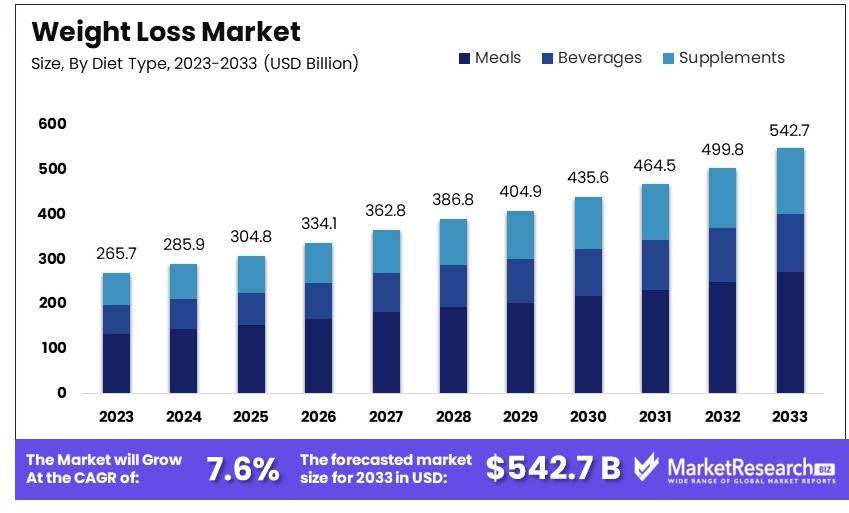
The Global Weight Loss Market size is expected to be worth around USD 542.7 Billion by 2033, from USD 265.7 Billion in 2023, growing at a CAGR of 7.6% during the forecast period from 2024 to 2033.
The weight loss market includes products and services designed to help individuals lose weight and maintain a healthy lifestyle. This market is driven by rising obesity rates and increasing health consciousness. Key players include diet planners, fitness centers, and supplement manufacturers.
The market has experienced substantial growth due to advancements in weight loss programs and products. Innovations such as personalized diet plans and fitness apps have fueled demand. Major trends include the popularity of plant-based diets and intermittent fasting. The market is competitive, with numerous options available to consumers.
The weight loss market is witnessing strong growth, driven by increasing awareness of health and fitness. Consumers are actively seeking products and programs that help them achieve and maintain a healthy weight. Weight loss products, including dietary supplements and fitness equipment, are seeing substantial international trade. The high demand for fitness equipment, particularly from China and the United States, underscores this trend. In 2022, the U.S. imported over USD 3.7 billion worth of fitness equipment, reflecting a significant global trade presence.
Programs like the Mayo Clinic Diet have gained popularity due to their structured approach to weight loss. The Mayo Clinic Diet promotes losing up to 10 pounds in the initial two weeks and then a steady 1-2 pounds per week thereafter. Such programs appeal to consumers looking for credible and manageable weight loss solutions.
The rise of e-commerce has made weight loss products more accessible, allowing consumers to purchase supplements and equipment online. This convenience has further fueled market growth. Additionally, technological advancements in fitness equipment, such as smart features and connectivity, are attracting tech-savvy consumers.
Moreover, the market is seeing innovation in dietary supplements with ingredients that claim to boost metabolism and reduce appetite. These products are marketed towards consumers looking for quick and effective weight loss solutions.
In conclusion, the weight loss market is poised for continued growth, driven by high consumer demand, international trade, and innovations in products and programs. The combination of structured diets, advanced fitness equipment, and accessible e-commerce platforms ensures a dynamic and expanding market landscape. This trend indicates a promising future for both consumers and manufacturers in the weight loss industry.
Key Takeaways
- Market Value: The Weight Loss Market was valued at USD 265.7 billion in 2023 and is expected to reach USD 542.7 billion by 2033, with a CAGR of 7.6%.
- By Diet Type Analysis: Supplements dominate by 50%; they are pivotal due to their accessibility and varied dietary support.
- By Equipment Type Analysis: Cardiovascular Training Equipment leads with 65%; essential for core fitness offerings.
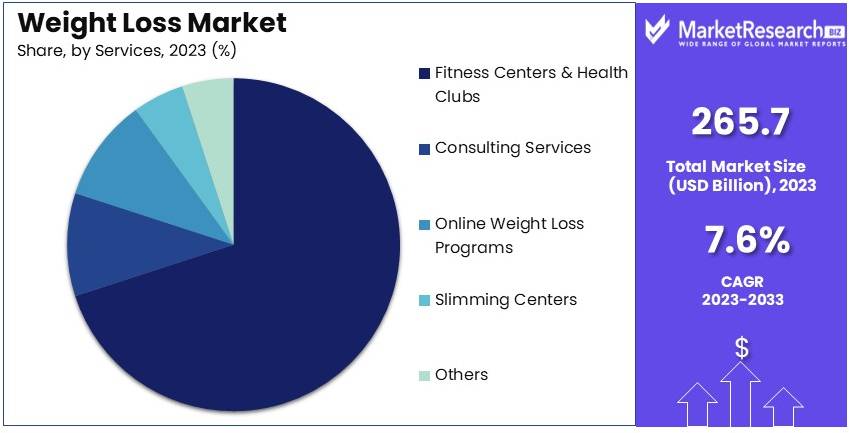
- By Services Analysis: Fitness Centers and Health Clubs take the largest share at 70%; they are central to sustainable weight management.
- By Age Group Analysis: The 31-50 years segment holds 45%; this group actively seeks weight loss solutions.
- Dominant Region: APAC dominates with 38.5%; a large population base drives demand in this region.
- Analyst Viewpoint: The Weight Loss Market shows moderate saturation with diverse competition; growth will be driven by innovative product offerings and enhanced service platforms.
- Growth Opportunities: Key players can leverage tailored fitness programs and personalized dietary supplements to differentiate and capture market share.
Driving Factors
Rising Obesity Rates and Health Awareness Drive Market Growth
The global increase in obesity rates is a significant driver for the weight loss market. According to the World Health Organization, worldwide obesity has nearly tripled since 1975, with 39% of adults overweight in 2016.
This alarming trend, coupled with growing awareness of obesity-related health risks such as diabetes, heart disease, and certain cancers, is pushing more individuals to seek weight loss & diet control solutions. For instance, the success of programs like Weight Watchers (now WW) can be attributed to this trend, with the company reporting 4.6 million subscribers in 2020. The rising obesity rates and health awareness are key factors driving demand in the weight loss market.
Technological Advancements in Fitness Tracking and Personalized Nutrition Drive Market Growth
The integration of technology into weight loss strategies has revolutionized the market. Wearable devices, smartphone apps, and AI-powered platforms are providing users with personalized fitness and clinical nutrition plans, making weight loss more accessible and engaging.
Fitbit, for example, has capitalized on this trend, selling over 120 million devices as of 2023. These technologies not only help users track their progress but also provide valuable data for companies to improve their products and services, driving further growth in the market. The combination of technological innovation and personalized health solutions is a significant growth driver in the weight loss industry.
Increasing Disposable Income and Willingness to Invest in Health Drive Market Growth
As global disposable income rises, particularly in emerging economies, more people are willing to spend on weight loss products and services. This includes gym memberships, personal training, specialized diet foods, and supplements.
For instance, the global health club industry was valued at USD 102.3 billion in 2023, with a significant portion attributed to weight loss-oriented memberships. The success of premium weight loss programs like Jenny Craig, which can cost over USD 600 per month, further illustrates consumers' willingness to invest in their health and appearance. The growing disposable income and prioritization of health expenditures are major drivers in the weight loss market.
Restraining Factors
Proliferation of Fad Diets and Skepticism Restrain Market Growth
The weight loss market is often crowded with quick-fix solutions and fad diets that promise rapid results but fail to deliver long-term success. This has led to increased consumer skepticism, making it difficult for legitimate weight loss products and services to gain trust.
For example, the Keto diet saw a massive surge in popularity, with the global keto market size reaching USD 11.2 billion in 2023. However, its sustainability and long-term health effects have been questioned by health professionals, potentially dampening consumer confidence in weight loss solutions overall.
Regulatory Challenges and Safety Concerns Restrain Market Growth
The weight loss industry faces strict regulations, particularly for dietary supplements and medical devices. Safety concerns and potential side effects of weight loss products can lead to market withdrawals and damage consumer trust.
A notable example is the FDA's ban on ephedra in dietary supplements in 2004 due to serious health risks. This significantly impacted the weight loss supplement market. Such regulatory actions and safety issues can restrain market growth and require companies to invest heavily in research and compliance.
Diet Type Analysis
Supplements dominate the diet segment of the weight loss market with a 50% share due to their convenience and effectiveness in supporting weight loss goals.
In the weight loss market, the diet type is a critical segment, consisting of meals, beverages, and supplements. Supplements lead this category, favored for their ease of use, effectiveness, and ability to provide targeted nutritional support for weight loss. These include a variety of products such as fat burners, meal replacement shakes, and metabolism boosters that help increase the efficiency of weight loss efforts.
Meals and beverages also play significant roles in the diet segment. Specialized weight loss meals often come pre-portioned and are calorie-counted to eliminate guesswork, making them a practical choice for individuals seeking structured diet plans. Beverages like iced tea, green tea and protein shakes are popular for their metabolism-boosting properties and convenience.
While supplements hold the largest market share, the growth of meal and beverage solutions continues to support the diversification of diet options available to consumers, catering to different preferences and lifestyle needs. This variety not only stimulates market growth but also helps maintain consumer interest and adherence to weight management programs.
Equipment Type Analysis
Cardiovascular training equipment leads the equipment segment with 65% due to its widespread use in both home and gym settings for effective calorie burn.
Weight loss equipment is categorized into fitness and surgical equipment, with fitness equipment further divided into cardiovascular and strength training devices. Cardiovascular training equipment, such as treadmills, stationary bikes, and ellipticals, occupies the dominant position in this segment. This equipment is favored for its efficiency in burning calories and enhancing cardiovascular health, making it a staple in both home and commercial gym settings.
Strength training equipment is also integral to weight loss and fitness regimens, aiding in muscle building and metabolic rate enhancement. Surgical weight loss equipment, including minimally invasive and non-invasive devices, caters to a niche market that opts for surgical interventions after conservative methods have failed.
The dominance of cardiovascular equipment is crucial as it addresses the broad needs of the market, from casual fitness enthusiasts to serious athletes, contributing significantly to the overall growth of the weight loss equipment market.
Services Analysis
Fitness centers and health clubs are the most utilized services in the weight loss industry, holding a 70% market share.
The services segment of the weight loss market includes fitness centers, health clubs, consulting services, online programs, and slimming centers. Fitness centers and health clubs lead this segment, providing an environment that supports a variety of weight loss activities and programs. These facilities often offer a range of services from group fitness classes and personal training to nutrition planning and wellness consultations.
Online weight loss programs are increasingly popular, offering convenience and accessibility for users with busy schedules or limited access to traditional fitness venues. Consulting services and slimming centers offer more personalized solutions, focusing on bespoke diet and exercise regimens tailored to individual needs.
The robust presence of fitness centers and health clubs is essential for market growth, providing a foundational element that supports the ongoing demand for weight loss services and encouraging sustained engagement in health and fitness activities.
Age Group Analysis
The 31-50 years age group dominates the weight loss market with 45%, driven by their higher disposable income and investment in health and wellness.
Weight loss efforts are significant across various age groups, but the 31-50 years segment stands out due to its combination of health awareness and economic capability. This age group typically has more disposable income and is at a stage where health concerns begin to increase, motivating a stronger commitment to weight loss and management.
Younger individuals (below 18 years) and those in the 18-30 years range are also key segments, often driven by aesthetic goals or the desire for a healthier lifestyle. The above 50 years age group focuses on weight loss primarily for health reasons, particularly to mitigate age-related conditions.
The market influence of the 31-50 years age group underscores the importance of targeted marketing and product development that addresses the specific health and lifestyle needs of this demographic, supporting sustained growth and diversification of the weight loss market.
Key Market Segments
By Diet Type
- Meals
- Beverages
- Supplements
By Equipment Type
- Fitness Equipment
- Cardiovascular Training Equipment
- Strength Training Equipment
- Surgical Equipment
- Minimally Invasive/Bariatric Equipment
- Non-Invasive Equipment
By Services
- Fitness Centers and Health Clubs
- Consulting Services
- Online Weight Loss Programs
- Slimming Centers
- Others
By Age Group
- Below 18 Years
- 18-30 Years
- 31-50 Years
- Above 50 Years
By Gender
- Male
- Female
By Distribution Channel
- Online Stores
- Offline Stores
- Hypermarkets/Supermarkets
- Specialty Stores
- Pharmacy Stores
- Others
Growth Opportunities
Personalized Nutrition and Genetic Testing Offer Growth Opportunity
The integration of genetic testing and personalized nutrition plans represents a significant growth opportunity in the weight loss market. Companies offering DNA-based diet recommendations are gaining traction, as they promise more effective, individualized weight loss solutions.
For example, DNAfit provides genetic testing that informs personalized diet and exercise plans. This trend towards hyper-personalization is likely to continue, with the global personalized nutrition market expected to reach USD 18.6 billion by 2027. Personalized nutrition can enhance the effectiveness of weight loss programs, appealing to consumers seeking tailored solutions.
Virtual and Augmented Reality Fitness Experiences Offer Growth Opportunity
The rise of VR and AR technologies presents an opportunity to create immersive, engaging weight loss experiences. These technologies can make exercise more enjoyable and accessible, potentially increasing adherence to fitness routines.
For instance, VR fitness games like "Beat Saber" have gained popularity, with Meta reporting that people have burned an estimated 200 billion calories playing VR games. This trend is likely to grow as VR technology becomes more affordable and widespread. The use of VR and AR in fitness can drive new engagement levels in weight loss programs, offering significant market growth potential.
Trending Factors
AI and Machine Learning for Predictive Weight Loss Are Trending Factors
The use of AI and machine learning to predict weight loss outcomes and provide more accurate, personalized recommendations is a growing trend. These technologies can analyze vast amounts of user data to identify patterns and optimize weight loss strategies.
For example, the AI-powered app Lark uses machine learning to provide personalized coaching and has partnered with 23andMe to incorporate genetic data into its recommendations. This trend towards personalized health solutions offers more effective weight loss plans, catering to individuals' specific needs and preferences, and driving market growth through innovative, tech-driven approaches.
Mindfulness and Mental Health Integration Are Trending Factors
There is a growing trend towards integrating mindfulness and mental health support into weight loss programs. This holistic approach addresses the psychological aspects of weight loss, potentially improving long-term success rates.
Meditation apps like Headspace have partnered with weight loss companies to offer mental health support, indicating the market's move towards more comprehensive solutions. By incorporating mental well-being into weight loss programs, companies can offer more effective and sustainable solutions, appealing to consumers looking for a balanced approach to health and wellness.
Regional Analysis
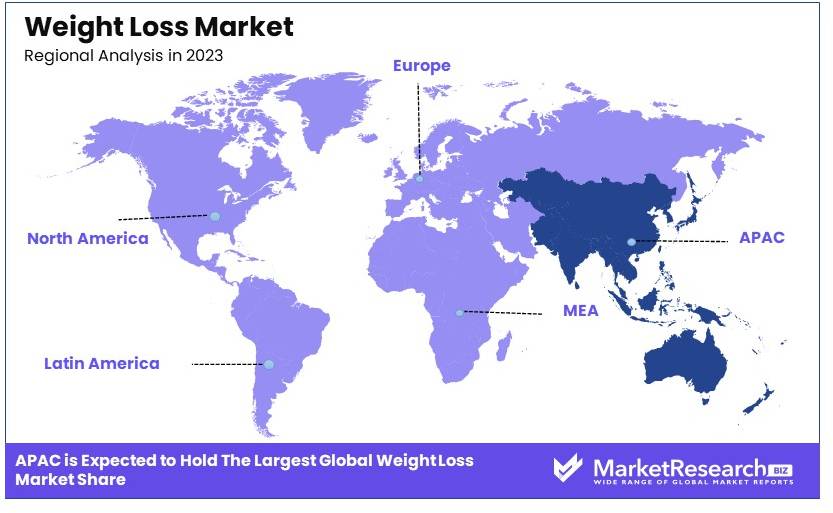
APAC Dominates with 38.5% Market Share in the Weight Loss Market
Asia-Pacific (APAC) commands a 38.5% share of the global weight loss market, driven by increasing health awareness and a growing middle class with disposable income. Factors such as rising obesity rates and the prevalence of lifestyle diseases have heightened the demand for weight management solutions. Additionally, cultural shifts towards Western dietary habits and fitness trends contribute to the expanding market.
The region benefits from diverse weight loss and management approaches, including traditional remedies, modern dietary supplements, and technological interventions like fitness apps. APAC's strong manufacturing base for dietary supplements and fitness equipment also supports its market dominance. Furthermore, government initiatives aimed at curbing obesity rates and promoting healthier lifestyles boost the market.
The future of APAC in the weight loss market looks promising. Continued economic growth and urbanization are expected to further drive the demand for weight management products and services. Innovations in personalized diet and fitness plans, fueled by advances in technology and data analytics, are likely to attract a larger consumer base, reinforcing APAC’s leadership in the market.
Regional Market Shares:
- North America: Holds about 35% of the market, driven by high health-conscious consumer behavior and advanced healthcare infrastructure focusing on preventive health measures.
- Europe: With approximately 20% of the market, Europe's growth is supported by increasing government policies aimed at reducing obesity levels and a strong presence of fitness and wellness centers.
- Middle East & Africa: This region captures around 3% of the market. While relatively smaller, the market is growing due to increasing urbanization and awareness of health issues related to weight gain.
- Latin America: Accounts for roughly 4% of the global market. Growth in this region is driven by improving economic conditions and a rising middle class that is increasingly adopting health and fitness regimes.
Key Regions and Countries
- North America
- The US
- Canada
- Mexico
- Western Europe
- Germany
- France
- The UK
- Spain
- Italy
- Portugal
- Ireland
- Austria
- Switzerland
- Benelux
- Nordic
- Rest of Western Europe
- Eastern Europe
- Russia
- Poland
- The Czech Republic
- Greece
- Rest of Eastern Europe
- APAC
- China
- Japan
- South Korea
- India
- Australia & New Zealand
- Indonesia
- Malaysia
- Philippines
- Singapore
- Thailand
- Vietnam
- Rest of APAC
- Latin America
- Brazil
- Colombia
- Chile
- Argentina
- Costa Rica
- Rest of Latin America
- Middle East & Africa
- Algeria
- Egypt
- Israel
- Kuwait
- Nigeria
- Saudi Arabia
- South Africa
- Turkey
- United Arab Emirates
- Rest of MEA
Key Players Analysis
The weight loss market comprises several key players known for their impact and strategic positioning. Atkins Nutritionals, Inc. and Nutrisystem, Inc. lead with structured diet plans and meal replacements that appeal to consumers seeking convenience and effectiveness.
Weight Watchers International, Inc. utilizes a community-based approach, leveraging technology for personalized coaching. Herbalife Nutrition Ltd. and The Kellogg Company offer a wide range of nutritional products, focusing on protein-rich and low-calorie options.
Nestle SA and Kraft Heinz Company integrate weight management products into their extensive food portfolios. Jenny Craig, Inc. and SlimFast provide comprehensive weight loss programs, combining meal plans with support services.
Medifast, Inc. and Glanbia plc emphasize scientifically backed products, targeting health-conscious consumers. Amway Corporation and VLCC Health Care Limited leverage their direct selling models to reach a broad audience. GNC Holdings, Inc. and Beachbody, LLC focus on supplements and fitness programs, respectively.
These companies drive market growth through diverse product offerings, strategic partnerships, and innovative marketing approaches.
Market Key Players
- Atkins Nutritionals, Inc.
- Nutrisystem, Inc.
- Weight Watchers International, Inc.
- Herbalife Nutrition Ltd.
- The Kellogg Company
- Nestle
- Kraft Heinz Company
- Jenny Craig, Inc.
- SlimFast
- Medifast, Inc.
- Glanbia plc
- Amway Corporation
- VLCC Health Care Limited
- GNC Holdings, Inc.
- Beachbody, LLC
Recent Developments
2024: The Mayo Clinic Diet has been ranked as the number one commercial weight loss program in the "Best Diets Overall" category by U.S. News & World Report for 2024. This program emphasizes a balanced approach to food, sleep, exercise, and emotional health, and includes digital tools to help users track their food intake and discover nutritional information. It is designed to promote sustainable weight loss through lifelong healthy habits.
2024: KOS has introduced the Show Me the Greens Powder, a dietary supplement designed to support weight loss by promoting gut health. The powder includes a blend of organic superfoods and probiotics, aiming to enhance digestion and nutrient absorption, which are crucial for effective weight management. It is certified organic, non-GMO, and vegan, offering a low-calorie option for those looking to supplement their diet.
Report Scope
Report Features Description Market Value (2023) USD 265.7 Billion Forecast Revenue (2033) USD 542.7 Billion CAGR (2024-2033) 7.6% Base Year for Estimation 2023 Historic Period 2018-2023 Forecast Period 2024-2033 Report Coverage Revenue Forecast, Market Dynamics, Competitive Landscape, Recent Developments Segments Covered By Diet Type (Meals, Beverages, Supplements), By Equipment Type (Fitness Equipment [Cardiovascular Training Equipment, Strength Training Equipment], Surgical Equipment [Minimally Invasive/Bariatric Equipment, Non-Invasive Equipment]), By Services (Fitness Centers and Health Clubs, Consulting Services, Online Weight Loss Programs, Slimming Centers, Others), By Age Group (Below 18 Years, 18-30 Years, 31-50 Years, Above 50 Years), By Gender (Male, Female), By Distribution Channel (Online Stores, Offline Stores [Hypermarkets/Supermarkets, Specialty Stores, Pharmacy Stores, Others]) Regional Analysis North America - The US, Canada, & Mexico; Western Europe - Germany, France, The UK, Spain, Italy, Portugal, Ireland, Austria, Switzerland, Benelux, Nordic, & Rest of Western Europe; Eastern Europe - Russia, Poland, The Czech Republic, Greece, & Rest of Eastern Europe; APAC - China, Japan, South Korea, India, Australia & New Zealand, Indonesia, Malaysia, Philippines, Singapore, Thailand, Vietnam, & Rest of APAC; Latin America - Brazil, Colombia, Chile, Argentina, Costa Rica, & Rest of Latin America; Middle East & Africa - Algeria, Egypt, Israel, Kuwait, Nigeria, Saudi Arabia, South Africa, Turkey, United Arab Emirates, & Rest of MEA Competitive Landscape Atkins Nutritionals, Inc., Nutrisystem, Inc., Weight Watchers International, Inc., Herbalife Nutrition Ltd., The Kellogg Company, Nestle SA, Kraft Heinz Company, Jenny Craig, Inc., SlimFast, Medifast, Inc., Glanbia plc, Amway Corporation, VLCC Health Care Limited, GNC Holdings, Inc., Beachbody, LLC Customization Scope Customization for segments, region/country-level will be provided. Moreover, additional customization can be done based on the requirements. Purchase Options We have three licenses to opt for: Single User License, Multi-User License (Up to 5 Users), Corporate Use License (Unlimited User and Printable PDF) -
- 1. Executive Summary
- 1.1. Definition
- 1.2. Taxonomy
- 1.3. Research Scope
- 1.4. Key Analysis
- 1.5. Key Findings by Major Segments
- 1.6. Top strategies by Major Players
- 2. Global Weight Loss Market Overview
- 2.1. Weight Loss Market Dynamics
- 2.1.1. Drivers
- 2.1.2. Opportunities
- 2.1.3. Restraints
- 2.1.4. Challenges
- 2.2. Macro-economic Factors
- 2.3. Regulatory Framework
- 2.4. Market Investment Feasibility Index
- 2.5. PEST Analysis
- 2.6. PORTER’S Five Force Analysis
- 2.7. Drivers & Restraints Impact Analysis
- 2.8. Industry Chain Analysis
- 2.9. Cost Structure Analysis
- 2.10. Marketing Strategy
- 2.11. Russia-Ukraine War Impact Analysis
- 2.12. Opportunity Map Analysis
- 2.13. Market Competition Scenario Analysis
- 2.14. Product Life Cycle Analysis
- 2.15. Opportunity Orbits
- 2.16. Manufacturer Intensity Map
- 2.17. Major Companies sales by Value & Volume
- 2.1. Weight Loss Market Dynamics
- 3. Global Weight Loss Market Analysis, Opportunity and Forecast, 2016-2032
- 3.1. Global Weight Loss Market Analysis, 2016-2021
- 3.2. Global Weight Loss Market Opportunity and Forecast, 2023-2032
- 3.3. Global Weight Loss Market Analysis, Opportunity and Forecast, By Diet Type, 2016-2032
- 3.3.1. Global Weight Loss Market Analysis by Diet Type: Introduction
- 3.3.2. Market Size Absolute $ Opportunity Analysis and Forecast, By Diet Type, 2016-2032
- 3.3.3. Meals
- 3.3.4. Beverages
- 3.3.5. Supplements
- 3.4. Global Weight Loss Market Analysis, Opportunity and Forecast, By Equipment Type, 2016-2032
- 3.4.1. Global Weight Loss Market Analysis by Equipment Type: Introduction
- 3.4.2. Market Size Absolute $ Opportunity Analysis and Forecast, By Equipment Type, 2016-2032
- 3.4.3. Fitness Equipment
- 3.4.4. Surgical Equipment
- 3.5. Global Weight Loss Market Analysis, Opportunity and Forecast, By Services, 2016-2032
- 3.5.1. Global Weight Loss Market Analysis by Services: Introduction
- 3.5.2. Market Size Absolute $ Opportunity Analysis and Forecast, By Services, 2016-2032
- 3.5.3. Fitness Centers and Health Clubs
- 3.5.4. Consulting Services
- 3.5.5. Online Weight Loss Programs
- 3.5.6. Slimming Centers
- 3.5.7. Others
- 3.6. Global Weight Loss Market Analysis, Opportunity and Forecast, By Age Group, 2016-2032
- 3.6.1. Global Weight Loss Market Analysis by Age Group: Introduction
- 3.6.2. Market Size Absolute $ Opportunity Analysis and Forecast, By Age Group, 2016-2032
- 3.6.3. Below 18 Years
- 3.6.4. 18-30 Years
- 3.6.5. 31-50 Years
- 3.6.6. Above 50 Years
- 3.7. Global Weight Loss Market Analysis, Opportunity and Forecast, By Gender, 2016-2032
- 3.7.1. Global Weight Loss Market Analysis by Gender: Introduction
- 3.7.2. Market Size Absolute $ Opportunity Analysis and Forecast, By Gender, 2016-2032
- 3.7.3. Male
- 3.7.4. Female
- 3.8. Global Weight Loss Market Analysis, Opportunity and Forecast, By Distribution Channel, 2016-2032
- 3.8.1. Global Weight Loss Market Analysis by Distribution Channel: Introduction
- 3.8.2. Market Size Absolute $ Opportunity Analysis and Forecast, By Distribution Channel, 2016-2032
- 3.8.3. Online Stores
- 3.8.4. Offline Stores
- 4. North America Weight Loss Market Analysis, Opportunity and Forecast, 2016-2032
- 4.1. North America Weight Loss Market Analysis, 2016-2021
- 4.2. North America Weight Loss Market Opportunity and Forecast, 2023-2032
- 4.3. North America Weight Loss Market Analysis, Opportunity and Forecast, By Diet Type, 2016-2032
- 4.3.1. North America Weight Loss Market Analysis by Diet Type: Introduction
- 4.3.2. Market Size Absolute $ Opportunity Analysis and Forecast, By Diet Type, 2016-2032
- 4.3.3. Meals
- 4.3.4. Beverages
- 4.3.5. Supplements
- 4.4. North America Weight Loss Market Analysis, Opportunity and Forecast, By Equipment Type, 2016-2032
- 4.4.1. North America Weight Loss Market Analysis by Equipment Type: Introduction
- 4.4.2. Market Size Absolute $ Opportunity Analysis and Forecast, By Equipment Type, 2016-2032
- 4.4.3. Fitness Equipment
- 4.4.4. Surgical Equipment
- 4.5. North America Weight Loss Market Analysis, Opportunity and Forecast, By Services, 2016-2032
- 4.5.1. North America Weight Loss Market Analysis by Services: Introduction
- 4.5.2. Market Size Absolute $ Opportunity Analysis and Forecast, By Services, 2016-2032
- 4.5.3. Fitness Centers and Health Clubs
- 4.5.4. Consulting Services
- 4.5.5. Online Weight Loss Programs
- 4.5.6. Slimming Centers
- 4.5.7. Others
- 4.6. North America Weight Loss Market Analysis, Opportunity and Forecast, By Age Group, 2016-2032
- 4.6.1. North America Weight Loss Market Analysis by Age Group: Introduction
- 4.6.2. Market Size Absolute $ Opportunity Analysis and Forecast, By Age Group, 2016-2032
- 4.6.3. Below 18 Years
- 4.6.4. 18-30 Years
- 4.6.5. 31-50 Years
- 4.6.6. Above 50 Years
- 4.7. North America Weight Loss Market Analysis, Opportunity and Forecast, By Gender, 2016-2032
- 4.7.1. North America Weight Loss Market Analysis by Gender: Introduction
- 4.7.2. Market Size Absolute $ Opportunity Analysis and Forecast, By Gender, 2016-2032
- 4.7.3. Male
- 4.7.4. Female
- 4.8. North America Weight Loss Market Analysis, Opportunity and Forecast, By Distribution Channel, 2016-2032
- 4.8.1. North America Weight Loss Market Analysis by Distribution Channel: Introduction
- 4.8.2. Market Size Absolute $ Opportunity Analysis and Forecast, By Distribution Channel, 2016-2032
- 4.8.3. Online Stores
- 4.8.4. Offline Stores
- 4.9. North America Weight Loss Market Analysis, Opportunity and Forecast, By Country , 2016-2032
- 4.9.1. North America Weight Loss Market Analysis by Country : Introduction
- 4.9.2. Market Size Absolute $ Opportunity Analysis and Forecast, Country , 2016-2032
- 4.9.2.1. The US
- 4.9.2.2. Canada
- 4.9.2.3. Mexico
- 5. Western Europe Weight Loss Market Analysis, Opportunity and Forecast, 2016-2032
- 5.1. Western Europe Weight Loss Market Analysis, 2016-2021
- 5.2. Western Europe Weight Loss Market Opportunity and Forecast, 2023-2032
- 5.3. Western Europe Weight Loss Market Analysis, Opportunity and Forecast, By Diet Type, 2016-2032
- 5.3.1. Western Europe Weight Loss Market Analysis by Diet Type: Introduction
- 5.3.2. Market Size Absolute $ Opportunity Analysis and Forecast, By Diet Type, 2016-2032
- 5.3.3. Meals
- 5.3.4. Beverages
- 5.3.5. Supplements
- 5.4. Western Europe Weight Loss Market Analysis, Opportunity and Forecast, By Equipment Type, 2016-2032
- 5.4.1. Western Europe Weight Loss Market Analysis by Equipment Type: Introduction
- 5.4.2. Market Size Absolute $ Opportunity Analysis and Forecast, By Equipment Type, 2016-2032
- 5.4.3. Fitness Equipment
- 5.4.4. Surgical Equipment
- 5.5. Western Europe Weight Loss Market Analysis, Opportunity and Forecast, By Services, 2016-2032
- 5.5.1. Western Europe Weight Loss Market Analysis by Services: Introduction
- 5.5.2. Market Size Absolute $ Opportunity Analysis and Forecast, By Services, 2016-2032
- 5.5.3. Fitness Centers and Health Clubs
- 5.5.4. Consulting Services
- 5.5.5. Online Weight Loss Programs
- 5.5.6. Slimming Centers
- 5.5.7. Others
- 5.6. Western Europe Weight Loss Market Analysis, Opportunity and Forecast, By Age Group, 2016-2032
- 5.6.1. Western Europe Weight Loss Market Analysis by Age Group: Introduction
- 5.6.2. Market Size Absolute $ Opportunity Analysis and Forecast, By Age Group, 2016-2032
- 5.6.3. Below 18 Years
- 5.6.4. 18-30 Years
- 5.6.5. 31-50 Years
- 5.6.6. Above 50 Years
- 5.7. Western Europe Weight Loss Market Analysis, Opportunity and Forecast, By Gender, 2016-2032
- 5.7.1. Western Europe Weight Loss Market Analysis by Gender: Introduction
- 5.7.2. Market Size Absolute $ Opportunity Analysis and Forecast, By Gender, 2016-2032
- 5.7.3. Male
- 5.7.4. Female
- 5.8. Western Europe Weight Loss Market Analysis, Opportunity and Forecast, By Distribution Channel, 2016-2032
- 5.8.1. Western Europe Weight Loss Market Analysis by Distribution Channel: Introduction
- 5.8.2. Market Size Absolute $ Opportunity Analysis and Forecast, By Distribution Channel, 2016-2032
- 5.8.3. Online Stores
- 5.8.4. Offline Stores
- 5.9. Western Europe Weight Loss Market Analysis, Opportunity and Forecast, By Country , 2016-2032
- 5.9.1. Western Europe Weight Loss Market Analysis by Country : Introduction
- 5.9.2. Market Size Absolute $ Opportunity Analysis and Forecast, Country , 2016-2032
- 5.9.2.1. Germany
- 5.9.2.2. France
- 5.9.2.3. The UK
- 5.9.2.4. Spain
- 5.9.2.5. Italy
- 5.9.2.6. Portugal
- 5.9.2.7. Ireland
- 5.9.2.8. Austria
- 5.9.2.9. Switzerland
- 5.9.2.10. Benelux
- 5.9.2.11. Nordic
- 5.9.2.12. Rest of Western Europe
- 6. Eastern Europe Weight Loss Market Analysis, Opportunity and Forecast, 2016-2032
- 6.1. Eastern Europe Weight Loss Market Analysis, 2016-2021
- 6.2. Eastern Europe Weight Loss Market Opportunity and Forecast, 2023-2032
- 6.3. Eastern Europe Weight Loss Market Analysis, Opportunity and Forecast, By Diet Type, 2016-2032
- 6.3.1. Eastern Europe Weight Loss Market Analysis by Diet Type: Introduction
- 6.3.2. Market Size Absolute $ Opportunity Analysis and Forecast, By Diet Type, 2016-2032
- 6.3.3. Meals
- 6.3.4. Beverages
- 6.3.5. Supplements
- 6.4. Eastern Europe Weight Loss Market Analysis, Opportunity and Forecast, By Equipment Type, 2016-2032
- 6.4.1. Eastern Europe Weight Loss Market Analysis by Equipment Type: Introduction
- 6.4.2. Market Size Absolute $ Opportunity Analysis and Forecast, By Equipment Type, 2016-2032
- 6.4.3. Fitness Equipment
- 6.4.4. Surgical Equipment
- 6.5. Eastern Europe Weight Loss Market Analysis, Opportunity and Forecast, By Services, 2016-2032
- 6.5.1. Eastern Europe Weight Loss Market Analysis by Services: Introduction
- 6.5.2. Market Size Absolute $ Opportunity Analysis and Forecast, By Services, 2016-2032
- 6.5.3. Fitness Centers and Health Clubs
- 6.5.4. Consulting Services
- 6.5.5. Online Weight Loss Programs
- 6.5.6. Slimming Centers
- 6.5.7. Others
- 6.6. Eastern Europe Weight Loss Market Analysis, Opportunity and Forecast, By Age Group, 2016-2032
- 6.6.1. Eastern Europe Weight Loss Market Analysis by Age Group: Introduction
- 6.6.2. Market Size Absolute $ Opportunity Analysis and Forecast, By Age Group, 2016-2032
- 6.6.3. Below 18 Years
- 6.6.4. 18-30 Years
- 6.6.5. 31-50 Years
- 6.6.6. Above 50 Years
- 6.7. Eastern Europe Weight Loss Market Analysis, Opportunity and Forecast, By Gender, 2016-2032
- 6.7.1. Eastern Europe Weight Loss Market Analysis by Gender: Introduction
- 6.7.2. Market Size Absolute $ Opportunity Analysis and Forecast, By Gender, 2016-2032
- 6.7.3. Male
- 6.7.4. Female
- 6.8. Eastern Europe Weight Loss Market Analysis, Opportunity and Forecast, By Distribution Channel, 2016-2032
- 6.8.1. Eastern Europe Weight Loss Market Analysis by Distribution Channel: Introduction
- 6.8.2. Market Size Absolute $ Opportunity Analysis and Forecast, By Distribution Channel, 2016-2032
- 6.8.3. Online Stores
- 6.8.4. Offline Stores
- 6.9. Eastern Europe Weight Loss Market Analysis, Opportunity and Forecast, By Country , 2016-2032
- 6.9.1. Eastern Europe Weight Loss Market Analysis by Country : Introduction
- 6.9.2. Market Size Absolute $ Opportunity Analysis and Forecast, Country , 2016-2032
- 6.9.2.1. Russia
- 6.9.2.2. Poland
- 6.9.2.3. The Czech Republic
- 6.9.2.4. Greece
- 6.9.2.5. Rest of Eastern Europe
- 7. APAC Weight Loss Market Analysis, Opportunity and Forecast, 2016-2032
- 7.1. APAC Weight Loss Market Analysis, 2016-2021
- 7.2. APAC Weight Loss Market Opportunity and Forecast, 2023-2032
- 7.3. APAC Weight Loss Market Analysis, Opportunity and Forecast, By Diet Type, 2016-2032
- 7.3.1. APAC Weight Loss Market Analysis by Diet Type: Introduction
- 7.3.2. Market Size Absolute $ Opportunity Analysis and Forecast, By Diet Type, 2016-2032
- 7.3.3. Meals
- 7.3.4. Beverages
- 7.3.5. Supplements
- 7.4. APAC Weight Loss Market Analysis, Opportunity and Forecast, By Equipment Type, 2016-2032
- 7.4.1. APAC Weight Loss Market Analysis by Equipment Type: Introduction
- 7.4.2. Market Size Absolute $ Opportunity Analysis and Forecast, By Equipment Type, 2016-2032
- 7.4.3. Fitness Equipment
- 7.4.4. Surgical Equipment
- 7.5. APAC Weight Loss Market Analysis, Opportunity and Forecast, By Services, 2016-2032
- 7.5.1. APAC Weight Loss Market Analysis by Services: Introduction
- 7.5.2. Market Size Absolute $ Opportunity Analysis and Forecast, By Services, 2016-2032
- 7.5.3. Fitness Centers and Health Clubs
- 7.5.4. Consulting Services
- 7.5.5. Online Weight Loss Programs
- 7.5.6. Slimming Centers
- 7.5.7. Others
- 7.6. APAC Weight Loss Market Analysis, Opportunity and Forecast, By Age Group, 2016-2032
- 7.6.1. APAC Weight Loss Market Analysis by Age Group: Introduction
- 7.6.2. Market Size Absolute $ Opportunity Analysis and Forecast, By Age Group, 2016-2032
- 7.6.3. Below 18 Years
- 7.6.4. 18-30 Years
- 7.6.5. 31-50 Years
- 7.6.6. Above 50 Years
- 7.7. APAC Weight Loss Market Analysis, Opportunity and Forecast, By Gender, 2016-2032
- 7.7.1. APAC Weight Loss Market Analysis by Gender: Introduction
- 7.7.2. Market Size Absolute $ Opportunity Analysis and Forecast, By Gender, 2016-2032
- 7.7.3. Male
- 7.7.4. Female
- 7.8. APAC Weight Loss Market Analysis, Opportunity and Forecast, By Distribution Channel, 2016-2032
- 7.8.1. APAC Weight Loss Market Analysis by Distribution Channel: Introduction
- 7.8.2. Market Size Absolute $ Opportunity Analysis and Forecast, By Distribution Channel, 2016-2032
- 7.8.3. Online Stores
- 7.8.4. Offline Stores
- 7.9. APAC Weight Loss Market Analysis, Opportunity and Forecast, By Country , 2016-2032
- 7.9.1. APAC Weight Loss Market Analysis by Country : Introduction
- 7.9.2. Market Size Absolute $ Opportunity Analysis and Forecast, Country , 2016-2032
- 7.9.2.1. China
- 7.9.2.2. Japan
- 7.9.2.3. South Korea
- 7.9.2.4. India
- 7.9.2.5. Australia & New Zeland
- 7.9.2.6. Indonesia
- 7.9.2.7. Malaysia
- 7.9.2.8. Philippines
- 7.9.2.9. Singapore
- 7.9.2.10. Thailand
- 7.9.2.11. Vietnam
- 7.9.2.12. Rest of APAC
- 8. Latin America Weight Loss Market Analysis, Opportunity and Forecast, 2016-2032
- 8.1. Latin America Weight Loss Market Analysis, 2016-2021
- 8.2. Latin America Weight Loss Market Opportunity and Forecast, 2023-2032
- 8.3. Latin America Weight Loss Market Analysis, Opportunity and Forecast, By Diet Type, 2016-2032
- 8.3.1. Latin America Weight Loss Market Analysis by Diet Type: Introduction
- 8.3.2. Market Size Absolute $ Opportunity Analysis and Forecast, By Diet Type, 2016-2032
- 8.3.3. Meals
- 8.3.4. Beverages
- 8.3.5. Supplements
- 8.4. Latin America Weight Loss Market Analysis, Opportunity and Forecast, By Equipment Type, 2016-2032
- 8.4.1. Latin America Weight Loss Market Analysis by Equipment Type: Introduction
- 8.4.2. Market Size Absolute $ Opportunity Analysis and Forecast, By Equipment Type, 2016-2032
- 8.4.3. Fitness Equipment
- 8.4.4. Surgical Equipment
- 8.5. Latin America Weight Loss Market Analysis, Opportunity and Forecast, By Services, 2016-2032
- 8.5.1. Latin America Weight Loss Market Analysis by Services: Introduction
- 8.5.2. Market Size Absolute $ Opportunity Analysis and Forecast, By Services, 2016-2032
- 8.5.3. Fitness Centers and Health Clubs
- 8.5.4. Consulting Services
- 8.5.5. Online Weight Loss Programs
- 8.5.6. Slimming Centers
- 8.5.7. Others
- 8.6. Latin America Weight Loss Market Analysis, Opportunity and Forecast, By Age Group, 2016-2032
- 8.6.1. Latin America Weight Loss Market Analysis by Age Group: Introduction
- 8.6.2. Market Size Absolute $ Opportunity Analysis and Forecast, By Age Group, 2016-2032
- 8.6.3. Below 18 Years
- 8.6.4. 18-30 Years
- 8.6.5. 31-50 Years
- 8.6.6. Above 50 Years
- 8.7. Latin America Weight Loss Market Analysis, Opportunity and Forecast, By Gender, 2016-2032
- 8.7.1. Latin America Weight Loss Market Analysis by Gender: Introduction
- 8.7.2. Market Size Absolute $ Opportunity Analysis and Forecast, By Gender, 2016-2032
- 8.7.3. Male
- 8.7.4. Female
- 8.8. Latin America Weight Loss Market Analysis, Opportunity and Forecast, By Distribution Channel, 2016-2032
- 8.8.1. Latin America Weight Loss Market Analysis by Distribution Channel: Introduction
- 8.8.2. Market Size Absolute $ Opportunity Analysis and Forecast, By Distribution Channel, 2016-2032
- 8.8.3. Online Stores
- 8.8.4. Offline Stores
- 8.9. Latin America Weight Loss Market Analysis, Opportunity and Forecast, By Country , 2016-2032
- 8.9.1. Latin America Weight Loss Market Analysis by Country : Introduction
- 8.9.2. Market Size Absolute $ Opportunity Analysis and Forecast, Country , 2016-2032
- 8.9.2.1. Brazil
- 8.9.2.2. Colombia
- 8.9.2.3. Chile
- 8.9.2.4. Argentina
- 8.9.2.5. Costa Rica
- 8.9.2.6. Rest of Latin America
- 9. Middle East & Africa Weight Loss Market Analysis, Opportunity and Forecast, 2016-2032
- 9.1. Middle East & Africa Weight Loss Market Analysis, 2016-2021
- 9.2. Middle East & Africa Weight Loss Market Opportunity and Forecast, 2023-2032
- 9.3. Middle East & Africa Weight Loss Market Analysis, Opportunity and Forecast, By Diet Type, 2016-2032
- 9.3.1. Middle East & Africa Weight Loss Market Analysis by Diet Type: Introduction
- 9.3.2. Market Size Absolute $ Opportunity Analysis and Forecast, By Diet Type, 2016-2032
- 9.3.3. Meals
- 9.3.4. Beverages
- 9.3.5. Supplements
- 9.4. Middle East & Africa Weight Loss Market Analysis, Opportunity and Forecast, By Equipment Type, 2016-2032
- 9.4.1. Middle East & Africa Weight Loss Market Analysis by Equipment Type: Introduction
- 9.4.2. Market Size Absolute $ Opportunity Analysis and Forecast, By Equipment Type, 2016-2032
- 9.4.3. Fitness Equipment
- 9.4.4. Surgical Equipment
- 9.5. Middle East & Africa Weight Loss Market Analysis, Opportunity and Forecast, By Services, 2016-2032
- 9.5.1. Middle East & Africa Weight Loss Market Analysis by Services: Introduction
- 9.5.2. Market Size Absolute $ Opportunity Analysis and Forecast, By Services, 2016-2032
- 9.5.3. Fitness Centers and Health Clubs
- 9.5.4. Consulting Services
- 9.5.5. Online Weight Loss Programs
- 9.5.6. Slimming Centers
- 9.5.7. Others
- 9.6. Middle East & Africa Weight Loss Market Analysis, Opportunity and Forecast, By Age Group, 2016-2032
- 9.6.1. Middle East & Africa Weight Loss Market Analysis by Age Group: Introduction
- 9.6.2. Market Size Absolute $ Opportunity Analysis and Forecast, By Age Group, 2016-2032
- 9.6.3. Below 18 Years
- 9.6.4. 18-30 Years
- 9.6.5. 31-50 Years
- 9.6.6. Above 50 Years
- 9.7. Middle East & Africa Weight Loss Market Analysis, Opportunity and Forecast, By Gender, 2016-2032
- 9.7.1. Middle East & Africa Weight Loss Market Analysis by Gender: Introduction
- 9.7.2. Market Size Absolute $ Opportunity Analysis and Forecast, By Gender, 2016-2032
- 9.7.3. Male
- 9.7.4. Female
- 9.8. Middle East & Africa Weight Loss Market Analysis, Opportunity and Forecast, By Distribution Channel, 2016-2032
- 9.8.1. Middle East & Africa Weight Loss Market Analysis by Distribution Channel: Introduction
- 9.8.2. Market Size Absolute $ Opportunity Analysis and Forecast, By Distribution Channel, 2016-2032
- 9.8.3. Online Stores
- 9.8.4. Offline Stores
- 9.9. Middle East & Africa Weight Loss Market Analysis, Opportunity and Forecast, By Country , 2016-2032
- 9.9.1. Middle East & Africa Weight Loss Market Analysis by Country : Introduction
- 9.9.2. Market Size Absolute $ Opportunity Analysis and Forecast, Country , 2016-2032
- 9.9.2.1. Algeria
- 9.9.2.2. Egypt
- 9.9.2.3. Israel
- 9.9.2.4. Kuwait
- 9.9.2.5. Nigeria
- 9.9.2.6. Saudi Arabia
- 9.9.2.7. South Africa
- 9.9.2.8. Turkey
- 9.9.2.9. The UAE
- 9.9.2.10. Rest of MEA
- 10. Global Weight Loss Market Analysis, Opportunity and Forecast, By Region , 2016-2032
- 10.1. Global Weight Loss Market Analysis by Region : Introduction
- 10.2. Market Size Absolute $ Opportunity Analysis and Forecast, By Region , 2016-2032
- 10.2.1. North America
- 10.2.2. Western Europe
- 10.2.3. Eastern Europe
- 10.2.4. APAC
- 10.2.5. Latin America
- 10.2.6. Middle East & Africa
- 11. Global Weight Loss Market Competitive Landscape, Market Share Analysis, and Company Profiles
- 11.1. Market Share Analysis
- 11.2. Company Profiles
- 11.3. Atkins Nutritionals, Inc.
- 11.3.1. Company Overview
- 11.3.2. Financial Highlights
- 11.3.3. Product Portfolio
- 11.3.4. SWOT Analysis
- 11.3.5. Key Strategies and Developments
- 11.4. Nutrisystem, Inc.
- 11.4.1. Company Overview
- 11.4.2. Financial Highlights
- 11.4.3. Product Portfolio
- 11.4.4. SWOT Analysis
- 11.4.5. Key Strategies and Developments
- 11.5. Weight Watchers International, Inc.
- 11.5.1. Company Overview
- 11.5.2. Financial Highlights
- 11.5.3. Product Portfolio
- 11.5.4. SWOT Analysis
- 11.5.5. Key Strategies and Developments
- 11.6. Herbalife Nutrition Ltd.
- 11.6.1. Company Overview
- 11.6.2. Financial Highlights
- 11.6.3. Product Portfolio
- 11.6.4. SWOT Analysis
- 11.6.5. Key Strategies and Developments
- 11.7. The Kellogg Company
- 11.7.1. Company Overview
- 11.7.2. Financial Highlights
- 11.7.3. Product Portfolio
- 11.7.4. SWOT Analysis
- 11.7.5. Key Strategies and Developments
- 11.8. Nestle SA
- 11.8.1. Company Overview
- 11.8.2. Financial Highlights
- 11.8.3. Product Portfolio
- 11.8.4. SWOT Analysis
- 11.8.5. Key Strategies and Developments
- 11.9. Kraft Heinz Company
- 11.9.1. Company Overview
- 11.9.2. Financial Highlights
- 11.9.3. Product Portfolio
- 11.9.4. SWOT Analysis
- 11.9.5. Key Strategies and Developments
- 11.10. Jenny Craig, Inc.
- 11.10.1. Company Overview
- 11.10.2. Financial Highlights
- 11.10.3. Product Portfolio
- 11.10.4. SWOT Analysis
- 11.10.5. Key Strategies and Developments
- 11.11. SlimFast
- 11.11.1. Company Overview
- 11.11.2. Financial Highlights
- 11.11.3. Product Portfolio
- 11.11.4. SWOT Analysis
- 11.11.5. Key Strategies and Developments
- 11.12. Medifast, Inc.
- 11.12.1. Company Overview
- 11.12.2. Financial Highlights
- 11.12.3. Product Portfolio
- 11.12.4. SWOT Analysis
- 11.12.5. Key Strategies and Developments
- 11.13.1. Company Overview
- 11.13.2. Financial Highlights
- 11.13.3. Product Portfolio
- 11.13.4. SWOT Analysis
- 11.13.5. Key Strategies and Developments
- 11.14. Glanbia plc
- 11.14.1. Company Overview
- 11.14.2. Financial Highlights
- 11.14.3. Product Portfolio
- 11.14.4. SWOT Analysis
- 11.14.5. Key Strategies and Developments
- 11.15. VLCC Health Care Limited
- 11.15.1. Company Overview
- 11.15.2. Financial Highlights
- 11.15.3. Product Portfolio
- 11.15.4. SWOT Analysis
- 11.15.5. Key Strategies and Developments
- 11.16. GNC Holdings, Inc.
- 11.16.1. Company Overview
- 11.16.2. Financial Highlights
- 11.16.3. Product Portfolio
- 11.16.4. SWOT Analysis
- 11.16.5. Key Strategies and Developments
- 11.17. Beachbody, LLC
- 11.17.1. Company Overview
- 11.17.2. Financial Highlights
- 11.17.3. Product Portfolio
- 11.17.4. SWOT Analysis
- 11.17.5. Key Strategies and Developments
- 12. Assumptions and Acronyms
- 13. Research Methodology
- 14. Contact
"
- List of Figures
- "
- Figure 1: Global Weight Loss Market Revenue (US$ Mn) Market Share by Diet Type in 2022
- Figure 2: Global Weight Loss Market Attractiveness Analysis by Diet Type, 2016-2032
- Figure 3: Global Weight Loss Market Revenue (US$ Mn) Market Share by Equipment Typein 2022
- Figure 4: Global Weight Loss Market Attractiveness Analysis by Equipment Type, 2016-2032
- Figure 5: Global Weight Loss Market Revenue (US$ Mn) Market Share by Servicesin 2022
- Figure 6: Global Weight Loss Market Attractiveness Analysis by Services, 2016-2032
- Figure 7: Global Weight Loss Market Revenue (US$ Mn) Market Share by Age Groupin 2022
- Figure 8: Global Weight Loss Market Attractiveness Analysis by Age Group, 2016-2032
- Figure 9: Global Weight Loss Market Revenue (US$ Mn) Market Share by Genderin 2022
- Figure 10: Global Weight Loss Market Attractiveness Analysis by Gender, 2016-2032
- Figure 11: Global Weight Loss Market Revenue (US$ Mn) Market Share by Distribution Channelin 2022
- Figure 12: Global Weight Loss Market Attractiveness Analysis by Distribution Channel, 2016-2032
- Figure 13: Global Weight Loss Market Revenue (US$ Mn) Market Share by Region in 2022
- Figure 14: Global Weight Loss Market Attractiveness Analysis by Region, 2016-2032
- Figure 15: Global Weight Loss Market Revenue (US$ Mn) (2016-2032)
- Figure 16: Global Weight Loss Market Revenue (US$ Mn) Comparison by Region (2016-2032)
- Figure 17: Global Weight Loss Market Revenue (US$ Mn) Comparison by Diet Type (2016-2032)
- Figure 18: Global Weight Loss Market Revenue (US$ Mn) Comparison by Equipment Type (2016-2032)
- Figure 19: Global Weight Loss Market Revenue (US$ Mn) Comparison by Services (2016-2032)
- Figure 20: Global Weight Loss Market Revenue (US$ Mn) Comparison by Age Group (2016-2032)
- Figure 21: Global Weight Loss Market Revenue (US$ Mn) Comparison by Gender (2016-2032)
- Figure 22: Global Weight Loss Market Revenue (US$ Mn) Comparison by Distribution Channel (2016-2032)
- Figure 23: Global Weight Loss Market Y-o-Y Growth Rate Comparison by Region (2016-2032)
- Figure 24: Global Weight Loss Market Y-o-Y Growth Rate Comparison by Diet Type (2016-2032)
- Figure 25: Global Weight Loss Market Y-o-Y Growth Rate Comparison by Equipment Type (2016-2032)
- Figure 26: Global Weight Loss Market Y-o-Y Growth Rate Comparison by Services (2016-2032)
- Figure 27: Global Weight Loss Market Y-o-Y Growth Rate Comparison by Age Group (2016-2032)
- Figure 28: Global Weight Loss Market Y-o-Y Growth Rate Comparison by Gender (2016-2032)
- Figure 29: Global Weight Loss Market Y-o-Y Growth Rate Comparison by Distribution Channel (2016-2032)
- Figure 30: Global Weight Loss Market Share Comparison by Region (2016-2032)
- Figure 31: Global Weight Loss Market Share Comparison by Diet Type (2016-2032)
- Figure 32: Global Weight Loss Market Share Comparison by Equipment Type (2016-2032)
- Figure 33: Global Weight Loss Market Share Comparison by Services (2016-2032)
- Figure 34: Global Weight Loss Market Share Comparison by Age Group (2016-2032)
- Figure 35: Global Weight Loss Market Share Comparison by Gender (2016-2032)
- Figure 36: Global Weight Loss Market Share Comparison by Distribution Channel (2016-2032)
- Figure 37: North America Weight Loss Market Revenue (US$ Mn) Market Share by Diet Typein 2022
- Figure 38: North America Weight Loss Market Attractiveness Analysis by Diet Type, 2016-2032
- Figure 39: North America Weight Loss Market Revenue (US$ Mn) Market Share by Equipment Typein 2022
- Figure 40: North America Weight Loss Market Attractiveness Analysis by Equipment Type, 2016-2032
- Figure 41: North America Weight Loss Market Revenue (US$ Mn) Market Share by Servicesin 2022
- Figure 42: North America Weight Loss Market Attractiveness Analysis by Services, 2016-2032
- Figure 43: North America Weight Loss Market Revenue (US$ Mn) Market Share by Age Groupin 2022
- Figure 44: North America Weight Loss Market Attractiveness Analysis by Age Group, 2016-2032
- Figure 45: North America Weight Loss Market Revenue (US$ Mn) Market Share by Genderin 2022
- Figure 46: North America Weight Loss Market Attractiveness Analysis by Gender, 2016-2032
- Figure 47: North America Weight Loss Market Revenue (US$ Mn) Market Share by Distribution Channelin 2022
- Figure 48: North America Weight Loss Market Attractiveness Analysis by Distribution Channel, 2016-2032
- Figure 49: North America Weight Loss Market Revenue (US$ Mn) Market Share by Country in 2022
- Figure 50: North America Weight Loss Market Attractiveness Analysis by Country, 2016-2032
- Figure 51: North America Weight Loss Market Revenue (US$ Mn) (2016-2032)
- Figure 52: North America Weight Loss Market Revenue (US$ Mn) Comparison by Country (2016-2032)
- Figure 53: North America Weight Loss Market Revenue (US$ Mn) Comparison by Diet Type (2016-2032)
- Figure 54: North America Weight Loss Market Revenue (US$ Mn) Comparison by Equipment Type (2016-2032)
- Figure 55: North America Weight Loss Market Revenue (US$ Mn) Comparison by Services (2016-2032)
- Figure 56: North America Weight Loss Market Revenue (US$ Mn) Comparison by Age Group (2016-2032)
- Figure 57: North America Weight Loss Market Revenue (US$ Mn) Comparison by Gender (2016-2032)
- Figure 58: North America Weight Loss Market Revenue (US$ Mn) Comparison by Distribution Channel (2016-2032)
- Figure 59: North America Weight Loss Market Y-o-Y Growth Rate Comparison by Country (2016-2032)
- Figure 60: North America Weight Loss Market Y-o-Y Growth Rate Comparison by Diet Type (2016-2032)
- Figure 61: North America Weight Loss Market Y-o-Y Growth Rate Comparison by Equipment Type (2016-2032)
- Figure 62: North America Weight Loss Market Y-o-Y Growth Rate Comparison by Services (2016-2032)
- Figure 63: North America Weight Loss Market Y-o-Y Growth Rate Comparison by Age Group (2016-2032)
- Figure 64: North America Weight Loss Market Y-o-Y Growth Rate Comparison by Gender (2016-2032)
- Figure 65: North America Weight Loss Market Y-o-Y Growth Rate Comparison by Distribution Channel (2016-2032)
- Figure 66: North America Weight Loss Market Share Comparison by Country (2016-2032)
- Figure 67: North America Weight Loss Market Share Comparison by Diet Type (2016-2032)
- Figure 68: North America Weight Loss Market Share Comparison by Equipment Type (2016-2032)
- Figure 69: North America Weight Loss Market Share Comparison by Services (2016-2032)
- Figure 70: North America Weight Loss Market Share Comparison by Age Group (2016-2032)
- Figure 71: North America Weight Loss Market Share Comparison by Gender (2016-2032)
- Figure 72: North America Weight Loss Market Share Comparison by Distribution Channel (2016-2032)
- Figure 73: Western Europe Weight Loss Market Revenue (US$ Mn) Market Share by Diet Typein 2022
- Figure 74: Western Europe Weight Loss Market Attractiveness Analysis by Diet Type, 2016-2032
- Figure 75: Western Europe Weight Loss Market Revenue (US$ Mn) Market Share by Equipment Typein 2022
- Figure 76: Western Europe Weight Loss Market Attractiveness Analysis by Equipment Type, 2016-2032
- Figure 77: Western Europe Weight Loss Market Revenue (US$ Mn) Market Share by Servicesin 2022
- Figure 78: Western Europe Weight Loss Market Attractiveness Analysis by Services, 2016-2032
- Figure 79: Western Europe Weight Loss Market Revenue (US$ Mn) Market Share by Age Groupin 2022
- Figure 80: Western Europe Weight Loss Market Attractiveness Analysis by Age Group, 2016-2032
- Figure 81: Western Europe Weight Loss Market Revenue (US$ Mn) Market Share by Genderin 2022
- Figure 82: Western Europe Weight Loss Market Attractiveness Analysis by Gender, 2016-2032
- Figure 83: Western Europe Weight Loss Market Revenue (US$ Mn) Market Share by Distribution Channelin 2022
- Figure 84: Western Europe Weight Loss Market Attractiveness Analysis by Distribution Channel, 2016-2032
- Figure 85: Western Europe Weight Loss Market Revenue (US$ Mn) Market Share by Country in 2022
- Figure 86: Western Europe Weight Loss Market Attractiveness Analysis by Country, 2016-2032
- Figure 87: Western Europe Weight Loss Market Revenue (US$ Mn) (2016-2032)
- Figure 88: Western Europe Weight Loss Market Revenue (US$ Mn) Comparison by Country (2016-2032)
- Figure 89: Western Europe Weight Loss Market Revenue (US$ Mn) Comparison by Diet Type (2016-2032)
- Figure 90: Western Europe Weight Loss Market Revenue (US$ Mn) Comparison by Equipment Type (2016-2032)
- Figure 91: Western Europe Weight Loss Market Revenue (US$ Mn) Comparison by Services (2016-2032)
- Figure 92: Western Europe Weight Loss Market Revenue (US$ Mn) Comparison by Age Group (2016-2032)
- Figure 93: Western Europe Weight Loss Market Revenue (US$ Mn) Comparison by Gender (2016-2032)
- Figure 94: Western Europe Weight Loss Market Revenue (US$ Mn) Comparison by Distribution Channel (2016-2032)
- Figure 95: Western Europe Weight Loss Market Y-o-Y Growth Rate Comparison by Country (2016-2032)
- Figure 96: Western Europe Weight Loss Market Y-o-Y Growth Rate Comparison by Diet Type (2016-2032)
- Figure 97: Western Europe Weight Loss Market Y-o-Y Growth Rate Comparison by Equipment Type (2016-2032)
- Figure 98: Western Europe Weight Loss Market Y-o-Y Growth Rate Comparison by Services (2016-2032)
- Figure 99: Western Europe Weight Loss Market Y-o-Y Growth Rate Comparison by Age Group (2016-2032)
- Figure 100: Western Europe Weight Loss Market Y-o-Y Growth Rate Comparison by Gender (2016-2032)
- Figure 101: Western Europe Weight Loss Market Y-o-Y Growth Rate Comparison by Distribution Channel (2016-2032)
- Figure 102: Western Europe Weight Loss Market Share Comparison by Country (2016-2032)
- Figure 103: Western Europe Weight Loss Market Share Comparison by Diet Type (2016-2032)
- Figure 104: Western Europe Weight Loss Market Share Comparison by Equipment Type (2016-2032)
- Figure 105: Western Europe Weight Loss Market Share Comparison by Services (2016-2032)
- Figure 106: Western Europe Weight Loss Market Share Comparison by Age Group (2016-2032)
- Figure 107: Western Europe Weight Loss Market Share Comparison by Gender (2016-2032)
- Figure 108: Western Europe Weight Loss Market Share Comparison by Distribution Channel (2016-2032)
- Figure 109: Eastern Europe Weight Loss Market Revenue (US$ Mn) Market Share by Diet Typein 2022
- Figure 110: Eastern Europe Weight Loss Market Attractiveness Analysis by Diet Type, 2016-2032
- Figure 111: Eastern Europe Weight Loss Market Revenue (US$ Mn) Market Share by Equipment Typein 2022
- Figure 112: Eastern Europe Weight Loss Market Attractiveness Analysis by Equipment Type, 2016-2032
- Figure 113: Eastern Europe Weight Loss Market Revenue (US$ Mn) Market Share by Servicesin 2022
- Figure 114: Eastern Europe Weight Loss Market Attractiveness Analysis by Services, 2016-2032
- Figure 115: Eastern Europe Weight Loss Market Revenue (US$ Mn) Market Share by Age Groupin 2022
- Figure 116: Eastern Europe Weight Loss Market Attractiveness Analysis by Age Group, 2016-2032
- Figure 117: Eastern Europe Weight Loss Market Revenue (US$ Mn) Market Share by Genderin 2022
- Figure 118: Eastern Europe Weight Loss Market Attractiveness Analysis by Gender, 2016-2032
- Figure 119: Eastern Europe Weight Loss Market Revenue (US$ Mn) Market Share by Distribution Channelin 2022
- Figure 120: Eastern Europe Weight Loss Market Attractiveness Analysis by Distribution Channel, 2016-2032
- Figure 121: Eastern Europe Weight Loss Market Revenue (US$ Mn) Market Share by Country in 2022
- Figure 122: Eastern Europe Weight Loss Market Attractiveness Analysis by Country, 2016-2032
- Figure 123: Eastern Europe Weight Loss Market Revenue (US$ Mn) (2016-2032)
- Figure 124: Eastern Europe Weight Loss Market Revenue (US$ Mn) Comparison by Country (2016-2032)
- Figure 125: Eastern Europe Weight Loss Market Revenue (US$ Mn) Comparison by Diet Type (2016-2032)
- Figure 126: Eastern Europe Weight Loss Market Revenue (US$ Mn) Comparison by Equipment Type (2016-2032)
- Figure 127: Eastern Europe Weight Loss Market Revenue (US$ Mn) Comparison by Services (2016-2032)
- Figure 128: Eastern Europe Weight Loss Market Revenue (US$ Mn) Comparison by Age Group (2016-2032)
- Figure 129: Eastern Europe Weight Loss Market Revenue (US$ Mn) Comparison by Gender (2016-2032)
- Figure 130: Eastern Europe Weight Loss Market Revenue (US$ Mn) Comparison by Distribution Channel (2016-2032)
- Figure 131: Eastern Europe Weight Loss Market Y-o-Y Growth Rate Comparison by Country (2016-2032)
- Figure 132: Eastern Europe Weight Loss Market Y-o-Y Growth Rate Comparison by Diet Type (2016-2032)
- Figure 133: Eastern Europe Weight Loss Market Y-o-Y Growth Rate Comparison by Equipment Type (2016-2032)
- Figure 134: Eastern Europe Weight Loss Market Y-o-Y Growth Rate Comparison by Services (2016-2032)
- Figure 135: Eastern Europe Weight Loss Market Y-o-Y Growth Rate Comparison by Age Group (2016-2032)
- Figure 136: Eastern Europe Weight Loss Market Y-o-Y Growth Rate Comparison by Gender (2016-2032)
- Figure 137: Eastern Europe Weight Loss Market Y-o-Y Growth Rate Comparison by Distribution Channel (2016-2032)
- Figure 138: Eastern Europe Weight Loss Market Share Comparison by Country (2016-2032)
- Figure 139: Eastern Europe Weight Loss Market Share Comparison by Diet Type (2016-2032)
- Figure 140: Eastern Europe Weight Loss Market Share Comparison by Equipment Type (2016-2032)
- Figure 141: Eastern Europe Weight Loss Market Share Comparison by Services (2016-2032)
- Figure 142: Eastern Europe Weight Loss Market Share Comparison by Age Group (2016-2032)
- Figure 143: Eastern Europe Weight Loss Market Share Comparison by Gender (2016-2032)
- Figure 144: Eastern Europe Weight Loss Market Share Comparison by Distribution Channel (2016-2032)
- Figure 145: APAC Weight Loss Market Revenue (US$ Mn) Market Share by Diet Typein 2022
- Figure 146: APAC Weight Loss Market Attractiveness Analysis by Diet Type, 2016-2032
- Figure 147: APAC Weight Loss Market Revenue (US$ Mn) Market Share by Equipment Typein 2022
- Figure 148: APAC Weight Loss Market Attractiveness Analysis by Equipment Type, 2016-2032
- Figure 149: APAC Weight Loss Market Revenue (US$ Mn) Market Share by Servicesin 2022
- Figure 150: APAC Weight Loss Market Attractiveness Analysis by Services, 2016-2032
- Figure 151: APAC Weight Loss Market Revenue (US$ Mn) Market Share by Age Groupin 2022
- Figure 152: APAC Weight Loss Market Attractiveness Analysis by Age Group, 2016-2032
- Figure 153: APAC Weight Loss Market Revenue (US$ Mn) Market Share by Genderin 2022
- Figure 154: APAC Weight Loss Market Attractiveness Analysis by Gender, 2016-2032
- Figure 155: APAC Weight Loss Market Revenue (US$ Mn) Market Share by Distribution Channelin 2022
- Figure 156: APAC Weight Loss Market Attractiveness Analysis by Distribution Channel, 2016-2032
- Figure 157: APAC Weight Loss Market Revenue (US$ Mn) Market Share by Country in 2022
- Figure 158: APAC Weight Loss Market Attractiveness Analysis by Country, 2016-2032
- Figure 159: APAC Weight Loss Market Revenue (US$ Mn) (2016-2032)
- Figure 160: APAC Weight Loss Market Revenue (US$ Mn) Comparison by Country (2016-2032)
- Figure 161: APAC Weight Loss Market Revenue (US$ Mn) Comparison by Diet Type (2016-2032)
- Figure 162: APAC Weight Loss Market Revenue (US$ Mn) Comparison by Equipment Type (2016-2032)
- Figure 163: APAC Weight Loss Market Revenue (US$ Mn) Comparison by Services (2016-2032)
- Figure 164: APAC Weight Loss Market Revenue (US$ Mn) Comparison by Age Group (2016-2032)
- Figure 165: APAC Weight Loss Market Revenue (US$ Mn) Comparison by Gender (2016-2032)
- Figure 166: APAC Weight Loss Market Revenue (US$ Mn) Comparison by Distribution Channel (2016-2032)
- Figure 167: APAC Weight Loss Market Y-o-Y Growth Rate Comparison by Country (2016-2032)
- Figure 168: APAC Weight Loss Market Y-o-Y Growth Rate Comparison by Diet Type (2016-2032)
- Figure 169: APAC Weight Loss Market Y-o-Y Growth Rate Comparison by Equipment Type (2016-2032)
- Figure 170: APAC Weight Loss Market Y-o-Y Growth Rate Comparison by Services (2016-2032)
- Figure 171: APAC Weight Loss Market Y-o-Y Growth Rate Comparison by Age Group (2016-2032)
- Figure 172: APAC Weight Loss Market Y-o-Y Growth Rate Comparison by Gender (2016-2032)
- Figure 173: APAC Weight Loss Market Y-o-Y Growth Rate Comparison by Distribution Channel (2016-2032)
- Figure 174: APAC Weight Loss Market Share Comparison by Country (2016-2032)
- Figure 175: APAC Weight Loss Market Share Comparison by Diet Type (2016-2032)
- Figure 176: APAC Weight Loss Market Share Comparison by Equipment Type (2016-2032)
- Figure 177: APAC Weight Loss Market Share Comparison by Services (2016-2032)
- Figure 178: APAC Weight Loss Market Share Comparison by Age Group (2016-2032)
- Figure 179: APAC Weight Loss Market Share Comparison by Gender (2016-2032)
- Figure 180: APAC Weight Loss Market Share Comparison by Distribution Channel (2016-2032)
- Figure 181: Latin America Weight Loss Market Revenue (US$ Mn) Market Share by Diet Typein 2022
- Figure 182: Latin America Weight Loss Market Attractiveness Analysis by Diet Type, 2016-2032
- Figure 183: Latin America Weight Loss Market Revenue (US$ Mn) Market Share by Equipment Typein 2022
- Figure 184: Latin America Weight Loss Market Attractiveness Analysis by Equipment Type, 2016-2032
- Figure 185: Latin America Weight Loss Market Revenue (US$ Mn) Market Share by Servicesin 2022
- Figure 186: Latin America Weight Loss Market Attractiveness Analysis by Services, 2016-2032
- Figure 187: Latin America Weight Loss Market Revenue (US$ Mn) Market Share by Age Groupin 2022
- Figure 188: Latin America Weight Loss Market Attractiveness Analysis by Age Group, 2016-2032
- Figure 189: Latin America Weight Loss Market Revenue (US$ Mn) Market Share by Genderin 2022
- Figure 190: Latin America Weight Loss Market Attractiveness Analysis by Gender, 2016-2032
- Figure 191: Latin America Weight Loss Market Revenue (US$ Mn) Market Share by Distribution Channelin 2022
- Figure 192: Latin America Weight Loss Market Attractiveness Analysis by Distribution Channel, 2016-2032
- Figure 193: Latin America Weight Loss Market Revenue (US$ Mn) Market Share by Country in 2022
- Figure 194: Latin America Weight Loss Market Attractiveness Analysis by Country, 2016-2032
- Figure 195: Latin America Weight Loss Market Revenue (US$ Mn) (2016-2032)
- Figure 196: Latin America Weight Loss Market Revenue (US$ Mn) Comparison by Country (2016-2032)
- Figure 197: Latin America Weight Loss Market Revenue (US$ Mn) Comparison by Diet Type (2016-2032)
- Figure 198: Latin America Weight Loss Market Revenue (US$ Mn) Comparison by Equipment Type (2016-2032)
- Figure 199: Latin America Weight Loss Market Revenue (US$ Mn) Comparison by Services (2016-2032)
- Figure 200: Latin America Weight Loss Market Revenue (US$ Mn) Comparison by Age Group (2016-2032)
- Figure 201: Latin America Weight Loss Market Revenue (US$ Mn) Comparison by Gender (2016-2032)
- Figure 202: Latin America Weight Loss Market Revenue (US$ Mn) Comparison by Distribution Channel (2016-2032)
- Figure 203: Latin America Weight Loss Market Y-o-Y Growth Rate Comparison by Country (2016-2032)
- Figure 204: Latin America Weight Loss Market Y-o-Y Growth Rate Comparison by Diet Type (2016-2032)
- Figure 205: Latin America Weight Loss Market Y-o-Y Growth Rate Comparison by Equipment Type (2016-2032)
- Figure 206: Latin America Weight Loss Market Y-o-Y Growth Rate Comparison by Services (2016-2032)
- Figure 207: Latin America Weight Loss Market Y-o-Y Growth Rate Comparison by Age Group (2016-2032)
- Figure 208: Latin America Weight Loss Market Y-o-Y Growth Rate Comparison by Gender (2016-2032)
- Figure 209: Latin America Weight Loss Market Y-o-Y Growth Rate Comparison by Distribution Channel (2016-2032)
- Figure 210: Latin America Weight Loss Market Share Comparison by Country (2016-2032)
- Figure 211: Latin America Weight Loss Market Share Comparison by Diet Type (2016-2032)
- Figure 212: Latin America Weight Loss Market Share Comparison by Equipment Type (2016-2032)
- Figure 213: Latin America Weight Loss Market Share Comparison by Services (2016-2032)
- Figure 214: Latin America Weight Loss Market Share Comparison by Age Group (2016-2032)
- Figure 215: Latin America Weight Loss Market Share Comparison by Gender (2016-2032)
- Figure 216: Latin America Weight Loss Market Share Comparison by Distribution Channel (2016-2032)
- Figure 217: Middle East & Africa Weight Loss Market Revenue (US$ Mn) Market Share by Diet Typein 2022
- Figure 218: Middle East & Africa Weight Loss Market Attractiveness Analysis by Diet Type, 2016-2032
- Figure 219: Middle East & Africa Weight Loss Market Revenue (US$ Mn) Market Share by Equipment Typein 2022
- Figure 220: Middle East & Africa Weight Loss Market Attractiveness Analysis by Equipment Type, 2016-2032
- Figure 221: Middle East & Africa Weight Loss Market Revenue (US$ Mn) Market Share by Servicesin 2022
- Figure 222: Middle East & Africa Weight Loss Market Attractiveness Analysis by Services, 2016-2032
- Figure 223: Middle East & Africa Weight Loss Market Revenue (US$ Mn) Market Share by Age Groupin 2022
- Figure 224: Middle East & Africa Weight Loss Market Attractiveness Analysis by Age Group, 2016-2032
- Figure 225: Middle East & Africa Weight Loss Market Revenue (US$ Mn) Market Share by Genderin 2022
- Figure 226: Middle East & Africa Weight Loss Market Attractiveness Analysis by Gender, 2016-2032
- Figure 227: Middle East & Africa Weight Loss Market Revenue (US$ Mn) Market Share by Distribution Channelin 2022
- Figure 228: Middle East & Africa Weight Loss Market Attractiveness Analysis by Distribution Channel, 2016-2032
- Figure 229: Middle East & Africa Weight Loss Market Revenue (US$ Mn) Market Share by Country in 2022
- Figure 230: Middle East & Africa Weight Loss Market Attractiveness Analysis by Country, 2016-2032
- Figure 231: Middle East & Africa Weight Loss Market Revenue (US$ Mn) (2016-2032)
- Figure 232: Middle East & Africa Weight Loss Market Revenue (US$ Mn) Comparison by Country (2016-2032)
- Figure 233: Middle East & Africa Weight Loss Market Revenue (US$ Mn) Comparison by Diet Type (2016-2032)
- Figure 234: Middle East & Africa Weight Loss Market Revenue (US$ Mn) Comparison by Equipment Type (2016-2032)
- Figure 235: Middle East & Africa Weight Loss Market Revenue (US$ Mn) Comparison by Services (2016-2032)
- Figure 236: Middle East & Africa Weight Loss Market Revenue (US$ Mn) Comparison by Age Group (2016-2032)
- Figure 237: Middle East & Africa Weight Loss Market Revenue (US$ Mn) Comparison by Gender (2016-2032)
- Figure 238: Middle East & Africa Weight Loss Market Revenue (US$ Mn) Comparison by Distribution Channel (2016-2032)
- Figure 239: Middle East & Africa Weight Loss Market Y-o-Y Growth Rate Comparison by Country (2016-2032)
- Figure 240: Middle East & Africa Weight Loss Market Y-o-Y Growth Rate Comparison by Diet Type (2016-2032)
- Figure 241: Middle East & Africa Weight Loss Market Y-o-Y Growth Rate Comparison by Equipment Type (2016-2032)
- Figure 242: Middle East & Africa Weight Loss Market Y-o-Y Growth Rate Comparison by Services (2016-2032)
- Figure 243: Middle East & Africa Weight Loss Market Y-o-Y Growth Rate Comparison by Age Group (2016-2032)
- Figure 244: Middle East & Africa Weight Loss Market Y-o-Y Growth Rate Comparison by Gender (2016-2032)
- Figure 245: Middle East & Africa Weight Loss Market Y-o-Y Growth Rate Comparison by Distribution Channel (2016-2032)
- Figure 246: Middle East & Africa Weight Loss Market Share Comparison by Country (2016-2032)
- Figure 247: Middle East & Africa Weight Loss Market Share Comparison by Diet Type (2016-2032)
- Figure 248: Middle East & Africa Weight Loss Market Share Comparison by Equipment Type (2016-2032)
- Figure 249: Middle East & Africa Weight Loss Market Share Comparison by Services (2016-2032)
- Figure 250: Middle East & Africa Weight Loss Market Share Comparison by Age Group (2016-2032)
- Figure 251: Middle East & Africa Weight Loss Market Share Comparison by Gender (2016-2032)
- Figure 252: Middle East & Africa Weight Loss Market Share Comparison by Distribution Channel (2016-2032)
"
- List of Tables
- "
- Table 1: Global Weight Loss Market Comparison by Diet Type (2016-2032)
- Table 2: Global Weight Loss Market Comparison by Equipment Type (2016-2032)
- Table 3: Global Weight Loss Market Comparison by Services (2016-2032)
- Table 4: Global Weight Loss Market Comparison by Age Group (2016-2032)
- Table 5: Global Weight Loss Market Comparison by Gender (2016-2032)
- Table 6: Global Weight Loss Market Comparison by Distribution Channel (2016-2032)
- Table 7: Global Weight Loss Market Revenue (US$ Mn) Comparison by Region (2016-2032)
- Table 8: Global Weight Loss Market Revenue (US$ Mn) (2016-2032)
- Table 9: Global Weight Loss Market Revenue (US$ Mn) Comparison by Region (2016-2032)
- Table 10: Global Weight Loss Market Revenue (US$ Mn) Comparison by Diet Type (2016-2032)
- Table 11: Global Weight Loss Market Revenue (US$ Mn) Comparison by Equipment Type (2016-2032)
- Table 12: Global Weight Loss Market Revenue (US$ Mn) Comparison by Services (2016-2032)
- Table 13: Global Weight Loss Market Revenue (US$ Mn) Comparison by Age Group (2016-2032)
- Table 14: Global Weight Loss Market Revenue (US$ Mn) Comparison by Gender (2016-2032)
- Table 15: Global Weight Loss Market Revenue (US$ Mn) Comparison by Distribution Channel (2016-2032)
- Table 16: Global Weight Loss Market Y-o-Y Growth Rate Comparison by Region (2016-2032)
- Table 17: Global Weight Loss Market Y-o-Y Growth Rate Comparison by Diet Type (2016-2032)
- Table 18: Global Weight Loss Market Y-o-Y Growth Rate Comparison by Equipment Type (2016-2032)
- Table 19: Global Weight Loss Market Y-o-Y Growth Rate Comparison by Services (2016-2032)
- Table 20: Global Weight Loss Market Y-o-Y Growth Rate Comparison by Age Group (2016-2032)
- Table 21: Global Weight Loss Market Y-o-Y Growth Rate Comparison by Gender (2016-2032)
- Table 22: Global Weight Loss Market Y-o-Y Growth Rate Comparison by Distribution Channel (2016-2032)
- Table 23: Global Weight Loss Market Share Comparison by Region (2016-2032)
- Table 24: Global Weight Loss Market Share Comparison by Diet Type (2016-2032)
- Table 25: Global Weight Loss Market Share Comparison by Equipment Type (2016-2032)
- Table 26: Global Weight Loss Market Share Comparison by Services (2016-2032)
- Table 27: Global Weight Loss Market Share Comparison by Age Group (2016-2032)
- Table 28: Global Weight Loss Market Share Comparison by Gender (2016-2032)
- Table 29: Global Weight Loss Market Share Comparison by Distribution Channel (2016-2032)
- Table 30: North America Weight Loss Market Comparison by Equipment Type (2016-2032)
- Table 31: North America Weight Loss Market Comparison by Services (2016-2032)
- Table 32: North America Weight Loss Market Comparison by Age Group (2016-2032)
- Table 33: North America Weight Loss Market Comparison by Gender (2016-2032)
- Table 34: North America Weight Loss Market Comparison by Distribution Channel (2016-2032)
- Table 35: North America Weight Loss Market Revenue (US$ Mn) Comparison by Country (2016-2032)
- Table 36: North America Weight Loss Market Revenue (US$ Mn) (2016-2032)
- Table 37: North America Weight Loss Market Revenue (US$ Mn) Comparison by Country (2016-2032)
- Table 38: North America Weight Loss Market Revenue (US$ Mn) Comparison by Diet Type (2016-2032)
- Table 39: North America Weight Loss Market Revenue (US$ Mn) Comparison by Equipment Type (2016-2032)
- Table 40: North America Weight Loss Market Revenue (US$ Mn) Comparison by Services (2016-2032)
- Table 41: North America Weight Loss Market Revenue (US$ Mn) Comparison by Age Group (2016-2032)
- Table 42: North America Weight Loss Market Revenue (US$ Mn) Comparison by Gender (2016-2032)
- Table 43: North America Weight Loss Market Revenue (US$ Mn) Comparison by Distribution Channel (2016-2032)
- Table 44: North America Weight Loss Market Y-o-Y Growth Rate Comparison by Country (2016-2032)
- Table 45: North America Weight Loss Market Y-o-Y Growth Rate Comparison by Diet Type (2016-2032)
- Table 46: North America Weight Loss Market Y-o-Y Growth Rate Comparison by Equipment Type (2016-2032)
- Table 47: North America Weight Loss Market Y-o-Y Growth Rate Comparison by Services (2016-2032)
- Table 48: North America Weight Loss Market Y-o-Y Growth Rate Comparison by Age Group (2016-2032)
- Table 49: North America Weight Loss Market Y-o-Y Growth Rate Comparison by Gender (2016-2032)
- Table 50: North America Weight Loss Market Y-o-Y Growth Rate Comparison by Distribution Channel (2016-2032)
- Table 51: North America Weight Loss Market Share Comparison by Country (2016-2032)
- Table 52: North America Weight Loss Market Share Comparison by Diet Type (2016-2032)
- Table 53: North America Weight Loss Market Share Comparison by Equipment Type (2016-2032)
- Table 54: North America Weight Loss Market Share Comparison by Services (2016-2032)
- Table 55: North America Weight Loss Market Share Comparison by Age Group (2016-2032)
- Table 56: North America Weight Loss Market Share Comparison by Gender (2016-2032)
- Table 57: North America Weight Loss Market Share Comparison by Distribution Channel (2016-2032)
- Table 58: Western Europe Weight Loss Market Comparison by Diet Type (2016-2032)
- Table 59: Western Europe Weight Loss Market Comparison by Equipment Type (2016-2032)
- Table 60: Western Europe Weight Loss Market Comparison by Services (2016-2032)
- Table 61: Western Europe Weight Loss Market Comparison by Age Group (2016-2032)
- Table 62: Western Europe Weight Loss Market Comparison by Gender (2016-2032)
- Table 63: Western Europe Weight Loss Market Comparison by Distribution Channel (2016-2032)
- Table 64: Western Europe Weight Loss Market Revenue (US$ Mn) Comparison by Country (2016-2032)
- Table 65: Western Europe Weight Loss Market Revenue (US$ Mn) (2016-2032)
- Table 66: Western Europe Weight Loss Market Revenue (US$ Mn) Comparison by Country (2016-2032)
- Table 67: Western Europe Weight Loss Market Revenue (US$ Mn) Comparison by Diet Type (2016-2032)
- Table 68: Western Europe Weight Loss Market Revenue (US$ Mn) Comparison by Equipment Type (2016-2032)
- Table 69: Western Europe Weight Loss Market Revenue (US$ Mn) Comparison by Services (2016-2032)
- Table 70: Western Europe Weight Loss Market Revenue (US$ Mn) Comparison by Age Group (2016-2032)
- Table 71: Western Europe Weight Loss Market Revenue (US$ Mn) Comparison by Gender (2016-2032)
- Table 72: Western Europe Weight Loss Market Revenue (US$ Mn) Comparison by Distribution Channel (2016-2032)
- Table 73: Western Europe Weight Loss Market Y-o-Y Growth Rate Comparison by Country (2016-2032)
- Table 74: Western Europe Weight Loss Market Y-o-Y Growth Rate Comparison by Diet Type (2016-2032)
- Table 75: Western Europe Weight Loss Market Y-o-Y Growth Rate Comparison by Equipment Type (2016-2032)
- Table 76: Western Europe Weight Loss Market Y-o-Y Growth Rate Comparison by Services (2016-2032)
- Table 77: Western Europe Weight Loss Market Y-o-Y Growth Rate Comparison by Age Group (2016-2032)
- Table 78: Western Europe Weight Loss Market Y-o-Y Growth Rate Comparison by Gender (2016-2032)
- Table 79: Western Europe Weight Loss Market Y-o-Y Growth Rate Comparison by Distribution Channel (2016-2032)
- Table 80: Western Europe Weight Loss Market Share Comparison by Country (2016-2032)
- Table 81: Western Europe Weight Loss Market Share Comparison by Diet Type (2016-2032)
- Table 82: Western Europe Weight Loss Market Share Comparison by Equipment Type (2016-2032)
- Table 83: Western Europe Weight Loss Market Share Comparison by Services (2016-2032)
- Table 84: Western Europe Weight Loss Market Share Comparison by Age Group (2016-2032)
- Table 85: Western Europe Weight Loss Market Share Comparison by Gender (2016-2032)
- Table 86: Western Europe Weight Loss Market Share Comparison by Distribution Channel (2016-2032)
- Table 87: Eastern Europe Weight Loss Market Comparison by Diet Type (2016-2032)
- Table 88: Eastern Europe Weight Loss Market Comparison by Equipment Type (2016-2032)
- Table 89: Eastern Europe Weight Loss Market Comparison by Services (2016-2032)
- Table 90: Eastern Europe Weight Loss Market Comparison by Age Group (2016-2032)
- Table 91: Eastern Europe Weight Loss Market Comparison by Gender (2016-2032)
- Table 92: Eastern Europe Weight Loss Market Comparison by Distribution Channel (2016-2032)
- Table 93: Eastern Europe Weight Loss Market Revenue (US$ Mn) Comparison by Country (2016-2032)
- Table 94: Eastern Europe Weight Loss Market Revenue (US$ Mn) (2016-2032)
- Table 95: Eastern Europe Weight Loss Market Revenue (US$ Mn) Comparison by Country (2016-2032)
- Table 96: Eastern Europe Weight Loss Market Revenue (US$ Mn) Comparison by Diet Type (2016-2032)
- Table 97: Eastern Europe Weight Loss Market Revenue (US$ Mn) Comparison by Equipment Type (2016-2032)
- Table 98: Eastern Europe Weight Loss Market Revenue (US$ Mn) Comparison by Services (2016-2032)
- Table 99: Eastern Europe Weight Loss Market Revenue (US$ Mn) Comparison by Age Group (2016-2032)
- Table 100: Eastern Europe Weight Loss Market Revenue (US$ Mn) Comparison by Gender (2016-2032)
- Table 101: Eastern Europe Weight Loss Market Revenue (US$ Mn) Comparison by Distribution Channel (2016-2032)
- Table 102: Eastern Europe Weight Loss Market Y-o-Y Growth Rate Comparison by Country (2016-2032)
- Table 103: Eastern Europe Weight Loss Market Y-o-Y Growth Rate Comparison by Diet Type (2016-2032)
- Table 104: Eastern Europe Weight Loss Market Y-o-Y Growth Rate Comparison by Equipment Type (2016-2032)
- Table 105: Eastern Europe Weight Loss Market Y-o-Y Growth Rate Comparison by Services (2016-2032)
- Table 106: Eastern Europe Weight Loss Market Y-o-Y Growth Rate Comparison by Age Group (2016-2032)
- Table 107: Eastern Europe Weight Loss Market Y-o-Y Growth Rate Comparison by Gender (2016-2032)
- Table 108: Eastern Europe Weight Loss Market Y-o-Y Growth Rate Comparison by Distribution Channel (2016-2032)
- Table 109: Eastern Europe Weight Loss Market Share Comparison by Country (2016-2032)
- Table 110: Eastern Europe Weight Loss Market Share Comparison by Diet Type (2016-2032)
- Table 111: Eastern Europe Weight Loss Market Share Comparison by Equipment Type (2016-2032)
- Table 112: Eastern Europe Weight Loss Market Share Comparison by Services (2016-2032)
- Table 113: Eastern Europe Weight Loss Market Share Comparison by Age Group (2016-2032)
- Table 114: Eastern Europe Weight Loss Market Share Comparison by Gender (2016-2032)
- Table 115: Eastern Europe Weight Loss Market Share Comparison by Distribution Channel (2016-2032)
- Table 116: APAC Weight Loss Market Comparison by Diet Type (2016-2032)
- Table 117: APAC Weight Loss Market Comparison by Equipment Type (2016-2032)
- Table 118: APAC Weight Loss Market Comparison by Services (2016-2032)
- Table 119: APAC Weight Loss Market Comparison by Age Group (2016-2032)
- Table 120: APAC Weight Loss Market Comparison by Gender (2016-2032)
- Table 121: APAC Weight Loss Market Comparison by Distribution Channel (2016-2032)
- Table 122: APAC Weight Loss Market Revenue (US$ Mn) Comparison by Country (2016-2032)
- Table 123: APAC Weight Loss Market Revenue (US$ Mn) (2016-2032)
- Table 124: APAC Weight Loss Market Revenue (US$ Mn) Comparison by Country (2016-2032)
- Table 125: APAC Weight Loss Market Revenue (US$ Mn) Comparison by Diet Type (2016-2032)
- Table 126: APAC Weight Loss Market Revenue (US$ Mn) Comparison by Equipment Type (2016-2032)
- Table 127: APAC Weight Loss Market Revenue (US$ Mn) Comparison by Services (2016-2032)
- Table 128: APAC Weight Loss Market Revenue (US$ Mn) Comparison by Age Group (2016-2032)
- Table 129: APAC Weight Loss Market Revenue (US$ Mn) Comparison by Gender (2016-2032)
- Table 130: APAC Weight Loss Market Revenue (US$ Mn) Comparison by Distribution Channel (2016-2032)
- Table 131: APAC Weight Loss Market Y-o-Y Growth Rate Comparison by Country (2016-2032)
- Table 132: APAC Weight Loss Market Y-o-Y Growth Rate Comparison by Diet Type (2016-2032)
- Table 133: APAC Weight Loss Market Y-o-Y Growth Rate Comparison by Equipment Type (2016-2032)
- Table 134: APAC Weight Loss Market Y-o-Y Growth Rate Comparison by Services (2016-2032)
- Table 135: APAC Weight Loss Market Y-o-Y Growth Rate Comparison by Age Group (2016-2032)
- Table 136: APAC Weight Loss Market Y-o-Y Growth Rate Comparison by Gender (2016-2032)
- Table 137: APAC Weight Loss Market Y-o-Y Growth Rate Comparison by Distribution Channel (2016-2032)
- Table 138: APAC Weight Loss Market Share Comparison by Country (2016-2032)
- Table 139: APAC Weight Loss Market Share Comparison by Diet Type (2016-2032)
- Table 140: APAC Weight Loss Market Share Comparison by Equipment Type (2016-2032)
- Table 141: APAC Weight Loss Market Share Comparison by Services (2016-2032)
- Table 142: APAC Weight Loss Market Share Comparison by Age Group (2016-2032)
- Table 143: APAC Weight Loss Market Share Comparison by Gender (2016-2032)
- Table 144: APAC Weight Loss Market Share Comparison by Distribution Channel (2016-2032)
- Table 145: Latin America Weight Loss Market Comparison by Diet Type (2016-2032)
- Table 146: Latin America Weight Loss Market Comparison by Equipment Type (2016-2032)
- Table 147: Latin America Weight Loss Market Comparison by Services (2016-2032)
- Table 148: Latin America Weight Loss Market Comparison by Age Group (2016-2032)
- Table 149: Latin America Weight Loss Market Comparison by Gender (2016-2032)
- Table 150: Latin America Weight Loss Market Comparison by Distribution Channel (2016-2032)
- Table 151: Latin America Weight Loss Market Revenue (US$ Mn) Comparison by Country (2016-2032)
- Table 152: Latin America Weight Loss Market Revenue (US$ Mn) (2016-2032)
- Table 153: Latin America Weight Loss Market Revenue (US$ Mn) Comparison by Country (2016-2032)
- Table 154: Latin America Weight Loss Market Revenue (US$ Mn) Comparison by Diet Type (2016-2032)
- Table 155: Latin America Weight Loss Market Revenue (US$ Mn) Comparison by Equipment Type (2016-2032)
- Table 156: Latin America Weight Loss Market Revenue (US$ Mn) Comparison by Services (2016-2032)
- Table 157: Latin America Weight Loss Market Revenue (US$ Mn) Comparison by Age Group (2016-2032)
- Table 158: Latin America Weight Loss Market Revenue (US$ Mn) Comparison by Gender (2016-2032)
- Table 159: Latin America Weight Loss Market Revenue (US$ Mn) Comparison by Distribution Channel (2016-2032)
- Table 160: Latin America Weight Loss Market Y-o-Y Growth Rate Comparison by Country (2016-2032)
- Table 161: Latin America Weight Loss Market Y-o-Y Growth Rate Comparison by Diet Type (2016-2032)
- Table 162: Latin America Weight Loss Market Y-o-Y Growth Rate Comparison by Equipment Type (2016-2032)
- Table 163: Latin America Weight Loss Market Y-o-Y Growth Rate Comparison by Services (2016-2032)
- Table 164: Latin America Weight Loss Market Y-o-Y Growth Rate Comparison by Age Group (2016-2032)
- Table 165: Latin America Weight Loss Market Y-o-Y Growth Rate Comparison by Gender (2016-2032)
- Table 166: Latin America Weight Loss Market Y-o-Y Growth Rate Comparison by Distribution Channel (2016-2032)
- Table 167: Latin America Weight Loss Market Share Comparison by Country (2016-2032)
- Table 168: Latin America Weight Loss Market Share Comparison by Diet Type (2016-2032)
- Table 169: Latin America Weight Loss Market Share Comparison by Equipment Type (2016-2032)
- Table 170: Latin America Weight Loss Market Share Comparison by Services (2016-2032)
- Table 171: Latin America Weight Loss Market Share Comparison by Age Group (2016-2032)
- Table 172: Latin America Weight Loss Market Share Comparison by Gender (2016-2032)
- Table 173: Latin America Weight Loss Market Share Comparison by Distribution Channel (2016-2032)
- Table 174: Middle East & Africa Weight Loss Market Comparison by Diet Type (2016-2032)
- Table 175: Middle East & Africa Weight Loss Market Comparison by Equipment Type (2016-2032)
- Table 176: Middle East & Africa Weight Loss Market Comparison by Services (2016-2032)
- Table 177: Middle East & Africa Weight Loss Market Comparison by Age Group (2016-2032)
- Table 178: Middle East & Africa Weight Loss Market Comparison by Gender (2016-2032)
- Table 179: Middle East & Africa Weight Loss Market Comparison by Distribution Channel (2016-2032)
- Table 180: Middle East & Africa Weight Loss Market Revenue (US$ Mn) Comparison by Country (2016-2032)
- Table 181: Middle East & Africa Weight Loss Market Revenue (US$ Mn) (2016-2032)
- Table 182: Middle East & Africa Weight Loss Market Revenue (US$ Mn) Comparison by Country (2016-2032)
- Table 183: Middle East & Africa Weight Loss Market Revenue (US$ Mn) Comparison by Diet Type (2016-2032)
- Table 184: Middle East & Africa Weight Loss Market Revenue (US$ Mn) Comparison by Equipment Type (2016-2032)
- Table 185: Middle East & Africa Weight Loss Market Revenue (US$ Mn) Comparison by Services (2016-2032)
- Table 186: Middle East & Africa Weight Loss Market Revenue (US$ Mn) Comparison by Age Group (2016-2032)
- Table 187: Middle East & Africa Weight Loss Market Revenue (US$ Mn) Comparison by Gender (2016-2032)
- Table 188: Middle East & Africa Weight Loss Market Revenue (US$ Mn) Comparison by Distribution Channel (2016-2032)
- Table 189: Middle East & Africa Weight Loss Market Y-o-Y Growth Rate Comparison by Country (2016-2032)
- Table 190: Middle East & Africa Weight Loss Market Y-o-Y Growth Rate Comparison by Diet Type (2016-2032)
- Table 191: Middle East & Africa Weight Loss Market Y-o-Y Growth Rate Comparison by Equipment Type (2016-2032)
- Table 192: Middle East & Africa Weight Loss Market Y-o-Y Growth Rate Comparison by Services (2016-2032)
- Table 193: Middle East & Africa Weight Loss Market Y-o-Y Growth Rate Comparison by Age Group (2016-2032)
- Table 194: Middle East & Africa Weight Loss Market Y-o-Y Growth Rate Comparison by Gender (2016-2032)
- Table 195: Middle East & Africa Weight Loss Market Y-o-Y Growth Rate Comparison by Distribution Channel (2016-2032)
- Table 196: Middle East & Africa Weight Loss Market Share Comparison by Country (2016-2032)
- Table 197: Middle East & Africa Weight Loss Market Share Comparison by Diet Type (2016-2032)
- Table 198: Middle East & Africa Weight Loss Market Share Comparison by Equipment Type (2016-2032)
- Table 199: Middle East & Africa Weight Loss Market Share Comparison by Services (2016-2032)
- Table 200: Middle East & Africa Weight Loss Market Share Comparison by Age Group (2016-2032)
- Table 201: Middle East & Africa Weight Loss Market Share Comparison by Gender (2016-2032)
- Table 202: Middle East & Africa Weight Loss Market Share Comparison by Distribution Channel (2016-2032)
- 1. Executive Summary
-
- Good Food Company
- Herbalife Nutrition Ltd.
- Nestle
- Glanbia plc
- Amway Corp
- Kellogg Company
- Abbott
- GlaxoSmithKline plc
- PepsiCo
- Atkins Nutrionals, Inc.
- Nutrisystem Inc.
- Jenny Caring Inc.
- Johnson Health Technology Co, Ltd
- Gold’s Gym International, Inc.
- Herbalife International, Inc.
- Brunswick Corp.
- Meticore
- Solace Nutrition
- Apollo Endosurgery Inc.
- Cargill Inc.
- Ingredion Inc.
- Brunswick Corporation
- Medifast Inc.
- Gold’s Gym International Inc.
- Other Key Players
Our Clients


View Our Licence Options
