Global Tortilla Market By Ingredients(Wheat, Corn), By Processing Type(Fresh, Frozen), By Product Type(Tortilla Chips, Taco Shells, Tostadas, Flour Tortillas, Corn Tortillas), By Distribution Channel(Hypermarkets/Supermarkets, Specialty Stores, Online), By Region And Companies - Industry Segment Outlook, Market Assessment, Competition Scenario, Trends, And Forecast 2024-2033
-
8210
-
June 2024
-
300
-


-
This report was compiled by Shreyas Rokade Shreyas Rokade is a seasoned Research Analyst with CMFE, bringing extensive expertise in market research and consulting, with a strong background in Chemical Engineering. Correspondence Team Lead-CMFE Linkedin | Detailed Market research Methodology Our methodology involves a mix of primary research, including interviews with leading mental health experts, and secondary research from reputable medical journals and databases. View Detailed Methodology Page
-
Quick Navigation
Report Overview
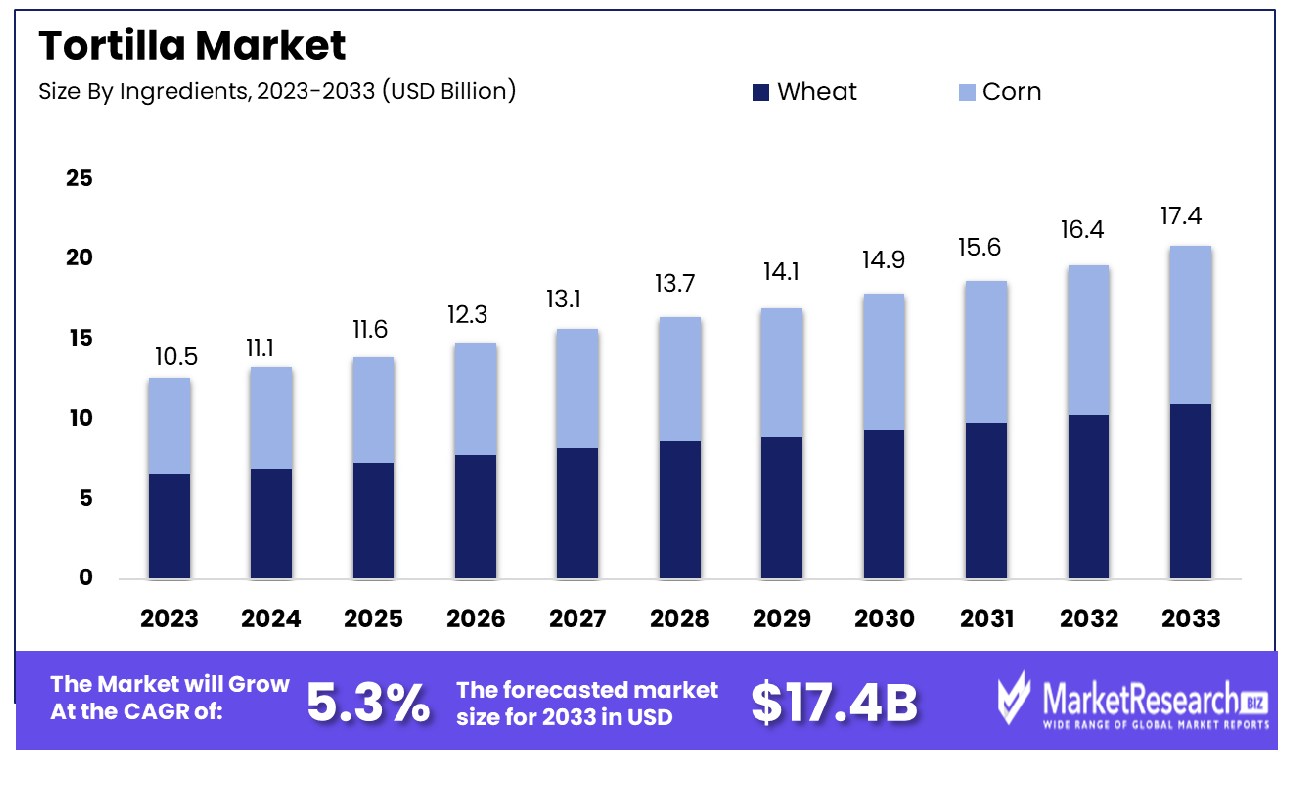
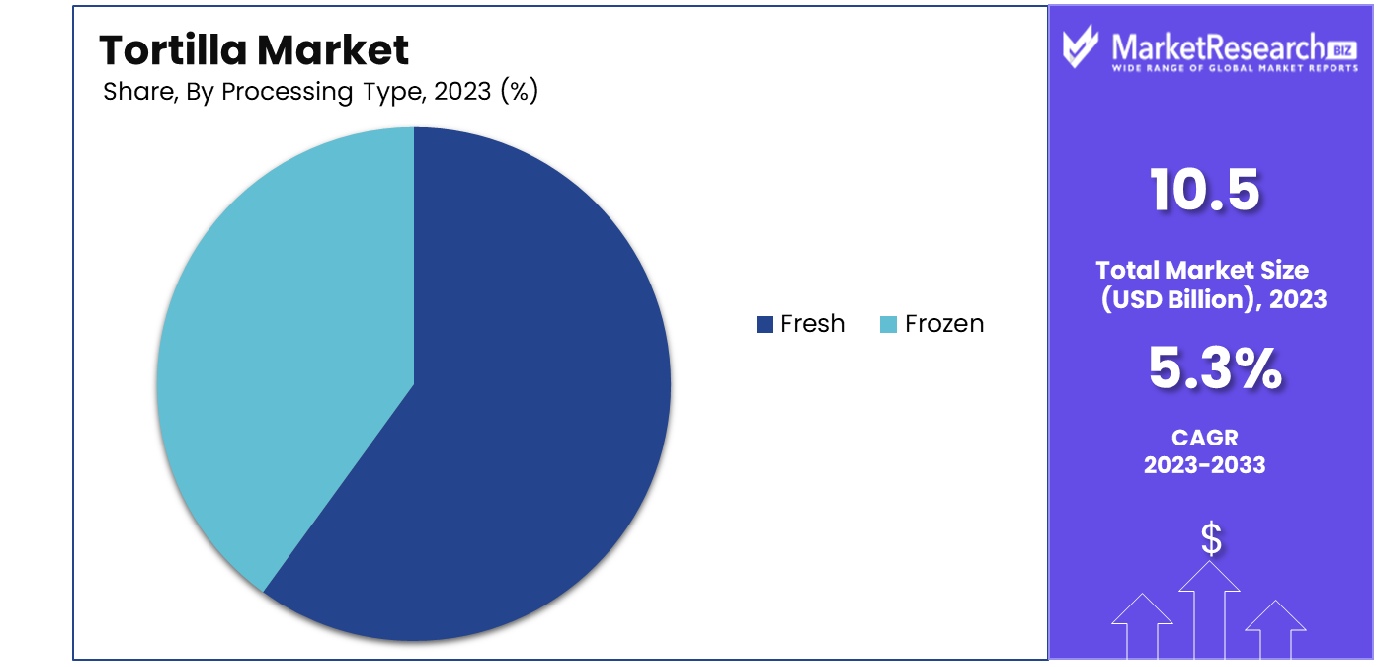
The Global Tortilla Market was valued at USD 10.5 billion in 2023. It is expected to reach USD 17.4 billion by 2033, with a CAGR of 5.3% during the forecast period from 2024 to 2033.
The Tortilla Market encompasses the production, distribution, and sale of tortillas, a staple in various cuisines globally. This market caters to both retail and commercial sectors, offering products ranging from corn and wheat tortillas to newer, health-oriented variants like gluten-free and low-carb options. As consumer preferences evolve towards healthier and more diverse food choices, the market is experiencing significant growth.
Key drivers include the rising popularity of Latin American cuisine worldwide and the increasing demand for convenient, ready-to-eat meal solutions. This market is pivotal for food industry leaders aiming to expand their product lines and capitalize on global culinary trends.
The tortilla market has experienced a significant upturn in sales, reflecting broader consumer trends toward diverse culinary preferences and convenience foods. Over the 52 weeks ending April 17, 2022, the tortilla and tostada chip category witnessed a robust 7.3% increase in sales, reaching a total of $6.77 billion. This growth trajectory is underscored by a modest rise in unit sales, up 0.4% to 2.33 billion, and a notable increase in the average price per unit by 19 cents to $2.91, indicative of premiumization within the segment.
A closer examination of brand performance within the category reveals that Doritos continues to lead with a commanding presence, registering $3.0 billion in sales, an 8.9% increase from the previous year. This positions Doritos as holding nearly half (44.7%) of the total market share. Following Doritos, Tostitos maintains a solid second with sales of $1.5 billion, up 3.4%, accounting for 21.7% of the market share. Notably, Barcel has shown the most dynamic growth rate among the leading brands, with a 27.6% increase in sales to $762.3 million, capturing 11.3% of the market.
This data points to a competitive and evolving market landscape where brand positioning and product innovation play critical roles in capturing consumer interest. The upward movement in unit pricing also reflects an increased consumer willingness to invest in higher-quality, differentiated products, which could indicate opportunities for new entrants and existing players to explore premium and niche market segments within the broader tortilla industry.
Key Takeaways
- Market Growth: The Global Tortilla Market was valued at USD 10.5 billion in 2023. It is expected to reach USD 17.4 billion by 2033, with a CAGR of 5.3% during the forecast period from 2024 to 2033.
- By Ingredients: Corn dominated the market by ingredients, accounting for 53% of the share.
- By Processing Type: Fresh processing type led the market, capturing 64% of the overall share.
- By Product Type: Tortilla chips dominated the product type segment, holding a 37% market share.
- By Distribution Channel: Hypermarkets and supermarkets led the distribution channel with 38% market dominance.
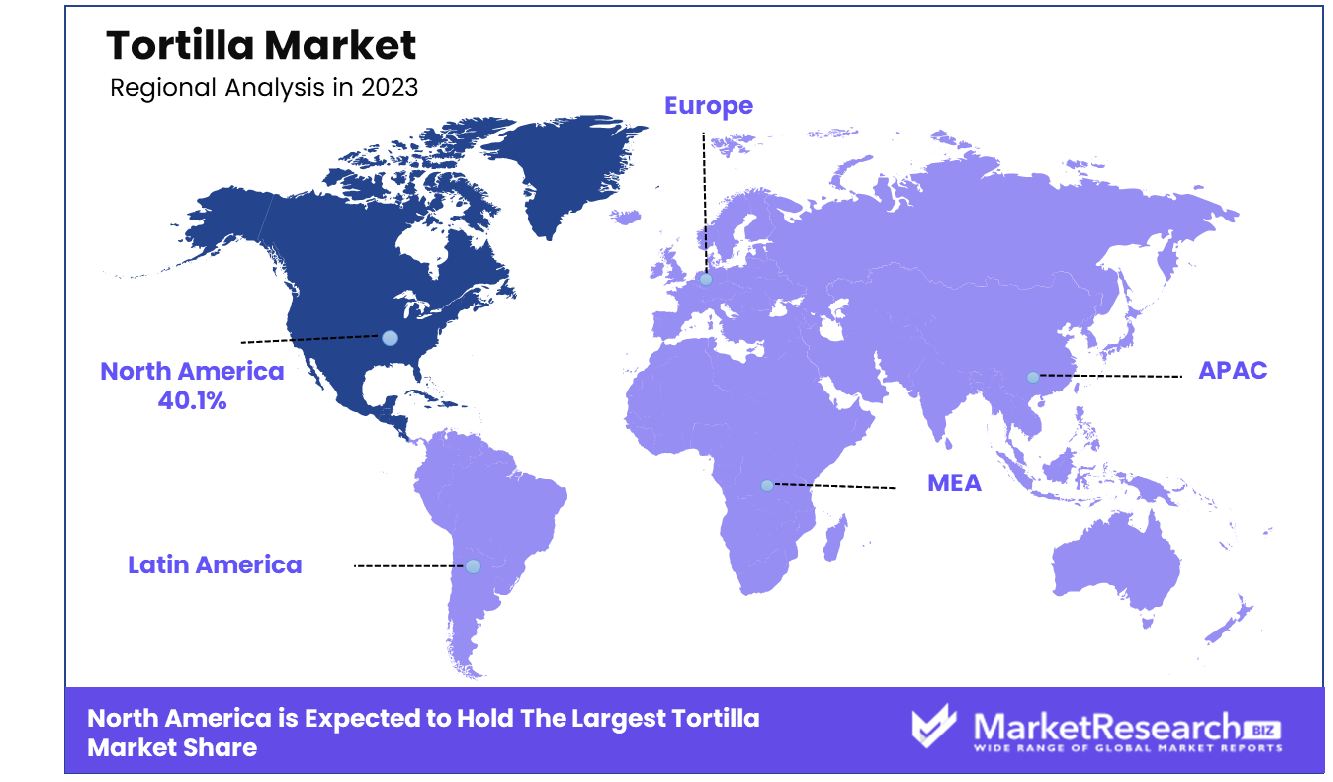
- Regional Dominance: North America dominates the Tortilla market, holding a 40.1% global share.
- Growth Opportunity: The global tortilla market is expanding due to its growing integration into mainstream diets and the rise of e-commerce platforms enhancing accessibility and consumer reach.
Driving factors
Health Perception Driving Demand
Tortillas are increasingly perceived as a healthier alternative to traditional bread options, a key driver for their rising market demand. This shift is largely due to consumer awareness about dietary choices and an ongoing trend towards gluten-free and lower-carb diets. Tortillas, especially those made from corn and whole grains, are often marketed as containing fewer calories and carbohydrates than conventional bread, making them an appealing option for health-conscious consumers.
This perception is bolstered by a growing body of dietary guidelines and nutritionists recommending whole grains as part of a balanced diet. As consumers continue to prioritize health and wellness, the demand for tortillas as a nutritious staple is expected to surge, directly influencing market growth.
Expanded Retail Presence Boosts Accessibility
The accessibility of tortilla-based products across various retail channels significantly contributes to the expansion of the Tortilla Market. Supermarkets, hypermarkets, and online grocery platforms have enhanced their tortilla product ranges, including organic, non-GMO, and exotic flavor variants, to cater to diverse consumer preferences. This widespread availability makes it convenient for consumers to incorporate tortillas into their daily meals, boosting purchase frequency.
The strategic placement of tortillas in prominent retail locations, alongside complementary products like salsa and guacamole, further stimulates impulse buying. Enhanced distribution networks and the increasing presence of tortillas in non-traditional markets like Asia and Europe also play crucial roles in market growth.
Global Cuisine Trends Elevate Tortilla Popularity
The increasing global popularity of Mexican and Latin American cuisines is another significant growth driver for the Tortilla Market. As international travel and culinary exploration rise, so does the appetite for authentic and ethnic foods. Tortillas are a fundamental component of Mexican and Latin American dishes, which are now staples in many global restaurants and households.
This culinary trend not only promotes the inclusion of tortillas in various international dishes but also inspires new product innovations, such as flavored tortillas that cater to regional tastes. The cross-cultural adoption of tortilla-based dishes, such as tacos and burritos, into daily cuisine across various demographics further accelerates market growth.
Restraining Factors
Cost Volatility Hampers Production Stability
Fluctuating raw material costs significantly restrain the growth of the Tortilla Market. The primary ingredients for tortillas include corn and wheat, the prices of which are highly susceptible to changes due to factors like climate variability, agricultural policies, and economic instability. For instance, adverse weather conditions can lead to poor crop yields, driving up the cost of corn and wheat. This volatility not only impacts the cost structure for tortilla manufacturers but also leads to inconsistent pricing in the consumer market, potentially deterring budget-conscious buyers.
Additionally, when raw material costs increase, manufacturers may be forced to cut corners on quality to maintain profit margins, which can adversely affect consumer satisfaction and loyalty. This dynamic poses a challenge to maintaining a stable growth trajectory for the tortilla market, as manufacturers struggle to balance cost, quality, and price in a competitive market.
Shifting Consumer Preferences Challenge Market Adaptability
Changing consumer preferences also poses a significant challenge to the Tortilla Market. As dietary trends evolve, there is a growing demand for healthier and more diverse food options. While tortillas are considered a healthier alternative to traditional bread, the increasing consumer interest in low-carbohydrate and keto diets can limit the demand for tortillas, which are primarily carbohydrate-based.
Furthermore, the surge in demand for gluten-free products challenges the tortilla market to innovate, as traditional wheat-based tortillas do not meet this dietary requirement. The market's ability to adapt to these dietary shifts through product innovation—such as introducing low-carb or gluten-free products tortillas—is crucial. However, the pace of consumer change often outstrips product development, leading to potential gaps in meeting consumer demands, thereby restraining market growth.
By Ingredients Analysis
Corn dominated 53% of the market share, highlighting its popularity among consumers and manufacturers.
In 2023, Corn held a dominant market position in the By Ingredients segment of the Tortilla Market, capturing more than a 53% share. This significant market share can be attributed to the widespread preference for corn tortillas, particularly in regions with a strong cultural inclination towards traditional Mexican cuisine. Corn tortillas are renowned for their authentic flavor and versatility in various dishes, driving their popularity among consumers.
The use of corn as a primary ingredient in tortillas is not only rooted in tradition but also supported by its nutritional benefits. Corn tortillas are naturally gluten-free, making them a preferred choice for consumers with gluten sensitivities or celiac disease. Additionally, the increasing consumer awareness regarding the health benefits of corn, such as its high fiber content and essential nutrients, has further fueled its demand.
On the other hand, Wheat also plays a significant role in the Ingredients segment of the Tortilla Market. Wheat tortillas, while not as dominant as their corn counterparts, have carved out a substantial niche, particularly in regions where dietary preferences lean towards wheat-based products. Wheat tortillas are often favored for their softer texture and ease of preparation in various modern and fusion culinary applications.
Wheat tortillas have gained traction due to their perceived health benefits, including a higher protein content compared to corn tortillas. This makes them a popular choice among health-conscious consumers seeking to balance their diet with a mix of macronutrients. The growing trend of high-protein and whole-grain diets has also contributed to the rising demand for wheat tortillas.
The competition between Corn and Wheat in the Ingredients segment of the Tortilla Market highlights the diverse consumer preferences and regional variations in dietary habits. As both ingredients continue to innovate and cater to evolving consumer tastes, their market shares are expected to see dynamic shifts in the coming years.
By Processing Type Analysis
Fresh products led with 64%, reflecting a strong preference for fresh over processed alternatives.
In 2023, Fresh held a dominant market position in the By Processing Type segment of the Tortilla Market, capturing more than a 64% share. This commanding market share is attributed to the growing consumer preference for fresh, minimally processed foods, which are perceived to be healthier and of higher quality. Fresh tortillas, often available in local markets and artisanal shops, appeal to consumers seeking authentic taste and texture, aligning with the increasing trend toward clean labels and natural food products.
The demand for fresh tortillas is also driven by their superior taste and pliability, which are crucial for preparing traditional dishes such as tacos, enchiladas, and quesadillas. Moreover, fresh tortillas tend to have fewer preservatives, which resonates with health-conscious consumers who are wary of artificial additives. The convenience of ready-to-use fresh tortillas further enhances their popularity, especially among busy consumers looking for quick meal solutions without compromising on quality.
On the other hand, Frozen tortillas hold a significant position in the market, although they lag behind fresh tortillas in terms of market share. Frozen tortillas offer extended shelf life and convenience, making them a popular choice in regions with limited access to fresh tortillas. They cater to consumers who prioritize longevity and the ability to store products for longer periods without sacrificing taste and texture upon reheating.
Frozen tortillas are particularly favored in the food service industry, where consistent quality and availability are essential. Restaurants, catering services, and other food service providers rely on frozen tortillas to maintain supply chain efficiency and minimize waste. Additionally, the rising trend of frozen ready-to-eat meals and snacks has bolstered the demand for frozen tortillas as a key ingredient in these products.
The competition between Fresh and Frozen tortillas in the By Processing Type segment of the Tortilla Market highlights the diverse consumer preferences and regional variations in accessibility. As both processing types continue to innovate and adapt to consumer needs, their market shares are expected to reflect ongoing shifts in consumer behavior and market dynamics.
By Product Type Analysis
Tortilla chips dominated 37% of sales, showcasing their significant consumer demand in the market.
In 2023, Tortilla Chips held a dominant market position in the By Product Type segment of the Tortilla Market, capturing more than a 37% share. This substantial market share is driven by the widespread popularity of tortilla chips as a snack food, both for casual consumption and in social settings. The convenience, variety of flavors, and versatility of tortilla chips in different culinary applications, such as nachos, dips, and salsas, have cemented their position as a preferred choice among consumers.
The demand for tortilla chips is further bolstered by the increasing trend towards convenient, ready-to-eat snacks. Health-conscious consumers are also drawn to baked and multigrain tortilla chip options, which offer a healthier alternative to traditional fried snacks. The growth of the snack food industry, coupled with innovative marketing strategies and new product launches by leading brands, has significantly contributed to the dominance of tortilla chips in the market.
Taco Shells, while not as dominant, play a crucial role in the market, appealing to consumers who enjoy preparing traditional Mexican dishes at home. Tostadas, another popular product type, offer a unique texture and taste experience, making them a favorite for various recipes and meal occasions. Both Taco Shells and Tostadas have a strong presence in markets with a rich culinary tradition of Mexican cuisine.
Flour Tortillas and Corn Tortillas are also significant contributors to the market. Flour Tortillas are favored for their soft texture and versatility in a wide range of dishes, from burritos to wraps. Corn Tortillas, valued for their authentic taste and cultural significance, remains a staple in many households, particularly in Latin American regions.
The diverse product offerings within the By Product Type segment of the Tortilla Market highlight the varied consumer preferences and culinary traditions across different regions. As manufacturers continue to innovate and cater to evolving tastes and dietary preferences, the market shares of these product types are expected to experience dynamic changes in the coming years.
By Distribution Channel Analysis
Hypermarkets/supermarkets dominated 38%, indicating their crucial role in product availability and consumer access.
In 2023, Hypermarkets/Supermarkets held a dominant market position in the By Distribution Channel segment of the Tortilla Market, capturing more than a 38% share. This significant market share is primarily driven by the wide availability and accessibility of tortillas in hypermarkets and supermarkets, which are frequented by a large number of consumers for their grocery shopping. These retail formats offer an extensive variety of tortilla products, including different brands, flavors, and types, making them a convenient one-stop shop for consumers.
Hypermarkets and supermarkets benefit from high foot traffic, strategic product placements, and frequent promotional activities that boost sales of tortilla products. Their extensive distribution networks ensure that a consistent supply of fresh and packaged tortillas is available to meet consumer demand. Additionally, the ability to offer competitive pricing and bulk purchase options attracts cost-conscious shoppers, further solidifying the dominance of hypermarkets and supermarkets in this segment.
Specialty Stores also hold a significant position in the market, catering to niche consumer segments looking for gourmet, organic, or specialty tortilla products. These stores often provide a more personalized shopping experience and offer high-quality, artisanal tortillas that appeal to discerning consumers. The focus on premium and unique product offerings allows specialty stores to capture a loyal customer base willing to pay a premium for quality and authenticity.
Online sales of tortillas have been growing steadily, driven by the increasing penetration of e-commerce and the convenience of home delivery. Online platforms offer a wide selection of tortilla products, often including customer reviews and detailed product information that help consumers make informed purchasing decisions. The flexibility of online shopping, combined with the rise of digital grocery platforms and direct-to-consumer models, has expanded the reach of tortilla products to a broader audience.
The competition between Hypermarkets/Supermarkets, Specialty Stores, and Online channels in the By Distribution Channel segment of the Tortilla Market reflects the diverse shopping preferences and behaviors of consumers. As each channel continues to evolve and adapt to changing market dynamics, their respective market shares are expected to experience shifts driven by consumer trends, technological advancements, and strategic retail innovations.
Key Market Segments
By Ingredients
- Wheat
- Corn
By Processing Type
- Fresh
- Frozen
By Product Type
- Tortilla Chips
- Taco Shells
- Tostadas
- Flour Tortillas
- Corn Tortillas
By Distribution Channel
- Hypermarkets/Supermarkets
- Specialty Stores
- Online
Growth Opportunity
Incorporation of Tortillas into Mainstream Dietary Habits
The global tortilla market is poised for significant growth, driven by the widespread incorporation of tortillas into mainstream dietary habits. As consumer preferences shift towards diverse and culturally enriched food options, tortillas are gaining prominence beyond their traditional markets. This trend is fueled by the rising popularity of Mexican cuisine globally, which has led to an increased demand for tortillas in both retail and food service sectors.
The versatility of tortillas, serving as a base for a variety of dishes such as tacos, burritos, and wraps, further enhances their appeal across different demographic segments. Moreover, manufacturers are capitalizing on this trend by expanding their product lines to include healthier options such as gluten-free, low-carb, and organic tortillas, catering to the growing health-conscious consumer base. This strategic diversification not only broadens the market reach but also reinforces the growth trajectory of the tortilla industry.
Rise of E-commerce Platforms for Tortilla Sales
The escalation of e-commerce platforms plays a transformative role in the tortilla market's expansion. With the advent of online shopping, tortilla manufacturers and retailers have found a lucrative channel to reach a broader audience. The convenience of online ordering, coupled with the ability to easily access a wide range of tortilla products, has significantly boosted sales.
E-commerce also provides an essential platform for small to medium-sized enterprises to compete on a larger scale, breaking geographical barriers and enhancing consumer outreach. The integration of advanced logistics solutions and the emphasis on maintaining product freshness during delivery further enhance customer satisfaction and loyalty. As e-commerce continues to evolve, it is expected to be a key driver for the tortilla market, facilitating sustained growth and market penetration in untapped regions.
Latest Trends
Artisanal and Handmade Tortillas
In 2023, the global tortilla market is witnessing a notable surge in the demand for artisanal and handmade tortillas, driven by consumers' increasing desire for authentic and traditional food experiences. This trend reflects a broader consumer shift towards artisanal food products that offer a taste of cultural authenticity and craftsmanship. Handmade tortillas are particularly appealing because they are perceived as fresher, tastier, and more authentic than their mass-produced counterparts.
As a result, both small-scale artisan shops and large manufacturers are tapping into this trend by offering premium, handcrafted tortillas that cater to gourmet preferences. These products often leverage traditional preparation methods and highlight their heritage, which significantly appeals to consumers seeking unique and authentic dining experiences.
Fortified Tortillas
Another emerging trend in the tortilla market is the introduction of fortified tortillas, which are enhanced with additional nutrients such as vitamins and minerals. This innovation targets health-conscious consumers looking to improve their dietary intake without sacrificing convenience or flavor. Fortified tortillas are becoming increasingly popular as they align with the growing demand for functional foods that support a healthy lifestyle.
Manufacturers are incorporating a range of fortifications, including fiber, protein, calcium, and iron, to cater to specific health concerns such as digestive health, energy levels, and bone density. The development of fortified tortillas not only addresses health and nutritional deficiencies but also offers manufacturers a competitive edge in a market that is becoming more attentive to health and wellness.
Regional Analysis
The Tortilla market in North America dominates with a substantial 40.1% share of the global market.
The Tortilla market exhibits diverse dynamics across different geographical regions. In North America, this market holds a commanding share, accounting for approximately 40.1% of the global market. This dominance is primarily driven by the widespread consumption of Mexican and Tex-Mex cuisines, with the U.S. leading in both production and consumption of tortillas. Factors such as the increasing Hispanic population and the rising popularity of convenience foods significantly contribute to market growth.
Moving to Europe, the market is experiencing gradual expansion, fueled by the increasing adoption of ethnic cuisines and the rising demand for gluten-free products. Countries such as the UK and Germany are seeing a surge in the availability of tortillas in retail outlets, indicating a growing consumer preference for non-traditional food options.
In the Asia Pacific region, the market is emerging, with countries like China and India witnessing a growing inclination towards international cuisines. The region's vast population base, coupled with urbanization and the expanding middle class, offers substantial growth opportunities for the tortilla market.
The Middle East & Africa region shows potential for growth due to urbanization and changing dietary patterns. The increasing exposure to global cuisine, along with a rising expatriate population, particularly in the Gulf Cooperation Council (GCC) countries, supports the adoption of tortillas.
Lastly, Latin America, being the origin of tortillas, naturally exhibits a robust market presence. However, the growth in this region is more stable and mature, with innovation in product offerings and packaging driving further market expansion.
Key Regions and Countries
North America
- The US
- Canada
- Rest of North America
Europe
- Germany
- France
- The UK
- Spain
- Netherlands
- Russia
- Italy
- Rest of Europe
Asia-Pacific
- China
- Japan
- Singapore
- Thailand
- South Korea
- Vietnam
- India
- New Zealand
- Rest of Asia Pacific
Latin America
- Mexico
- Brazil
- Rest of Latin America
Middle East & Africa
- Saudi Arabia
- South Africa
- UAE
- Rest of Middle East & Africa
Key Players Analysis
In the 2023 Global Tortilla Market, key players have exhibited significant market presence and influence, driving competitive dynamics and innovation trends. Among these, La Tortilla Factory stands out for its commitment to health-oriented products, catering to the rising consumer demand for gluten-free and low-carb options. This strategic focus not only differentiates them but also positions them well in niche segments.
PepsiCo Inc., with its vast distribution network and established brand reputation, capitalizes on its extensive reach to dominate the market. Its product diversification and aggressive marketing strategies further enhance its market share, making it a formidable competitor in the tortilla market.
Siete Family Foods has carved a unique space for itself by focusing on grain-free and paleo-friendly tortillas, appealing to health-conscious consumers and those with dietary restrictions. Their commitment to quality ingredients and authentic Mexican flavors drives their brand loyalty and consumer base growth.
Reser’s Fine Foods and Aranda’s Tortilla Company Inc. both emphasize traditional and authentic tortilla offerings, focusing on quality and taste to retain customer loyalty in a market where authenticity is highly valued.
Grupo Bimbo SAB de CV leverages its global brand presence and extensive product portfolio to maintain a strong position in the market. Their strategic acquisitions and innovations in product development ensure continued growth and market expansion.
Easy Foods Inc. and Catallia Mexican Foods emphasize custom solutions and versatility, catering to both the retail and food service sectors, which allows them to maintain a competitive edge.
Lastly, Tyson Foods Inc. integrates tortillas into its broader product strategy, offering ready-to-eat meal solutions that appeal to time-conscious consumers, thereby enhancing its market reach and consumer base.
Market Key Players
- La Tortilla Factory
- PepsiCo Inc.
- Siete Family Foods
- Reser’s Fine Foods
- Aranda’s Tortilla Company Inc.
- Grupo Bimbo SAB de CV
- Easy Foods Inc.
- Catallia Mexican Foods
- Tyson Foods Inc.
Recent Development
- In March 2024, Mexilla Tortillas innovate with diverse flavors and ingredients, offering clean label, organic, and protein-rich options. With personalized service and certifications, Mexilla serves Europe, the Middle East, and Africa.
- In June 2023, Tortilla and flatbread sales rose with BFY innovation and healthy halo. Circana reports 1% segment growth; Toufayan notes nutritional benefits driving popularity. Tia Lupita Foods sees global cuisine influence.
Report Scope
Report Features Description Market Value (2023) USD 10.5 Billion Forecast Revenue (2033) USD 17.4 Billion CAGR (2024-2032) 5.3% Base Year for Estimation 2023 Historic Period 2016-2023 Forecast Period 2024-2033 Report Coverage Revenue Forecast, Market Dynamics, COVID-19 Impact, Competitive Landscape, Recent Developments Segments Covered By Ingredients(Wheat, Corn), By Processing Type(Fresh, Frozen), By Product Type(Tortilla Chips, Taco Shells, Tostadas, Flour Tortillas, Corn Tortillas), By Distribution Channel(Hypermarkets/Supermarkets, Specialty Stores, Online) Regional Analysis North America - The US, Canada, Rest of North America, Europe - Germany, France, The UK, Spain, Italy, Russia, Netherlands, Rest of Europe, Asia-Pacific - China, Japan, South Korea, India, New Zealand, Singapore, Thailand, Vietnam, Rest of Asia Pacific, Latin America - Brazil, Mexico, Rest of Latin America, Middle East & Africa - South Africa, Saudi Arabia, UAE, Rest of Middle East & Africa Competitive Landscape La Tortilla Factory, PepsiCo Inc., Siete Family Foods, Reser’s Fine Foods, Aranda’s Tortilla Company Inc., Grupo Bimbo SAB de CV, Easy Foods Inc., Catallia Mexican Foods, Tyson Foods Inc. Customization Scope Customization for segments, region/country-level will be provided. Moreover, additional customization can be done based on the requirements. Purchase Options We have three licenses to opt for Single User License, Multi-User License (Up to 5 Users), Corporate Use License (Unlimited User and Printable PDF) -
- 1. Executive Summary
- 1.1. Definition
- 1.2. Taxonomy
- 1.3. Research Scope
- 1.4. Key Analysis
- 1.5. Key Findings by Major Segments
- 1.6. Top strategies by Major Players
- 2. Global Tortilla Market Overview
- 2.1. Tortilla Market Dynamics
- 2.1.1. Drivers
- 2.1.2. Opportunities
- 2.1.3. Restraints
- 2.1.4. Challenges
- 2.2. Macro-economic Factors
- 2.3. Regulatory Framework
- 2.4. Market Investment Feasibility Index
- 2.5. PEST Analysis
- 2.6. PORTER’S Five Force Analysis
- 2.7. Drivers & Restraints Impact Analysis
- 2.8. Industry Chain Analysis
- 2.9. Cost Structure Analysis
- 2.10. Marketing Strategy
- 2.11. Russia-Ukraine War Impact Analysis
- 2.12. Opportunity Map Analysis
- 2.13. Market Competition Scenario Analysis
- 2.14. Product Life Cycle Analysis
- 2.15. Opportunity Orbits
- 2.16. Manufacturer Intensity Map
- 2.17. Major Companies sales by Value & Volume
- 2.1. Tortilla Market Dynamics
- 3. Global Tortilla Market Analysis, Opportunity and Forecast, 2016-2032
- 3.1. Global Tortilla Market Analysis, 2016-2021
- 3.2. Global Tortilla Market Opportunity and Forecast, 2023-2032
- 3.3. Global Tortilla Market Analysis, Opportunity and Forecast, By By Ingredients, 2016-2032
- 3.3.1. Global Tortilla Market Analysis by By Ingredients: Introduction
- 3.3.2. Market Size Absolute $ Opportunity Analysis and Forecast, By By Ingredients, 2016-2032
- 3.3.3. Wheat
- 3.3.4. Corn
- 3.4. Global Tortilla Market Analysis, Opportunity and Forecast, By By Processing Type, 2016-2032
- 3.4.1. Global Tortilla Market Analysis by By Processing Type: Introduction
- 3.4.2. Market Size Absolute $ Opportunity Analysis and Forecast, By By Processing Type, 2016-2032
- 3.4.3. Fresh
- 3.4.4. Frozen
- 3.5. Global Tortilla Market Analysis, Opportunity and Forecast, By By Product Type, 2016-2032
- 3.5.1. Global Tortilla Market Analysis by By Product Type: Introduction
- 3.5.2. Market Size Absolute $ Opportunity Analysis and Forecast, By By Product Type, 2016-2032
- 3.5.3. Tortilla Chips
- 3.5.4. Taco Shells
- 3.5.5. Tostadas
- 3.5.6. Flour Tortillas
- 3.5.7. Corn Tortillas
- 3.6. Global Tortilla Market Analysis, Opportunity and Forecast, By By Distribution Channel, 2016-2032
- 3.6.1. Global Tortilla Market Analysis by By Distribution Channel: Introduction
- 3.6.2. Market Size Absolute $ Opportunity Analysis and Forecast, By By Distribution Channel, 2016-2032
- 3.6.3. Hypermarkets/Supermarkets
- 3.6.4. Specialty Stores
- 3.6.5. Online
- 4. North America Tortilla Market Analysis, Opportunity and Forecast, 2016-2032
- 4.1. North America Tortilla Market Analysis, 2016-2021
- 4.2. North America Tortilla Market Opportunity and Forecast, 2023-2032
- 4.3. North America Tortilla Market Analysis, Opportunity and Forecast, By By Ingredients, 2016-2032
- 4.3.1. North America Tortilla Market Analysis by By Ingredients: Introduction
- 4.3.2. Market Size Absolute $ Opportunity Analysis and Forecast, By By Ingredients, 2016-2032
- 4.3.3. Wheat
- 4.3.4. Corn
- 4.4. North America Tortilla Market Analysis, Opportunity and Forecast, By By Processing Type, 2016-2032
- 4.4.1. North America Tortilla Market Analysis by By Processing Type: Introduction
- 4.4.2. Market Size Absolute $ Opportunity Analysis and Forecast, By By Processing Type, 2016-2032
- 4.4.3. Fresh
- 4.4.4. Frozen
- 4.5. North America Tortilla Market Analysis, Opportunity and Forecast, By By Product Type, 2016-2032
- 4.5.1. North America Tortilla Market Analysis by By Product Type: Introduction
- 4.5.2. Market Size Absolute $ Opportunity Analysis and Forecast, By By Product Type, 2016-2032
- 4.5.3. Tortilla Chips
- 4.5.4. Taco Shells
- 4.5.5. Tostadas
- 4.5.6. Flour Tortillas
- 4.5.7. Corn Tortillas
- 4.6. North America Tortilla Market Analysis, Opportunity and Forecast, By By Distribution Channel, 2016-2032
- 4.6.1. North America Tortilla Market Analysis by By Distribution Channel: Introduction
- 4.6.2. Market Size Absolute $ Opportunity Analysis and Forecast, By By Distribution Channel, 2016-2032
- 4.6.3. Hypermarkets/Supermarkets
- 4.6.4. Specialty Stores
- 4.6.5. Online
- 4.7. North America Tortilla Market Analysis, Opportunity and Forecast, By Country , 2016-2032
- 4.7.1. North America Tortilla Market Analysis by Country : Introduction
- 4.7.2. Market Size Absolute $ Opportunity Analysis and Forecast, Country , 2016-2032
- 4.7.2.1. The US
- 4.7.2.2. Canada
- 4.7.2.3. Mexico
- 5. Western Europe Tortilla Market Analysis, Opportunity and Forecast, 2016-2032
- 5.1. Western Europe Tortilla Market Analysis, 2016-2021
- 5.2. Western Europe Tortilla Market Opportunity and Forecast, 2023-2032
- 5.3. Western Europe Tortilla Market Analysis, Opportunity and Forecast, By By Ingredients, 2016-2032
- 5.3.1. Western Europe Tortilla Market Analysis by By Ingredients: Introduction
- 5.3.2. Market Size Absolute $ Opportunity Analysis and Forecast, By By Ingredients, 2016-2032
- 5.3.3. Wheat
- 5.3.4. Corn
- 5.4. Western Europe Tortilla Market Analysis, Opportunity and Forecast, By By Processing Type, 2016-2032
- 5.4.1. Western Europe Tortilla Market Analysis by By Processing Type: Introduction
- 5.4.2. Market Size Absolute $ Opportunity Analysis and Forecast, By By Processing Type, 2016-2032
- 5.4.3. Fresh
- 5.4.4. Frozen
- 5.5. Western Europe Tortilla Market Analysis, Opportunity and Forecast, By By Product Type, 2016-2032
- 5.5.1. Western Europe Tortilla Market Analysis by By Product Type: Introduction
- 5.5.2. Market Size Absolute $ Opportunity Analysis and Forecast, By By Product Type, 2016-2032
- 5.5.3. Tortilla Chips
- 5.5.4. Taco Shells
- 5.5.5. Tostadas
- 5.5.6. Flour Tortillas
- 5.5.7. Corn Tortillas
- 5.6. Western Europe Tortilla Market Analysis, Opportunity and Forecast, By By Distribution Channel, 2016-2032
- 5.6.1. Western Europe Tortilla Market Analysis by By Distribution Channel: Introduction
- 5.6.2. Market Size Absolute $ Opportunity Analysis and Forecast, By By Distribution Channel, 2016-2032
- 5.6.3. Hypermarkets/Supermarkets
- 5.6.4. Specialty Stores
- 5.6.5. Online
- 5.7. Western Europe Tortilla Market Analysis, Opportunity and Forecast, By Country , 2016-2032
- 5.7.1. Western Europe Tortilla Market Analysis by Country : Introduction
- 5.7.2. Market Size Absolute $ Opportunity Analysis and Forecast, Country , 2016-2032
- 5.7.2.1. Germany
- 5.7.2.2. France
- 5.7.2.3. The UK
- 5.7.2.4. Spain
- 5.7.2.5. Italy
- 5.7.2.6. Portugal
- 5.7.2.7. Ireland
- 5.7.2.8. Austria
- 5.7.2.9. Switzerland
- 5.7.2.10. Benelux
- 5.7.2.11. Nordic
- 5.7.2.12. Rest of Western Europe
- 6. Eastern Europe Tortilla Market Analysis, Opportunity and Forecast, 2016-2032
- 6.1. Eastern Europe Tortilla Market Analysis, 2016-2021
- 6.2. Eastern Europe Tortilla Market Opportunity and Forecast, 2023-2032
- 6.3. Eastern Europe Tortilla Market Analysis, Opportunity and Forecast, By By Ingredients, 2016-2032
- 6.3.1. Eastern Europe Tortilla Market Analysis by By Ingredients: Introduction
- 6.3.2. Market Size Absolute $ Opportunity Analysis and Forecast, By By Ingredients, 2016-2032
- 6.3.3. Wheat
- 6.3.4. Corn
- 6.4. Eastern Europe Tortilla Market Analysis, Opportunity and Forecast, By By Processing Type, 2016-2032
- 6.4.1. Eastern Europe Tortilla Market Analysis by By Processing Type: Introduction
- 6.4.2. Market Size Absolute $ Opportunity Analysis and Forecast, By By Processing Type, 2016-2032
- 6.4.3. Fresh
- 6.4.4. Frozen
- 6.5. Eastern Europe Tortilla Market Analysis, Opportunity and Forecast, By By Product Type, 2016-2032
- 6.5.1. Eastern Europe Tortilla Market Analysis by By Product Type: Introduction
- 6.5.2. Market Size Absolute $ Opportunity Analysis and Forecast, By By Product Type, 2016-2032
- 6.5.3. Tortilla Chips
- 6.5.4. Taco Shells
- 6.5.5. Tostadas
- 6.5.6. Flour Tortillas
- 6.5.7. Corn Tortillas
- 6.6. Eastern Europe Tortilla Market Analysis, Opportunity and Forecast, By By Distribution Channel, 2016-2032
- 6.6.1. Eastern Europe Tortilla Market Analysis by By Distribution Channel: Introduction
- 6.6.2. Market Size Absolute $ Opportunity Analysis and Forecast, By By Distribution Channel, 2016-2032
- 6.6.3. Hypermarkets/Supermarkets
- 6.6.4. Specialty Stores
- 6.6.5. Online
- 6.7. Eastern Europe Tortilla Market Analysis, Opportunity and Forecast, By Country , 2016-2032
- 6.7.1. Eastern Europe Tortilla Market Analysis by Country : Introduction
- 6.7.2. Market Size Absolute $ Opportunity Analysis and Forecast, Country , 2016-2032
- 6.7.2.1. Russia
- 6.7.2.2. Poland
- 6.7.2.3. The Czech Republic
- 6.7.2.4. Greece
- 6.7.2.5. Rest of Eastern Europe
- 7. APAC Tortilla Market Analysis, Opportunity and Forecast, 2016-2032
- 7.1. APAC Tortilla Market Analysis, 2016-2021
- 7.2. APAC Tortilla Market Opportunity and Forecast, 2023-2032
- 7.3. APAC Tortilla Market Analysis, Opportunity and Forecast, By By Ingredients, 2016-2032
- 7.3.1. APAC Tortilla Market Analysis by By Ingredients: Introduction
- 7.3.2. Market Size Absolute $ Opportunity Analysis and Forecast, By By Ingredients, 2016-2032
- 7.3.3. Wheat
- 7.3.4. Corn
- 7.4. APAC Tortilla Market Analysis, Opportunity and Forecast, By By Processing Type, 2016-2032
- 7.4.1. APAC Tortilla Market Analysis by By Processing Type: Introduction
- 7.4.2. Market Size Absolute $ Opportunity Analysis and Forecast, By By Processing Type, 2016-2032
- 7.4.3. Fresh
- 7.4.4. Frozen
- 7.5. APAC Tortilla Market Analysis, Opportunity and Forecast, By By Product Type, 2016-2032
- 7.5.1. APAC Tortilla Market Analysis by By Product Type: Introduction
- 7.5.2. Market Size Absolute $ Opportunity Analysis and Forecast, By By Product Type, 2016-2032
- 7.5.3. Tortilla Chips
- 7.5.4. Taco Shells
- 7.5.5. Tostadas
- 7.5.6. Flour Tortillas
- 7.5.7. Corn Tortillas
- 7.6. APAC Tortilla Market Analysis, Opportunity and Forecast, By By Distribution Channel, 2016-2032
- 7.6.1. APAC Tortilla Market Analysis by By Distribution Channel: Introduction
- 7.6.2. Market Size Absolute $ Opportunity Analysis and Forecast, By By Distribution Channel, 2016-2032
- 7.6.3. Hypermarkets/Supermarkets
- 7.6.4. Specialty Stores
- 7.6.5. Online
- 7.7. APAC Tortilla Market Analysis, Opportunity and Forecast, By Country , 2016-2032
- 7.7.1. APAC Tortilla Market Analysis by Country : Introduction
- 7.7.2. Market Size Absolute $ Opportunity Analysis and Forecast, Country , 2016-2032
- 7.7.2.1. China
- 7.7.2.2. Japan
- 7.7.2.3. South Korea
- 7.7.2.4. India
- 7.7.2.5. Australia & New Zeland
- 7.7.2.6. Indonesia
- 7.7.2.7. Malaysia
- 7.7.2.8. Philippines
- 7.7.2.9. Singapore
- 7.7.2.10. Thailand
- 7.7.2.11. Vietnam
- 7.7.2.12. Rest of APAC
- 8. Latin America Tortilla Market Analysis, Opportunity and Forecast, 2016-2032
- 8.1. Latin America Tortilla Market Analysis, 2016-2021
- 8.2. Latin America Tortilla Market Opportunity and Forecast, 2023-2032
- 8.3. Latin America Tortilla Market Analysis, Opportunity and Forecast, By By Ingredients, 2016-2032
- 8.3.1. Latin America Tortilla Market Analysis by By Ingredients: Introduction
- 8.3.2. Market Size Absolute $ Opportunity Analysis and Forecast, By By Ingredients, 2016-2032
- 8.3.3. Wheat
- 8.3.4. Corn
- 8.4. Latin America Tortilla Market Analysis, Opportunity and Forecast, By By Processing Type, 2016-2032
- 8.4.1. Latin America Tortilla Market Analysis by By Processing Type: Introduction
- 8.4.2. Market Size Absolute $ Opportunity Analysis and Forecast, By By Processing Type, 2016-2032
- 8.4.3. Fresh
- 8.4.4. Frozen
- 8.5. Latin America Tortilla Market Analysis, Opportunity and Forecast, By By Product Type, 2016-2032
- 8.5.1. Latin America Tortilla Market Analysis by By Product Type: Introduction
- 8.5.2. Market Size Absolute $ Opportunity Analysis and Forecast, By By Product Type, 2016-2032
- 8.5.3. Tortilla Chips
- 8.5.4. Taco Shells
- 8.5.5. Tostadas
- 8.5.6. Flour Tortillas
- 8.5.7. Corn Tortillas
- 8.6. Latin America Tortilla Market Analysis, Opportunity and Forecast, By By Distribution Channel, 2016-2032
- 8.6.1. Latin America Tortilla Market Analysis by By Distribution Channel: Introduction
- 8.6.2. Market Size Absolute $ Opportunity Analysis and Forecast, By By Distribution Channel, 2016-2032
- 8.6.3. Hypermarkets/Supermarkets
- 8.6.4. Specialty Stores
- 8.6.5. Online
- 8.7. Latin America Tortilla Market Analysis, Opportunity and Forecast, By Country , 2016-2032
- 8.7.1. Latin America Tortilla Market Analysis by Country : Introduction
- 8.7.2. Market Size Absolute $ Opportunity Analysis and Forecast, Country , 2016-2032
- 8.7.2.1. Brazil
- 8.7.2.2. Colombia
- 8.7.2.3. Chile
- 8.7.2.4. Argentina
- 8.7.2.5. Costa Rica
- 8.7.2.6. Rest of Latin America
- 9. Middle East & Africa Tortilla Market Analysis, Opportunity and Forecast, 2016-2032
- 9.1. Middle East & Africa Tortilla Market Analysis, 2016-2021
- 9.2. Middle East & Africa Tortilla Market Opportunity and Forecast, 2023-2032
- 9.3. Middle East & Africa Tortilla Market Analysis, Opportunity and Forecast, By By Ingredients, 2016-2032
- 9.3.1. Middle East & Africa Tortilla Market Analysis by By Ingredients: Introduction
- 9.3.2. Market Size Absolute $ Opportunity Analysis and Forecast, By By Ingredients, 2016-2032
- 9.3.3. Wheat
- 9.3.4. Corn
- 9.4. Middle East & Africa Tortilla Market Analysis, Opportunity and Forecast, By By Processing Type, 2016-2032
- 9.4.1. Middle East & Africa Tortilla Market Analysis by By Processing Type: Introduction
- 9.4.2. Market Size Absolute $ Opportunity Analysis and Forecast, By By Processing Type, 2016-2032
- 9.4.3. Fresh
- 9.4.4. Frozen
- 9.5. Middle East & Africa Tortilla Market Analysis, Opportunity and Forecast, By By Product Type, 2016-2032
- 9.5.1. Middle East & Africa Tortilla Market Analysis by By Product Type: Introduction
- 9.5.2. Market Size Absolute $ Opportunity Analysis and Forecast, By By Product Type, 2016-2032
- 9.5.3. Tortilla Chips
- 9.5.4. Taco Shells
- 9.5.5. Tostadas
- 9.5.6. Flour Tortillas
- 9.5.7. Corn Tortillas
- 9.6. Middle East & Africa Tortilla Market Analysis, Opportunity and Forecast, By By Distribution Channel, 2016-2032
- 9.6.1. Middle East & Africa Tortilla Market Analysis by By Distribution Channel: Introduction
- 9.6.2. Market Size Absolute $ Opportunity Analysis and Forecast, By By Distribution Channel, 2016-2032
- 9.6.3. Hypermarkets/Supermarkets
- 9.6.4. Specialty Stores
- 9.6.5. Online
- 9.7. Middle East & Africa Tortilla Market Analysis, Opportunity and Forecast, By Country , 2016-2032
- 9.7.1. Middle East & Africa Tortilla Market Analysis by Country : Introduction
- 9.7.2. Market Size Absolute $ Opportunity Analysis and Forecast, Country , 2016-2032
- 9.7.2.1. Algeria
- 9.7.2.2. Egypt
- 9.7.2.3. Israel
- 9.7.2.4. Kuwait
- 9.7.2.5. Nigeria
- 9.7.2.6. Saudi Arabia
- 9.7.2.7. South Africa
- 9.7.2.8. Turkey
- 9.7.2.9. The UAE
- 9.7.2.10. Rest of MEA
- 10. Global Tortilla Market Analysis, Opportunity and Forecast, By Region , 2016-2032
- 10.1. Global Tortilla Market Analysis by Region : Introduction
- 10.2. Market Size Absolute $ Opportunity Analysis and Forecast, By Region , 2016-2032
- 10.2.1. North America
- 10.2.2. Western Europe
- 10.2.3. Eastern Europe
- 10.2.4. APAC
- 10.2.5. Latin America
- 10.2.6. Middle East & Africa
- 11. Global Tortilla Market Competitive Landscape, Market Share Analysis, and Company Profiles
- 11.1. Market Share Analysis
- 11.2. Company Profiles
- 11.3. La Tortilla Factory
- 11.3.1. Company Overview
- 11.3.2. Financial Highlights
- 11.3.3. Product Portfolio
- 11.3.4. SWOT Analysis
- 11.3.5. Key Strategies and Developments
- 11.4. PepsiCo Inc.
- 11.4.1. Company Overview
- 11.4.2. Financial Highlights
- 11.4.3. Product Portfolio
- 11.4.4. SWOT Analysis
- 11.4.5. Key Strategies and Developments
- 11.5. Siete Family Foods
- 11.5.1. Company Overview
- 11.5.2. Financial Highlights
- 11.5.3. Product Portfolio
- 11.5.4. SWOT Analysis
- 11.5.5. Key Strategies and Developments
- 11.6. Reser’s Fine Foods
- 11.6.1. Company Overview
- 11.6.2. Financial Highlights
- 11.6.3. Product Portfolio
- 11.6.4. SWOT Analysis
- 11.6.5. Key Strategies and Developments
- 11.7. Aranda’s Tortilla Company Inc.
- 11.7.1. Company Overview
- 11.7.2. Financial Highlights
- 11.7.3. Product Portfolio
- 11.7.4. SWOT Analysis
- 11.7.5. Key Strategies and Developments
- 11.8. Grupo Bimbo SAB de CV
- 11.8.1. Company Overview
- 11.8.2. Financial Highlights
- 11.8.3. Product Portfolio
- 11.8.4. SWOT Analysis
- 11.8.5. Key Strategies and Developments
- 11.9. Easy Foods Inc.
- 11.9.1. Company Overview
- 11.9.2. Financial Highlights
- 11.9.3. Product Portfolio
- 11.9.4. SWOT Analysis
- 11.9.5. Key Strategies and Developments
- 11.10. Catallia Mexican Foods
- 11.10.1. Company Overview
- 11.10.2. Financial Highlights
- 11.10.3. Product Portfolio
- 11.10.4. SWOT Analysis
- 11.10.5. Key Strategies and Developments
- 11.11. Tyson Foods Inc.
- 11.11.1. Company Overview
- 11.11.2. Financial Highlights
- 11.11.3. Product Portfolio
- 11.11.4. SWOT Analysis
- 11.11.5. Key Strategies and Developments
- 11.13.1. Company Overview
- 11.13.2. Financial Highlights
- 11.13.3. Product Portfolio
- 11.13.4. SWOT Analysis
- 11.13.5. Key Strategies and Developments
- 12. Assumptions and Acronyms
- 13. Research Methodology
- 14. Contact
"
- List of Figures
- "
- Figure 1: Global Tortilla Market Revenue (US$ Mn) Market Share by By Ingredients in 2022
- Figure 2: Global Tortilla Market Market Attractiveness Analysis by By Ingredients, 2016-2032
- Figure 3: Global Tortilla Market Revenue (US$ Mn) Market Share by By Processing Typein 2022
- Figure 4: Global Tortilla Market Market Attractiveness Analysis by By Processing Type, 2016-2032
- Figure 5: Global Tortilla Market Revenue (US$ Mn) Market Share by By Product Typein 2022
- Figure 6: Global Tortilla Market Market Attractiveness Analysis by By Product Type, 2016-2032
- Figure 7: Global Tortilla Market Revenue (US$ Mn) Market Share by By Distribution Channelin 2022
- Figure 8: Global Tortilla Market Market Attractiveness Analysis by By Distribution Channel, 2016-2032
- Figure 9: Global Tortilla Market Revenue (US$ Mn) Market Share by Region in 2022
- Figure 10: Global Tortilla Market Market Attractiveness Analysis by Region, 2016-2032
- Figure 11: Global Tortilla Market Market Revenue (US$ Mn) (2016-2032)
- Figure 12: Global Tortilla Market Market Revenue (US$ Mn) Comparison by Region (2016-2032)
- Figure 13: Global Tortilla Market Market Revenue (US$ Mn) Comparison by By Ingredients (2016-2032)
- Figure 14: Global Tortilla Market Market Revenue (US$ Mn) Comparison by By Processing Type (2016-2032)
- Figure 15: Global Tortilla Market Market Revenue (US$ Mn) Comparison by By Product Type (2016-2032)
- Figure 16: Global Tortilla Market Market Revenue (US$ Mn) Comparison by By Distribution Channel (2016-2032)
- Figure 17: Global Tortilla Market Market Y-o-Y Growth Rate Comparison by Region (2016-2032)
- Figure 18: Global Tortilla Market Market Y-o-Y Growth Rate Comparison by By Ingredients (2016-2032)
- Figure 19: Global Tortilla Market Market Y-o-Y Growth Rate Comparison by By Processing Type (2016-2032)
- Figure 20: Global Tortilla Market Market Y-o-Y Growth Rate Comparison by By Product Type (2016-2032)
- Figure 21: Global Tortilla Market Market Y-o-Y Growth Rate Comparison by By Distribution Channel (2016-2032)
- Figure 22: Global Tortilla Market Market Share Comparison by Region (2016-2032)
- Figure 23: Global Tortilla Market Market Share Comparison by By Ingredients (2016-2032)
- Figure 24: Global Tortilla Market Market Share Comparison by By Processing Type (2016-2032)
- Figure 25: Global Tortilla Market Market Share Comparison by By Product Type (2016-2032)
- Figure 26: Global Tortilla Market Market Share Comparison by By Distribution Channel (2016-2032)
- Figure 27: North America Tortilla Market Revenue (US$ Mn) Market Share by By Ingredientsin 2022
- Figure 28: North America Tortilla Market Market Attractiveness Analysis by By Ingredients, 2016-2032
- Figure 29: North America Tortilla Market Revenue (US$ Mn) Market Share by By Processing Typein 2022
- Figure 30: North America Tortilla Market Market Attractiveness Analysis by By Processing Type, 2016-2032
- Figure 31: North America Tortilla Market Revenue (US$ Mn) Market Share by By Product Typein 2022
- Figure 32: North America Tortilla Market Market Attractiveness Analysis by By Product Type, 2016-2032
- Figure 33: North America Tortilla Market Revenue (US$ Mn) Market Share by By Distribution Channelin 2022
- Figure 34: North America Tortilla Market Market Attractiveness Analysis by By Distribution Channel, 2016-2032
- Figure 35: North America Tortilla Market Revenue (US$ Mn) Market Share by Country in 2022
- Figure 36: North America Tortilla Market Market Attractiveness Analysis by Country, 2016-2032
- Figure 37: North America Tortilla Market Market Revenue (US$ Mn) (2016-2032)
- Figure 38: North America Tortilla Market Market Revenue (US$ Mn) Comparison by Country (2016-2032)
- Figure 39: North America Tortilla Market Market Revenue (US$ Mn) Comparison by By Ingredients (2016-2032)
- Figure 40: North America Tortilla Market Market Revenue (US$ Mn) Comparison by By Processing Type (2016-2032)
- Figure 41: North America Tortilla Market Market Revenue (US$ Mn) Comparison by By Product Type (2016-2032)
- Figure 42: North America Tortilla Market Market Revenue (US$ Mn) Comparison by By Distribution Channel (2016-2032)
- Figure 43: North America Tortilla Market Market Y-o-Y Growth Rate Comparison by Country (2016-2032)
- Figure 44: North America Tortilla Market Market Y-o-Y Growth Rate Comparison by By Ingredients (2016-2032)
- Figure 45: North America Tortilla Market Market Y-o-Y Growth Rate Comparison by By Processing Type (2016-2032)
- Figure 46: North America Tortilla Market Market Y-o-Y Growth Rate Comparison by By Product Type (2016-2032)
- Figure 47: North America Tortilla Market Market Y-o-Y Growth Rate Comparison by By Distribution Channel (2016-2032)
- Figure 48: North America Tortilla Market Market Share Comparison by Country (2016-2032)
- Figure 49: North America Tortilla Market Market Share Comparison by By Ingredients (2016-2032)
- Figure 50: North America Tortilla Market Market Share Comparison by By Processing Type (2016-2032)
- Figure 51: North America Tortilla Market Market Share Comparison by By Product Type (2016-2032)
- Figure 52: North America Tortilla Market Market Share Comparison by By Distribution Channel (2016-2032)
- Figure 53: Western Europe Tortilla Market Revenue (US$ Mn) Market Share by By Ingredientsin 2022
- Figure 54: Western Europe Tortilla Market Market Attractiveness Analysis by By Ingredients, 2016-2032
- Figure 55: Western Europe Tortilla Market Revenue (US$ Mn) Market Share by By Processing Typein 2022
- Figure 56: Western Europe Tortilla Market Market Attractiveness Analysis by By Processing Type, 2016-2032
- Figure 57: Western Europe Tortilla Market Revenue (US$ Mn) Market Share by By Product Typein 2022
- Figure 58: Western Europe Tortilla Market Market Attractiveness Analysis by By Product Type, 2016-2032
- Figure 59: Western Europe Tortilla Market Revenue (US$ Mn) Market Share by By Distribution Channelin 2022
- Figure 60: Western Europe Tortilla Market Market Attractiveness Analysis by By Distribution Channel, 2016-2032
- Figure 61: Western Europe Tortilla Market Revenue (US$ Mn) Market Share by Country in 2022
- Figure 62: Western Europe Tortilla Market Market Attractiveness Analysis by Country, 2016-2032
- Figure 63: Western Europe Tortilla Market Market Revenue (US$ Mn) (2016-2032)
- Figure 64: Western Europe Tortilla Market Market Revenue (US$ Mn) Comparison by Country (2016-2032)
- Figure 65: Western Europe Tortilla Market Market Revenue (US$ Mn) Comparison by By Ingredients (2016-2032)
- Figure 66: Western Europe Tortilla Market Market Revenue (US$ Mn) Comparison by By Processing Type (2016-2032)
- Figure 67: Western Europe Tortilla Market Market Revenue (US$ Mn) Comparison by By Product Type (2016-2032)
- Figure 68: Western Europe Tortilla Market Market Revenue (US$ Mn) Comparison by By Distribution Channel (2016-2032)
- Figure 69: Western Europe Tortilla Market Market Y-o-Y Growth Rate Comparison by Country (2016-2032)
- Figure 70: Western Europe Tortilla Market Market Y-o-Y Growth Rate Comparison by By Ingredients (2016-2032)
- Figure 71: Western Europe Tortilla Market Market Y-o-Y Growth Rate Comparison by By Processing Type (2016-2032)
- Figure 72: Western Europe Tortilla Market Market Y-o-Y Growth Rate Comparison by By Product Type (2016-2032)
- Figure 73: Western Europe Tortilla Market Market Y-o-Y Growth Rate Comparison by By Distribution Channel (2016-2032)
- Figure 74: Western Europe Tortilla Market Market Share Comparison by Country (2016-2032)
- Figure 75: Western Europe Tortilla Market Market Share Comparison by By Ingredients (2016-2032)
- Figure 76: Western Europe Tortilla Market Market Share Comparison by By Processing Type (2016-2032)
- Figure 77: Western Europe Tortilla Market Market Share Comparison by By Product Type (2016-2032)
- Figure 78: Western Europe Tortilla Market Market Share Comparison by By Distribution Channel (2016-2032)
- Figure 79: Eastern Europe Tortilla Market Revenue (US$ Mn) Market Share by By Ingredientsin 2022
- Figure 80: Eastern Europe Tortilla Market Market Attractiveness Analysis by By Ingredients, 2016-2032
- Figure 81: Eastern Europe Tortilla Market Revenue (US$ Mn) Market Share by By Processing Typein 2022
- Figure 82: Eastern Europe Tortilla Market Market Attractiveness Analysis by By Processing Type, 2016-2032
- Figure 83: Eastern Europe Tortilla Market Revenue (US$ Mn) Market Share by By Product Typein 2022
- Figure 84: Eastern Europe Tortilla Market Market Attractiveness Analysis by By Product Type, 2016-2032
- Figure 85: Eastern Europe Tortilla Market Revenue (US$ Mn) Market Share by By Distribution Channelin 2022
- Figure 86: Eastern Europe Tortilla Market Market Attractiveness Analysis by By Distribution Channel, 2016-2032
- Figure 87: Eastern Europe Tortilla Market Revenue (US$ Mn) Market Share by Country in 2022
- Figure 88: Eastern Europe Tortilla Market Market Attractiveness Analysis by Country, 2016-2032
- Figure 89: Eastern Europe Tortilla Market Market Revenue (US$ Mn) (2016-2032)
- Figure 90: Eastern Europe Tortilla Market Market Revenue (US$ Mn) Comparison by Country (2016-2032)
- Figure 91: Eastern Europe Tortilla Market Market Revenue (US$ Mn) Comparison by By Ingredients (2016-2032)
- Figure 92: Eastern Europe Tortilla Market Market Revenue (US$ Mn) Comparison by By Processing Type (2016-2032)
- Figure 93: Eastern Europe Tortilla Market Market Revenue (US$ Mn) Comparison by By Product Type (2016-2032)
- Figure 94: Eastern Europe Tortilla Market Market Revenue (US$ Mn) Comparison by By Distribution Channel (2016-2032)
- Figure 95: Eastern Europe Tortilla Market Market Y-o-Y Growth Rate Comparison by Country (2016-2032)
- Figure 96: Eastern Europe Tortilla Market Market Y-o-Y Growth Rate Comparison by By Ingredients (2016-2032)
- Figure 97: Eastern Europe Tortilla Market Market Y-o-Y Growth Rate Comparison by By Processing Type (2016-2032)
- Figure 98: Eastern Europe Tortilla Market Market Y-o-Y Growth Rate Comparison by By Product Type (2016-2032)
- Figure 99: Eastern Europe Tortilla Market Market Y-o-Y Growth Rate Comparison by By Distribution Channel (2016-2032)
- Figure 100: Eastern Europe Tortilla Market Market Share Comparison by Country (2016-2032)
- Figure 101: Eastern Europe Tortilla Market Market Share Comparison by By Ingredients (2016-2032)
- Figure 102: Eastern Europe Tortilla Market Market Share Comparison by By Processing Type (2016-2032)
- Figure 103: Eastern Europe Tortilla Market Market Share Comparison by By Product Type (2016-2032)
- Figure 104: Eastern Europe Tortilla Market Market Share Comparison by By Distribution Channel (2016-2032)
- Figure 105: APAC Tortilla Market Revenue (US$ Mn) Market Share by By Ingredientsin 2022
- Figure 106: APAC Tortilla Market Market Attractiveness Analysis by By Ingredients, 2016-2032
- Figure 107: APAC Tortilla Market Revenue (US$ Mn) Market Share by By Processing Typein 2022
- Figure 108: APAC Tortilla Market Market Attractiveness Analysis by By Processing Type, 2016-2032
- Figure 109: APAC Tortilla Market Revenue (US$ Mn) Market Share by By Product Typein 2022
- Figure 110: APAC Tortilla Market Market Attractiveness Analysis by By Product Type, 2016-2032
- Figure 111: APAC Tortilla Market Revenue (US$ Mn) Market Share by By Distribution Channelin 2022
- Figure 112: APAC Tortilla Market Market Attractiveness Analysis by By Distribution Channel, 2016-2032
- Figure 113: APAC Tortilla Market Revenue (US$ Mn) Market Share by Country in 2022
- Figure 114: APAC Tortilla Market Market Attractiveness Analysis by Country, 2016-2032
- Figure 115: APAC Tortilla Market Market Revenue (US$ Mn) (2016-2032)
- Figure 116: APAC Tortilla Market Market Revenue (US$ Mn) Comparison by Country (2016-2032)
- Figure 117: APAC Tortilla Market Market Revenue (US$ Mn) Comparison by By Ingredients (2016-2032)
- Figure 118: APAC Tortilla Market Market Revenue (US$ Mn) Comparison by By Processing Type (2016-2032)
- Figure 119: APAC Tortilla Market Market Revenue (US$ Mn) Comparison by By Product Type (2016-2032)
- Figure 120: APAC Tortilla Market Market Revenue (US$ Mn) Comparison by By Distribution Channel (2016-2032)
- Figure 121: APAC Tortilla Market Market Y-o-Y Growth Rate Comparison by Country (2016-2032)
- Figure 122: APAC Tortilla Market Market Y-o-Y Growth Rate Comparison by By Ingredients (2016-2032)
- Figure 123: APAC Tortilla Market Market Y-o-Y Growth Rate Comparison by By Processing Type (2016-2032)
- Figure 124: APAC Tortilla Market Market Y-o-Y Growth Rate Comparison by By Product Type (2016-2032)
- Figure 125: APAC Tortilla Market Market Y-o-Y Growth Rate Comparison by By Distribution Channel (2016-2032)
- Figure 126: APAC Tortilla Market Market Share Comparison by Country (2016-2032)
- Figure 127: APAC Tortilla Market Market Share Comparison by By Ingredients (2016-2032)
- Figure 128: APAC Tortilla Market Market Share Comparison by By Processing Type (2016-2032)
- Figure 129: APAC Tortilla Market Market Share Comparison by By Product Type (2016-2032)
- Figure 130: APAC Tortilla Market Market Share Comparison by By Distribution Channel (2016-2032)
- Figure 131: Latin America Tortilla Market Revenue (US$ Mn) Market Share by By Ingredientsin 2022
- Figure 132: Latin America Tortilla Market Market Attractiveness Analysis by By Ingredients, 2016-2032
- Figure 133: Latin America Tortilla Market Revenue (US$ Mn) Market Share by By Processing Typein 2022
- Figure 134: Latin America Tortilla Market Market Attractiveness Analysis by By Processing Type, 2016-2032
- Figure 135: Latin America Tortilla Market Revenue (US$ Mn) Market Share by By Product Typein 2022
- Figure 136: Latin America Tortilla Market Market Attractiveness Analysis by By Product Type, 2016-2032
- Figure 137: Latin America Tortilla Market Revenue (US$ Mn) Market Share by By Distribution Channelin 2022
- Figure 138: Latin America Tortilla Market Market Attractiveness Analysis by By Distribution Channel, 2016-2032
- Figure 139: Latin America Tortilla Market Revenue (US$ Mn) Market Share by Country in 2022
- Figure 140: Latin America Tortilla Market Market Attractiveness Analysis by Country, 2016-2032
- Figure 141: Latin America Tortilla Market Market Revenue (US$ Mn) (2016-2032)
- Figure 142: Latin America Tortilla Market Market Revenue (US$ Mn) Comparison by Country (2016-2032)
- Figure 143: Latin America Tortilla Market Market Revenue (US$ Mn) Comparison by By Ingredients (2016-2032)
- Figure 144: Latin America Tortilla Market Market Revenue (US$ Mn) Comparison by By Processing Type (2016-2032)
- Figure 145: Latin America Tortilla Market Market Revenue (US$ Mn) Comparison by By Product Type (2016-2032)
- Figure 146: Latin America Tortilla Market Market Revenue (US$ Mn) Comparison by By Distribution Channel (2016-2032)
- Figure 147: Latin America Tortilla Market Market Y-o-Y Growth Rate Comparison by Country (2016-2032)
- Figure 148: Latin America Tortilla Market Market Y-o-Y Growth Rate Comparison by By Ingredients (2016-2032)
- Figure 149: Latin America Tortilla Market Market Y-o-Y Growth Rate Comparison by By Processing Type (2016-2032)
- Figure 150: Latin America Tortilla Market Market Y-o-Y Growth Rate Comparison by By Product Type (2016-2032)
- Figure 151: Latin America Tortilla Market Market Y-o-Y Growth Rate Comparison by By Distribution Channel (2016-2032)
- Figure 152: Latin America Tortilla Market Market Share Comparison by Country (2016-2032)
- Figure 153: Latin America Tortilla Market Market Share Comparison by By Ingredients (2016-2032)
- Figure 154: Latin America Tortilla Market Market Share Comparison by By Processing Type (2016-2032)
- Figure 155: Latin America Tortilla Market Market Share Comparison by By Product Type (2016-2032)
- Figure 156: Latin America Tortilla Market Market Share Comparison by By Distribution Channel (2016-2032)
- Figure 157: Middle East & Africa Tortilla Market Revenue (US$ Mn) Market Share by By Ingredientsin 2022
- Figure 158: Middle East & Africa Tortilla Market Market Attractiveness Analysis by By Ingredients, 2016-2032
- Figure 159: Middle East & Africa Tortilla Market Revenue (US$ Mn) Market Share by By Processing Typein 2022
- Figure 160: Middle East & Africa Tortilla Market Market Attractiveness Analysis by By Processing Type, 2016-2032
- Figure 161: Middle East & Africa Tortilla Market Revenue (US$ Mn) Market Share by By Product Typein 2022
- Figure 162: Middle East & Africa Tortilla Market Market Attractiveness Analysis by By Product Type, 2016-2032
- Figure 163: Middle East & Africa Tortilla Market Revenue (US$ Mn) Market Share by By Distribution Channelin 2022
- Figure 164: Middle East & Africa Tortilla Market Market Attractiveness Analysis by By Distribution Channel, 2016-2032
- Figure 165: Middle East & Africa Tortilla Market Revenue (US$ Mn) Market Share by Country in 2022
- Figure 166: Middle East & Africa Tortilla Market Market Attractiveness Analysis by Country, 2016-2032
- Figure 167: Middle East & Africa Tortilla Market Market Revenue (US$ Mn) (2016-2032)
- Figure 168: Middle East & Africa Tortilla Market Market Revenue (US$ Mn) Comparison by Country (2016-2032)
- Figure 169: Middle East & Africa Tortilla Market Market Revenue (US$ Mn) Comparison by By Ingredients (2016-2032)
- Figure 170: Middle East & Africa Tortilla Market Market Revenue (US$ Mn) Comparison by By Processing Type (2016-2032)
- Figure 171: Middle East & Africa Tortilla Market Market Revenue (US$ Mn) Comparison by By Product Type (2016-2032)
- Figure 172: Middle East & Africa Tortilla Market Market Revenue (US$ Mn) Comparison by By Distribution Channel (2016-2032)
- Figure 173: Middle East & Africa Tortilla Market Market Y-o-Y Growth Rate Comparison by Country (2016-2032)
- Figure 174: Middle East & Africa Tortilla Market Market Y-o-Y Growth Rate Comparison by By Ingredients (2016-2032)
- Figure 175: Middle East & Africa Tortilla Market Market Y-o-Y Growth Rate Comparison by By Processing Type (2016-2032)
- Figure 176: Middle East & Africa Tortilla Market Market Y-o-Y Growth Rate Comparison by By Product Type (2016-2032)
- Figure 177: Middle East & Africa Tortilla Market Market Y-o-Y Growth Rate Comparison by By Distribution Channel (2016-2032)
- Figure 178: Middle East & Africa Tortilla Market Market Share Comparison by Country (2016-2032)
- Figure 179: Middle East & Africa Tortilla Market Market Share Comparison by By Ingredients (2016-2032)
- Figure 180: Middle East & Africa Tortilla Market Market Share Comparison by By Processing Type (2016-2032)
- Figure 181: Middle East & Africa Tortilla Market Market Share Comparison by By Product Type (2016-2032)
- Figure 182: Middle East & Africa Tortilla Market Market Share Comparison by By Distribution Channel (2016-2032)
"
- List of Tables
- "
- Table 1: Global Tortilla Market Market Comparison by By Ingredients (2016-2032)
- Table 2: Global Tortilla Market Market Comparison by By Processing Type (2016-2032)
- Table 3: Global Tortilla Market Market Comparison by By Product Type (2016-2032)
- Table 4: Global Tortilla Market Market Comparison by By Distribution Channel (2016-2032)
- Table 5: Global Tortilla Market Revenue (US$ Mn) Comparison by Region (2016-2032)
- Table 6: Global Tortilla Market Market Revenue (US$ Mn) (2016-2032)
- Table 7: Global Tortilla Market Market Revenue (US$ Mn) Comparison by Region (2016-2032)
- Table 8: Global Tortilla Market Market Revenue (US$ Mn) Comparison by By Ingredients (2016-2032)
- Table 9: Global Tortilla Market Market Revenue (US$ Mn) Comparison by By Processing Type (2016-2032)
- Table 10: Global Tortilla Market Market Revenue (US$ Mn) Comparison by By Product Type (2016-2032)
- Table 11: Global Tortilla Market Market Revenue (US$ Mn) Comparison by By Distribution Channel (2016-2032)
- Table 12: Global Tortilla Market Market Y-o-Y Growth Rate Comparison by Region (2016-2032)
- Table 13: Global Tortilla Market Market Y-o-Y Growth Rate Comparison by By Ingredients (2016-2032)
- Table 14: Global Tortilla Market Market Y-o-Y Growth Rate Comparison by By Processing Type (2016-2032)
- Table 15: Global Tortilla Market Market Y-o-Y Growth Rate Comparison by By Product Type (2016-2032)
- Table 16: Global Tortilla Market Market Y-o-Y Growth Rate Comparison by By Distribution Channel (2016-2032)
- Table 17: Global Tortilla Market Market Share Comparison by Region (2016-2032)
- Table 18: Global Tortilla Market Market Share Comparison by By Ingredients (2016-2032)
- Table 19: Global Tortilla Market Market Share Comparison by By Processing Type (2016-2032)
- Table 20: Global Tortilla Market Market Share Comparison by By Product Type (2016-2032)
- Table 21: Global Tortilla Market Market Share Comparison by By Distribution Channel (2016-2032)
- Table 22: North America Tortilla Market Market Comparison by By Processing Type (2016-2032)
- Table 23: North America Tortilla Market Market Comparison by By Product Type (2016-2032)
- Table 24: North America Tortilla Market Market Comparison by By Distribution Channel (2016-2032)
- Table 25: North America Tortilla Market Revenue (US$ Mn) Comparison by Country (2016-2032)
- Table 26: North America Tortilla Market Market Revenue (US$ Mn) (2016-2032)
- Table 27: North America Tortilla Market Market Revenue (US$ Mn) Comparison by Country (2016-2032)
- Table 28: North America Tortilla Market Market Revenue (US$ Mn) Comparison by By Ingredients (2016-2032)
- Table 29: North America Tortilla Market Market Revenue (US$ Mn) Comparison by By Processing Type (2016-2032)
- Table 30: North America Tortilla Market Market Revenue (US$ Mn) Comparison by By Product Type (2016-2032)
- Table 31: North America Tortilla Market Market Revenue (US$ Mn) Comparison by By Distribution Channel (2016-2032)
- Table 32: North America Tortilla Market Market Y-o-Y Growth Rate Comparison by Country (2016-2032)
- Table 33: North America Tortilla Market Market Y-o-Y Growth Rate Comparison by By Ingredients (2016-2032)
- Table 34: North America Tortilla Market Market Y-o-Y Growth Rate Comparison by By Processing Type (2016-2032)
- Table 35: North America Tortilla Market Market Y-o-Y Growth Rate Comparison by By Product Type (2016-2032)
- Table 36: North America Tortilla Market Market Y-o-Y Growth Rate Comparison by By Distribution Channel (2016-2032)
- Table 37: North America Tortilla Market Market Share Comparison by Country (2016-2032)
- Table 38: North America Tortilla Market Market Share Comparison by By Ingredients (2016-2032)
- Table 39: North America Tortilla Market Market Share Comparison by By Processing Type (2016-2032)
- Table 40: North America Tortilla Market Market Share Comparison by By Product Type (2016-2032)
- Table 41: North America Tortilla Market Market Share Comparison by By Distribution Channel (2016-2032)
- Table 42: Western Europe Tortilla Market Market Comparison by By Ingredients (2016-2032)
- Table 43: Western Europe Tortilla Market Market Comparison by By Processing Type (2016-2032)
- Table 44: Western Europe Tortilla Market Market Comparison by By Product Type (2016-2032)
- Table 45: Western Europe Tortilla Market Market Comparison by By Distribution Channel (2016-2032)
- Table 46: Western Europe Tortilla Market Revenue (US$ Mn) Comparison by Country (2016-2032)
- Table 47: Western Europe Tortilla Market Market Revenue (US$ Mn) (2016-2032)
- Table 48: Western Europe Tortilla Market Market Revenue (US$ Mn) Comparison by Country (2016-2032)
- Table 49: Western Europe Tortilla Market Market Revenue (US$ Mn) Comparison by By Ingredients (2016-2032)
- Table 50: Western Europe Tortilla Market Market Revenue (US$ Mn) Comparison by By Processing Type (2016-2032)
- Table 51: Western Europe Tortilla Market Market Revenue (US$ Mn) Comparison by By Product Type (2016-2032)
- Table 52: Western Europe Tortilla Market Market Revenue (US$ Mn) Comparison by By Distribution Channel (2016-2032)
- Table 53: Western Europe Tortilla Market Market Y-o-Y Growth Rate Comparison by Country (2016-2032)
- Table 54: Western Europe Tortilla Market Market Y-o-Y Growth Rate Comparison by By Ingredients (2016-2032)
- Table 55: Western Europe Tortilla Market Market Y-o-Y Growth Rate Comparison by By Processing Type (2016-2032)
- Table 56: Western Europe Tortilla Market Market Y-o-Y Growth Rate Comparison by By Product Type (2016-2032)
- Table 57: Western Europe Tortilla Market Market Y-o-Y Growth Rate Comparison by By Distribution Channel (2016-2032)
- Table 58: Western Europe Tortilla Market Market Share Comparison by Country (2016-2032)
- Table 59: Western Europe Tortilla Market Market Share Comparison by By Ingredients (2016-2032)
- Table 60: Western Europe Tortilla Market Market Share Comparison by By Processing Type (2016-2032)
- Table 61: Western Europe Tortilla Market Market Share Comparison by By Product Type (2016-2032)
- Table 62: Western Europe Tortilla Market Market Share Comparison by By Distribution Channel (2016-2032)
- Table 63: Eastern Europe Tortilla Market Market Comparison by By Ingredients (2016-2032)
- Table 64: Eastern Europe Tortilla Market Market Comparison by By Processing Type (2016-2032)
- Table 65: Eastern Europe Tortilla Market Market Comparison by By Product Type (2016-2032)
- Table 66: Eastern Europe Tortilla Market Market Comparison by By Distribution Channel (2016-2032)
- Table 67: Eastern Europe Tortilla Market Revenue (US$ Mn) Comparison by Country (2016-2032)
- Table 68: Eastern Europe Tortilla Market Market Revenue (US$ Mn) (2016-2032)
- Table 69: Eastern Europe Tortilla Market Market Revenue (US$ Mn) Comparison by Country (2016-2032)
- Table 70: Eastern Europe Tortilla Market Market Revenue (US$ Mn) Comparison by By Ingredients (2016-2032)
- Table 71: Eastern Europe Tortilla Market Market Revenue (US$ Mn) Comparison by By Processing Type (2016-2032)
- Table 72: Eastern Europe Tortilla Market Market Revenue (US$ Mn) Comparison by By Product Type (2016-2032)
- Table 73: Eastern Europe Tortilla Market Market Revenue (US$ Mn) Comparison by By Distribution Channel (2016-2032)
- Table 74: Eastern Europe Tortilla Market Market Y-o-Y Growth Rate Comparison by Country (2016-2032)
- Table 75: Eastern Europe Tortilla Market Market Y-o-Y Growth Rate Comparison by By Ingredients (2016-2032)
- Table 76: Eastern Europe Tortilla Market Market Y-o-Y Growth Rate Comparison by By Processing Type (2016-2032)
- Table 77: Eastern Europe Tortilla Market Market Y-o-Y Growth Rate Comparison by By Product Type (2016-2032)
- Table 78: Eastern Europe Tortilla Market Market Y-o-Y Growth Rate Comparison by By Distribution Channel (2016-2032)
- Table 79: Eastern Europe Tortilla Market Market Share Comparison by Country (2016-2032)
- Table 80: Eastern Europe Tortilla Market Market Share Comparison by By Ingredients (2016-2032)
- Table 81: Eastern Europe Tortilla Market Market Share Comparison by By Processing Type (2016-2032)
- Table 82: Eastern Europe Tortilla Market Market Share Comparison by By Product Type (2016-2032)
- Table 83: Eastern Europe Tortilla Market Market Share Comparison by By Distribution Channel (2016-2032)
- Table 84: APAC Tortilla Market Market Comparison by By Ingredients (2016-2032)
- Table 85: APAC Tortilla Market Market Comparison by By Processing Type (2016-2032)
- Table 86: APAC Tortilla Market Market Comparison by By Product Type (2016-2032)
- Table 87: APAC Tortilla Market Market Comparison by By Distribution Channel (2016-2032)
- Table 88: APAC Tortilla Market Revenue (US$ Mn) Comparison by Country (2016-2032)
- Table 89: APAC Tortilla Market Market Revenue (US$ Mn) (2016-2032)
- Table 90: APAC Tortilla Market Market Revenue (US$ Mn) Comparison by Country (2016-2032)
- Table 91: APAC Tortilla Market Market Revenue (US$ Mn) Comparison by By Ingredients (2016-2032)
- Table 92: APAC Tortilla Market Market Revenue (US$ Mn) Comparison by By Processing Type (2016-2032)
- Table 93: APAC Tortilla Market Market Revenue (US$ Mn) Comparison by By Product Type (2016-2032)
- Table 94: APAC Tortilla Market Market Revenue (US$ Mn) Comparison by By Distribution Channel (2016-2032)
- Table 95: APAC Tortilla Market Market Y-o-Y Growth Rate Comparison by Country (2016-2032)
- Table 96: APAC Tortilla Market Market Y-o-Y Growth Rate Comparison by By Ingredients (2016-2032)
- Table 97: APAC Tortilla Market Market Y-o-Y Growth Rate Comparison by By Processing Type (2016-2032)
- Table 98: APAC Tortilla Market Market Y-o-Y Growth Rate Comparison by By Product Type (2016-2032)
- Table 99: APAC Tortilla Market Market Y-o-Y Growth Rate Comparison by By Distribution Channel (2016-2032)
- Table 100: APAC Tortilla Market Market Share Comparison by Country (2016-2032)
- Table 101: APAC Tortilla Market Market Share Comparison by By Ingredients (2016-2032)
- Table 102: APAC Tortilla Market Market Share Comparison by By Processing Type (2016-2032)
- Table 103: APAC Tortilla Market Market Share Comparison by By Product Type (2016-2032)
- Table 104: APAC Tortilla Market Market Share Comparison by By Distribution Channel (2016-2032)
- Table 105: Latin America Tortilla Market Market Comparison by By Ingredients (2016-2032)
- Table 106: Latin America Tortilla Market Market Comparison by By Processing Type (2016-2032)
- Table 107: Latin America Tortilla Market Market Comparison by By Product Type (2016-2032)
- Table 108: Latin America Tortilla Market Market Comparison by By Distribution Channel (2016-2032)
- Table 109: Latin America Tortilla Market Revenue (US$ Mn) Comparison by Country (2016-2032)
- Table 110: Latin America Tortilla Market Market Revenue (US$ Mn) (2016-2032)
- Table 111: Latin America Tortilla Market Market Revenue (US$ Mn) Comparison by Country (2016-2032)
- Table 112: Latin America Tortilla Market Market Revenue (US$ Mn) Comparison by By Ingredients (2016-2032)
- Table 113: Latin America Tortilla Market Market Revenue (US$ Mn) Comparison by By Processing Type (2016-2032)
- Table 114: Latin America Tortilla Market Market Revenue (US$ Mn) Comparison by By Product Type (2016-2032)
- Table 115: Latin America Tortilla Market Market Revenue (US$ Mn) Comparison by By Distribution Channel (2016-2032)
- Table 116: Latin America Tortilla Market Market Y-o-Y Growth Rate Comparison by Country (2016-2032)
- Table 117: Latin America Tortilla Market Market Y-o-Y Growth Rate Comparison by By Ingredients (2016-2032)
- Table 118: Latin America Tortilla Market Market Y-o-Y Growth Rate Comparison by By Processing Type (2016-2032)
- Table 119: Latin America Tortilla Market Market Y-o-Y Growth Rate Comparison by By Product Type (2016-2032)
- Table 120: Latin America Tortilla Market Market Y-o-Y Growth Rate Comparison by By Distribution Channel (2016-2032)
- Table 121: Latin America Tortilla Market Market Share Comparison by Country (2016-2032)
- Table 122: Latin America Tortilla Market Market Share Comparison by By Ingredients (2016-2032)
- Table 123: Latin America Tortilla Market Market Share Comparison by By Processing Type (2016-2032)
- Table 124: Latin America Tortilla Market Market Share Comparison by By Product Type (2016-2032)
- Table 125: Latin America Tortilla Market Market Share Comparison by By Distribution Channel (2016-2032)
- Table 126: Middle East & Africa Tortilla Market Market Comparison by By Ingredients (2016-2032)
- Table 127: Middle East & Africa Tortilla Market Market Comparison by By Processing Type (2016-2032)
- Table 128: Middle East & Africa Tortilla Market Market Comparison by By Product Type (2016-2032)
- Table 129: Middle East & Africa Tortilla Market Market Comparison by By Distribution Channel (2016-2032)
- Table 130: Middle East & Africa Tortilla Market Revenue (US$ Mn) Comparison by Country (2016-2032)
- Table 131: Middle East & Africa Tortilla Market Market Revenue (US$ Mn) (2016-2032)
- Table 132: Middle East & Africa Tortilla Market Market Revenue (US$ Mn) Comparison by Country (2016-2032)
- Table 133: Middle East & Africa Tortilla Market Market Revenue (US$ Mn) Comparison by By Ingredients (2016-2032)
- Table 134: Middle East & Africa Tortilla Market Market Revenue (US$ Mn) Comparison by By Processing Type (2016-2032)
- Table 135: Middle East & Africa Tortilla Market Market Revenue (US$ Mn) Comparison by By Product Type (2016-2032)
- Table 136: Middle East & Africa Tortilla Market Market Revenue (US$ Mn) Comparison by By Distribution Channel (2016-2032)
- Table 137: Middle East & Africa Tortilla Market Market Y-o-Y Growth Rate Comparison by Country (2016-2032)
- Table 138: Middle East & Africa Tortilla Market Market Y-o-Y Growth Rate Comparison by By Ingredients (2016-2032)
- Table 139: Middle East & Africa Tortilla Market Market Y-o-Y Growth Rate Comparison by By Processing Type (2016-2032)
- Table 140: Middle East & Africa Tortilla Market Market Y-o-Y Growth Rate Comparison by By Product Type (2016-2032)
- Table 141: Middle East & Africa Tortilla Market Market Y-o-Y Growth Rate Comparison by By Distribution Channel (2016-2032)
- Table 142: Middle East & Africa Tortilla Market Market Share Comparison by Country (2016-2032)
- Table 143: Middle East & Africa Tortilla Market Market Share Comparison by By Ingredients (2016-2032)
- Table 144: Middle East & Africa Tortilla Market Market Share Comparison by By Processing Type (2016-2032)
- Table 145: Middle East & Africa Tortilla Market Market Share Comparison by By Product Type (2016-2032)
- Table 146: Middle East & Africa Tortilla Market Market Share Comparison by By Distribution Channel (2016-2032)
- 1. Executive Summary
-
- La Tortilla Factory
- PepsiCo Inc.
- Siete Family Foods
- Reser’s Fine Foods
- Aranda’s Tortilla Company Inc.
- Grupo Bimbo SAB de CV
- Easy Foods Inc.
- Catallia Mexican Foods
- Tyson Foods Inc.
Our Clients


View Our Licence Options
