
Supply Chain Management Software Market By Type (Small & Medium-Sized Enterprises, Large Enterprises), By Component (Solution, Hardware, Software, Services), Deployment Mode (On-premises, Cloud), End Use Analysis (Healthcare, FMCG, Retail and E-commerce, Manufacturing, Automotive, Transportation and Logistics, Others (Construction, Oil and Gas, Aerospace and Defense, and Agriculture), By Region and Companies - Industry Segment Outlook, Market Assessment, Competition Scenario, Trends and Forecast 2024-2033
-
26690
-
Aug 2024
-
160
-


-
This report was compiled by Vishwa Gaul Vishwa is an experienced market research and consulting professional with over 8 years of expertise in the ICT industry, contributing to over 700 reports across telecommunications, software, hardware, and digital solutions. Correspondence Team Lead- ICT Linkedin | Detailed Market research Methodology Our methodology involves a mix of primary research, including interviews with leading mental health experts, and secondary research from reputable medical journals and databases. View Detailed Methodology Page
-
Quick Navigation
Report Overview
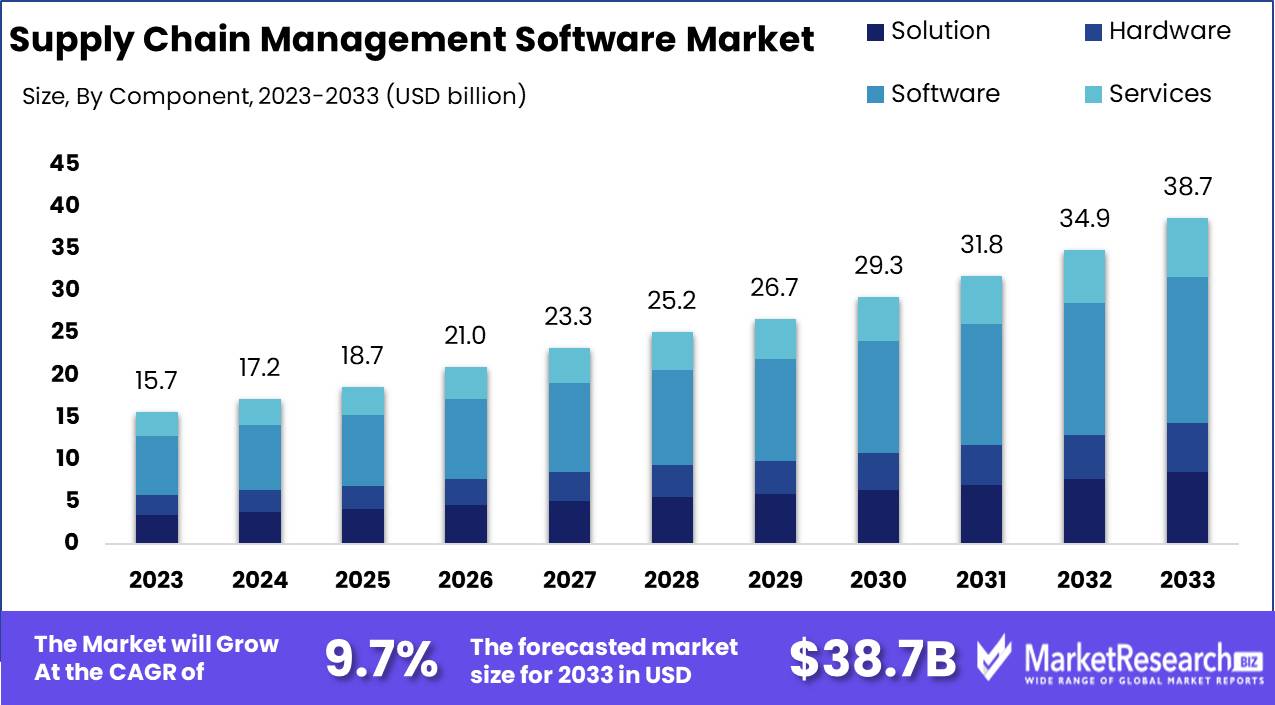
The Global Supply Chain Management Software Market was valued at USD 15.7 Bn in 2023. It is expected to reach USD 38.7 Bn by 2033, with a CAGR of 9.7% during the forecast period from 2024 to 2033.
The supply chain management (SCM) software market encompasses digital solutions designed to optimize and manage end-to-end supply chain activities, including procurement, production, distribution, and logistics. Driven by the need for greater efficiency, real-time data insights, and risk management, this market is witnessing robust growth. Key trends include the integration of cloud technology, artificial intelligence, and machine learning to enhance visibility and predictive capabilities. As global supply chains become increasingly complex, the demand for sophisticated SCM software solutions is expected to rise, providing significant opportunities for innovation and strategic investment.
 The supply chain management (SCM) software market is experiencing dynamic growth, propelled by technological advancements and the increasing complexity of global supply chains. In 2023, a Flexera survey indicated that 94% of enterprises are utilizing cloud services, with 83% deeming cloud technology essential to their supply chain strategy. This underscores the pivotal role of cloud-based solutions in enhancing supply chain visibility, agility, and efficiency. Moreover, 60% of supply chain executives highlight risk management as a critical component of their strategy, emphasizing the need for robust SCM software to mitigate disruptions and ensure continuity.
The adoption of cloud technology in SCM software is transforming the industry by enabling real-time data sharing, improved collaboration, and scalable solutions that can adapt to fluctuating market demands. Furthermore, the integration of artificial intelligence (AI) and machine learning development is enhancing predictive analytics capabilities, allowing businesses to anticipate and respond to potential disruptions proactively. These technological advancements are critical in addressing challenges such as supply chain disruptions, demand variability, and resource optimization.
As supply chains become more interconnected and susceptible to various risks, the demand for comprehensive SCM software solutions is expected to surge. Companies that invest in innovative technologies and prioritize risk management within their supply chain strategies will be better positioned to navigate the complexities of the modern supply chain landscape. To maintain a competitive edge, it is imperative for businesses to continuously evolve their SCM practices, leveraging advanced software solutions to drive efficiency, resilience, and sustainability in their operations.
Key Takeaways
- Market Value: The Global Supply Chain Management Software Market was valued at USD 15.7 Bn in 2023. It is expected to reach USD 38.7 Bn by 2033, with a CAGR of 9.7% during the forecast period from 2024 to 2033.
- By Type: Large Enterprises make up 60% of the market, leveraging advanced software for complex supply chain operations.
- By Component: Software accounts for 45%, essential for managing and optimizing supply chain processes.
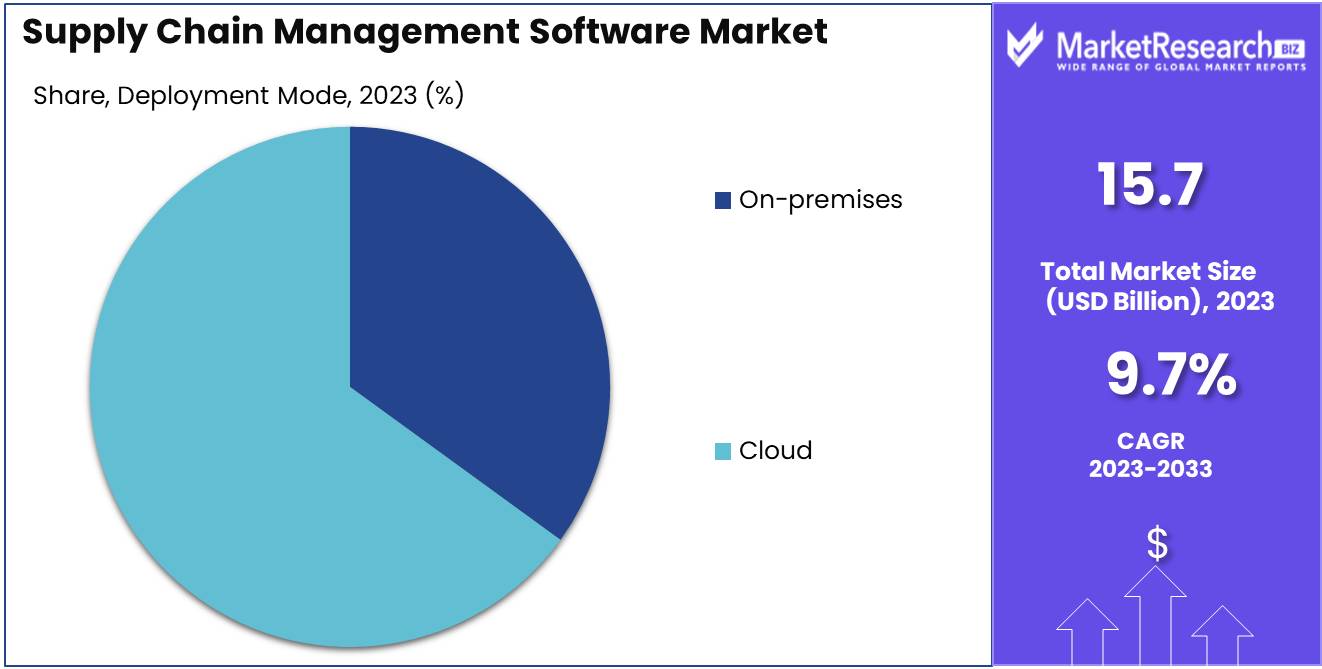
- By Deployment Mode: Cloud solutions lead with 65%, offering scalability and real-time data access.
- By End Use Analysis: Transportation and Logistics utilize 25%, enhancing operational efficiency and tracking.
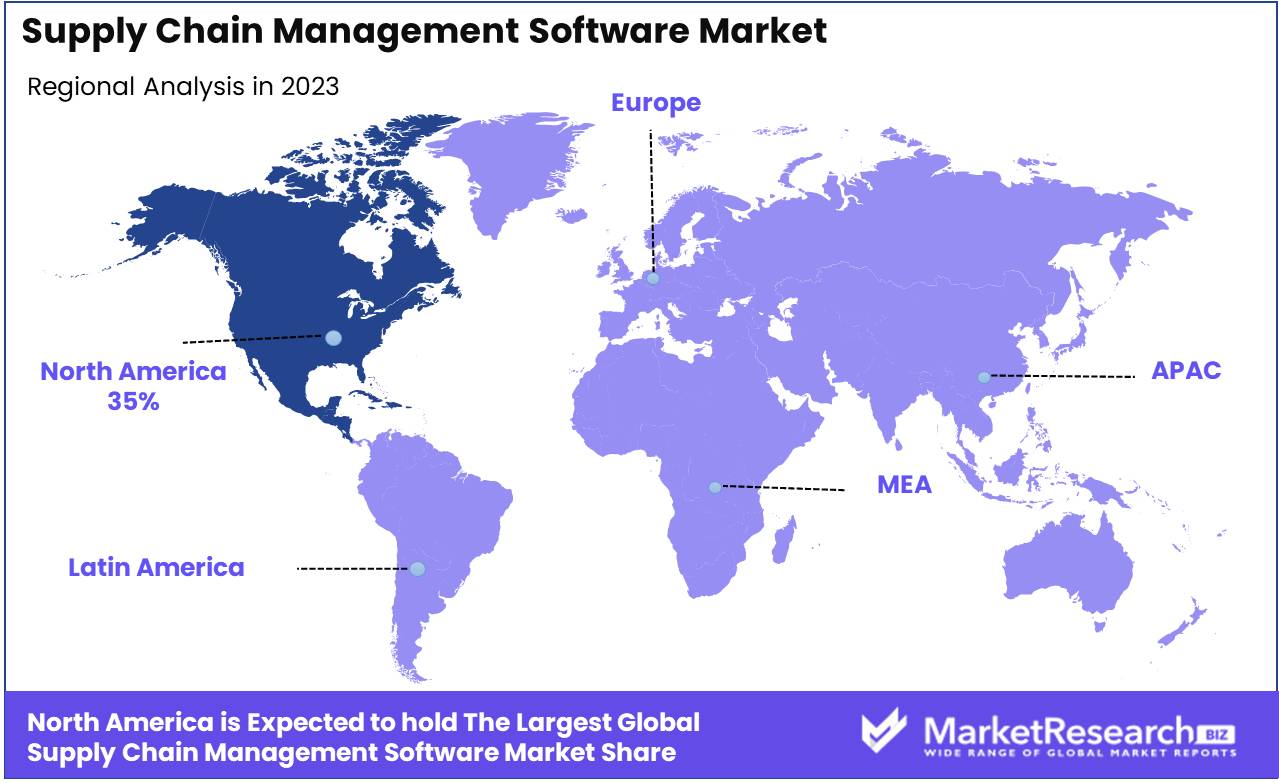
- Regional Dominance: North America holds a 35% market share, driven by technological innovation and robust logistics infrastructure.
- Growth Opportunity: Integrating AI and machine learning into supply chain management software can significantly improve predictive analytics and decision-making.
Driving factors
Increasing Complexity of Global Supply Chains
The growth of the Supply Chain Management (SCM) Software Market is significantly driven by the increasing complexity of global supply chains. Modern supply chains span multiple geographies and involve numerous stakeholders, making them more intricate and challenging to manage. As companies expand their operations globally, they face heightened risks related to delays, compliance, and disruptions.
The need for sophisticated tools to manage these complexities has led to a surge in demand for SCM software. These solutions help businesses streamline operations, ensure compliance with various regulations, and mitigate risks associated with global supply chain management. As a result, the adoption of SCM software is becoming imperative for organizations aiming to maintain efficiency and competitiveness in a global market.
Growing Demand for Real-Time Visibility and Analytics
The growing demand for real-time visibility and analytics is another crucial driver of the SCM software market. In today's fast-paced business environment, companies require real-time insights into their supply chain operations to make informed decisions and respond swiftly to changes. SCM software equipped with advanced analytics capabilities provides end-to-end visibility, enabling businesses to monitor inventory levels, track shipments, and predict potential disruptions.
Companies that adopt real-time supply chain visibility tools can reduce inventory levels by up to 20% and improve order fulfillment rates by up to 10%. The ability to leverage data for proactive decision-making enhances operational efficiency, reduces costs, and improves customer satisfaction, thereby driving the market's growth.
Advancements in AI and Machine Learning
Advancements in Artificial Intelligence (AI) and machine learning are transforming the SCM software market, offering new opportunities for innovation and efficiency. AI-driven SCM solutions can analyze vast amounts of data to identify patterns, predict demand, and optimize supply chain processes. Machine learning algorithms improve over time, providing increasingly accurate forecasts and recommendations.
Restraining Factors
High Implementation and Integration Costs
One of the significant restraining factors for the Supply Chain Management (SCM) Software Market is the high implementation and integration costs. Deploying SCM software involves substantial financial investment, including the costs of the software itself, hardware, and the necessary IT infrastructure. Businesses must invest in training staff to effectively use the new systems, which can be both time-consuming and expensive. Integration with existing systems is another costly and complex process, as it often requires customization and extensive technical support.
The total cost of ownership for SCM software can be a major barrier for small and medium-sized enterprises (SMEs), limiting their ability to adopt these advanced solutions. This financial hurdle can slow down market penetration and restrict growth, particularly among smaller organizations that could benefit most from improved supply chain efficiencies.
Data Security and Privacy Concerns
Data security and privacy concerns present another critical challenge to the growth of the SCM software market. Supply chain management involves handling vast amounts of sensitive data, including proprietary business information, customer data, and supplier details. The increasing prevalence of cyber threats and data breaches has heightened the need for robust security measures to protect this information.
Companies are often wary of adopting new technologies due to fears of data vulnerabilities and potential compliance issues with data protection regulations such as GDPR (General Data Protection Regulation) and CCPA (California Consumer Privacy Act). A survey by IBM indicates that the average cost of a data breach in 2023 was $4.35 million, underscoring the significant financial impact of security incidents. Ensuring the security and privacy of data within SCM software systems is essential to gaining the trust of businesses and promoting wider adoption.
By Type Analysis
Large Enterprises held a dominant market position in the By Type segment of the Supply Chain Management Software Market, capturing more than a 60% share.
In 2023, Large Enterprises held a dominant market position in the By Type segment of the Supply Chain Management Software Market, capturing more than a 60% share. The substantial market share of large enterprises is attributed to their extensive and complex supply chains, which require sophisticated software solutions to manage efficiently.
Small & Medium-Sized Enterprises (SMEs) also represent a growing market for supply chain management software. SMEs increasingly recognize the benefits of such software in improving operational efficiency, reducing costs, and gaining competitive advantage.
By Component Analysis
Software held a dominant market position in the By Component segment of the Supply Chain Management Software Market, capturing more than a 45% share.
In 2023, Software held a dominant market position in the By Component segment of the Supply Chain Management Software Market, capturing more than a 45% share. The demand for software solutions is driven by the need for automation, real-time data analytics, and advanced planning and execution capabilities. Supply chain management software includes various applications such as inventory management, order processing, demand forecasting, and logistics management, which are essential for streamlining supply chain operations.
Solutions encompass the comprehensive platforms that integrate these various applications into a unified system. This segment is crucial as businesses seek end-to-end solutions that provide complete visibility and control over their supply chains.
Hardware components, including servers, storage devices, and network equipment, are necessary for supporting the infrastructure of supply chain management systems. While essential, this segment holds a smaller share compared to software due to the one-time nature of hardware investments versus the ongoing demand for software updates and licenses.
Services include consulting, implementation, and support services that help businesses deploy and maintain their supply chain management software. This segment is critical for ensuring the successful adoption and utilization of the software, though it captures a smaller market share than software itself.
By Deployment Mode Analysis
Cloud held a dominant market position in the By Deployment Mode segment of the Supply Chain Management Software Market, capturing more than a 65% share.
In 2023, Cloud held a dominant market position in the By Deployment Mode segment of the Supply Chain Management Software Market, capturing more than a 65% share. The shift towards cloud-based solutions is driven by their scalability, flexibility, and cost-effectiveness. Cloud deployment allows businesses to access their supply chain management software from anywhere, facilitating remote work and collaboration.
On-premises deployment, while still significant, is declining in preference as businesses move towards more agile and adaptable cloud solutions. On-premises systems offer greater control over data and customization options, but they require significant upfront investment in hardware and ongoing maintenance costs.
By End Use Analysis Analysis
Transportation and Logistics held a dominant market position in the By End Use Analysis segment of the Supply Chain Management Software Market, capturing more than a 25% share.
In 2023, Transportation and Logistics held a dominant market position in the By End Use Analysis segment of the Supply Chain Management Software Market, capturing more than a 25% share. The transportation and logistics sector heavily relies on advanced supply chain management software to optimize routing, manage fleets, and ensure timely delivery of goods. The increasing complexity of global supply chains and the need for real-time tracking and visibility are key drivers for this segment.
Healthcare also represents a significant market, with supply chain management software being essential for managing the procurement, storage, and distribution of medical supplies and pharmaceuticals. The need for compliance with regulatory standards and the critical nature of healthcare supply chains drive demand in this segment.
FMCG (Fast-Moving Consumer Goods) companies use supply chain management software to manage high-volume, low-margin products efficiently. The need for rapid replenishment, demand forecasting, and inventory management is crucial in this industry.
Retail and E-commerce businesses rely on supply chain management software to manage their inventory, streamline order processing, and ensure customer satisfaction through timely deliveries. The rise of online shopping has further increased the demand for sophisticated supply chain solutions.
Manufacturing companies use supply chain management software to coordinate production schedules, manage suppliers, and optimize the flow of materials. The integration of supply chain management with manufacturing execution systems is essential for operational efficiency.
Automotive companies require advanced supply chain solutions to manage complex supply networks, track components, and ensure just-in-time delivery. The emphasis on reducing costs and improving efficiency in the automotive industry drives demand in this segment.
Other sectors, including Construction, Oil and Gas accumulators, Aerospace and Defense, and Agriculture, also utilize supply chain management software to address their unique logistical challenges and improve overall operational efficiency.
Key Market Segments
By Type
- Small & Medium-Sized Enterprises
- Large Enterprises
By Component
- Solution
- Hardware
- Software
- Services
Deployment Mode
- On-premises
- Cloud
End Use Analysis
- Healthcare
- FMCG
- Retail and E-commerce
- Manufacturing
- Automotive
- Transportation and Logistics
- Others (Construction, Oil and Gas, Aerospace and Defense, and Agriculture)
Growth Opportunity
Development of Cloud-Based and SaaS Solutions
The global Supply Chain Management (SCM) Software Market in 2024 is set to capitalize on significant growth opportunities, particularly through the development of cloud-based and Software as a Service (SaaS) solutions. Cloud-based SCM software offers several advantages, including lower upfront costs, scalability, and ease of integration. These solutions reduce the financial and technical barriers associated with traditional on-premise systems, making advanced supply chain tools more accessible to small and medium-sized enterprises (SMEs).
Cloud-based SCM software is expected to account for 60% of all SCM software deployments by 2024. This shift towards cloud solutions enables businesses to leverage cutting-edge technology without the need for significant capital investment, fostering wider adoption and driving market growth.
Expansion in Emerging Markets
Expansion in emerging markets represents another crucial opportunity for the SCM software market in 2024. Countries in Asia-Pacific, Latin America, and Africa are experiencing rapid economic growth and industrialization, leading to increased complexity in their supply chains. As these regions continue to develop, the demand for efficient supply chain management solutions is rising. The adoption of SCM software in emerging markets is driven by the need to enhance operational efficiency, reduce costs, and improve competitiveness.
A report by the World Bank highlights that digital adoption in emerging markets is growing at an unprecedented rate, creating fertile ground for SCM software providers to expand their footprint. By tapping into these burgeoning markets, companies can unlock new revenue streams and diversify their customer base.
Latest Trends
Integration with IoT for Real-Time Tracking
In 2024, the global Supply Chain Management (SCM) Software Market is poised to benefit significantly from the integration of Internet of Things (IoT) technology for real-time tracking. IoT devices, such as sensors and RFID tags, enable continuous monitoring of goods as they move through the supply chain. This real-time visibility allows businesses to track inventory levels, monitor transportation conditions, and ensure timely deliveries.
The integration of IoT with SCM software enhances operational efficiency, reduces losses due to theft or spoilage, and improves overall supply chain agility. Businesses that adopt IoT-enabled SCM solutions can gain a competitive edge by leveraging accurate, real-time data to optimize their supply chain processes.
Use of Blockchain for Enhanced Transparency and Security
The use of blockchain technology is emerging as a pivotal trend in the SCM software market for 2024, providing enhanced transparency and security. Blockchain's decentralized ledger system ensures that every transaction is recorded immutably, creating a transparent and tamper-proof record of the supply chain.
This technology addresses key issues such as fraud, counterfeiting, and compliance by providing end-to-end traceability. By integrating blockchain with SCM software, companies can enhance trust among stakeholders, streamline processes, and meet regulatory requirements more effectively.
Regional Analysis
North America led the Supply Chain Management Software Market in 2023, capturing a 35% share.
In 2023, North America led the Supply Chain Management Software Market, capturing a 35% share. The dominance is driven by the region's advanced technological infrastructure and the presence of major supply chain software providers. The U.S. is at the forefront, with businesses increasingly adopting advanced supply chain solutions to enhance efficiency, visibility, and resilience. The shift towards digital transformation and the integration of AI and IoT in supply chain management are significant drivers in this region.
Europe is a significant market, with strong adoption of supply chain management software in countries like Germany, the UK, and France. The focus on improving operational efficiency, reducing costs, and enhancing supply chain transparency drives the demand for advanced software solutions.
The Asia Pacific region is experiencing rapid growth in the supply chain management software market due to the expanding manufacturing sector and increasing trade activities. Countries like China, Japan, and India are investing in advanced supply chain technologies to streamline operations and improve competitiveness in global markets.
In the Middle East & Africa, the market is emerging, with growing interest in supply chain optimization and automation. The UAE and Saudi Arabia are notable markets, driven by economic diversification efforts and investments in advanced technologies.
Latin America is witnessing steady growth, with Brazil and Mexico being key markets. The increasing adoption of supply chain management software by businesses to improve operational efficiency and reduce logistics costs supports the market's development in the region.
Key Regions and Countries
North America
- US
- Canada
- Mexico
Western Europe
- Germany
- France
- The UK
- Spain
- Italy
- Portugal
- Ireland
- Austria
- Switzerland
- Benelux
- Nordic
- Rest of Western Europe
Eastern Europe
- Russia
- Poland
- The Czech Republic
- Greece
- Rest of Eastern Europe
APAC
- China
- Japan
- South Korea
- India
- Australia & New Zealand
- Indonesia
- Malaysia
- Philippines
- Singapore
- Thailand
- Vietnam
- Rest of APAC
Latin America
- Brazil
- Colombia
- Chile
- Argentina
- Costa Rica
- Rest of Latin America
Middle East & Africa
- Algeria
- Egypt
- Israel
- Kuwait
- Nigeria
- Saudi Arabia
- South Africa
- Turkey
- United Arab Emirates
- Rest of MEA
Key Players Analysis
In 2024, the supply chain management (SCM) software market is characterized by rapid technological advancements and a heightened focus on resilience and efficiency. SAP SE and Oracle Corporation remain dominant players, offering comprehensive SCM solutions that integrate advanced analytics, artificial intelligence (AI), and cloud capabilities. Their robust platforms enable businesses to optimize their supply chains, reduce costs, and enhance visibility.
IBM Corporation and Infor are pivotal in driving innovation within the market, leveraging AI and machine learning to offer predictive analytics and automation solutions. These technologies significantly enhance supply chain agility and decision-making processes. JDA Software Group Inc. and Kinaxis are recognized for their demand planning and real-time supply chain visibility solutions, which are critical for managing complex global supply networks.
Aspen Technology Inc. and Comarch provide specialized SCM solutions tailored to specific industries such as manufacturing and retail. Their focus on industry-specific challenges and solutions helps them maintain a competitive edge. QAD Inc. and Plex Manufacturing Cloud offer cloud-based SCM platforms that facilitate seamless integration and scalability, catering to the evolving needs of modern supply chains.
Sage and Vanguard Software are notable for their user-friendly and flexible SCM solutions, appealing to small and medium-sized enterprises (SMEs) seeking cost-effective and efficient supply chain management tools. The SCM software market in 2024 is driven by the need for enhanced supply chain resilience, real-time visibility, and advanced analytics. Key players continue to innovate, integrating cutting-edge technologies to address the dynamic challenges of global supply chain management.
Market Key Players
- Comarch
- Aspen Technology Inc.
- IBM Corporation
- JDA Software Group Inc.
- Infor
- Oracle Corporation
- Kinaxis
- QAD Inc.
- Plex Manufacturing Cloud
- SAP SE
- Sage
- Vanguard Software.
Recent Development
- In June 2024, SAP SE invested $50 million in developing advanced supply chain analytics tools. This investment aims to provide businesses with deeper insights and better predictive capabilities.
- In April 2024, Oracle Corporation launched an upgraded version of their cloud-based supply chain management platform. This upgrade is expected to enhance real-time visibility and decision-making capabilities.
Report Scope
Report Features Description Market Value (2023) USD 15.7 Bn Forecast Revenue (2033) USD 38.7 Bn CAGR (2024-2033) 9.7% Base Year for Estimation 2023 Historic Period 2018-2023 Forecast Period 2024-2033 Report Coverage Revenue Forecast, Market Dynamics, Competitive Landscape, Recent Developments Segments Covered By Type (Small & Medium-Sized Enterprises, Large Enterprises), By Component (Solution, Hardware, Software, Services), Deployment Mode (On-premises, Cloud), End Use Analysis (Healthcare, FMCG, Retail and E-commerce, Manufacturing, Automotive, Transportation and Logistics, Others (Construction, Oil and Gas, Aerospace and Defense, and Agriculture) Regional Analysis North America - The US, Canada, & Mexico; Western Europe - Germany, France, The UK, Spain, Italy, Portugal, Ireland, Austria, Switzerland, Benelux, Nordic, & Rest of Western Europe; Eastern Europe - Russia, Poland, The Czech Republic, Greece, & Rest of Eastern Europe; APAC - China, Japan, South Korea, India, Australia & New Zealand, Indonesia, Malaysia, Philippines, Singapore, Thailand, Vietnam, & Rest of APAC; Latin America - Brazil, Colombia, Chile, Argentina, Costa Rica, & Rest of Latin America; Middle East & Africa - Algeria, Egypt, Israel, Kuwait, Nigeria, Saudi Arabia, South Africa, Turkey, United Arab Emirates, & Rest of MEA Competitive Landscape Comarch, Aspen Technology Inc., IBM Corporation, JDA Software Group Inc., Infor, Oracle Corporation, Kinaxis, QAD Inc., Plex Manufacturing Cloud, SAP SE, Sage, Vanguard Software. Customization Scope Customization for segments, region/country-level will be provided. Moreover, additional customization can be done based on the requirements. Purchase Options We have three licenses to opt for: Single User License, Multi-User License (Up to 5 Users), Corporate Use License (Unlimited User and Printable PDF) </div
-
-
- Comarch
- Aspen Technology Inc.
- IBM Corporation
- JDA Software Group Inc.
- Infor
- Oracle Corporation
- Kinaxis
- QAD Inc.
- Plex Manufacturing Cloud
- SAP SE
- Sage
- Vanguard Software.
Our Clients


View Our Licence Options
