
Solar Cable Market By Material(Copper, Aluminium Alloy), By Cable Type(Stranded, Solid), By Application(Residential, Commercial, Industrial), By End User(Solar Panels Wiring, Underground ssrvice Entrances, Service Terminal Connections), By Region And Companies - Industry Segment Outlook, Market Assessment, Competition Scenario, Trends, And Forecast 2024-2033
-
23542
-
Feb 2024
-
177
-


-
This report was compiled by Shreyas Rokade Shreyas Rokade is a seasoned Research Analyst with CMFE, bringing extensive expertise in market research and consulting, with a strong background in Chemical Engineering. Correspondence Team Lead-CMFE Linkedin | Detailed Market research Methodology Our methodology involves a mix of primary research, including interviews with leading mental health experts, and secondary research from reputable medical journals and databases. View Detailed Methodology Page
-
Quick Navigation
- Report Overview
- Key Takeaways
- Driving factors
- Restraining Factors
- By Material Analysis
- By Cable Type Analysis
- By Application Analysis
- By End User Analysis
- Key Market Segments
- Growth Opportunity
- Latest Trends
- Shift Towards Halogen-Free Solar Cables
- Integration of Smart Technology in Solar Cabling
- Regional Analysis
- Key Players Analysis
- Recent Development
- Report Scope
Report Overview
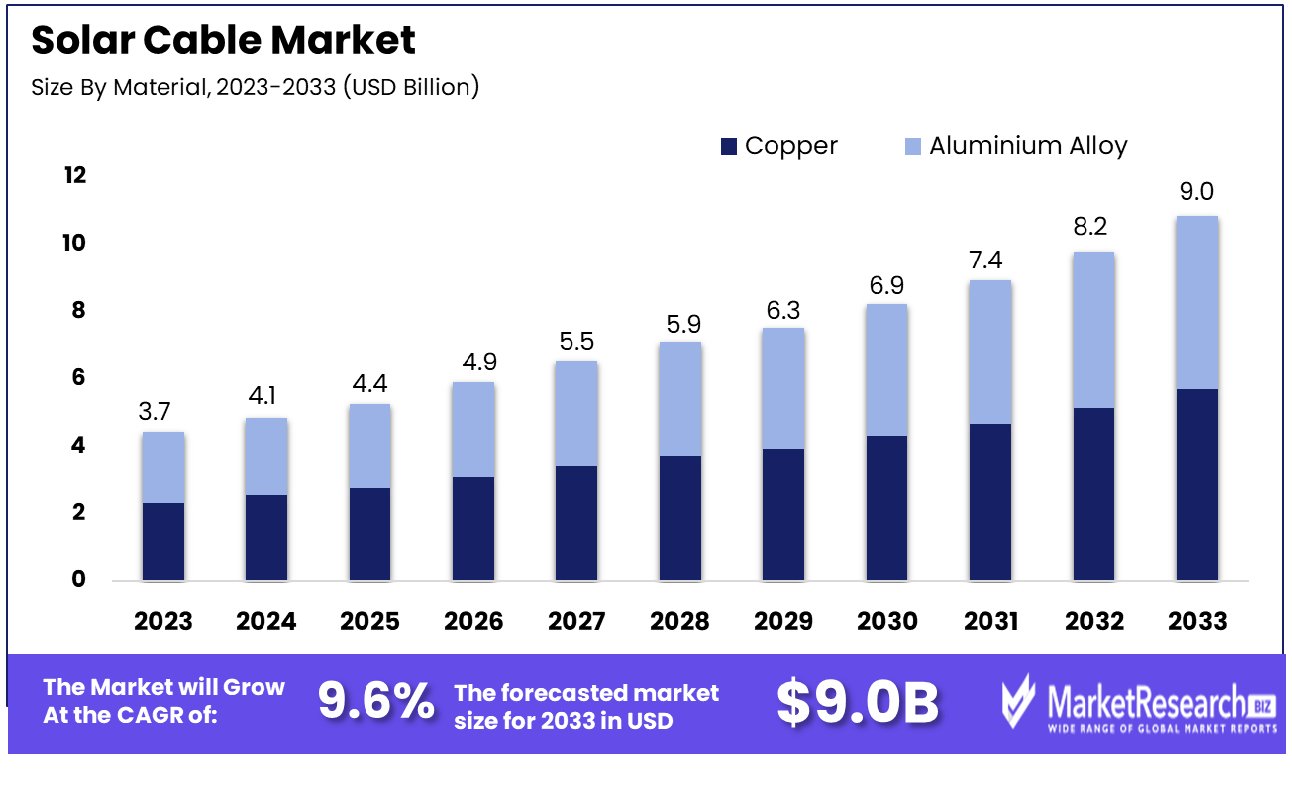
The global Solar Cable Market was valued at USD 3.7 billion in 2023, It is expected to reach USD 9.0 billion by 2033, with a CAGR of 9.6% during the forecast period from 2024 to 2033.
The Solar Cable Market encompasses a specialized segment of the electrical cable industry, dedicated to producing and distributing cables designed for the optimal operation of solar photovoltaic (PV) systems. These cables are engineered to withstand environmental stressors, including UV radiation, extreme temperatures, and moisture, ensuring reliable electrical connectivity in solar installations.
The market's significance is amplified by the global shift towards renewable energy sources, making it pivotal for stakeholders and Product Managers—in the renewable energy sector to comprehend its dynamics. The market's growth rate is attributed to increasing solar power installations worldwide, driven by the demand for sustainable and clean energy solutions.
The Solar Cable Market is currently experiencing a significant trajectory of growth, underpinned by the escalating global emphasis on renewable energy sources and the imperative to diminish carbon footprints. This upsurge is further bolstered by substantial investments and technological advancements within the sector.
For instance, Greenalia's recent endeavor to expand its solar projects in Texas, facilitated by a $200 million credit deal, exemplifies the robust confidence in solar energy's potential. This venture, alongside Toyota Boshoku America's investment in the Texas Solar Nova 1 project, underscores a persistent investor interest in solar energy, notwithstanding the prevailing political headwinds.
Moreover, the European market is witnessing a renaissance in solar innovation, spearheaded by entities such as NexWafe. The continent's solar installations approached a remarkable milestone of nearly 60GW in 2023, indicating a vibrant and expanding market ecosystem. The focus on cutting-edge Heterojunction Technology (HJT) and Tunnel Oxide Passivated Contacts (TOPcon) cell technologies, promising efficiencies of up to 26%, delineates a significant leap forward in enhancing solar energy's viability and cost-effectiveness.
These developments are indicative of a broader, global shift towards more sustainable energy solutions, positioning the solar cable market for unprecedented growth and innovation. As such, the solar cable market is poised for a sustained period of expansion, driven by technological advancements, strategic investments, and a collective shift towards greener, more sustainable energy alternatives.
Key Takeaways
- Market Growth: The Solar Cable Market was valued at USD 3.7 billion in 2023, It is expected to reach USD 9.0 billion by 2033, with a CAGR of 9.6% during the forecast period from 2024 to 2033.
- By Material: In the Solar Cable Market, Copper emerged as the leading material, showcasing widespread adoption.
- By Cable Type: Stranded cables were predominantly favored by the industry, indicating a preference for flexibility and durability.
- By Application: The Residential sector surfaced as the primary application area, driving demand for solar cables.
- By End User: Solar panel wiring stood out as the dominant end-user segment, reflecting its critical importance.
- Regional Dominance: Asia-Pacific dominates the solar cable industry with a market share of 30.8%.
- Growth Opportunity: Emerging markets offer growth opportunities for the solar cable industry, driven by renewable energy adoption and innovations enhancing cable efficiency and durability for expanded global presence and technological leadership.
Driving factors
Rising Global Demand for Renewable Energy
The global emphasis on transitioning to renewable energy sources has significantly fueled the growth of the solar cable market. This shift is propelled by heightened awareness of environmental issues and a concerted effort to reduce carbon footprints worldwide. Governments across various nations are implementing policies and providing incentives to support solar energy projects, thereby driving demand for solar cables, which are essential for the efficient transmission of electricity generated from solar panels.
Technological Advancements in Solar Cable Manufacturing
Technology advancement in solar cable manufacturing has played an essential role in expanding its market. Innovations in materials and manufacturing processes have resulted in solar cables that are more efficient, durable, and resistant to environmental factors. These improvements enhance the performance and reliability of solar power systems, making solar energy a more attractive option for both residential and commercial applications. Consequently, the demand for high-quality solar cables is expected to continue rising as solar energy projects proliferate globally.
Expansion of Solar Energy Infrastructure
Solar energy infrastructure's expansion around the globe has fueled rapid expansion in solar cable market growth. As countries invest in solar power plants and the deployment of solar panels in urban and remote locations increases, the need for solar cables, which are integral to connecting solar panels to the power grid, escalates. This expansion is not only limited to new installations but also encompasses the upgrading of existing solar power systems to accommodate higher capacities, further stimulating the demand for solar cables.
Restraining Factors
High Initial Installation Costs
The significant initial costs associated with the installation of solar energy systems, including the procurement of high-quality solar cables, can act as a major deterrent for potential adopters. The expenditure encompasses not only the cables themselves but also the cost of compatible components and professional installation services. This financial barrier can be particularly prohibitive for residential users and small-scale enterprises, thereby limiting the expansion of the solar cable market. The need for specialized, durable cables that can withstand environmental factors and ensure efficient energy transmission further escalates the initial outlay, impacting the market's accessibility and growth.
Regulatory and Standardization Challenges
Navigating the complex landscape of regulations and standards can pose significant challenges for manufacturers and installers of solar cables. The solar industry is subject to stringent quality and safety standards that vary widely across different regions and jurisdictions. Compliance with these evolving standards requires continuous research and development efforts, as well as regular updates to product designs and manufacturing processes. This not only increases the cost of production but also slows down the time to market for new and innovative solar cable solutions. Moreover, inconsistency in regulatory frameworks can create uncertainties, hindering the global trade of solar cables and affecting market growth negatively.
By Material Analysis
Copper emerged as the dominant material in the solar cable market, leading in usage and preference.
In 2023, Copper held a dominant market position in the By Material segment of the Solar Cable Market, underpinning its pivotal role in the industry's supply chain. This prominence is largely attributed to copper's superior electrical conductivity, durability, and flexibility, which are critical attributes for efficient solar energy transmission. The intrinsic properties of copper, such as its excellent thermal conductivity and resistance to corrosion, further consolidate its suitability for solar installations, ensuring long-term reliability and performance under varying environmental conditions.
Meanwhile, alternatives such as Aluminium Alloy also found application within the market, primarily due to their cost-effectiveness and lighter weight, which can be advantageous in specific contexts or installations. However, despite these benefits, the preference for copper in critical infrastructure and its enduring reliability often outweigh the lower upfront costs associated with aluminum alloys. The choice between copper and aluminum alloy materials ultimately hinges on a complex interplay of factors including cost, installation specifications, environmental conditions, and long-term performance expectations.
Copper's continued dominance in the Solar Cable Market speaks volumes of its efficiency and dependability. As the market continues to evolve, the demand for high-performance, durable materials is expected to further entrench copper's leading position, while also opening avenues for innovations in material science that could challenge or complement the existing dynamics.
By Cable Type Analysis
Stranded cables were the most preferred type, offering flexibility and durability in various installations.
Stranded cables dominated the By Cable Type segment of the Solar Cable Market in 2023, standing out as market leaders through superior flexibility and durability. Their prominence can be attributed to rising renewable energy demand - solar power being one such form. Stranded cables' flexibility compared to Solid versions is enhanced, making installation in difficult and varied terrain easier while simultaneously decreasing cable breakage risks significantly and thus prolonging installation lifespans.
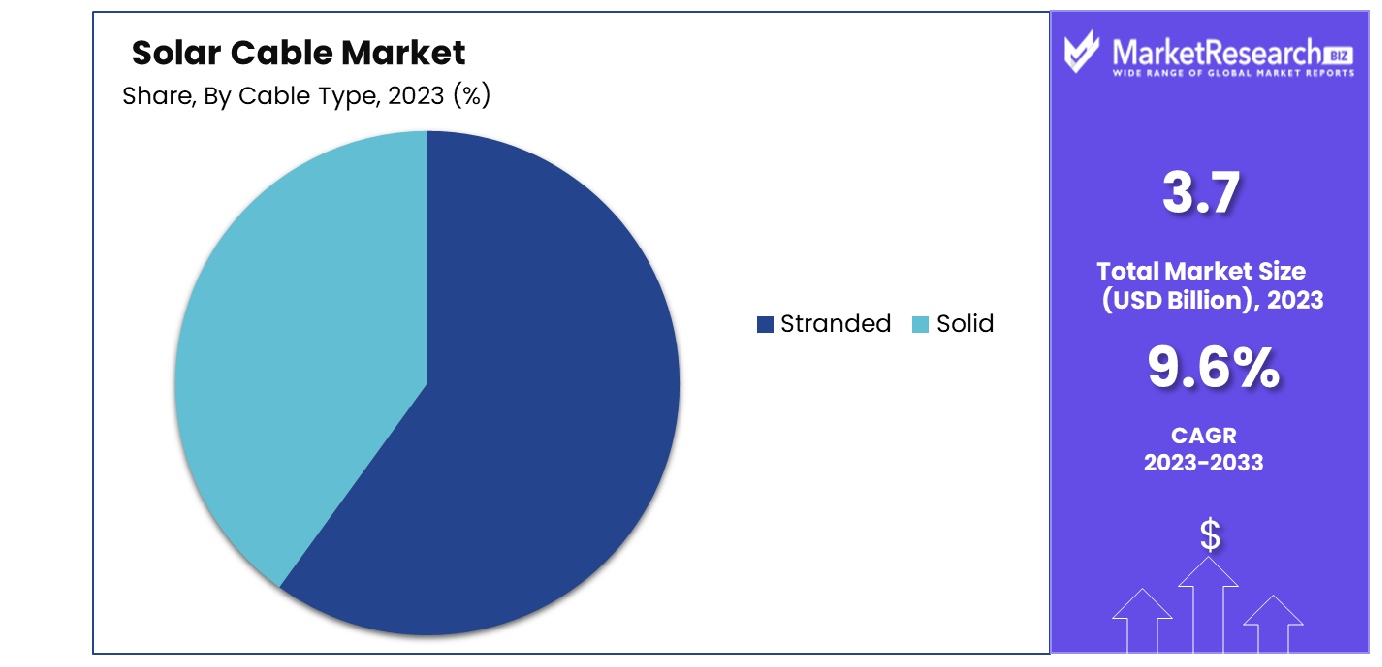
The market's inclination towards Stranded cables over Solid cables is further reinforced by their superior performance in dynamic environments subjected to frequent movements or temperature fluctuations. As solar energy projects have become more complex and ambitious, so has their demand for reliable cabling solutions, propelling the Stranded cable segment into prominence within the industry.
Moreover, advancements in cable technology and material science have augmented the efficiency and environmental resistance of Stranded cables, bolstering their adoption rate across both residential and commercial solar projects. As renewable energy expansion worldwide remains a top priority, Stranded cables play an integral part in achieving operational excellence and sustainability within the Solar Cable Market.
By Application Analysis
In terms of application, the residential sector saw the highest adoption of solar cables, reflecting growing homeowner interest.
In 2023, the Residential sector held a dominant market position within the "By Application" segment of the Solar Cable Market, underscoring a pivotal shift towards renewable energy solutions within domestic settings. This ascendancy can be attributed to several key factors, including heightened awareness around sustainable living practices, governmental incentives aimed at fostering green energy adoption, and the decreasing cost of solar installations for homeowners. Furthermore, advancements in solar technology have rendered residential solar systems more efficient and cost-effective, catalyzing their widespread implementation.
The Commercial and Industrial sectors, while also exhibiting significant growth, have followed with varied degrees of market penetration. Commercial solar cable adoption is driven by corporate sustainability goals and reduced operational costs, as well as the potential economic benefits of doing business using these cables. Meanwhile, the Industrial sector's growth is bolstered by large-scale solar projects and the need for robust, high-performance cabling solutions to ensure operational reliability and efficiency in harsh industrial environments.
Collectively, these key trends indicate a broader market evolution, with the Residential segment leading the charge toward a more sustainable and renewable energy future. The interplay between governmental policies, technological advancements, and consumer behavior patterns will continue to shape the trajectory of the Solar Cable Market across these segments.
By End User Analysis
Solar Panels Wiring led the end-user segments, highlighting its critical role in solar energy systems' efficiency and safety.
In 2023, Solar panel wiring held a dominant market position in the By End User segment of the Solar Cable Market, illustrating a pivotal shift towards renewable energy solutions and a growing emphasis on sustainable infrastructure development. This segment's prominence can be attributed to the escalating demand for efficient and reliable energy sources, coupled with significant advancements in solar technology. The integration of solar panels into residential, commercial, and industrial settings necessitates robust and durable wiring systems, thereby propelling the demand for high-quality solar cables.
Moreover, the Underground Service Entrances and Service Terminal Connections segments have also witnessed substantial growth, underpinned by the expansion of solar energy projects and the need for secure, long-lasting electrical connections. The surge in solar installations across various sectors necessitates enhanced connectivity solutions, driving the demand for specialized solar cables capable of withstanding environmental stresses and ensuring optimal energy transmission.
The market's evolution is further influenced by stringent regulatory standards and a collective move towards reducing carbon footprints, which have underscored the importance of adopting efficient wiring solutions in solar energy systems. Consequently, manufacturers and service providers are increasingly focusing on innovation, durability, and compliance in product offerings, aiming to cater to the sophisticated requirements of the solar cable market. This trend underscores a pivotal moment in the transition towards renewable energy sources, with Solar Panels Wiring emerging as a critical component in the development and implementation of solar energy projects.
Key Market Segments
By Material
- Copper
- Aluminium Alloy
By Cable Type
- Stranded
- Solid
By Application
- Residential
- Commercial
- Industrial
By End User
- Solar Panels Wiring
- Underground service Entrances
- Service Terminal Connections
Growth Opportunity
Expansion into Emerging Markets
The solar cable market is poised for significant expansion in emerging economies, driven by the increasing adoption of renewable energy sources and supportive government policies aimed at reducing carbon emissions. Countries in Asia, Africa, and Latin America are witnessing a surge in solar energy projects, catalyzed by their abundant solar resources and growing energy needs. This trend offers a lucrative growth opportunity for solar cable manufacturers to establish a presence or expand their operations in these regions.
Demand for durable, high-efficiency solar cables is expected to increase due to both new solar power plant construction projects and upgrades to existing infrastructure for supporting renewable energy generation. Manufacturers who can navigate the regulatory landscapes and form strategic partnerships with local entities will be well-positioned to capture market share.
Technological Advancements in Cable Efficiency and Durability
Innovation in solar cable technology presents another growth avenue within the solar cable market. The development of cables that combine higher efficiency, enhanced durability, and resistance to environmental factors is vital to the progress of solar energy systems. Advancements in materials science and engineering can lead to the production of solar cables that offer lower electrical losses, extended lifespans, and reduced maintenance costs.
These innovations not only meet the increasing demands for system efficiency and reliability but also provide a competitive edge in a market that values sustainability and performance. Companies investing in research and development to push the boundaries of solar cable technology can tap into new customer segments and strengthen their market position. This focus on technological advancement aligns with the broader industry trend toward increasing the efficiency and sustainability of renewable energy systems.
Latest Trends
Shift Towards Halogen-Free Solar Cables
A notable trend in the solar cable market is the increasing demand for halogen-free cables. This shift is driven by a growing emphasis on environmental sustainability and safety standards in the solar industry. Halogen-free cables, made from materials that do not emit toxic gases when exposed to fire, are becoming the preferred choice for installations in residential, commercial, and industrial sectors.
These cables not only contribute to safer solar energy systems but also align with global efforts to reduce hazardous substances in the environment. As regulations become stricter and awareness about environmental health rises, the demand for halogen-free solar cables is expected to surge, encouraging manufacturers to prioritize eco-friendly materials in their production processes.
Integration of Smart Technology in Solar Cabling
The integration of smart technology into solar cabling is transforming the way solar energy systems are monitored, maintained, and optimized. Smart solar cables equipped with sensors and IoT (Internet of Things) capabilities allow for real-time monitoring of system performance and early detection of faults.
This trend towards digitalization enables more efficient operation and maintenance of solar installations, leading to higher energy yields and reduced downtime. As the solar industry continues to evolve towards smarter and more connected systems, the demand for advanced solar cables with integrated technology is poised to grow, offering significant opportunities for innovation and market expansion. The U.S. added 32 gigawatts (GW) of new electricity-generating capacity in 2023, a growth of 52% from 2022.
Regional Analysis
Asia-Pacific leads with a 30.8% market share in the solar cable industry.
North America is witnessing steady growth, underpinned by supportive government policies and a growing inclination towards renewable energy sources. The United States, in particular, is a significant contributor to the region's market expansion, with initiatives aimed at doubling renewable energy production by 2030 fostering demand for solar cables.
Europe stands out for its stringent environmental regulations and ambitious goals for carbon neutrality. Countries like Germany and Spain are leading in solar installations, necessitating high-quality solar cables for efficient energy transmission.
Asia Pacific is the dominating region, accounting for approximately 30.8% of the global market share, driven by rapid industrialization and expanding solar energy projects in China, India, and Southeast Asia. The region benefits from favorable government policies, abundant solar resources, and escalating energy requirements, making it a hotspot for solar cable manufacturers.
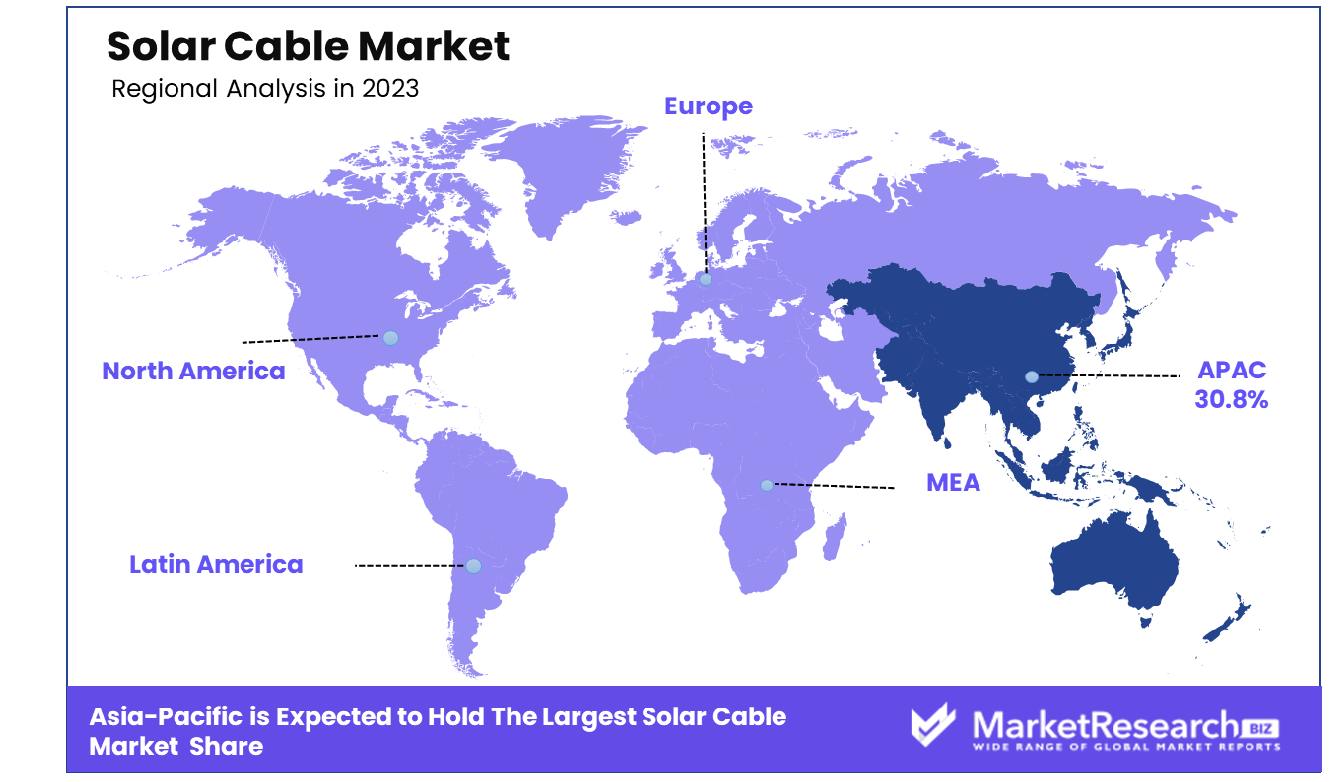
Middle East & Africa are emerging markets with significant potential, thanks to abundant solar resources and increasing investments in renewable energy. Initiatives to diversify energy sources beyond oil are gradually taking root, with countries like Saudi Arabia and South Africa investing in solar energy infrastructure.
Latin America is experiencing growth in solar energy adoption, with countries like Brazil and Chile leading the way. The region's market is buoyed by increasing awareness of renewable energy benefits and government incentives to adopt solar power.
Key Regions and Countries
North America
- The US
- Canada
- Rest of North America
Europe
- Germany
- France
- The UK
- Spain
- Netherlands
- Russia
- Italy
- Rest of Europe
Asia-Pacific
- China
- Japan
- Singapore
- Thailand
- South Korea
- Vietnam
- India
- New Zealand
- Rest of Asia Pacific
Latin America
- Mexico
- Brazil
- Rest of Latin America
Middle East & Africa
- Saudi Arabia
- South Africa
- UAE
- Rest of Middle East & Africa
Key Players Analysis
In the global solar cable market, key players such as General Cable Corporation, Atkore International Group Inc., Huber Suhner AG, Prysmian Group, and Allied Wire & Cable, among others, have significantly shaped the industry landscape in 2023. These companies are playing an essential role in driving innovation, providing high-quality, long-lasting solar cables necessary for efficient operation of solar power systems.
General Cable Corporation and Prysmian Group are noteworthy for their comprehensive range of solar cables that cater to various applications, underscoring their commitment to sustainability and renewable energy. Their products are known for reliability and performance, which is critical in reducing maintenance costs and maximizing the operational efficiency of solar installations.
Atkore International Group Inc. and Huber Suhner AG have distinguished themselves through their focus on technological advancements and product development. Their solar cables are designed to withstand harsh environmental conditions, ensuring long-term durability and safety, which is paramount for the success of solar energy projects.
Emerging players like Ningbo Pntech New Energy Co., Ltd, and Taiyo Cable Tech Co. Ltd. have also made significant inroads into the market, offering competitive solutions that emphasize cost-effectiveness without compromising quality. Their presence has introduced a dynamic competitive landscape, encouraging innovation and making solar energy more accessible.
Companies such as Lapp Group, Eldra B.V., and KBE Elektrotechnik GmbH have focused on the development of eco-friendly and sustainable solar cable solutions, aligning with the global shift towards environmental sustainability. Their efforts in producing cables that minimize environmental impact while maximizing performance are commendable.
Furthermore, specialized players like Phoenix Contact GmbH Co. KG and Havells have leveraged their expertise in electrical and connection technology to enhance the solar cable offerings, ensuring that the solar energy sector benefits from high-quality connectivity solutions.
Market Key Players
- General Cable Corporation
- Atkore International Group Inc.
- Huber Suhner AG
- Prysmian Group
- Allied Wire & Cable
- Lumberg Connect GmbH
- ReneSola Ltd
- Ram Ratna Wires Ltd.
- Ningbo Pntech New Energy Co., Ltd
- Taiyo Cable Tech Co. Ltd.
- Lapp Group, Eldra B.V
- KBE Elektrotechnik GmbH
- Phoenix Contact GmbH Co. KG
- Havells
Recent Development
- In February 2024, Vattenfall progresses the UK offshore hydrogen project with £9.3m funding. An 8MW electrolyzer at Aberdeen Bay's wind farm aims for early 2025 production, advancing clean energy transition.
- In February 2024, Spanish engineers unveil a groundbreaking airborne solar system, transcending terrestrial constraints. José Luis Peón González and José Raúl González Ruiánchez pioneer innovative PV technology, redefining energy generation possibilities.
- In February 2024, The U.S. PV industry experiences rapid growth, with NextEra's Desert Peak Energy Storage (325MW/1300MWh) and Intersect Power's Oberon solar (250MW) projects leading advancements in storage and solar integration.
- In February 2024, SECI commissioned India's largest Battery Energy Storage System (BESS) with 40MW/120MWh capacity in Chhattisgarh, utilizing solar energy, enhancing renewable energy infrastructure and sustainable land use.
- In February 2024, Polycab emphasizes solar cable importance for India's renewable energy goals. Efforts focus on efficiency, reliability, and environmental impact, aligning with the nation's ambitious targets for a sustainable future.
Report Scope
Report Features Description Market Value (2023) USD 3.7 Billion Forecast Revenue (2033) USD 9.0 Billion CAGR (2024-2032) 9.6% Base Year for Estimation 2023 Historic Period 2016-2023 Forecast Period 2024-2033 Report Coverage Revenue Forecast, Market Dynamics, COVID-19 Impact, Competitive Landscape, Recent Developments Segments Covered By Material(Copper, Aluminium Alloy), By Cable Type(Stranded, Solid), By Application(Residential, Commercial, Industrial), By End User(Solar Panels Wiring, Underground ssrvice Entrances, Service Terminal Connections) Regional Analysis North America - The US, Canada, Rest of North America, Europe - Germany, France, The UK, Spain, Italy, Russia, Netherlands, Rest of Europe, Asia-Pacific - China, Japan, South Korea, India, New Zealand, Singapore, Thailand, Vietnam, Rest of Asia Pacific, Latin America - Brazil, Mexico, Rest of Latin America, Middle East & Africa - South Africa, Saudi Arabia, UAE, Rest of Middle East & Africa Competitive Landscape General Cable Corporation, Atkore International Group Inc., Huber Suhner AG, Prysmian Group, Allied Wire & Cable, Lumberg Connect GmbH, ReneSola Ltd, Ram Ratna Wires Ltd., Ningbo Pntech New Energy Co., Ltd, Taiyo Cable Tech Co. Ltd., Lapp Group, Eldra B.V, KBE Elektrotechnik GmbH, Phoenix Contact GmbH Co. KG, Havells Customization Scope Customization for segments, region/country-level will be provided. Moreover, additional customization can be done based on the requirements. Purchase Options We have three licenses to opt for Single User License, Multi-User License (Up to 5 Users), Corporate Use License (Unlimited User and Printable PDF) -
- 1. Executive Summary
- 1.1. Definition
- 1.2. Taxonomy
- 1.3. Research Scope
- 1.4. Key Analysis
- 1.5. Key Findings by Major Segments
- 1.6. Top strategies by Major Players
- 2. Global Solar Cable Market Overview
- 2.1. Solar Cable Market Dynamics
- 2.1.1. Drivers
- 2.1.2. Opportunities
- 2.1.3. Restraints
- 2.1.4. Challenges
- 2.2. Macro-economic Factors
- 2.3. Regulatory Framework
- 2.4. Market Investment Feasibility Index
- 2.5. PEST Analysis
- 2.6. PORTER’S Five Force Analysis
- 2.7. Drivers & Restraints Impact Analysis
- 2.8. Industry Chain Analysis
- 2.9. Cost Structure Analysis
- 2.10. Marketing Strategy
- 2.11. Russia-Ukraine War Impact Analysis
- 2.12. Opportunity Map Analysis
- 2.13. Market Competition Scenario Analysis
- 2.14. Product Life Cycle Analysis
- 2.15. Opportunity Orbits
- 2.16. Manufacturer Intensity Map
- 2.17. Major Companies sales by Value & Volume
- 2.1. Solar Cable Market Dynamics
- 3. Global Solar Cable Market Analysis, Opportunity and Forecast, 2016-2032
- 3.1. Global Solar Cable Market Analysis, 2016-2021
- 3.2. Global Solar Cable Market Opportunity and Forecast, 2023-2032
- 3.3. Global Solar Cable Market Analysis, Opportunity and Forecast, By By Material, 2016-2032
- 3.3.1. Global Solar Cable Market Analysis by By Material: Introduction
- 3.3.2. Market Size Absolute $ Opportunity Analysis and Forecast, By By Material, 2016-2032
- 3.3.3. Copper
- 3.3.4. Aluminium Alloy
- 3.4. Global Solar Cable Market Analysis, Opportunity and Forecast, By By Cable Type, 2016-2032
- 3.4.1. Global Solar Cable Market Analysis by By Cable Type: Introduction
- 3.4.2. Market Size Absolute $ Opportunity Analysis and Forecast, By By Cable Type, 2016-2032
- 3.4.3. Stranded
- 3.4.4. Solid
- 3.5. Global Solar Cable Market Analysis, Opportunity and Forecast, By By Application, 2016-2032
- 3.5.1. Global Solar Cable Market Analysis by By Application: Introduction
- 3.5.2. Market Size Absolute $ Opportunity Analysis and Forecast, By By Application, 2016-2032
- 3.5.3. Residential
- 3.5.4. Commercial
- 3.5.5. Industrial
- 3.6. Global Solar Cable Market Analysis, Opportunity and Forecast, By By End User, 2016-2032
- 3.6.1. Global Solar Cable Market Analysis by By End User: Introduction
- 3.6.2. Market Size Absolute $ Opportunity Analysis and Forecast, By By End User, 2016-2032
- 3.6.3. Solar Panels Wiring
- 3.6.4. Underground ssrvice Entrances
- 3.6.5. Service Terminal Connections
- 4. North America Solar Cable Market Analysis, Opportunity and Forecast, 2016-2032
- 4.1. North America Solar Cable Market Analysis, 2016-2021
- 4.2. North America Solar Cable Market Opportunity and Forecast, 2023-2032
- 4.3. North America Solar Cable Market Analysis, Opportunity and Forecast, By By Material, 2016-2032
- 4.3.1. North America Solar Cable Market Analysis by By Material: Introduction
- 4.3.2. Market Size Absolute $ Opportunity Analysis and Forecast, By By Material, 2016-2032
- 4.3.3. Copper
- 4.3.4. Aluminium Alloy
- 4.4. North America Solar Cable Market Analysis, Opportunity and Forecast, By By Cable Type, 2016-2032
- 4.4.1. North America Solar Cable Market Analysis by By Cable Type: Introduction
- 4.4.2. Market Size Absolute $ Opportunity Analysis and Forecast, By By Cable Type, 2016-2032
- 4.4.3. Stranded
- 4.4.4. Solid
- 4.5. North America Solar Cable Market Analysis, Opportunity and Forecast, By By Application, 2016-2032
- 4.5.1. North America Solar Cable Market Analysis by By Application: Introduction
- 4.5.2. Market Size Absolute $ Opportunity Analysis and Forecast, By By Application, 2016-2032
- 4.5.3. Residential
- 4.5.4. Commercial
- 4.5.5. Industrial
- 4.6. North America Solar Cable Market Analysis, Opportunity and Forecast, By By End User, 2016-2032
- 4.6.1. North America Solar Cable Market Analysis by By End User: Introduction
- 4.6.2. Market Size Absolute $ Opportunity Analysis and Forecast, By By End User, 2016-2032
- 4.6.3. Solar Panels Wiring
- 4.6.4. Underground ssrvice Entrances
- 4.6.5. Service Terminal Connections
- 4.7. North America Solar Cable Market Analysis, Opportunity and Forecast, By Country , 2016-2032
- 4.7.1. North America Solar Cable Market Analysis by Country : Introduction
- 4.7.2. Market Size Absolute $ Opportunity Analysis and Forecast, Country , 2016-2032
- 4.7.2.1. The US
- 4.7.2.2. Canada
- 4.7.2.3. Mexico
- 5. Western Europe Solar Cable Market Analysis, Opportunity and Forecast, 2016-2032
- 5.1. Western Europe Solar Cable Market Analysis, 2016-2021
- 5.2. Western Europe Solar Cable Market Opportunity and Forecast, 2023-2032
- 5.3. Western Europe Solar Cable Market Analysis, Opportunity and Forecast, By By Material, 2016-2032
- 5.3.1. Western Europe Solar Cable Market Analysis by By Material: Introduction
- 5.3.2. Market Size Absolute $ Opportunity Analysis and Forecast, By By Material, 2016-2032
- 5.3.3. Copper
- 5.3.4. Aluminium Alloy
- 5.4. Western Europe Solar Cable Market Analysis, Opportunity and Forecast, By By Cable Type, 2016-2032
- 5.4.1. Western Europe Solar Cable Market Analysis by By Cable Type: Introduction
- 5.4.2. Market Size Absolute $ Opportunity Analysis and Forecast, By By Cable Type, 2016-2032
- 5.4.3. Stranded
- 5.4.4. Solid
- 5.5. Western Europe Solar Cable Market Analysis, Opportunity and Forecast, By By Application, 2016-2032
- 5.5.1. Western Europe Solar Cable Market Analysis by By Application: Introduction
- 5.5.2. Market Size Absolute $ Opportunity Analysis and Forecast, By By Application, 2016-2032
- 5.5.3. Residential
- 5.5.4. Commercial
- 5.5.5. Industrial
- 5.6. Western Europe Solar Cable Market Analysis, Opportunity and Forecast, By By End User, 2016-2032
- 5.6.1. Western Europe Solar Cable Market Analysis by By End User: Introduction
- 5.6.2. Market Size Absolute $ Opportunity Analysis and Forecast, By By End User, 2016-2032
- 5.6.3. Solar Panels Wiring
- 5.6.4. Underground ssrvice Entrances
- 5.6.5. Service Terminal Connections
- 5.7. Western Europe Solar Cable Market Analysis, Opportunity and Forecast, By Country , 2016-2032
- 5.7.1. Western Europe Solar Cable Market Analysis by Country : Introduction
- 5.7.2. Market Size Absolute $ Opportunity Analysis and Forecast, Country , 2016-2032
- 5.7.2.1. Germany
- 5.7.2.2. France
- 5.7.2.3. The UK
- 5.7.2.4. Spain
- 5.7.2.5. Italy
- 5.7.2.6. Portugal
- 5.7.2.7. Ireland
- 5.7.2.8. Austria
- 5.7.2.9. Switzerland
- 5.7.2.10. Benelux
- 5.7.2.11. Nordic
- 5.7.2.12. Rest of Western Europe
- 6. Eastern Europe Solar Cable Market Analysis, Opportunity and Forecast, 2016-2032
- 6.1. Eastern Europe Solar Cable Market Analysis, 2016-2021
- 6.2. Eastern Europe Solar Cable Market Opportunity and Forecast, 2023-2032
- 6.3. Eastern Europe Solar Cable Market Analysis, Opportunity and Forecast, By By Material, 2016-2032
- 6.3.1. Eastern Europe Solar Cable Market Analysis by By Material: Introduction
- 6.3.2. Market Size Absolute $ Opportunity Analysis and Forecast, By By Material, 2016-2032
- 6.3.3. Copper
- 6.3.4. Aluminium Alloy
- 6.4. Eastern Europe Solar Cable Market Analysis, Opportunity and Forecast, By By Cable Type, 2016-2032
- 6.4.1. Eastern Europe Solar Cable Market Analysis by By Cable Type: Introduction
- 6.4.2. Market Size Absolute $ Opportunity Analysis and Forecast, By By Cable Type, 2016-2032
- 6.4.3. Stranded
- 6.4.4. Solid
- 6.5. Eastern Europe Solar Cable Market Analysis, Opportunity and Forecast, By By Application, 2016-2032
- 6.5.1. Eastern Europe Solar Cable Market Analysis by By Application: Introduction
- 6.5.2. Market Size Absolute $ Opportunity Analysis and Forecast, By By Application, 2016-2032
- 6.5.3. Residential
- 6.5.4. Commercial
- 6.5.5. Industrial
- 6.6. Eastern Europe Solar Cable Market Analysis, Opportunity and Forecast, By By End User, 2016-2032
- 6.6.1. Eastern Europe Solar Cable Market Analysis by By End User: Introduction
- 6.6.2. Market Size Absolute $ Opportunity Analysis and Forecast, By By End User, 2016-2032
- 6.6.3. Solar Panels Wiring
- 6.6.4. Underground ssrvice Entrances
- 6.6.5. Service Terminal Connections
- 6.7. Eastern Europe Solar Cable Market Analysis, Opportunity and Forecast, By Country , 2016-2032
- 6.7.1. Eastern Europe Solar Cable Market Analysis by Country : Introduction
- 6.7.2. Market Size Absolute $ Opportunity Analysis and Forecast, Country , 2016-2032
- 6.7.2.1. Russia
- 6.7.2.2. Poland
- 6.7.2.3. The Czech Republic
- 6.7.2.4. Greece
- 6.7.2.5. Rest of Eastern Europe
- 7. APAC Solar Cable Market Analysis, Opportunity and Forecast, 2016-2032
- 7.1. APAC Solar Cable Market Analysis, 2016-2021
- 7.2. APAC Solar Cable Market Opportunity and Forecast, 2023-2032
- 7.3. APAC Solar Cable Market Analysis, Opportunity and Forecast, By By Material, 2016-2032
- 7.3.1. APAC Solar Cable Market Analysis by By Material: Introduction
- 7.3.2. Market Size Absolute $ Opportunity Analysis and Forecast, By By Material, 2016-2032
- 7.3.3. Copper
- 7.3.4. Aluminium Alloy
- 7.4. APAC Solar Cable Market Analysis, Opportunity and Forecast, By By Cable Type, 2016-2032
- 7.4.1. APAC Solar Cable Market Analysis by By Cable Type: Introduction
- 7.4.2. Market Size Absolute $ Opportunity Analysis and Forecast, By By Cable Type, 2016-2032
- 7.4.3. Stranded
- 7.4.4. Solid
- 7.5. APAC Solar Cable Market Analysis, Opportunity and Forecast, By By Application, 2016-2032
- 7.5.1. APAC Solar Cable Market Analysis by By Application: Introduction
- 7.5.2. Market Size Absolute $ Opportunity Analysis and Forecast, By By Application, 2016-2032
- 7.5.3. Residential
- 7.5.4. Commercial
- 7.5.5. Industrial
- 7.6. APAC Solar Cable Market Analysis, Opportunity and Forecast, By By End User, 2016-2032
- 7.6.1. APAC Solar Cable Market Analysis by By End User: Introduction
- 7.6.2. Market Size Absolute $ Opportunity Analysis and Forecast, By By End User, 2016-2032
- 7.6.3. Solar Panels Wiring
- 7.6.4. Underground ssrvice Entrances
- 7.6.5. Service Terminal Connections
- 7.7. APAC Solar Cable Market Analysis, Opportunity and Forecast, By Country , 2016-2032
- 7.7.1. APAC Solar Cable Market Analysis by Country : Introduction
- 7.7.2. Market Size Absolute $ Opportunity Analysis and Forecast, Country , 2016-2032
- 7.7.2.1. China
- 7.7.2.2. Japan
- 7.7.2.3. South Korea
- 7.7.2.4. India
- 7.7.2.5. Australia & New Zeland
- 7.7.2.6. Indonesia
- 7.7.2.7. Malaysia
- 7.7.2.8. Philippines
- 7.7.2.9. Singapore
- 7.7.2.10. Thailand
- 7.7.2.11. Vietnam
- 7.7.2.12. Rest of APAC
- 8. Latin America Solar Cable Market Analysis, Opportunity and Forecast, 2016-2032
- 8.1. Latin America Solar Cable Market Analysis, 2016-2021
- 8.2. Latin America Solar Cable Market Opportunity and Forecast, 2023-2032
- 8.3. Latin America Solar Cable Market Analysis, Opportunity and Forecast, By By Material, 2016-2032
- 8.3.1. Latin America Solar Cable Market Analysis by By Material: Introduction
- 8.3.2. Market Size Absolute $ Opportunity Analysis and Forecast, By By Material, 2016-2032
- 8.3.3. Copper
- 8.3.4. Aluminium Alloy
- 8.4. Latin America Solar Cable Market Analysis, Opportunity and Forecast, By By Cable Type, 2016-2032
- 8.4.1. Latin America Solar Cable Market Analysis by By Cable Type: Introduction
- 8.4.2. Market Size Absolute $ Opportunity Analysis and Forecast, By By Cable Type, 2016-2032
- 8.4.3. Stranded
- 8.4.4. Solid
- 8.5. Latin America Solar Cable Market Analysis, Opportunity and Forecast, By By Application, 2016-2032
- 8.5.1. Latin America Solar Cable Market Analysis by By Application: Introduction
- 8.5.2. Market Size Absolute $ Opportunity Analysis and Forecast, By By Application, 2016-2032
- 8.5.3. Residential
- 8.5.4. Commercial
- 8.5.5. Industrial
- 8.6. Latin America Solar Cable Market Analysis, Opportunity and Forecast, By By End User, 2016-2032
- 8.6.1. Latin America Solar Cable Market Analysis by By End User: Introduction
- 8.6.2. Market Size Absolute $ Opportunity Analysis and Forecast, By By End User, 2016-2032
- 8.6.3. Solar Panels Wiring
- 8.6.4. Underground ssrvice Entrances
- 8.6.5. Service Terminal Connections
- 8.7. Latin America Solar Cable Market Analysis, Opportunity and Forecast, By Country , 2016-2032
- 8.7.1. Latin America Solar Cable Market Analysis by Country : Introduction
- 8.7.2. Market Size Absolute $ Opportunity Analysis and Forecast, Country , 2016-2032
- 8.7.2.1. Brazil
- 8.7.2.2. Colombia
- 8.7.2.3. Chile
- 8.7.2.4. Argentina
- 8.7.2.5. Costa Rica
- 8.7.2.6. Rest of Latin America
- 9. Middle East & Africa Solar Cable Market Analysis, Opportunity and Forecast, 2016-2032
- 9.1. Middle East & Africa Solar Cable Market Analysis, 2016-2021
- 9.2. Middle East & Africa Solar Cable Market Opportunity and Forecast, 2023-2032
- 9.3. Middle East & Africa Solar Cable Market Analysis, Opportunity and Forecast, By By Material, 2016-2032
- 9.3.1. Middle East & Africa Solar Cable Market Analysis by By Material: Introduction
- 9.3.2. Market Size Absolute $ Opportunity Analysis and Forecast, By By Material, 2016-2032
- 9.3.3. Copper
- 9.3.4. Aluminium Alloy
- 9.4. Middle East & Africa Solar Cable Market Analysis, Opportunity and Forecast, By By Cable Type, 2016-2032
- 9.4.1. Middle East & Africa Solar Cable Market Analysis by By Cable Type: Introduction
- 9.4.2. Market Size Absolute $ Opportunity Analysis and Forecast, By By Cable Type, 2016-2032
- 9.4.3. Stranded
- 9.4.4. Solid
- 9.5. Middle East & Africa Solar Cable Market Analysis, Opportunity and Forecast, By By Application, 2016-2032
- 9.5.1. Middle East & Africa Solar Cable Market Analysis by By Application: Introduction
- 9.5.2. Market Size Absolute $ Opportunity Analysis and Forecast, By By Application, 2016-2032
- 9.5.3. Residential
- 9.5.4. Commercial
- 9.5.5. Industrial
- 9.6. Middle East & Africa Solar Cable Market Analysis, Opportunity and Forecast, By By End User, 2016-2032
- 9.6.1. Middle East & Africa Solar Cable Market Analysis by By End User: Introduction
- 9.6.2. Market Size Absolute $ Opportunity Analysis and Forecast, By By End User, 2016-2032
- 9.6.3. Solar Panels Wiring
- 9.6.4. Underground ssrvice Entrances
- 9.6.5. Service Terminal Connections
- 9.7. Middle East & Africa Solar Cable Market Analysis, Opportunity and Forecast, By Country , 2016-2032
- 9.7.1. Middle East & Africa Solar Cable Market Analysis by Country : Introduction
- 9.7.2. Market Size Absolute $ Opportunity Analysis and Forecast, Country , 2016-2032
- 9.7.2.1. Algeria
- 9.7.2.2. Egypt
- 9.7.2.3. Israel
- 9.7.2.4. Kuwait
- 9.7.2.5. Nigeria
- 9.7.2.6. Saudi Arabia
- 9.7.2.7. South Africa
- 9.7.2.8. Turkey
- 9.7.2.9. The UAE
- 9.7.2.10. Rest of MEA
- 10. Global Solar Cable Market Analysis, Opportunity and Forecast, By Region , 2016-2032
- 10.1. Global Solar Cable Market Analysis by Region : Introduction
- 10.2. Market Size Absolute $ Opportunity Analysis and Forecast, By Region , 2016-2032
- 10.2.1. North America
- 10.2.2. Western Europe
- 10.2.3. Eastern Europe
- 10.2.4. APAC
- 10.2.5. Latin America
- 10.2.6. Middle East & Africa
- 11. Global Solar Cable Market Competitive Landscape, Market Share Analysis, and Company Profiles
- 11.1. Market Share Analysis
- 11.2. Company Profiles
- 11.3. General Cable Corporation
- 11.3.1. Company Overview
- 11.3.2. Financial Highlights
- 11.3.3. Product Portfolio
- 11.3.4. SWOT Analysis
- 11.3.5. Key Strategies and Developments
- 11.4. Atkore International Group Inc.
- 11.4.1. Company Overview
- 11.4.2. Financial Highlights
- 11.4.3. Product Portfolio
- 11.4.4. SWOT Analysis
- 11.4.5. Key Strategies and Developments
- 11.5. Huber Suhner AG
- 11.5.1. Company Overview
- 11.5.2. Financial Highlights
- 11.5.3. Product Portfolio
- 11.5.4. SWOT Analysis
- 11.5.5. Key Strategies and Developments
- 11.6. Prysmian Group
- 11.6.1. Company Overview
- 11.6.2. Financial Highlights
- 11.6.3. Product Portfolio
- 11.6.4. SWOT Analysis
- 11.6.5. Key Strategies and Developments
- 11.7. Allied Wire & Cable
- 11.7.1. Company Overview
- 11.7.2. Financial Highlights
- 11.7.3. Product Portfolio
- 11.7.4. SWOT Analysis
- 11.7.5. Key Strategies and Developments
- 11.8. Lumberg Connect GmbH
- 11.8.1. Company Overview
- 11.8.2. Financial Highlights
- 11.8.3. Product Portfolio
- 11.8.4. SWOT Analysis
- 11.8.5. Key Strategies and Developments
- 11.9. ReneSola Ltd
- 11.9.1. Company Overview
- 11.9.2. Financial Highlights
- 11.9.3. Product Portfolio
- 11.9.4. SWOT Analysis
- 11.9.5. Key Strategies and Developments
- 11.10. Ram Ratna Wires Ltd.
- 11.10.1. Company Overview
- 11.10.2. Financial Highlights
- 11.10.3. Product Portfolio
- 11.10.4. SWOT Analysis
- 11.10.5. Key Strategies and Developments
- 11.11. Ningbo Pntech New Energy Co., Ltd
- 11.11.1. Company Overview
- 11.11.2. Financial Highlights
- 11.11.3. Product Portfolio
- 11.11.4. SWOT Analysis
- 11.11.5. Key Strategies and Developments
- 11.12. Taiyo Cable Tech Co. Ltd.
- 11.12.1. Company Overview
- 11.12.2. Financial Highlights
- 11.12.3. Product Portfolio
- 11.12.4. SWOT Analysis
- 11.12.5. Key Strategies and Developments
- 11.13.1. Company Overview
- 11.13.2. Financial Highlights
- 11.13.3. Product Portfolio
- 11.13.4. SWOT Analysis
- 11.13.5. Key Strategies and Developments
- 11.14. Lapp Group, Eldra B.V
- 11.14.1. Company Overview
- 11.14.2. Financial Highlights
- 11.14.3. Product Portfolio
- 11.14.4. SWOT Analysis
- 11.14.5. Key Strategies and Developments
- 11.15. Phoenix Contact GmbH Co. KG
- 11.15.1. Company Overview
- 11.15.2. Financial Highlights
- 11.15.3. Product Portfolio
- 11.15.4. SWOT Analysis
- 11.15.5. Key Strategies and Developments
- 11.16. Havells
- 11.16.1. Company Overview
- 11.16.2. Financial Highlights
- 11.16.3. Product Portfolio
- 11.16.4. SWOT Analysis
- 11.16.5. Key Strategies and Developments
- 12. Assumptions and Acronyms
- 13. Research Methodology
- 14. Contact
"
- List of Figures
- "
- Figure 1: Global Solar Cable Market Revenue (US$ Mn) Market Share by By Material in 2022
- Figure 2: Global Solar Cable Market Market Attractiveness Analysis by By Material, 2016-2032
- Figure 3: Global Solar Cable Market Revenue (US$ Mn) Market Share by By Cable Typein 2022
- Figure 4: Global Solar Cable Market Market Attractiveness Analysis by By Cable Type, 2016-2032
- Figure 5: Global Solar Cable Market Revenue (US$ Mn) Market Share by By Applicationin 2022
- Figure 6: Global Solar Cable Market Market Attractiveness Analysis by By Application, 2016-2032
- Figure 7: Global Solar Cable Market Revenue (US$ Mn) Market Share by By End Userin 2022
- Figure 8: Global Solar Cable Market Market Attractiveness Analysis by By End User, 2016-2032
- Figure 9: Global Solar Cable Market Revenue (US$ Mn) Market Share by Region in 2022
- Figure 10: Global Solar Cable Market Market Attractiveness Analysis by Region, 2016-2032
- Figure 11: Global Solar Cable Market Market Revenue (US$ Mn) (2016-2032)
- Figure 12: Global Solar Cable Market Market Revenue (US$ Mn) Comparison by Region (2016-2032)
- Figure 13: Global Solar Cable Market Market Revenue (US$ Mn) Comparison by By Material (2016-2032)
- Figure 14: Global Solar Cable Market Market Revenue (US$ Mn) Comparison by By Cable Type (2016-2032)
- Figure 15: Global Solar Cable Market Market Revenue (US$ Mn) Comparison by By Application (2016-2032)
- Figure 16: Global Solar Cable Market Market Revenue (US$ Mn) Comparison by By End User (2016-2032)
- Figure 17: Global Solar Cable Market Market Y-o-Y Growth Rate Comparison by Region (2016-2032)
- Figure 18: Global Solar Cable Market Market Y-o-Y Growth Rate Comparison by By Material (2016-2032)
- Figure 19: Global Solar Cable Market Market Y-o-Y Growth Rate Comparison by By Cable Type (2016-2032)
- Figure 20: Global Solar Cable Market Market Y-o-Y Growth Rate Comparison by By Application (2016-2032)
- Figure 21: Global Solar Cable Market Market Y-o-Y Growth Rate Comparison by By End User (2016-2032)
- Figure 22: Global Solar Cable Market Market Share Comparison by Region (2016-2032)
- Figure 23: Global Solar Cable Market Market Share Comparison by By Material (2016-2032)
- Figure 24: Global Solar Cable Market Market Share Comparison by By Cable Type (2016-2032)
- Figure 25: Global Solar Cable Market Market Share Comparison by By Application (2016-2032)
- Figure 26: Global Solar Cable Market Market Share Comparison by By End User (2016-2032)
- Figure 27: North America Solar Cable Market Revenue (US$ Mn) Market Share by By Materialin 2022
- Figure 28: North America Solar Cable Market Market Attractiveness Analysis by By Material, 2016-2032
- Figure 29: North America Solar Cable Market Revenue (US$ Mn) Market Share by By Cable Typein 2022
- Figure 30: North America Solar Cable Market Market Attractiveness Analysis by By Cable Type, 2016-2032
- Figure 31: North America Solar Cable Market Revenue (US$ Mn) Market Share by By Applicationin 2022
- Figure 32: North America Solar Cable Market Market Attractiveness Analysis by By Application, 2016-2032
- Figure 33: North America Solar Cable Market Revenue (US$ Mn) Market Share by By End Userin 2022
- Figure 34: North America Solar Cable Market Market Attractiveness Analysis by By End User, 2016-2032
- Figure 35: North America Solar Cable Market Revenue (US$ Mn) Market Share by Country in 2022
- Figure 36: North America Solar Cable Market Market Attractiveness Analysis by Country, 2016-2032
- Figure 37: North America Solar Cable Market Market Revenue (US$ Mn) (2016-2032)
- Figure 38: North America Solar Cable Market Market Revenue (US$ Mn) Comparison by Country (2016-2032)
- Figure 39: North America Solar Cable Market Market Revenue (US$ Mn) Comparison by By Material (2016-2032)
- Figure 40: North America Solar Cable Market Market Revenue (US$ Mn) Comparison by By Cable Type (2016-2032)
- Figure 41: North America Solar Cable Market Market Revenue (US$ Mn) Comparison by By Application (2016-2032)
- Figure 42: North America Solar Cable Market Market Revenue (US$ Mn) Comparison by By End User (2016-2032)
- Figure 43: North America Solar Cable Market Market Y-o-Y Growth Rate Comparison by Country (2016-2032)
- Figure 44: North America Solar Cable Market Market Y-o-Y Growth Rate Comparison by By Material (2016-2032)
- Figure 45: North America Solar Cable Market Market Y-o-Y Growth Rate Comparison by By Cable Type (2016-2032)
- Figure 46: North America Solar Cable Market Market Y-o-Y Growth Rate Comparison by By Application (2016-2032)
- Figure 47: North America Solar Cable Market Market Y-o-Y Growth Rate Comparison by By End User (2016-2032)
- Figure 48: North America Solar Cable Market Market Share Comparison by Country (2016-2032)
- Figure 49: North America Solar Cable Market Market Share Comparison by By Material (2016-2032)
- Figure 50: North America Solar Cable Market Market Share Comparison by By Cable Type (2016-2032)
- Figure 51: North America Solar Cable Market Market Share Comparison by By Application (2016-2032)
- Figure 52: North America Solar Cable Market Market Share Comparison by By End User (2016-2032)
- Figure 53: Western Europe Solar Cable Market Revenue (US$ Mn) Market Share by By Materialin 2022
- Figure 54: Western Europe Solar Cable Market Market Attractiveness Analysis by By Material, 2016-2032
- Figure 55: Western Europe Solar Cable Market Revenue (US$ Mn) Market Share by By Cable Typein 2022
- Figure 56: Western Europe Solar Cable Market Market Attractiveness Analysis by By Cable Type, 2016-2032
- Figure 57: Western Europe Solar Cable Market Revenue (US$ Mn) Market Share by By Applicationin 2022
- Figure 58: Western Europe Solar Cable Market Market Attractiveness Analysis by By Application, 2016-2032
- Figure 59: Western Europe Solar Cable Market Revenue (US$ Mn) Market Share by By End Userin 2022
- Figure 60: Western Europe Solar Cable Market Market Attractiveness Analysis by By End User, 2016-2032
- Figure 61: Western Europe Solar Cable Market Revenue (US$ Mn) Market Share by Country in 2022
- Figure 62: Western Europe Solar Cable Market Market Attractiveness Analysis by Country, 2016-2032
- Figure 63: Western Europe Solar Cable Market Market Revenue (US$ Mn) (2016-2032)
- Figure 64: Western Europe Solar Cable Market Market Revenue (US$ Mn) Comparison by Country (2016-2032)
- Figure 65: Western Europe Solar Cable Market Market Revenue (US$ Mn) Comparison by By Material (2016-2032)
- Figure 66: Western Europe Solar Cable Market Market Revenue (US$ Mn) Comparison by By Cable Type (2016-2032)
- Figure 67: Western Europe Solar Cable Market Market Revenue (US$ Mn) Comparison by By Application (2016-2032)
- Figure 68: Western Europe Solar Cable Market Market Revenue (US$ Mn) Comparison by By End User (2016-2032)
- Figure 69: Western Europe Solar Cable Market Market Y-o-Y Growth Rate Comparison by Country (2016-2032)
- Figure 70: Western Europe Solar Cable Market Market Y-o-Y Growth Rate Comparison by By Material (2016-2032)
- Figure 71: Western Europe Solar Cable Market Market Y-o-Y Growth Rate Comparison by By Cable Type (2016-2032)
- Figure 72: Western Europe Solar Cable Market Market Y-o-Y Growth Rate Comparison by By Application (2016-2032)
- Figure 73: Western Europe Solar Cable Market Market Y-o-Y Growth Rate Comparison by By End User (2016-2032)
- Figure 74: Western Europe Solar Cable Market Market Share Comparison by Country (2016-2032)
- Figure 75: Western Europe Solar Cable Market Market Share Comparison by By Material (2016-2032)
- Figure 76: Western Europe Solar Cable Market Market Share Comparison by By Cable Type (2016-2032)
- Figure 77: Western Europe Solar Cable Market Market Share Comparison by By Application (2016-2032)
- Figure 78: Western Europe Solar Cable Market Market Share Comparison by By End User (2016-2032)
- Figure 79: Eastern Europe Solar Cable Market Revenue (US$ Mn) Market Share by By Materialin 2022
- Figure 80: Eastern Europe Solar Cable Market Market Attractiveness Analysis by By Material, 2016-2032
- Figure 81: Eastern Europe Solar Cable Market Revenue (US$ Mn) Market Share by By Cable Typein 2022
- Figure 82: Eastern Europe Solar Cable Market Market Attractiveness Analysis by By Cable Type, 2016-2032
- Figure 83: Eastern Europe Solar Cable Market Revenue (US$ Mn) Market Share by By Applicationin 2022
- Figure 84: Eastern Europe Solar Cable Market Market Attractiveness Analysis by By Application, 2016-2032
- Figure 85: Eastern Europe Solar Cable Market Revenue (US$ Mn) Market Share by By End Userin 2022
- Figure 86: Eastern Europe Solar Cable Market Market Attractiveness Analysis by By End User, 2016-2032
- Figure 87: Eastern Europe Solar Cable Market Revenue (US$ Mn) Market Share by Country in 2022
- Figure 88: Eastern Europe Solar Cable Market Market Attractiveness Analysis by Country, 2016-2032
- Figure 89: Eastern Europe Solar Cable Market Market Revenue (US$ Mn) (2016-2032)
- Figure 90: Eastern Europe Solar Cable Market Market Revenue (US$ Mn) Comparison by Country (2016-2032)
- Figure 91: Eastern Europe Solar Cable Market Market Revenue (US$ Mn) Comparison by By Material (2016-2032)
- Figure 92: Eastern Europe Solar Cable Market Market Revenue (US$ Mn) Comparison by By Cable Type (2016-2032)
- Figure 93: Eastern Europe Solar Cable Market Market Revenue (US$ Mn) Comparison by By Application (2016-2032)
- Figure 94: Eastern Europe Solar Cable Market Market Revenue (US$ Mn) Comparison by By End User (2016-2032)
- Figure 95: Eastern Europe Solar Cable Market Market Y-o-Y Growth Rate Comparison by Country (2016-2032)
- Figure 96: Eastern Europe Solar Cable Market Market Y-o-Y Growth Rate Comparison by By Material (2016-2032)
- Figure 97: Eastern Europe Solar Cable Market Market Y-o-Y Growth Rate Comparison by By Cable Type (2016-2032)
- Figure 98: Eastern Europe Solar Cable Market Market Y-o-Y Growth Rate Comparison by By Application (2016-2032)
- Figure 99: Eastern Europe Solar Cable Market Market Y-o-Y Growth Rate Comparison by By End User (2016-2032)
- Figure 100: Eastern Europe Solar Cable Market Market Share Comparison by Country (2016-2032)
- Figure 101: Eastern Europe Solar Cable Market Market Share Comparison by By Material (2016-2032)
- Figure 102: Eastern Europe Solar Cable Market Market Share Comparison by By Cable Type (2016-2032)
- Figure 103: Eastern Europe Solar Cable Market Market Share Comparison by By Application (2016-2032)
- Figure 104: Eastern Europe Solar Cable Market Market Share Comparison by By End User (2016-2032)
- Figure 105: APAC Solar Cable Market Revenue (US$ Mn) Market Share by By Materialin 2022
- Figure 106: APAC Solar Cable Market Market Attractiveness Analysis by By Material, 2016-2032
- Figure 107: APAC Solar Cable Market Revenue (US$ Mn) Market Share by By Cable Typein 2022
- Figure 108: APAC Solar Cable Market Market Attractiveness Analysis by By Cable Type, 2016-2032
- Figure 109: APAC Solar Cable Market Revenue (US$ Mn) Market Share by By Applicationin 2022
- Figure 110: APAC Solar Cable Market Market Attractiveness Analysis by By Application, 2016-2032
- Figure 111: APAC Solar Cable Market Revenue (US$ Mn) Market Share by By End Userin 2022
- Figure 112: APAC Solar Cable Market Market Attractiveness Analysis by By End User, 2016-2032
- Figure 113: APAC Solar Cable Market Revenue (US$ Mn) Market Share by Country in 2022
- Figure 114: APAC Solar Cable Market Market Attractiveness Analysis by Country, 2016-2032
- Figure 115: APAC Solar Cable Market Market Revenue (US$ Mn) (2016-2032)
- Figure 116: APAC Solar Cable Market Market Revenue (US$ Mn) Comparison by Country (2016-2032)
- Figure 117: APAC Solar Cable Market Market Revenue (US$ Mn) Comparison by By Material (2016-2032)
- Figure 118: APAC Solar Cable Market Market Revenue (US$ Mn) Comparison by By Cable Type (2016-2032)
- Figure 119: APAC Solar Cable Market Market Revenue (US$ Mn) Comparison by By Application (2016-2032)
- Figure 120: APAC Solar Cable Market Market Revenue (US$ Mn) Comparison by By End User (2016-2032)
- Figure 121: APAC Solar Cable Market Market Y-o-Y Growth Rate Comparison by Country (2016-2032)
- Figure 122: APAC Solar Cable Market Market Y-o-Y Growth Rate Comparison by By Material (2016-2032)
- Figure 123: APAC Solar Cable Market Market Y-o-Y Growth Rate Comparison by By Cable Type (2016-2032)
- Figure 124: APAC Solar Cable Market Market Y-o-Y Growth Rate Comparison by By Application (2016-2032)
- Figure 125: APAC Solar Cable Market Market Y-o-Y Growth Rate Comparison by By End User (2016-2032)
- Figure 126: APAC Solar Cable Market Market Share Comparison by Country (2016-2032)
- Figure 127: APAC Solar Cable Market Market Share Comparison by By Material (2016-2032)
- Figure 128: APAC Solar Cable Market Market Share Comparison by By Cable Type (2016-2032)
- Figure 129: APAC Solar Cable Market Market Share Comparison by By Application (2016-2032)
- Figure 130: APAC Solar Cable Market Market Share Comparison by By End User (2016-2032)
- Figure 131: Latin America Solar Cable Market Revenue (US$ Mn) Market Share by By Materialin 2022
- Figure 132: Latin America Solar Cable Market Market Attractiveness Analysis by By Material, 2016-2032
- Figure 133: Latin America Solar Cable Market Revenue (US$ Mn) Market Share by By Cable Typein 2022
- Figure 134: Latin America Solar Cable Market Market Attractiveness Analysis by By Cable Type, 2016-2032
- Figure 135: Latin America Solar Cable Market Revenue (US$ Mn) Market Share by By Applicationin 2022
- Figure 136: Latin America Solar Cable Market Market Attractiveness Analysis by By Application, 2016-2032
- Figure 137: Latin America Solar Cable Market Revenue (US$ Mn) Market Share by By End Userin 2022
- Figure 138: Latin America Solar Cable Market Market Attractiveness Analysis by By End User, 2016-2032
- Figure 139: Latin America Solar Cable Market Revenue (US$ Mn) Market Share by Country in 2022
- Figure 140: Latin America Solar Cable Market Market Attractiveness Analysis by Country, 2016-2032
- Figure 141: Latin America Solar Cable Market Market Revenue (US$ Mn) (2016-2032)
- Figure 142: Latin America Solar Cable Market Market Revenue (US$ Mn) Comparison by Country (2016-2032)
- Figure 143: Latin America Solar Cable Market Market Revenue (US$ Mn) Comparison by By Material (2016-2032)
- Figure 144: Latin America Solar Cable Market Market Revenue (US$ Mn) Comparison by By Cable Type (2016-2032)
- Figure 145: Latin America Solar Cable Market Market Revenue (US$ Mn) Comparison by By Application (2016-2032)
- Figure 146: Latin America Solar Cable Market Market Revenue (US$ Mn) Comparison by By End User (2016-2032)
- Figure 147: Latin America Solar Cable Market Market Y-o-Y Growth Rate Comparison by Country (2016-2032)
- Figure 148: Latin America Solar Cable Market Market Y-o-Y Growth Rate Comparison by By Material (2016-2032)
- Figure 149: Latin America Solar Cable Market Market Y-o-Y Growth Rate Comparison by By Cable Type (2016-2032)
- Figure 150: Latin America Solar Cable Market Market Y-o-Y Growth Rate Comparison by By Application (2016-2032)
- Figure 151: Latin America Solar Cable Market Market Y-o-Y Growth Rate Comparison by By End User (2016-2032)
- Figure 152: Latin America Solar Cable Market Market Share Comparison by Country (2016-2032)
- Figure 153: Latin America Solar Cable Market Market Share Comparison by By Material (2016-2032)
- Figure 154: Latin America Solar Cable Market Market Share Comparison by By Cable Type (2016-2032)
- Figure 155: Latin America Solar Cable Market Market Share Comparison by By Application (2016-2032)
- Figure 156: Latin America Solar Cable Market Market Share Comparison by By End User (2016-2032)
- Figure 157: Middle East & Africa Solar Cable Market Revenue (US$ Mn) Market Share by By Materialin 2022
- Figure 158: Middle East & Africa Solar Cable Market Market Attractiveness Analysis by By Material, 2016-2032
- Figure 159: Middle East & Africa Solar Cable Market Revenue (US$ Mn) Market Share by By Cable Typein 2022
- Figure 160: Middle East & Africa Solar Cable Market Market Attractiveness Analysis by By Cable Type, 2016-2032
- Figure 161: Middle East & Africa Solar Cable Market Revenue (US$ Mn) Market Share by By Applicationin 2022
- Figure 162: Middle East & Africa Solar Cable Market Market Attractiveness Analysis by By Application, 2016-2032
- Figure 163: Middle East & Africa Solar Cable Market Revenue (US$ Mn) Market Share by By End Userin 2022
- Figure 164: Middle East & Africa Solar Cable Market Market Attractiveness Analysis by By End User, 2016-2032
- Figure 165: Middle East & Africa Solar Cable Market Revenue (US$ Mn) Market Share by Country in 2022
- Figure 166: Middle East & Africa Solar Cable Market Market Attractiveness Analysis by Country, 2016-2032
- Figure 167: Middle East & Africa Solar Cable Market Market Revenue (US$ Mn) (2016-2032)
- Figure 168: Middle East & Africa Solar Cable Market Market Revenue (US$ Mn) Comparison by Country (2016-2032)
- Figure 169: Middle East & Africa Solar Cable Market Market Revenue (US$ Mn) Comparison by By Material (2016-2032)
- Figure 170: Middle East & Africa Solar Cable Market Market Revenue (US$ Mn) Comparison by By Cable Type (2016-2032)
- Figure 171: Middle East & Africa Solar Cable Market Market Revenue (US$ Mn) Comparison by By Application (2016-2032)
- Figure 172: Middle East & Africa Solar Cable Market Market Revenue (US$ Mn) Comparison by By End User (2016-2032)
- Figure 173: Middle East & Africa Solar Cable Market Market Y-o-Y Growth Rate Comparison by Country (2016-2032)
- Figure 174: Middle East & Africa Solar Cable Market Market Y-o-Y Growth Rate Comparison by By Material (2016-2032)
- Figure 175: Middle East & Africa Solar Cable Market Market Y-o-Y Growth Rate Comparison by By Cable Type (2016-2032)
- Figure 176: Middle East & Africa Solar Cable Market Market Y-o-Y Growth Rate Comparison by By Application (2016-2032)
- Figure 177: Middle East & Africa Solar Cable Market Market Y-o-Y Growth Rate Comparison by By End User (2016-2032)
- Figure 178: Middle East & Africa Solar Cable Market Market Share Comparison by Country (2016-2032)
- Figure 179: Middle East & Africa Solar Cable Market Market Share Comparison by By Material (2016-2032)
- Figure 180: Middle East & Africa Solar Cable Market Market Share Comparison by By Cable Type (2016-2032)
- Figure 181: Middle East & Africa Solar Cable Market Market Share Comparison by By Application (2016-2032)
- Figure 182: Middle East & Africa Solar Cable Market Market Share Comparison by By End User (2016-2032)
"
- List of Tables
- "
- Table 1: Global Solar Cable Market Market Comparison by By Material (2016-2032)
- Table 2: Global Solar Cable Market Market Comparison by By Cable Type (2016-2032)
- Table 3: Global Solar Cable Market Market Comparison by By Application (2016-2032)
- Table 4: Global Solar Cable Market Market Comparison by By End User (2016-2032)
- Table 5: Global Solar Cable Market Revenue (US$ Mn) Comparison by Region (2016-2032)
- Table 6: Global Solar Cable Market Market Revenue (US$ Mn) (2016-2032)
- Table 7: Global Solar Cable Market Market Revenue (US$ Mn) Comparison by Region (2016-2032)
- Table 8: Global Solar Cable Market Market Revenue (US$ Mn) Comparison by By Material (2016-2032)
- Table 9: Global Solar Cable Market Market Revenue (US$ Mn) Comparison by By Cable Type (2016-2032)
- Table 10: Global Solar Cable Market Market Revenue (US$ Mn) Comparison by By Application (2016-2032)
- Table 11: Global Solar Cable Market Market Revenue (US$ Mn) Comparison by By End User (2016-2032)
- Table 12: Global Solar Cable Market Market Y-o-Y Growth Rate Comparison by Region (2016-2032)
- Table 13: Global Solar Cable Market Market Y-o-Y Growth Rate Comparison by By Material (2016-2032)
- Table 14: Global Solar Cable Market Market Y-o-Y Growth Rate Comparison by By Cable Type (2016-2032)
- Table 15: Global Solar Cable Market Market Y-o-Y Growth Rate Comparison by By Application (2016-2032)
- Table 16: Global Solar Cable Market Market Y-o-Y Growth Rate Comparison by By End User (2016-2032)
- Table 17: Global Solar Cable Market Market Share Comparison by Region (2016-2032)
- Table 18: Global Solar Cable Market Market Share Comparison by By Material (2016-2032)
- Table 19: Global Solar Cable Market Market Share Comparison by By Cable Type (2016-2032)
- Table 20: Global Solar Cable Market Market Share Comparison by By Application (2016-2032)
- Table 21: Global Solar Cable Market Market Share Comparison by By End User (2016-2032)
- Table 22: North America Solar Cable Market Market Comparison by By Cable Type (2016-2032)
- Table 23: North America Solar Cable Market Market Comparison by By Application (2016-2032)
- Table 24: North America Solar Cable Market Market Comparison by By End User (2016-2032)
- Table 25: North America Solar Cable Market Revenue (US$ Mn) Comparison by Country (2016-2032)
- Table 26: North America Solar Cable Market Market Revenue (US$ Mn) (2016-2032)
- Table 27: North America Solar Cable Market Market Revenue (US$ Mn) Comparison by Country (2016-2032)
- Table 28: North America Solar Cable Market Market Revenue (US$ Mn) Comparison by By Material (2016-2032)
- Table 29: North America Solar Cable Market Market Revenue (US$ Mn) Comparison by By Cable Type (2016-2032)
- Table 30: North America Solar Cable Market Market Revenue (US$ Mn) Comparison by By Application (2016-2032)
- Table 31: North America Solar Cable Market Market Revenue (US$ Mn) Comparison by By End User (2016-2032)
- Table 32: North America Solar Cable Market Market Y-o-Y Growth Rate Comparison by Country (2016-2032)
- Table 33: North America Solar Cable Market Market Y-o-Y Growth Rate Comparison by By Material (2016-2032)
- Table 34: North America Solar Cable Market Market Y-o-Y Growth Rate Comparison by By Cable Type (2016-2032)
- Table 35: North America Solar Cable Market Market Y-o-Y Growth Rate Comparison by By Application (2016-2032)
- Table 36: North America Solar Cable Market Market Y-o-Y Growth Rate Comparison by By End User (2016-2032)
- Table 37: North America Solar Cable Market Market Share Comparison by Country (2016-2032)
- Table 38: North America Solar Cable Market Market Share Comparison by By Material (2016-2032)
- Table 39: North America Solar Cable Market Market Share Comparison by By Cable Type (2016-2032)
- Table 40: North America Solar Cable Market Market Share Comparison by By Application (2016-2032)
- Table 41: North America Solar Cable Market Market Share Comparison by By End User (2016-2032)
- Table 42: Western Europe Solar Cable Market Market Comparison by By Material (2016-2032)
- Table 43: Western Europe Solar Cable Market Market Comparison by By Cable Type (2016-2032)
- Table 44: Western Europe Solar Cable Market Market Comparison by By Application (2016-2032)
- Table 45: Western Europe Solar Cable Market Market Comparison by By End User (2016-2032)
- Table 46: Western Europe Solar Cable Market Revenue (US$ Mn) Comparison by Country (2016-2032)
- Table 47: Western Europe Solar Cable Market Market Revenue (US$ Mn) (2016-2032)
- Table 48: Western Europe Solar Cable Market Market Revenue (US$ Mn) Comparison by Country (2016-2032)
- Table 49: Western Europe Solar Cable Market Market Revenue (US$ Mn) Comparison by By Material (2016-2032)
- Table 50: Western Europe Solar Cable Market Market Revenue (US$ Mn) Comparison by By Cable Type (2016-2032)
- Table 51: Western Europe Solar Cable Market Market Revenue (US$ Mn) Comparison by By Application (2016-2032)
- Table 52: Western Europe Solar Cable Market Market Revenue (US$ Mn) Comparison by By End User (2016-2032)
- Table 53: Western Europe Solar Cable Market Market Y-o-Y Growth Rate Comparison by Country (2016-2032)
- Table 54: Western Europe Solar Cable Market Market Y-o-Y Growth Rate Comparison by By Material (2016-2032)
- Table 55: Western Europe Solar Cable Market Market Y-o-Y Growth Rate Comparison by By Cable Type (2016-2032)
- Table 56: Western Europe Solar Cable Market Market Y-o-Y Growth Rate Comparison by By Application (2016-2032)
- Table 57: Western Europe Solar Cable Market Market Y-o-Y Growth Rate Comparison by By End User (2016-2032)
- Table 58: Western Europe Solar Cable Market Market Share Comparison by Country (2016-2032)
- Table 59: Western Europe Solar Cable Market Market Share Comparison by By Material (2016-2032)
- Table 60: Western Europe Solar Cable Market Market Share Comparison by By Cable Type (2016-2032)
- Table 61: Western Europe Solar Cable Market Market Share Comparison by By Application (2016-2032)
- Table 62: Western Europe Solar Cable Market Market Share Comparison by By End User (2016-2032)
- Table 63: Eastern Europe Solar Cable Market Market Comparison by By Material (2016-2032)
- Table 64: Eastern Europe Solar Cable Market Market Comparison by By Cable Type (2016-2032)
- Table 65: Eastern Europe Solar Cable Market Market Comparison by By Application (2016-2032)
- Table 66: Eastern Europe Solar Cable Market Market Comparison by By End User (2016-2032)
- Table 67: Eastern Europe Solar Cable Market Revenue (US$ Mn) Comparison by Country (2016-2032)
- Table 68: Eastern Europe Solar Cable Market Market Revenue (US$ Mn) (2016-2032)
- Table 69: Eastern Europe Solar Cable Market Market Revenue (US$ Mn) Comparison by Country (2016-2032)
- Table 70: Eastern Europe Solar Cable Market Market Revenue (US$ Mn) Comparison by By Material (2016-2032)
- Table 71: Eastern Europe Solar Cable Market Market Revenue (US$ Mn) Comparison by By Cable Type (2016-2032)
- Table 72: Eastern Europe Solar Cable Market Market Revenue (US$ Mn) Comparison by By Application (2016-2032)
- Table 73: Eastern Europe Solar Cable Market Market Revenue (US$ Mn) Comparison by By End User (2016-2032)
- Table 74: Eastern Europe Solar Cable Market Market Y-o-Y Growth Rate Comparison by Country (2016-2032)
- Table 75: Eastern Europe Solar Cable Market Market Y-o-Y Growth Rate Comparison by By Material (2016-2032)
- Table 76: Eastern Europe Solar Cable Market Market Y-o-Y Growth Rate Comparison by By Cable Type (2016-2032)
- Table 77: Eastern Europe Solar Cable Market Market Y-o-Y Growth Rate Comparison by By Application (2016-2032)
- Table 78: Eastern Europe Solar Cable Market Market Y-o-Y Growth Rate Comparison by By End User (2016-2032)
- Table 79: Eastern Europe Solar Cable Market Market Share Comparison by Country (2016-2032)
- Table 80: Eastern Europe Solar Cable Market Market Share Comparison by By Material (2016-2032)
- Table 81: Eastern Europe Solar Cable Market Market Share Comparison by By Cable Type (2016-2032)
- Table 82: Eastern Europe Solar Cable Market Market Share Comparison by By Application (2016-2032)
- Table 83: Eastern Europe Solar Cable Market Market Share Comparison by By End User (2016-2032)
- Table 84: APAC Solar Cable Market Market Comparison by By Material (2016-2032)
- Table 85: APAC Solar Cable Market Market Comparison by By Cable Type (2016-2032)
- Table 86: APAC Solar Cable Market Market Comparison by By Application (2016-2032)
- Table 87: APAC Solar Cable Market Market Comparison by By End User (2016-2032)
- Table 88: APAC Solar Cable Market Revenue (US$ Mn) Comparison by Country (2016-2032)
- Table 89: APAC Solar Cable Market Market Revenue (US$ Mn) (2016-2032)
- Table 90: APAC Solar Cable Market Market Revenue (US$ Mn) Comparison by Country (2016-2032)
- Table 91: APAC Solar Cable Market Market Revenue (US$ Mn) Comparison by By Material (2016-2032)
- Table 92: APAC Solar Cable Market Market Revenue (US$ Mn) Comparison by By Cable Type (2016-2032)
- Table 93: APAC Solar Cable Market Market Revenue (US$ Mn) Comparison by By Application (2016-2032)
- Table 94: APAC Solar Cable Market Market Revenue (US$ Mn) Comparison by By End User (2016-2032)
- Table 95: APAC Solar Cable Market Market Y-o-Y Growth Rate Comparison by Country (2016-2032)
- Table 96: APAC Solar Cable Market Market Y-o-Y Growth Rate Comparison by By Material (2016-2032)
- Table 97: APAC Solar Cable Market Market Y-o-Y Growth Rate Comparison by By Cable Type (2016-2032)
- Table 98: APAC Solar Cable Market Market Y-o-Y Growth Rate Comparison by By Application (2016-2032)
- Table 99: APAC Solar Cable Market Market Y-o-Y Growth Rate Comparison by By End User (2016-2032)
- Table 100: APAC Solar Cable Market Market Share Comparison by Country (2016-2032)
- Table 101: APAC Solar Cable Market Market Share Comparison by By Material (2016-2032)
- Table 102: APAC Solar Cable Market Market Share Comparison by By Cable Type (2016-2032)
- Table 103: APAC Solar Cable Market Market Share Comparison by By Application (2016-2032)
- Table 104: APAC Solar Cable Market Market Share Comparison by By End User (2016-2032)
- Table 105: Latin America Solar Cable Market Market Comparison by By Material (2016-2032)
- Table 106: Latin America Solar Cable Market Market Comparison by By Cable Type (2016-2032)
- Table 107: Latin America Solar Cable Market Market Comparison by By Application (2016-2032)
- Table 108: Latin America Solar Cable Market Market Comparison by By End User (2016-2032)
- Table 109: Latin America Solar Cable Market Revenue (US$ Mn) Comparison by Country (2016-2032)
- Table 110: Latin America Solar Cable Market Market Revenue (US$ Mn) (2016-2032)
- Table 111: Latin America Solar Cable Market Market Revenue (US$ Mn) Comparison by Country (2016-2032)
- Table 112: Latin America Solar Cable Market Market Revenue (US$ Mn) Comparison by By Material (2016-2032)
- Table 113: Latin America Solar Cable Market Market Revenue (US$ Mn) Comparison by By Cable Type (2016-2032)
- Table 114: Latin America Solar Cable Market Market Revenue (US$ Mn) Comparison by By Application (2016-2032)
- Table 115: Latin America Solar Cable Market Market Revenue (US$ Mn) Comparison by By End User (2016-2032)
- Table 116: Latin America Solar Cable Market Market Y-o-Y Growth Rate Comparison by Country (2016-2032)
- Table 117: Latin America Solar Cable Market Market Y-o-Y Growth Rate Comparison by By Material (2016-2032)
- Table 118: Latin America Solar Cable Market Market Y-o-Y Growth Rate Comparison by By Cable Type (2016-2032)
- Table 119: Latin America Solar Cable Market Market Y-o-Y Growth Rate Comparison by By Application (2016-2032)
- Table 120: Latin America Solar Cable Market Market Y-o-Y Growth Rate Comparison by By End User (2016-2032)
- Table 121: Latin America Solar Cable Market Market Share Comparison by Country (2016-2032)
- Table 122: Latin America Solar Cable Market Market Share Comparison by By Material (2016-2032)
- Table 123: Latin America Solar Cable Market Market Share Comparison by By Cable Type (2016-2032)
- Table 124: Latin America Solar Cable Market Market Share Comparison by By Application (2016-2032)
- Table 125: Latin America Solar Cable Market Market Share Comparison by By End User (2016-2032)
- Table 126: Middle East & Africa Solar Cable Market Market Comparison by By Material (2016-2032)
- Table 127: Middle East & Africa Solar Cable Market Market Comparison by By Cable Type (2016-2032)
- Table 128: Middle East & Africa Solar Cable Market Market Comparison by By Application (2016-2032)
- Table 129: Middle East & Africa Solar Cable Market Market Comparison by By End User (2016-2032)
- Table 130: Middle East & Africa Solar Cable Market Revenue (US$ Mn) Comparison by Country (2016-2032)
- Table 131: Middle East & Africa Solar Cable Market Market Revenue (US$ Mn) (2016-2032)
- Table 132: Middle East & Africa Solar Cable Market Market Revenue (US$ Mn) Comparison by Country (2016-2032)
- Table 133: Middle East & Africa Solar Cable Market Market Revenue (US$ Mn) Comparison by By Material (2016-2032)
- Table 134: Middle East & Africa Solar Cable Market Market Revenue (US$ Mn) Comparison by By Cable Type (2016-2032)
- Table 135: Middle East & Africa Solar Cable Market Market Revenue (US$ Mn) Comparison by By Application (2016-2032)
- Table 136: Middle East & Africa Solar Cable Market Market Revenue (US$ Mn) Comparison by By End User (2016-2032)
- Table 137: Middle East & Africa Solar Cable Market Market Y-o-Y Growth Rate Comparison by Country (2016-2032)
- Table 138: Middle East & Africa Solar Cable Market Market Y-o-Y Growth Rate Comparison by By Material (2016-2032)
- Table 139: Middle East & Africa Solar Cable Market Market Y-o-Y Growth Rate Comparison by By Cable Type (2016-2032)
- Table 140: Middle East & Africa Solar Cable Market Market Y-o-Y Growth Rate Comparison by By Application (2016-2032)
- Table 141: Middle East & Africa Solar Cable Market Market Y-o-Y Growth Rate Comparison by By End User (2016-2032)
- Table 142: Middle East & Africa Solar Cable Market Market Share Comparison by Country (2016-2032)
- Table 143: Middle East & Africa Solar Cable Market Market Share Comparison by By Material (2016-2032)
- Table 144: Middle East & Africa Solar Cable Market Market Share Comparison by By Cable Type (2016-2032)
- Table 145: Middle East & Africa Solar Cable Market Market Share Comparison by By Application (2016-2032)
- Table 146: Middle East & Africa Solar Cable Market Market Share Comparison by By End User (2016-2032)
- 1. Executive Summary
-
- General Cable Corporation
- Atkore International Group Inc.
- Huber Suhner AG
- Prysmian Group
- Allied Wire & Cable
- Lumberg Connect GmbH
- ReneSola Ltd
- Ram Ratna Wires Ltd.
- Ningbo Pntech New Energy Co., Ltd
- Taiyo Cable Tech Co. Ltd.
- Lapp Group, Eldra B.V
- KBE Elektrotechnik GmbH
- Phoenix Contact GmbH Co. KG
- Havells
Our Clients


View Our Licence Options
