
Simulation Software Market Deployment Mode( On-Premise, Cloud), Component (Software, Services), Application (Engineering, Research, Modeling & Simulated Testing, Gaming & Immersive Experiences, and Other), End-Use Industry (Automotive, Electronics & Semiconductor and Other End-Use Industries), By Region And Companies - Industry Segment Outlook, Market Assessment, Competition Scenario, Trends, And Forecast 2024-2033
-
51371
-
Sept 2024
-
305
-


-
This report was compiled by Vishwa Gaul Vishwa is an experienced market research and consulting professional with over 8 years of expertise in the ICT industry, contributing to over 700 reports across telecommunications, software, hardware, and digital solutions. Correspondence Team Lead- ICT Linkedin | Detailed Market research Methodology Our methodology involves a mix of primary research, including interviews with leading mental health experts, and secondary research from reputable medical journals and databases. View Detailed Methodology Page
-
Quick Navigation
Report Overview
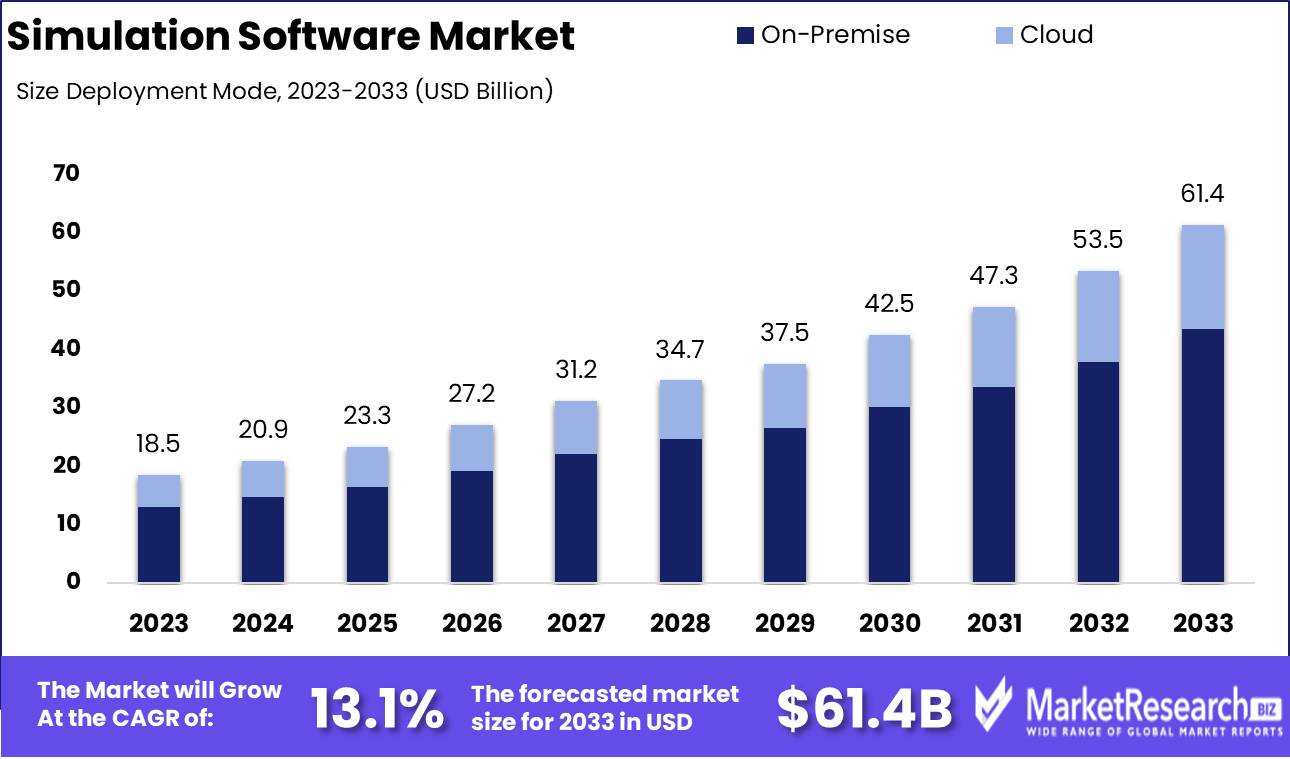
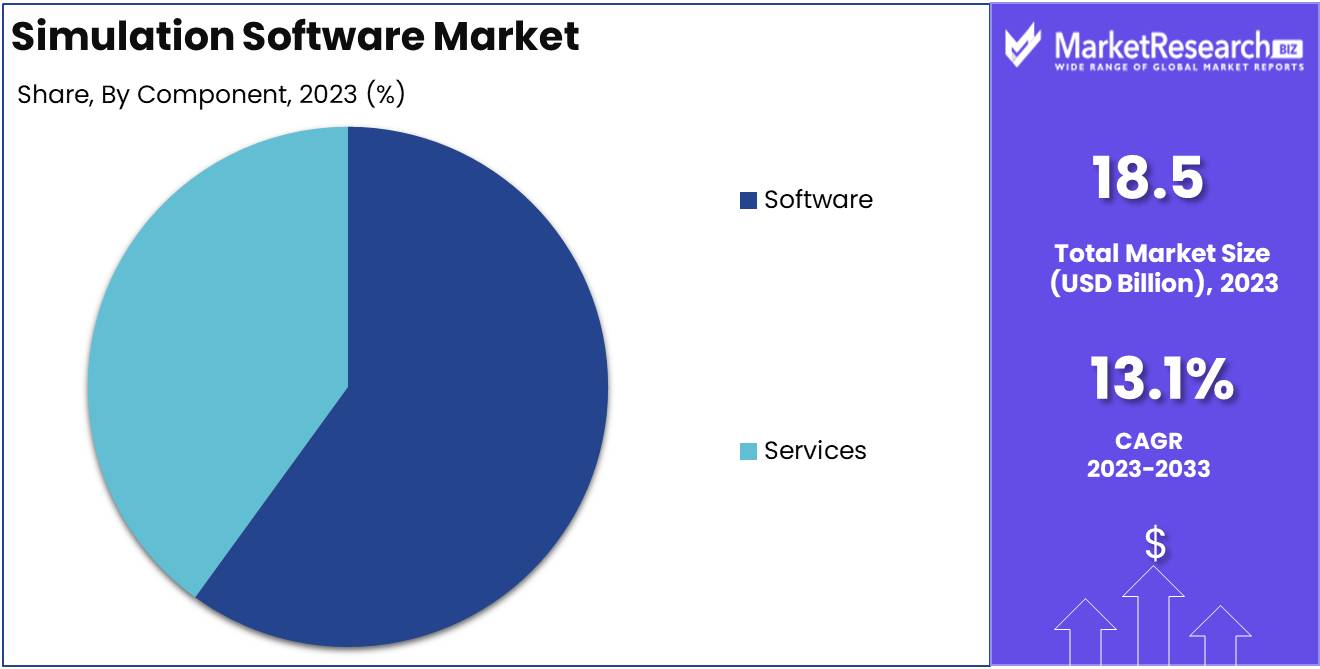
The Simulation Software Market was valued at USD 18.5 billion in 2023. It is expected to reach USD 61.4 billion by 2033, with a Compound annual growth rate (CAGR) of 13.1% during the forecast period from 2024 to 2033.
The Simulation Software Market encompasses a range of advanced digital tools designed to model and analyze complex systems and processes across various industries. These software solutions facilitate predictive analysis, allowing businesses to test scenarios and make data-driven decisions without the risks associated with real-world execution. Key applications include product development, process optimization, and training enhancements. As industries strive for increased efficiency and reduced costs, the demand for simulation software is growing, supported by its ability to integrate with emerging technologies such as AI and IoT, thereby expanding its impact on sectors like manufacturing, automotive, healthcare, and aerospace.
The simulation software market is experiencing significant growth, driven by advancements in key technologies such as artificial intelligence (AI), machine learning, and cloud computing, alongside increasing adoption across various industries. As companies seek to enhance operational efficiency, reduce costs, and accelerate product development cycles, simulation software is becoming integral to their digital transformation strategies. One key factor driving demand is the growing role of Industry 4.0, where simulation tools enable the creation of digital twins virtual replicas of physical systems that allow organizations to model, predict, and optimize performance in real time.
This shift toward digitalization is further accelerated by cloud-based solutions, which offer scalable and flexible deployment options for businesses of all sizes. For instance, the collaboration between SimScale GmbH and KKE to expand their customer base in Asia exemplifies how leading simulation software providers are leveraging partnerships to tap into new markets, particularly in regions undergoing rapid industrialization and digital transformation.
Additionally, strategic investments by global corporations are propelling innovation in the simulation software space. For example, BMW i Ventures' investment in Ascon Systems highlights the growing importance of simulation technology in shaping the future of the industrial metaverse. Ascon's digital twin and low-code solutions aim to enhance flexibility and efficiency in automotive production, further underscoring the role of simulation software in driving digital shopfloor management.
Similarly, Accenture's strategic investment in Cosmo Tech demonstrates the increasing relevance of simulation in optimizing business scenarios for profitability and sustainability. This partnership is designed to give clients greater access to advanced simulation tools, further embedding simulation technology into core business processes. As industries increasingly prioritize resilience, efficiency, and innovation in the face of global competition and market volatility, the simulation software market is well-positioned to grow, becoming a critical component of digital transformation efforts worldwide. This trend aligns with broader shifts toward smart manufacturing, predictive analytics, and real-time decision-making capabilities across various sectors.
Key Takeaways
- Market Growth: The simulation software market Size is projected to grow from USD 18.5 billion in 2023 to USD 61.4 billion by 2033, at a robust CAGR of 13.1%, driven by advancements in AI, cloud computing, and increasing adoption across industries like automotive, aerospace, and healthcare.
- Deployment Mode: The on-premise segment held a dominant market share of 71.4% in 2023, driven by industries prioritizing data security and privacy.
- Component: The software segment captured 70.3% of the market in 2023, fueled by growing demand across industries for advanced simulation solutions.
- Application: Engineering, research, modeling & simulated testing led with a 37.6% market share in 2023, as industries focus on optimizing product development and reducing costs.
- End-Use Industry: The automotive industry dominated with 31% market share in 2023, driven by the sector's reliance on simulation tools for vehicle design, safety, and electrification efforts.
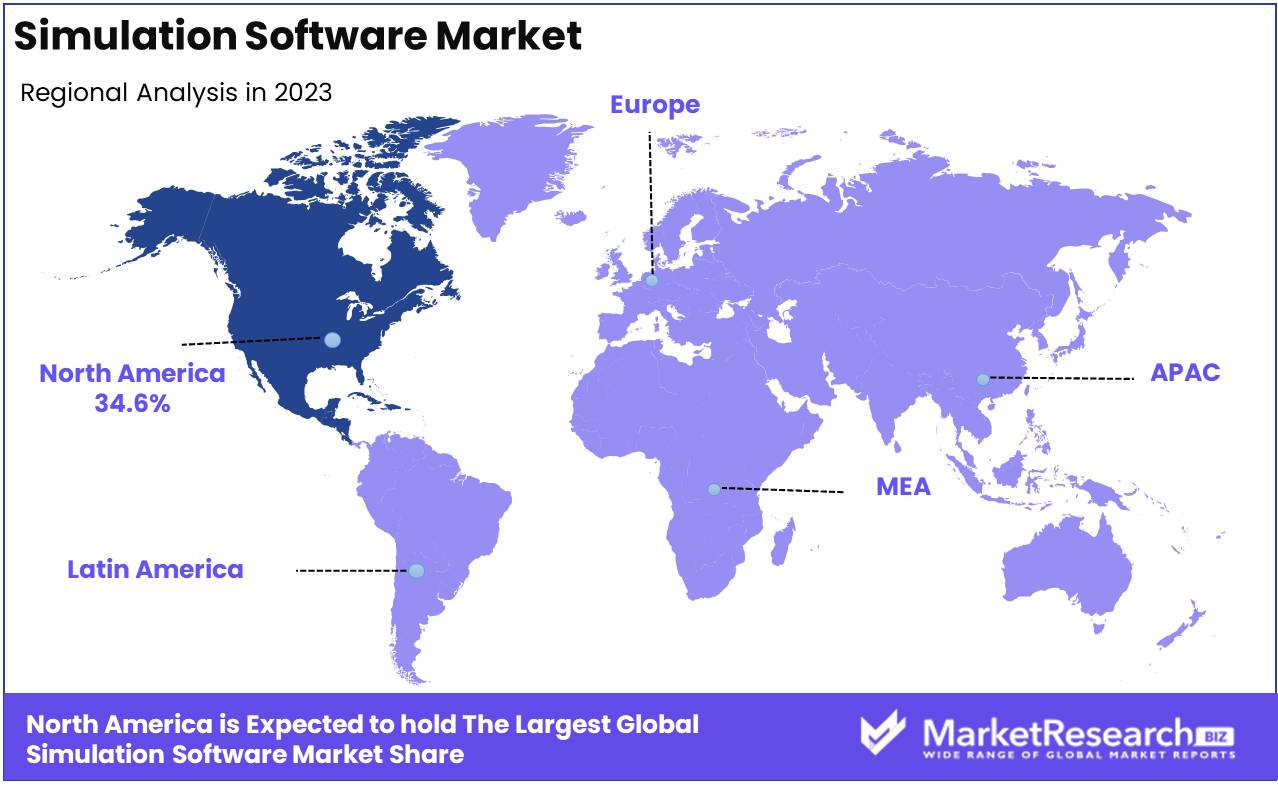
- Regional Dominance: North America led the market with 34.6% share in 2023, propelled by strong adoption in aerospace, automotive, and defense industries.
- Growth Opportunity/Driver: The rise of AI and machine learning technologies is creating opportunities for more accurate and scalable simulation solutions, enhancing decision-making and operational efficiency.
- Restraint Factor: Data security and privacy concerns, particularly in regulated industries, remain a major restraint, impacting adoption rates across sectors.
Driving Factors
Industry 4.0 and Digital Transformation
A major driver of the Simulation Software Market is the integration of Industry 4.0 and digital transformation initiatives across various industries. As companies increasingly adopt smart technologies and the Internet of Things (IoT), the demand for simulation software rises significantly. These tools are essential for designing, optimizing, and deploying new technologies, enabling businesses to test and refine processes without the high costs of physical prototypes.
A key study reveals that 70% of companies undergoing digital transformation rely on simulation software to enhance decision-making. The convergence of Industry 4.0 technologies with simulation capabilities is not only a major factor in market expansion but also leads to innovative applications beyond traditional manufacturing, such as smart cities and digital healthcare. This broadens the market’s scope and creates new revenue streams.
Growing Need for Risk Management and Cost Efficiency
The increasing focus on risk management and cost efficiency represents another major factor fueling the growth of the Simulation Software Market. In a dynamic economic environment, businesses are driven to mitigate risks related to operational changes and market volatility. Simulation software is a critical tool for addressing these challenges, allowing organizations to model different scenarios and predict potential outcomes without incurring the financial risks of real-world testing.
This capability is particularly valuable in industries like aerospace, automotive, and construction, where early error detection and system optimizations can result in significant cost savings. Recent reports indicate that firms using simulation tools can potentially reduce time-to-market by 50%, underscoring its role as a major driver of efficiency. The growing emphasis on cost optimization and advanced data utilization, aligned with Industry 4.0 objectives, further amplifies the impact of simulation software on market growth.
Restraining Factors
Data Security and Privacy Concerns
Data security and privacy concerns significantly restrain the growth of the simulation software market. As simulation software often handles sensitive information, including proprietary business data and personal identifiers, the risk of data breaches and unauthorized access can deter potential users. For instance, industries such as healthcare, aerospace, and defense, where data sensitivity is paramount, are particularly cautious. The hesitation stems from the potential consequences of data compromise, which can include substantial financial penalties, loss of customer trust, and regulatory non-compliance.
The restraining impact of data security concerns is magnified by the increasing stringency of global data protection regulations like GDPR in Europe and CCPA in California, which mandate rigorous data handling practices. Companies must invest in enhanced security measures, which can increase the cost and complexity of deploying simulation software. This requirement often leads to longer sales cycles as businesses weigh the risks and benefits. Moreover, these concerns intersect with the broader technological landscape, where cybersecurity threats are evolving rapidly, thereby necessitating continuous updates and improvements in security protocols within simulation software.
Complexity and Time Consumption
The inherent complexity and time consumption associated with setting up and running advanced simulation software can also pose significant barriers to market growth. This complexity often requires users to possess specialized knowledge or undergo extensive training, which can be a deterrent for smaller organizations or those with limited technical expertise. Additionally, the time-intensive nature of detailed simulations can delay decision-making processes, which is a critical drawback in fast-paced industries.
This factor ties closely with the ongoing need for simplified user interfaces and more intuitive user experiences. As companies seek to democratize access to simulation tools, the demand for more user-friendly solutions grows. This need for simplicity and efficiency drives innovation in the market, pushing developers to create more streamlined and automated solutions that reduce the learning curve and operational delays. The complexity and time consumption of simulation software not only slow down adoption but also encourage the development of integrated solutions that connect simulation with real-time data analytics and AI to enhance predictive capabilities and reduce time to insight.
By Deployment Mode Analysis
On-premise Segment Dominates Simulation Software Market with 71.4% Largest Share in 2023
n 2023, On-premise deployment mode in the Simulation Software Market held a commanding market share, capturing more than 71.4% of the segment. This dominance is driven by the preference for on-premise systems in industries where control over security and data privacy is paramount. On-premise solutions offer organizations the ability to manage sensitive simulations and data internally, without the potential vulnerabilities associated with cloud-based data hosting. This mode is particularly preferred in sectors such as defense, aerospace, and healthcare, where compliance with strict regulatory standards is critical. Despite the scalability and cost-effectiveness of cloud solutions, the demand for on-premise deployment remains robust due to its inherent advantages in security and data control.
While the cloud-based deployment mode holds a smaller portion of the market, it is rapidly growing due to its scalability, lower upfront costs, and the ability to access advanced simulation tools remotely. As technology advances and security measures in cloud environments strengthen, a shift towards cloud deployment is expected to accelerate, particularly among small to medium-sized enterprises seeking cost-effective and flexible simulation solutions.
By Component Analysis
Software Segment Dominates Simulation Software Market with 70.3% Largest Share in 2023
In 2023, Software held a dominant market position within the Component segment of the Simulation Software Market, capturing more than 70.3% of the total market share. This robust performance can be attributed to the growing demand for advanced simulation solutions across a variety of industries, including automotive, aerospace, healthcare, and manufacturing. The continuous advancements in AI, machine learning, and cloud-based technologies have further fueled the adoption of sophisticated software platforms, enabling businesses to enhance product development, optimize processes, and reduce operational costs.
By contrast, the Services segment accounted for a smaller, yet significant, portion of the market. The increasing complexity of software solutions and the need for ongoing maintenance, customization, and integration services has driven steady growth in this segment. As organizations across sectors seek to leverage simulation software effectively, demand for consultancy, training, and support services continues to rise. Despite its smaller share relative to software, the services segment is expected to witness incremental growth in the coming years as enterprises prioritize tailored solutions and operational efficiency.
Overall, the simulation software market's component breakdown underscores a heavy reliance on software platforms, with services playing a crucial supporting role in maximizing the value of these tools for end-users. The combined strength of these segments is expected to drive continued market expansion and innovation over the next decade.
By Application Analysis
Engineering, Research, Modeling & Simulated Testing Leads Simulation Software Market Application Segment with 37.6% Share in 2023
In 2023, Engineering, Research, Modeling & Simulated Testing held a dominant market position within the Application segment of the Simulation Software Market, capturing more than 37.6% of the total market share. This leadership is driven by the increasing reliance on simulation software for product design, development, and testing across industries such as automotive, aerospace, and electronics. Companies are utilizing advanced modeling and simulation tools to optimize product performance, reduce prototyping costs, and accelerate time-to-market, contributing to the sustained growth of this application.
The Gaming & Immersive Experiences segment also accounted for a significant portion of the market, as advancements in virtual reality (VR) and augmented reality (AR) technologies fuel demand for highly realistic simulations. These applications are increasingly employed in entertainment, education, and training, offering users interactive and engaging experiences that simulate real-world environments.
Another critical area of growth is High-Fidelity Experiential 3D Training, where organizations in sectors like defense, healthcare, and aviation use 3D simulations for hands-on training in safe, controlled environments. This segment continues to grow as industries recognize the value of experiential learning in high-stakes scenarios.
Manufacturing Process Optimization is another key application, with companies leveraging simulation software to streamline production workflows, enhance efficiency, and reduce operational costs. As industries move toward Industry 4.0, demand for simulation tools in smart manufacturing will likely increase.
The Cyber Simulation segment is expanding as cybersecurity becomes a top priority for businesses. Simulation software is increasingly used to model potential cyber threats and vulnerabilities, allowing companies to strengthen their defenses through scenario-based training and testing.
Lastly, the Other applications category, encompassing areas such as energy management and environmental simulations, continues to grow steadily, driven by increased focus on sustainability and resource efficiency.
By End-Use Industry Analysis
Automotive Segment Dominates Simulation Software Market End-Use Industry with 31% Largest Market Share in 2023
In 2023, Automotive held a dominant market position within the End-Use Industry segment of the Simulation Software Market, capturing more than 31% of the total market share. The automotive sector’s extensive use of simulation software for vehicle design, crash testing, aerodynamics, and electric vehicle (EV) development has been a key driver of this dominance. With the rise of autonomous vehicles and the shift towards electrification, automakers increasingly rely on simulation tools to accelerate innovation, enhance safety features, and reduce physical prototyping costs, contributing to the sector’s leading market share.
The Electronics & Semiconductor industry also represented a significant portion of the market, driven by the demand for precision in the design and manufacturing of semiconductors and consumer electronics. Simulation software is critical for improving the efficiency and reliability of electronic components, especially as devices become more complex and miniaturized.
The Aerospace & Defense sector continues to be a major user of simulation software, particularly for flight simulation, mission training, and the design of next-generation aircraft and defense systems. As defense budgets rise and the aerospace industry prioritizes safety and efficiency, the demand for advanced simulation tools is expected to grow.
Healthcare is another emerging sector for simulation software, where it is used for medical device testing, surgical simulation, and personalized healthcare solutions. The growing focus on patient safety, innovation in medical devices, and the adoption of virtual training programs are pushing the healthcare industry to increase its investment in simulation technologies.
The Transportation & Logistics segment is also gaining traction, utilizing simulation tools to optimize supply chains, improve fleet management, and enhance urban transportation systems. As global trade and urbanization expand, companies are adopting simulation to model and manage complex logistical networks efficiently.
Finally, the Other End-Use Industries category, encompassing sectors like energy, education, and consumer goods, continues to see steady growth as the versatility of simulation software finds new applications across diverse markets.
Overall, the dominance of the Automotive industry reflects its central role in driving the adoption of simulation technologies, with other industries contributing to the broader expansion and diversification of the simulation software market.
Key Market Segments
Deployment Mode
- On-Premise
- Cloud
Component
- Software
- Services
Application
- Engineering, Research, Modeling & Simulated Testing
- Gaming & Immersive Experiences
- High-Fidelity Experiential 3D Training
- Manufacturing Process Optimization
- Cyber Simulation
- Other
End-Use Industry
- Automotive
- Electronics & Semiconductor
- Aerospace & Defense
- Healthcare
- Transportation & Logistics
- Other End-Use Industries
Growth Opportunity
Advancements in AI and Machine Learning
AI and machine learning (ML) are revolutionizing simulation software by enabling more accurate, predictive, and real-time analytics. These technologies enhance the ability of simulation software to model complex systems, such as fluid dynamics or manufacturing processes, with greater precision and scalability. For instance, AI-driven algorithms can optimize simulation scenarios, reducing the time and computational power required, while also allowing for continuous learning and improvement. As industries like aerospace, automotive, and healthcare increasingly adopt AI-enhanced simulation tools, the demand for more sophisticated software solutions is expected to surge.
Rise of Autonomous Systems and Electric Vehicles
The rapid development of autonomous systems and the growing EV market are creating substantial growth opportunities. Both sectors rely heavily on simulation software to model real-world scenarios, test algorithms, and optimize system performance without the need for extensive physical testing. In the automotive sector, manufacturers are leveraging simulation software to refine autonomous driving systems and design more efficient EV batteries. This reliance on virtual environments for testing and validation is set to drive strong demand for simulation solutions across multiple sectors in 2024 and beyond.
Latest Trends
Shift Towards Cloud-Based Solutions
The migration to cloud-based simulation software is accelerating as companies prioritize scalability, cost-efficiency, and flexibility. Cloud platforms provide access to high-performance computing (HPC) resources, enabling businesses to run complex simulations without investing in expensive on-premise infrastructure. By leveraging cloud solutions, companies can collaborate globally in real time, significantly enhancing R&D processes. In 2024, this shift will intensify, with cloud-native simulation software providers gaining traction by offering pay-as-you-go models and enhanced security features to address concerns over data privacy.
Virtual Prototyping Over Physical Prototyping
The preference for virtual prototyping is set to grow as businesses seek to reduce costs and time-to-market. Virtual simulations allow for comprehensive testing of designs under various conditions, replacing the need for multiple physical prototypes. This shift is particularly pronounced in sectors like automotive and aerospace, where rapid innovation cycles demand agility. In 2024, advancements in simulation accuracy, coupled with the integration of AI and machine learning, will drive greater adoption of virtual prototyping, enabling companies to optimize designs, minimize risks, and streamline product development processes.
Regional Analysis
North America Leads the Global Simulation Software Market with 34.6% Largest Share
North America holds the largest regional market size in the global simulation software market, commanding a 34.6% share. The U.S. and Canada are pivotal, with the U.S. leading due to its concentration of aerospace, automotive companies, and defense industry stakeholders that integrate simulation software for enhanced research, development, and operational efficiency. In Canada, investments in smart manufacturing technologies contribute significantly to the market's strength.
In Europe, the market analysis reveals a robust share, with key contributions from Germany, France, and the UK. Germany's market dominance is fueled by its automotive and industrial automation sectors, utilizing engineering simulations extensively. France and the UK bolster the European market share through their strong aerospace and energy sectors. Analysis by country within the Rest of Europe spanning Spain, Italy, and Russia highlights their focus on manufacturing advancements and renewable energy, with an emphasis on sustainable technologies.
Asia-Pacific is marked by the fastest growth in market share by country, with China, Japan, and India as central markets. China's vast manufacturing and electronics sectors heavily employ simulation software, while Japan specializes in automotive and robotics simulations. India's growth is spurred by IT services and smart manufacturing. Additional growth in South-East Asian countries like Vietnam, Thailand, and South Korea is driven by investments in Industry 4.0 technologies.
In South America, the simulation software market is expanding, with Brazil and Mexico at the forefront. Brazil's healthcare sector and oil & gas industries are increasingly adopting simulation tools, while Mexico focuses on manufacturing and supply chain optimization, serving as a critical hub for North American production.
The Middle East & Africa region shows a steady increase in the adoption of simulation software, led by the oil & gas, construction, and defense industries. Saudi Arabia and the UAE are investing heavily in smart city and infrastructure projects, utilizing simulation tools for planning and development. South Africa leads in Africa with its focus on mining and energy sectors, using simulation software to enhance productivity and project management.
Key Regions and Countries
North America
- The US
- Canada
- Rest of North America
Europe
- Germany
- France
- The UK
- Spain
- Netherlands
- Russia
- Italy
- Rest of Europe
Asia-Pacific
- China
- Japan
- Singapore
- Thailand
- South Korea
- Vietnam
- India
- New Zealand
- Rest of Asia Pacific
Latin America
- Mexico
- Brazil
- Rest of Latin America
Middle East & Africa
- Saudi Arabia
- South Africa
- UAE
- Rest of the Middle East & Africa
Key Players Analysis
In 2024, the global simulation software market is set for significant growth, fueled by advancements in digital transformation, Industry 4.0 initiatives, and increasing adoption of AI and machine learning. Major players in this space are positioning themselves to capitalize on these trends through innovation, strategic acquisitions, and expansion into new industries.
Altair Engineering Inc., a key market player, is expected to leverage its focus on high-performance computing and cloud-based solutions to strengthen its position across industrial manufacturing, automotive, and aerospace sectors. Autodesk Inc., a major company with a robust design software portfolio, is likely to continue integrating simulation features within its broader architecture, engineering, and construction (AEC) ecosystem.
Ansys Inc. remains a leader in multiphysics simulations, benefiting from rising demand for advanced simulations in key sectors such as healthcare, defense, and electronics. Bentley Systems, Inc., a key company, will likely concentrate on infrastructure development, with its offerings well-aligned to capture the growing digital twin market.
Dassault Systèmes continues to dominate with its 3DEXPERIENCE platform, which integrates simulation capabilities across industries, reinforcing its leadership in digital twin and product lifecycle management. MathWorks Inc., recognized for MATLAB and Simulink, plays a crucial role in sectors requiring complex modeling and simulation, such as automotive and energy.
Additionally, Rockwell Automation Inc. is expected to expand its industrial simulation offerings, capitalizing on the rise of smart manufacturing. Niche players like Simulations Plus and ESI Group focus on specialized areas such as pharmaceuticals and virtual prototyping, while GSE Systems concentrates on energy and utilities. This diverse landscape of key market players suggests a competitive yet opportunity-rich future for the simulation software industry.
Market Key Players
- Altair Engineering Inc.
- Autodesk Inc.
- Ansys Inc.
- Bentley Systems, Inc.
- Dassault Systèmes
- MathWorks Inc.
- Rockwell Automation Inc.
- honeywell international inc.
- Simulations Plus
- ESI Group
- GSE Systems Inc
- Other Key Players
Recent Development
- In 2023, BMW i Ventures made a strategic investment in Ascon Systems, a German software firm pioneering the industrial metaverse with its innovative digital twins and low-code software solutions. This investment marks BMW i Ventures' support for the next evolution in digital production, promoting the potential of the industrial metaverse and digital shopfloor management within the automotive and supplier industry. The collaboration aims to enhance flexibility and efficiency in these critical sectors.
- On January 23, 2023, Accenture announced its strategic investment in Cosmo Tech, a specialist in digital twin simulation technology. This initiative, facilitated through Accenture Ventures during the first phase of Cosmo Tech's Series C fundraising, is intended to augment client access to sophisticated simulation tools that bolster planning and operational resilience. Cosmo Tech's platform enables organizations to simulate a variety of business scenarios, which can lead to enhanced profitability and sustainability.
Report Scope
Report Features Description Market Value (2023) USD 18.5 Bn Forecast Revenue (2033) USD 61.4 Bn CAGR (2024-2032) 13.1% Base Year for Estimation 2023 Historic Period 2016-2023 Forecast Period 2024-2033 Report Coverage Revenue Forecast, Market Dynamics, COVID-19 Impact, Competitive Landscape, Recent Developments Segments Covered Deployment Mode( On-Premise, Cloud), Component (Software, Services), Application (Engineering, Research, Modeling & Simulated Testing, Gaming & Immersive Experiences, High-Fidelity Experiential 3D Training, Manufacturing Process Optimization, Cyber Simulation, Other), End-Use Industry (Automotive, Electronics & Semiconductor, Aerospace & Defense, Healthcare, Transportation & Logistics, Other End-Use Industries) Regional Analysis North America - The US, Canada, Rest of North America, Europe - Germany, France, The UK, Spain, Italy, Russia, Netherlands, Rest of Europe, Asia-Pacific - China, Japan, South Korea, India, New Zealand, Singapore, Thailand, Vietnam, Rest of Asia Pacific, Latin America - Brazil, Mexico, Rest of Latin America, Middle East & Africa - South Africa, Saudi Arabia, UAE, Rest of Middle East & Africa Competitive Landscape Altair Engineering Inc., Autodesk Inc., Ansys Inc., Bentley Systems, Inc., Dassault Systèmes, MathWorks Inc., Rockwell Automation Inc., honeywell international inc., Simulations Plus, ESI Group, GSE Systems Inc, Other Key Players Customization Scope Customization for segments, region/country-level will be provided. Moreover, additional customization can be done based on the requirements. Purchase Options We have three licenses to opt for Single User License, Multi-User License (Up to 5 Users), Corporate Use License (Unlimited User and Printable PDF) -
- 1. Executive Summary
- 1.1. Definition
- 1.2. Taxonomy
- 1.3. Research Scope
- 1.4. Key Analysis
- 1.5. Key Findings by Major Segments
- 1.6. Top strategies by Major Players
- 2. Global Simulation Software Market Overview
- 2.1. Simulation Software Market Dynamics
- 2.1.1. Drivers
- 2.1.2. Opportunities
- 2.1.3. Restraints
- 2.1.4. Challenges
- 2.2. Macro-economic Factors
- 2.3. Regulatory Framework
- 2.4. Market Investment Feasibility Index
- 2.5. PEST Analysis
- 2.6. PORTER’S Five Force Analysis
- 2.7. Drivers & Restraints Impact Analysis
- 2.8. Industry Chain Analysis
- 2.9. Cost Structure Analysis
- 2.10. Marketing Strategy
- 2.11. Russia-Ukraine War Impact Analysis
- 2.12. Opportunity Map Analysis
- 2.13. Market Competition Scenario Analysis
- 2.14. Product Life Cycle Analysis
- 2.15. Opportunity Orbits
- 2.16. Manufacturer Intensity Map
- 2.17. Major Companies sales by Value & Volume
- 2.1. Simulation Software Market Dynamics
- 3. Global Simulation Software Market Analysis, Opportunity and Forecast, 2016-2032
- 3.1. Global Simulation Software Market Analysis, 2016-2021
- 3.2. Global Simulation Software Market Opportunity and Forecast, 2023-2032
- 3.3. Global Simulation Software Market Analysis, Opportunity and Forecast, By Deployment Mode, 2016-2032
- 3.3.1. Global Simulation Software Market Analysis by Deployment Mode: Introduction
- 3.3.2. Market Size Absolute $ Opportunity Analysis and Forecast, By Deployment Mode, 2016-2032
- 3.3.3. On-Premise
- 3.3.4. Cloud
- 3.4. Global Simulation Software Market Analysis, Opportunity and Forecast, By Component, 2016-2032
- 3.4.1. Global Simulation Software Market Analysis by Component: Introduction
- 3.4.2. Market Size Absolute $ Opportunity Analysis and Forecast, By Component, 2016-2032
- 3.4.3. Software
- 3.4.4. Services
- 3.5. Global Simulation Software Market Analysis, Opportunity and Forecast, By Application, 2016-2032
- 3.5.1. Global Simulation Software Market Analysis by Application: Introduction
- 3.5.2. Market Size Absolute $ Opportunity Analysis and Forecast, By Application, 2016-2032
- 3.5.3. Engineering, Research, Modeling & Simulated Testing
- 3.5.4. Gaming & Immersive Experiences
- 3.5.5. High-Fidelity Experiential 3D Training
- 3.5.6. Manufacturing Process Optimization
- 3.5.7. Cyber Simulation
- 3.5.8. Other
- 3.6. Global Simulation Software Market Analysis, Opportunity and Forecast, By End-Use Industry, 2016-2032
- 3.6.1. Global Simulation Software Market Analysis by End-Use Industry: Introduction
- 3.6.2. Market Size Absolute $ Opportunity Analysis and Forecast, By End-Use Industry, 2016-2032
- 3.6.3. Automotive
- 3.6.4. Electronics & Semiconductor
- 3.6.5. Aerospace & Defense
- 3.6.6. Healthcare
- 3.6.7. Transportation & Logistics
- 3.6.8. Other End-Use Industries
- 4. North America Simulation Software Market Analysis, Opportunity and Forecast, 2016-2032
- 4.1. North America Simulation Software Market Analysis, 2016-2021
- 4.2. North America Simulation Software Market Opportunity and Forecast, 2023-2032
- 4.3. North America Simulation Software Market Analysis, Opportunity and Forecast, By Deployment Mode, 2016-2032
- 4.3.1. North America Simulation Software Market Analysis by Deployment Mode: Introduction
- 4.3.2. Market Size Absolute $ Opportunity Analysis and Forecast, By Deployment Mode, 2016-2032
- 4.3.3. On-Premise
- 4.3.4. Cloud
- 4.4. North America Simulation Software Market Analysis, Opportunity and Forecast, By Component, 2016-2032
- 4.4.1. North America Simulation Software Market Analysis by Component: Introduction
- 4.4.2. Market Size Absolute $ Opportunity Analysis and Forecast, By Component, 2016-2032
- 4.4.3. Software
- 4.4.4. Services
- 4.5. North America Simulation Software Market Analysis, Opportunity and Forecast, By Application, 2016-2032
- 4.5.1. North America Simulation Software Market Analysis by Application: Introduction
- 4.5.2. Market Size Absolute $ Opportunity Analysis and Forecast, By Application, 2016-2032
- 4.5.3. Engineering, Research, Modeling & Simulated Testing
- 4.5.4. Gaming & Immersive Experiences
- 4.5.5. High-Fidelity Experiential 3D Training
- 4.5.6. Manufacturing Process Optimization
- 4.5.7. Cyber Simulation
- 4.5.8. Other
- 4.6. North America Simulation Software Market Analysis, Opportunity and Forecast, By End-Use Industry, 2016-2032
- 4.6.1. North America Simulation Software Market Analysis by End-Use Industry: Introduction
- 4.6.2. Market Size Absolute $ Opportunity Analysis and Forecast, By End-Use Industry, 2016-2032
- 4.6.3. Automotive
- 4.6.4. Electronics & Semiconductor
- 4.6.5. Aerospace & Defense
- 4.6.6. Healthcare
- 4.6.7. Transportation & Logistics
- 4.6.8. Other End-Use Industries
- 4.7. North America Simulation Software Market Analysis, Opportunity and Forecast, By Country , 2016-2032
- 4.7.1. North America Simulation Software Market Analysis by Country : Introduction
- 4.7.2. Market Size Absolute $ Opportunity Analysis and Forecast, Country , 2016-2032
- 4.7.2.1. The US
- 4.7.2.2. Canada
- 4.7.2.3. Mexico
- 5. Western Europe Simulation Software Market Analysis, Opportunity and Forecast, 2016-2032
- 5.1. Western Europe Simulation Software Market Analysis, 2016-2021
- 5.2. Western Europe Simulation Software Market Opportunity and Forecast, 2023-2032
- 5.3. Western Europe Simulation Software Market Analysis, Opportunity and Forecast, By Deployment Mode, 2016-2032
- 5.3.1. Western Europe Simulation Software Market Analysis by Deployment Mode: Introduction
- 5.3.2. Market Size Absolute $ Opportunity Analysis and Forecast, By Deployment Mode, 2016-2032
- 5.3.3. On-Premise
- 5.3.4. Cloud
- 5.4. Western Europe Simulation Software Market Analysis, Opportunity and Forecast, By Component, 2016-2032
- 5.4.1. Western Europe Simulation Software Market Analysis by Component: Introduction
- 5.4.2. Market Size Absolute $ Opportunity Analysis and Forecast, By Component, 2016-2032
- 5.4.3. Software
- 5.4.4. Services
- 5.5. Western Europe Simulation Software Market Analysis, Opportunity and Forecast, By Application, 2016-2032
- 5.5.1. Western Europe Simulation Software Market Analysis by Application: Introduction
- 5.5.2. Market Size Absolute $ Opportunity Analysis and Forecast, By Application, 2016-2032
- 5.5.3. Engineering, Research, Modeling & Simulated Testing
- 5.5.4. Gaming & Immersive Experiences
- 5.5.5. High-Fidelity Experiential 3D Training
- 5.5.6. Manufacturing Process Optimization
- 5.5.7. Cyber Simulation
- 5.5.8. Other
- 5.6. Western Europe Simulation Software Market Analysis, Opportunity and Forecast, By End-Use Industry, 2016-2032
- 5.6.1. Western Europe Simulation Software Market Analysis by End-Use Industry: Introduction
- 5.6.2. Market Size Absolute $ Opportunity Analysis and Forecast, By End-Use Industry, 2016-2032
- 5.6.3. Automotive
- 5.6.4. Electronics & Semiconductor
- 5.6.5. Aerospace & Defense
- 5.6.6. Healthcare
- 5.6.7. Transportation & Logistics
- 5.6.8. Other End-Use Industries
- 5.7. Western Europe Simulation Software Market Analysis, Opportunity and Forecast, By Country , 2016-2032
- 5.7.1. Western Europe Simulation Software Market Analysis by Country : Introduction
- 5.7.2. Market Size Absolute $ Opportunity Analysis and Forecast, Country , 2016-2032
- 5.7.2.1. Germany
- 5.7.2.2. France
- 5.7.2.3. The UK
- 5.7.2.4. Spain
- 5.7.2.5. Italy
- 5.7.2.6. Portugal
- 5.7.2.7. Ireland
- 5.7.2.8. Austria
- 5.7.2.9. Switzerland
- 5.7.2.10. Benelux
- 5.7.2.11. Nordic
- 5.7.2.12. Rest of Western Europe
- 6. Eastern Europe Simulation Software Market Analysis, Opportunity and Forecast, 2016-2032
- 6.1. Eastern Europe Simulation Software Market Analysis, 2016-2021
- 6.2. Eastern Europe Simulation Software Market Opportunity and Forecast, 2023-2032
- 6.3. Eastern Europe Simulation Software Market Analysis, Opportunity and Forecast, By Deployment Mode, 2016-2032
- 6.3.1. Eastern Europe Simulation Software Market Analysis by Deployment Mode: Introduction
- 6.3.2. Market Size Absolute $ Opportunity Analysis and Forecast, By Deployment Mode, 2016-2032
- 6.3.3. On-Premise
- 6.3.4. Cloud
- 6.4. Eastern Europe Simulation Software Market Analysis, Opportunity and Forecast, By Component, 2016-2032
- 6.4.1. Eastern Europe Simulation Software Market Analysis by Component: Introduction
- 6.4.2. Market Size Absolute $ Opportunity Analysis and Forecast, By Component, 2016-2032
- 6.4.3. Software
- 6.4.4. Services
- 6.5. Eastern Europe Simulation Software Market Analysis, Opportunity and Forecast, By Application, 2016-2032
- 6.5.1. Eastern Europe Simulation Software Market Analysis by Application: Introduction
- 6.5.2. Market Size Absolute $ Opportunity Analysis and Forecast, By Application, 2016-2032
- 6.5.3. Engineering, Research, Modeling & Simulated Testing
- 6.5.4. Gaming & Immersive Experiences
- 6.5.5. High-Fidelity Experiential 3D Training
- 6.5.6. Manufacturing Process Optimization
- 6.5.7. Cyber Simulation
- 6.5.8. Other
- 6.6. Eastern Europe Simulation Software Market Analysis, Opportunity and Forecast, By End-Use Industry, 2016-2032
- 6.6.1. Eastern Europe Simulation Software Market Analysis by End-Use Industry: Introduction
- 6.6.2. Market Size Absolute $ Opportunity Analysis and Forecast, By End-Use Industry, 2016-2032
- 6.6.3. Automotive
- 6.6.4. Electronics & Semiconductor
- 6.6.5. Aerospace & Defense
- 6.6.6. Healthcare
- 6.6.7. Transportation & Logistics
- 6.6.8. Other End-Use Industries
- 6.7. Eastern Europe Simulation Software Market Analysis, Opportunity and Forecast, By Country , 2016-2032
- 6.7.1. Eastern Europe Simulation Software Market Analysis by Country : Introduction
- 6.7.2. Market Size Absolute $ Opportunity Analysis and Forecast, Country , 2016-2032
- 6.7.2.1. Russia
- 6.7.2.2. Poland
- 6.7.2.3. The Czech Republic
- 6.7.2.4. Greece
- 6.7.2.5. Rest of Eastern Europe
- 7. APAC Simulation Software Market Analysis, Opportunity and Forecast, 2016-2032
- 7.1. APAC Simulation Software Market Analysis, 2016-2021
- 7.2. APAC Simulation Software Market Opportunity and Forecast, 2023-2032
- 7.3. APAC Simulation Software Market Analysis, Opportunity and Forecast, By Deployment Mode, 2016-2032
- 7.3.1. APAC Simulation Software Market Analysis by Deployment Mode: Introduction
- 7.3.2. Market Size Absolute $ Opportunity Analysis and Forecast, By Deployment Mode, 2016-2032
- 7.3.3. On-Premise
- 7.3.4. Cloud
- 7.4. APAC Simulation Software Market Analysis, Opportunity and Forecast, By Component, 2016-2032
- 7.4.1. APAC Simulation Software Market Analysis by Component: Introduction
- 7.4.2. Market Size Absolute $ Opportunity Analysis and Forecast, By Component, 2016-2032
- 7.4.3. Software
- 7.4.4. Services
- 7.5. APAC Simulation Software Market Analysis, Opportunity and Forecast, By Application, 2016-2032
- 7.5.1. APAC Simulation Software Market Analysis by Application: Introduction
- 7.5.2. Market Size Absolute $ Opportunity Analysis and Forecast, By Application, 2016-2032
- 7.5.3. Engineering, Research, Modeling & Simulated Testing
- 7.5.4. Gaming & Immersive Experiences
- 7.5.5. High-Fidelity Experiential 3D Training
- 7.5.6. Manufacturing Process Optimization
- 7.5.7. Cyber Simulation
- 7.5.8. Other
- 7.6. APAC Simulation Software Market Analysis, Opportunity and Forecast, By End-Use Industry, 2016-2032
- 7.6.1. APAC Simulation Software Market Analysis by End-Use Industry: Introduction
- 7.6.2. Market Size Absolute $ Opportunity Analysis and Forecast, By End-Use Industry, 2016-2032
- 7.6.3. Automotive
- 7.6.4. Electronics & Semiconductor
- 7.6.5. Aerospace & Defense
- 7.6.6. Healthcare
- 7.6.7. Transportation & Logistics
- 7.6.8. Other End-Use Industries
- 7.7. APAC Simulation Software Market Analysis, Opportunity and Forecast, By Country , 2016-2032
- 7.7.1. APAC Simulation Software Market Analysis by Country : Introduction
- 7.7.2. Market Size Absolute $ Opportunity Analysis and Forecast, Country , 2016-2032
- 7.7.2.1. China
- 7.7.2.2. Japan
- 7.7.2.3. South Korea
- 7.7.2.4. India
- 7.7.2.5. Australia & New Zeland
- 7.7.2.6. Indonesia
- 7.7.2.7. Malaysia
- 7.7.2.8. Philippines
- 7.7.2.9. Singapore
- 7.7.2.10. Thailand
- 7.7.2.11. Vietnam
- 7.7.2.12. Rest of APAC
- 8. Latin America Simulation Software Market Analysis, Opportunity and Forecast, 2016-2032
- 8.1. Latin America Simulation Software Market Analysis, 2016-2021
- 8.2. Latin America Simulation Software Market Opportunity and Forecast, 2023-2032
- 8.3. Latin America Simulation Software Market Analysis, Opportunity and Forecast, By Deployment Mode, 2016-2032
- 8.3.1. Latin America Simulation Software Market Analysis by Deployment Mode: Introduction
- 8.3.2. Market Size Absolute $ Opportunity Analysis and Forecast, By Deployment Mode, 2016-2032
- 8.3.3. On-Premise
- 8.3.4. Cloud
- 8.4. Latin America Simulation Software Market Analysis, Opportunity and Forecast, By Component, 2016-2032
- 8.4.1. Latin America Simulation Software Market Analysis by Component: Introduction
- 8.4.2. Market Size Absolute $ Opportunity Analysis and Forecast, By Component, 2016-2032
- 8.4.3. Software
- 8.4.4. Services
- 8.5. Latin America Simulation Software Market Analysis, Opportunity and Forecast, By Application, 2016-2032
- 8.5.1. Latin America Simulation Software Market Analysis by Application: Introduction
- 8.5.2. Market Size Absolute $ Opportunity Analysis and Forecast, By Application, 2016-2032
- 8.5.3. Engineering, Research, Modeling & Simulated Testing
- 8.5.4. Gaming & Immersive Experiences
- 8.5.5. High-Fidelity Experiential 3D Training
- 8.5.6. Manufacturing Process Optimization
- 8.5.7. Cyber Simulation
- 8.5.8. Other
- 8.6. Latin America Simulation Software Market Analysis, Opportunity and Forecast, By End-Use Industry, 2016-2032
- 8.6.1. Latin America Simulation Software Market Analysis by End-Use Industry: Introduction
- 8.6.2. Market Size Absolute $ Opportunity Analysis and Forecast, By End-Use Industry, 2016-2032
- 8.6.3. Automotive
- 8.6.4. Electronics & Semiconductor
- 8.6.5. Aerospace & Defense
- 8.6.6. Healthcare
- 8.6.7. Transportation & Logistics
- 8.6.8. Other End-Use Industries
- 8.7. Latin America Simulation Software Market Analysis, Opportunity and Forecast, By Country , 2016-2032
- 8.7.1. Latin America Simulation Software Market Analysis by Country : Introduction
- 8.7.2. Market Size Absolute $ Opportunity Analysis and Forecast, Country , 2016-2032
- 8.7.2.1. Brazil
- 8.7.2.2. Colombia
- 8.7.2.3. Chile
- 8.7.2.4. Argentina
- 8.7.2.5. Costa Rica
- 8.7.2.6. Rest of Latin America
- 9. Middle East & Africa Simulation Software Market Analysis, Opportunity and Forecast, 2016-2032
- 9.1. Middle East & Africa Simulation Software Market Analysis, 2016-2021
- 9.2. Middle East & Africa Simulation Software Market Opportunity and Forecast, 2023-2032
- 9.3. Middle East & Africa Simulation Software Market Analysis, Opportunity and Forecast, By Deployment Mode, 2016-2032
- 9.3.1. Middle East & Africa Simulation Software Market Analysis by Deployment Mode: Introduction
- 9.3.2. Market Size Absolute $ Opportunity Analysis and Forecast, By Deployment Mode, 2016-2032
- 9.3.3. On-Premise
- 9.3.4. Cloud
- 9.4. Middle East & Africa Simulation Software Market Analysis, Opportunity and Forecast, By Component, 2016-2032
- 9.4.1. Middle East & Africa Simulation Software Market Analysis by Component: Introduction
- 9.4.2. Market Size Absolute $ Opportunity Analysis and Forecast, By Component, 2016-2032
- 9.4.3. Software
- 9.4.4. Services
- 9.5. Middle East & Africa Simulation Software Market Analysis, Opportunity and Forecast, By Application, 2016-2032
- 9.5.1. Middle East & Africa Simulation Software Market Analysis by Application: Introduction
- 9.5.2. Market Size Absolute $ Opportunity Analysis and Forecast, By Application, 2016-2032
- 9.5.3. Engineering, Research, Modeling & Simulated Testing
- 9.5.4. Gaming & Immersive Experiences
- 9.5.5. High-Fidelity Experiential 3D Training
- 9.5.6. Manufacturing Process Optimization
- 9.5.7. Cyber Simulation
- 9.5.8. Other
- 9.6. Middle East & Africa Simulation Software Market Analysis, Opportunity and Forecast, By End-Use Industry, 2016-2032
- 9.6.1. Middle East & Africa Simulation Software Market Analysis by End-Use Industry: Introduction
- 9.6.2. Market Size Absolute $ Opportunity Analysis and Forecast, By End-Use Industry, 2016-2032
- 9.6.3. Automotive
- 9.6.4. Electronics & Semiconductor
- 9.6.5. Aerospace & Defense
- 9.6.6. Healthcare
- 9.6.7. Transportation & Logistics
- 9.6.8. Other End-Use Industries
- 9.7. Middle East & Africa Simulation Software Market Analysis, Opportunity and Forecast, By Country , 2016-2032
- 9.7.1. Middle East & Africa Simulation Software Market Analysis by Country : Introduction
- 9.7.2. Market Size Absolute $ Opportunity Analysis and Forecast, Country , 2016-2032
- 9.7.2.1. Algeria
- 9.7.2.2. Egypt
- 9.7.2.3. Israel
- 9.7.2.4. Kuwait
- 9.7.2.5. Nigeria
- 9.7.2.6. Saudi Arabia
- 9.7.2.7. South Africa
- 9.7.2.8. Turkey
- 9.7.2.9. The UAE
- 9.7.2.10. Rest of MEA
- 10. Global Simulation Software Market Analysis, Opportunity and Forecast, By Region , 2016-2032
- 10.1. Global Simulation Software Market Analysis by Region : Introduction
- 10.2. Market Size Absolute $ Opportunity Analysis and Forecast, By Region , 2016-2032
- 10.2.1. North America
- 10.2.2. Western Europe
- 10.2.3. Eastern Europe
- 10.2.4. APAC
- 10.2.5. Latin America
- 10.2.6. Middle East & Africa
- 11. Global Simulation Software Market Competitive Landscape, Market Share Analysis, and Company Profiles
- 11.1. Market Share Analysis
- 11.2. Company Profiles
- 11.3. Altair Engineering Inc.
- 11.3.1. Company Overview
- 11.3.2. Financial Highlights
- 11.3.3. Product Portfolio
- 11.3.4. SWOT Analysis
- 11.3.5. Key Strategies and Developments
- 11.4. Autodesk Inc.
- 11.4.1. Company Overview
- 11.4.2. Financial Highlights
- 11.4.3. Product Portfolio
- 11.4.4. SWOT Analysis
- 11.4.5. Key Strategies and Developments
- 11.5. Ansys Inc.
- 11.5.1. Company Overview
- 11.5.2. Financial Highlights
- 11.5.3. Product Portfolio
- 11.5.4. SWOT Analysis
- 11.5.5. Key Strategies and Developments
- 11.6. Bentley Systems, Inc.
- 11.6.1. Company Overview
- 11.6.2. Financial Highlights
- 11.6.3. Product Portfolio
- 11.6.4. SWOT Analysis
- 11.6.5. Key Strategies and Developments
- 11.7. Dassault Systèmes
- 11.7.1. Company Overview
- 11.7.2. Financial Highlights
- 11.7.3. Product Portfolio
- 11.7.4. SWOT Analysis
- 11.7.5. Key Strategies and Developments
- 11.8. MathWorks Inc.
- 11.8.1. Company Overview
- 11.8.2. Financial Highlights
- 11.8.3. Product Portfolio
- 11.8.4. SWOT Analysis
- 11.8.5. Key Strategies and Developments
- 11.9. Rockwell Automation Inc.
- 11.9.1. Company Overview
- 11.9.2. Financial Highlights
- 11.9.3. Product Portfolio
- 11.9.4. SWOT Analysis
- 11.9.5. Key Strategies and Developments
- 11.10. honeywell international inc.
- 11.10.1. Company Overview
- 11.10.2. Financial Highlights
- 11.10.3. Product Portfolio
- 11.10.4. SWOT Analysis
- 11.10.5. Key Strategies and Developments
- 11.11. Simulations Plus
- 11.11.1. Company Overview
- 11.11.2. Financial Highlights
- 11.11.3. Product Portfolio
- 11.11.4. SWOT Analysis
- 11.11.5. Key Strategies and Developments
- 11.12. ESI Group
- 11.12.1. Company Overview
- 11.12.2. Financial Highlights
- 11.12.3. Product Portfolio
- 11.12.4. SWOT Analysis
- 11.12.5. Key Strategies and Developments
- 11.13.1. Company Overview
- 11.13.2. Financial Highlights
- 11.13.3. Product Portfolio
- 11.13.4. SWOT Analysis
- 11.13.5. Key Strategies and Developments
- 11.14. GSE Systems Inc
- 11.14.1. Company Overview
- 11.14.2. Financial Highlights
- 11.14.3. Product Portfolio
- 11.14.4. SWOT Analysis
- 11.14.5. Key Strategies and Developments
- 12. Assumptions and Acronyms
- 13. Research Methodology
- 14. Contact
List of Figures
-
- Figure 1: Global Simulation Software Market Revenue (US$ Mn) Market Share by Deployment Mode in 2022
- Figure 2: Global Simulation Software Market Market Attractiveness Analysis by Deployment Mode, 2016-2032
- Figure 3: Global Simulation Software Market Revenue (US$ Mn) Market Share by Componentin 2022
- Figure 4: Global Simulation Software Market Market Attractiveness Analysis by Component, 2016-2032
- Figure 5: Global Simulation Software Market Revenue (US$ Mn) Market Share by Applicationin 2022
- Figure 6: Global Simulation Software Market Market Attractiveness Analysis by Application, 2016-2032
- Figure 7: Global Simulation Software Market Revenue (US$ Mn) Market Share by End-Use Industryin 2022
- Figure 8: Global Simulation Software Market Market Attractiveness Analysis by End-Use Industry, 2016-2032
- Figure 9: Global Simulation Software Market Revenue (US$ Mn) Market Share by Region in 2022
- Figure 10: Global Simulation Software Market Market Attractiveness Analysis by Region, 2016-2032
- Figure 11: Global Simulation Software Market Market Revenue (US$ Mn) (2016-2032)
- Figure 12: Global Simulation Software Market Market Revenue (US$ Mn) Comparison by Region (2016-2032)
- Figure 13: Global Simulation Software Market Market Revenue (US$ Mn) Comparison by Deployment Mode (2016-2032)
- Figure 14: Global Simulation Software Market Market Revenue (US$ Mn) Comparison by Component (2016-2032)
- Figure 15: Global Simulation Software Market Market Revenue (US$ Mn) Comparison by Application (2016-2032)
- Figure 16: Global Simulation Software Market Market Revenue (US$ Mn) Comparison by End-Use Industry (2016-2032)
- Figure 17: Global Simulation Software Market Market Y-o-Y Growth Rate Comparison by Region (2016-2032)
- Figure 18: Global Simulation Software Market Market Y-o-Y Growth Rate Comparison by Deployment Mode (2016-2032)
- Figure 19: Global Simulation Software Market Market Y-o-Y Growth Rate Comparison by Component (2016-2032)
- Figure 20: Global Simulation Software Market Market Y-o-Y Growth Rate Comparison by Application (2016-2032)
- Figure 21: Global Simulation Software Market Market Y-o-Y Growth Rate Comparison by End-Use Industry (2016-2032)
- Figure 22: Global Simulation Software Market Market Share Comparison by Region (2016-2032)
- Figure 23: Global Simulation Software Market Market Share Comparison by Deployment Mode (2016-2032)
- Figure 24: Global Simulation Software Market Market Share Comparison by Component (2016-2032)
- Figure 25: Global Simulation Software Market Market Share Comparison by Application (2016-2032)
- Figure 26: Global Simulation Software Market Market Share Comparison by End-Use Industry (2016-2032)
- Figure 27: North America Simulation Software Market Revenue (US$ Mn) Market Share by Deployment Modein 2022
- Figure 28: North America Simulation Software Market Market Attractiveness Analysis by Deployment Mode, 2016-2032
- Figure 29: North America Simulation Software Market Revenue (US$ Mn) Market Share by Componentin 2022
- Figure 30: North America Simulation Software Market Market Attractiveness Analysis by Component, 2016-2032
- Figure 31: North America Simulation Software Market Revenue (US$ Mn) Market Share by Applicationin 2022
- Figure 32: North America Simulation Software Market Market Attractiveness Analysis by Application, 2016-2032
- Figure 33: North America Simulation Software Market Revenue (US$ Mn) Market Share by End-Use Industryin 2022
- Figure 34: North America Simulation Software Market Market Attractiveness Analysis by End-Use Industry, 2016-2032
- Figure 35: North America Simulation Software Market Revenue (US$ Mn) Market Share by Country in 2022
- Figure 36: North America Simulation Software Market Market Attractiveness Analysis by Country, 2016-2032
- Figure 37: North America Simulation Software Market Market Revenue (US$ Mn) (2016-2032)
- Figure 38: North America Simulation Software Market Market Revenue (US$ Mn) Comparison by Country (2016-2032)
- Figure 39: North America Simulation Software Market Market Revenue (US$ Mn) Comparison by Deployment Mode (2016-2032)
- Figure 40: North America Simulation Software Market Market Revenue (US$ Mn) Comparison by Component (2016-2032)
- Figure 41: North America Simulation Software Market Market Revenue (US$ Mn) Comparison by Application (2016-2032)
- Figure 42: North America Simulation Software Market Market Revenue (US$ Mn) Comparison by End-Use Industry (2016-2032)
- Figure 43: North America Simulation Software Market Market Y-o-Y Growth Rate Comparison by Country (2016-2032)
- Figure 44: North America Simulation Software Market Market Y-o-Y Growth Rate Comparison by Deployment Mode (2016-2032)
- Figure 45: North America Simulation Software Market Market Y-o-Y Growth Rate Comparison by Component (2016-2032)
- Figure 46: North America Simulation Software Market Market Y-o-Y Growth Rate Comparison by Application (2016-2032)
- Figure 47: North America Simulation Software Market Market Y-o-Y Growth Rate Comparison by End-Use Industry (2016-2032)
- Figure 48: North America Simulation Software Market Market Share Comparison by Country (2016-2032)
- Figure 49: North America Simulation Software Market Market Share Comparison by Deployment Mode (2016-2032)
- Figure 50: North America Simulation Software Market Market Share Comparison by Component (2016-2032)
- Figure 51: North America Simulation Software Market Market Share Comparison by Application (2016-2032)
- Figure 52: North America Simulation Software Market Market Share Comparison by End-Use Industry (2016-2032)
- Figure 53: Western Europe Simulation Software Market Revenue (US$ Mn) Market Share by Deployment Modein 2022
- Figure 54: Western Europe Simulation Software Market Market Attractiveness Analysis by Deployment Mode, 2016-2032
- Figure 55: Western Europe Simulation Software Market Revenue (US$ Mn) Market Share by Componentin 2022
- Figure 56: Western Europe Simulation Software Market Market Attractiveness Analysis by Component, 2016-2032
- Figure 57: Western Europe Simulation Software Market Revenue (US$ Mn) Market Share by Applicationin 2022
- Figure 58: Western Europe Simulation Software Market Market Attractiveness Analysis by Application, 2016-2032
- Figure 59: Western Europe Simulation Software Market Revenue (US$ Mn) Market Share by End-Use Industryin 2022
- Figure 60: Western Europe Simulation Software Market Market Attractiveness Analysis by End-Use Industry, 2016-2032
- Figure 61: Western Europe Simulation Software Market Revenue (US$ Mn) Market Share by Country in 2022
- Figure 62: Western Europe Simulation Software Market Market Attractiveness Analysis by Country, 2016-2032
- Figure 63: Western Europe Simulation Software Market Market Revenue (US$ Mn) (2016-2032)
- Figure 64: Western Europe Simulation Software Market Market Revenue (US$ Mn) Comparison by Country (2016-2032)
- Figure 65: Western Europe Simulation Software Market Market Revenue (US$ Mn) Comparison by Deployment Mode (2016-2032)
- Figure 66: Western Europe Simulation Software Market Market Revenue (US$ Mn) Comparison by Component (2016-2032)
- Figure 67: Western Europe Simulation Software Market Market Revenue (US$ Mn) Comparison by Application (2016-2032)
- Figure 68: Western Europe Simulation Software Market Market Revenue (US$ Mn) Comparison by End-Use Industry (2016-2032)
- Figure 69: Western Europe Simulation Software Market Market Y-o-Y Growth Rate Comparison by Country (2016-2032)
- Figure 70: Western Europe Simulation Software Market Market Y-o-Y Growth Rate Comparison by Deployment Mode (2016-2032)
- Figure 71: Western Europe Simulation Software Market Market Y-o-Y Growth Rate Comparison by Component (2016-2032)
- Figure 72: Western Europe Simulation Software Market Market Y-o-Y Growth Rate Comparison by Application (2016-2032)
- Figure 73: Western Europe Simulation Software Market Market Y-o-Y Growth Rate Comparison by End-Use Industry (2016-2032)
- Figure 74: Western Europe Simulation Software Market Market Share Comparison by Country (2016-2032)
- Figure 75: Western Europe Simulation Software Market Market Share Comparison by Deployment Mode (2016-2032)
- Figure 76: Western Europe Simulation Software Market Market Share Comparison by Component (2016-2032)
- Figure 77: Western Europe Simulation Software Market Market Share Comparison by Application (2016-2032)
- Figure 78: Western Europe Simulation Software Market Market Share Comparison by End-Use Industry (2016-2032)
- Figure 79: Eastern Europe Simulation Software Market Revenue (US$ Mn) Market Share by Deployment Modein 2022
- Figure 80: Eastern Europe Simulation Software Market Market Attractiveness Analysis by Deployment Mode, 2016-2032
- Figure 81: Eastern Europe Simulation Software Market Revenue (US$ Mn) Market Share by Componentin 2022
- Figure 82: Eastern Europe Simulation Software Market Market Attractiveness Analysis by Component, 2016-2032
- Figure 83: Eastern Europe Simulation Software Market Revenue (US$ Mn) Market Share by Applicationin 2022
- Figure 84: Eastern Europe Simulation Software Market Market Attractiveness Analysis by Application, 2016-2032
- Figure 85: Eastern Europe Simulation Software Market Revenue (US$ Mn) Market Share by End-Use Industryin 2022
- Figure 86: Eastern Europe Simulation Software Market Market Attractiveness Analysis by End-Use Industry, 2016-2032
- Figure 87: Eastern Europe Simulation Software Market Revenue (US$ Mn) Market Share by Country in 2022
- Figure 88: Eastern Europe Simulation Software Market Market Attractiveness Analysis by Country, 2016-2032
- Figure 89: Eastern Europe Simulation Software Market Market Revenue (US$ Mn) (2016-2032)
- Figure 90: Eastern Europe Simulation Software Market Market Revenue (US$ Mn) Comparison by Country (2016-2032)
- Figure 91: Eastern Europe Simulation Software Market Market Revenue (US$ Mn) Comparison by Deployment Mode (2016-2032)
- Figure 92: Eastern Europe Simulation Software Market Market Revenue (US$ Mn) Comparison by Component (2016-2032)
- Figure 93: Eastern Europe Simulation Software Market Market Revenue (US$ Mn) Comparison by Application (2016-2032)
- Figure 94: Eastern Europe Simulation Software Market Market Revenue (US$ Mn) Comparison by End-Use Industry (2016-2032)
- Figure 95: Eastern Europe Simulation Software Market Market Y-o-Y Growth Rate Comparison by Country (2016-2032)
- Figure 96: Eastern Europe Simulation Software Market Market Y-o-Y Growth Rate Comparison by Deployment Mode (2016-2032)
- Figure 97: Eastern Europe Simulation Software Market Market Y-o-Y Growth Rate Comparison by Component (2016-2032)
- Figure 98: Eastern Europe Simulation Software Market Market Y-o-Y Growth Rate Comparison by Application (2016-2032)
- Figure 99: Eastern Europe Simulation Software Market Market Y-o-Y Growth Rate Comparison by End-Use Industry (2016-2032)
- Figure 100: Eastern Europe Simulation Software Market Market Share Comparison by Country (2016-2032)
- Figure 101: Eastern Europe Simulation Software Market Market Share Comparison by Deployment Mode (2016-2032)
- Figure 102: Eastern Europe Simulation Software Market Market Share Comparison by Component (2016-2032)
- Figure 103: Eastern Europe Simulation Software Market Market Share Comparison by Application (2016-2032)
- Figure 104: Eastern Europe Simulation Software Market Market Share Comparison by End-Use Industry (2016-2032)
- Figure 105: APAC Simulation Software Market Revenue (US$ Mn) Market Share by Deployment Modein 2022
- Figure 106: APAC Simulation Software Market Market Attractiveness Analysis by Deployment Mode, 2016-2032
- Figure 107: APAC Simulation Software Market Revenue (US$ Mn) Market Share by Componentin 2022
- Figure 108: APAC Simulation Software Market Market Attractiveness Analysis by Component, 2016-2032
- Figure 109: APAC Simulation Software Market Revenue (US$ Mn) Market Share by Applicationin 2022
- Figure 110: APAC Simulation Software Market Market Attractiveness Analysis by Application, 2016-2032
- Figure 111: APAC Simulation Software Market Revenue (US$ Mn) Market Share by End-Use Industryin 2022
- Figure 112: APAC Simulation Software Market Market Attractiveness Analysis by End-Use Industry, 2016-2032
- Figure 113: APAC Simulation Software Market Revenue (US$ Mn) Market Share by Country in 2022
- Figure 114: APAC Simulation Software Market Market Attractiveness Analysis by Country, 2016-2032
- Figure 115: APAC Simulation Software Market Market Revenue (US$ Mn) (2016-2032)
- Figure 116: APAC Simulation Software Market Market Revenue (US$ Mn) Comparison by Country (2016-2032)
- Figure 117: APAC Simulation Software Market Market Revenue (US$ Mn) Comparison by Deployment Mode (2016-2032)
- Figure 118: APAC Simulation Software Market Market Revenue (US$ Mn) Comparison by Component (2016-2032)
- Figure 119: APAC Simulation Software Market Market Revenue (US$ Mn) Comparison by Application (2016-2032)
- Figure 120: APAC Simulation Software Market Market Revenue (US$ Mn) Comparison by End-Use Industry (2016-2032)
- Figure 121: APAC Simulation Software Market Market Y-o-Y Growth Rate Comparison by Country (2016-2032)
- Figure 122: APAC Simulation Software Market Market Y-o-Y Growth Rate Comparison by Deployment Mode (2016-2032)
- Figure 123: APAC Simulation Software Market Market Y-o-Y Growth Rate Comparison by Component (2016-2032)
- Figure 124: APAC Simulation Software Market Market Y-o-Y Growth Rate Comparison by Application (2016-2032)
- Figure 125: APAC Simulation Software Market Market Y-o-Y Growth Rate Comparison by End-Use Industry (2016-2032)
- Figure 126: APAC Simulation Software Market Market Share Comparison by Country (2016-2032)
- Figure 127: APAC Simulation Software Market Market Share Comparison by Deployment Mode (2016-2032)
- Figure 128: APAC Simulation Software Market Market Share Comparison by Component (2016-2032)
- Figure 129: APAC Simulation Software Market Market Share Comparison by Application (2016-2032)
- Figure 130: APAC Simulation Software Market Market Share Comparison by End-Use Industry (2016-2032)
- Figure 131: Latin America Simulation Software Market Revenue (US$ Mn) Market Share by Deployment Modein 2022
- Figure 132: Latin America Simulation Software Market Market Attractiveness Analysis by Deployment Mode, 2016-2032
- Figure 133: Latin America Simulation Software Market Revenue (US$ Mn) Market Share by Componentin 2022
- Figure 134: Latin America Simulation Software Market Market Attractiveness Analysis by Component, 2016-2032
- Figure 135: Latin America Simulation Software Market Revenue (US$ Mn) Market Share by Applicationin 2022
- Figure 136: Latin America Simulation Software Market Market Attractiveness Analysis by Application, 2016-2032
- Figure 137: Latin America Simulation Software Market Revenue (US$ Mn) Market Share by End-Use Industryin 2022
- Figure 138: Latin America Simulation Software Market Market Attractiveness Analysis by End-Use Industry, 2016-2032
- Figure 139: Latin America Simulation Software Market Revenue (US$ Mn) Market Share by Country in 2022
- Figure 140: Latin America Simulation Software Market Market Attractiveness Analysis by Country, 2016-2032
- Figure 141: Latin America Simulation Software Market Market Revenue (US$ Mn) (2016-2032)
- Figure 142: Latin America Simulation Software Market Market Revenue (US$ Mn) Comparison by Country (2016-2032)
- Figure 143: Latin America Simulation Software Market Market Revenue (US$ Mn) Comparison by Deployment Mode (2016-2032)
- Figure 144: Latin America Simulation Software Market Market Revenue (US$ Mn) Comparison by Component (2016-2032)
- Figure 145: Latin America Simulation Software Market Market Revenue (US$ Mn) Comparison by Application (2016-2032)
- Figure 146: Latin America Simulation Software Market Market Revenue (US$ Mn) Comparison by End-Use Industry (2016-2032)
- Figure 147: Latin America Simulation Software Market Market Y-o-Y Growth Rate Comparison by Country (2016-2032)
- Figure 148: Latin America Simulation Software Market Market Y-o-Y Growth Rate Comparison by Deployment Mode (2016-2032)
- Figure 149: Latin America Simulation Software Market Market Y-o-Y Growth Rate Comparison by Component (2016-2032)
- Figure 150: Latin America Simulation Software Market Market Y-o-Y Growth Rate Comparison by Application (2016-2032)
- Figure 151: Latin America Simulation Software Market Market Y-o-Y Growth Rate Comparison by End-Use Industry (2016-2032)
- Figure 152: Latin America Simulation Software Market Market Share Comparison by Country (2016-2032)
- Figure 153: Latin America Simulation Software Market Market Share Comparison by Deployment Mode (2016-2032)
- Figure 154: Latin America Simulation Software Market Market Share Comparison by Component (2016-2032)
- Figure 155: Latin America Simulation Software Market Market Share Comparison by Application (2016-2032)
- Figure 156: Latin America Simulation Software Market Market Share Comparison by End-Use Industry (2016-2032)
- Figure 157: Middle East & Africa Simulation Software Market Revenue (US$ Mn) Market Share by Deployment Modein 2022
- Figure 158: Middle East & Africa Simulation Software Market Market Attractiveness Analysis by Deployment Mode, 2016-2032
- Figure 159: Middle East & Africa Simulation Software Market Revenue (US$ Mn) Market Share by Componentin 2022
- Figure 160: Middle East & Africa Simulation Software Market Market Attractiveness Analysis by Component, 2016-2032
- Figure 161: Middle East & Africa Simulation Software Market Revenue (US$ Mn) Market Share by Applicationin 2022
- Figure 162: Middle East & Africa Simulation Software Market Market Attractiveness Analysis by Application, 2016-2032
- Figure 163: Middle East & Africa Simulation Software Market Revenue (US$ Mn) Market Share by End-Use Industryin 2022
- Figure 164: Middle East & Africa Simulation Software Market Market Attractiveness Analysis by End-Use Industry, 2016-2032
- Figure 165: Middle East & Africa Simulation Software Market Revenue (US$ Mn) Market Share by Country in 2022
- Figure 166: Middle East & Africa Simulation Software Market Market Attractiveness Analysis by Country, 2016-2032
- Figure 167: Middle East & Africa Simulation Software Market Market Revenue (US$ Mn) (2016-2032)
- Figure 168: Middle East & Africa Simulation Software Market Market Revenue (US$ Mn) Comparison by Country (2016-2032)
- Figure 169: Middle East & Africa Simulation Software Market Market Revenue (US$ Mn) Comparison by Deployment Mode (2016-2032)
- Figure 170: Middle East & Africa Simulation Software Market Market Revenue (US$ Mn) Comparison by Component (2016-2032)
- Figure 171: Middle East & Africa Simulation Software Market Market Revenue (US$ Mn) Comparison by Application (2016-2032)
- Figure 172: Middle East & Africa Simulation Software Market Market Revenue (US$ Mn) Comparison by End-Use Industry (2016-2032)
- Figure 173: Middle East & Africa Simulation Software Market Market Y-o-Y Growth Rate Comparison by Country (2016-2032)
- Figure 174: Middle East & Africa Simulation Software Market Market Y-o-Y Growth Rate Comparison by Deployment Mode (2016-2032)
- Figure 175: Middle East & Africa Simulation Software Market Market Y-o-Y Growth Rate Comparison by Component (2016-2032)
- Figure 176: Middle East & Africa Simulation Software Market Market Y-o-Y Growth Rate Comparison by Application (2016-2032)
- Figure 177: Middle East & Africa Simulation Software Market Market Y-o-Y Growth Rate Comparison by End-Use Industry (2016-2032)
- Figure 178: Middle East & Africa Simulation Software Market Market Share Comparison by Country (2016-2032)
- Figure 179: Middle East & Africa Simulation Software Market Market Share Comparison by Deployment Mode (2016-2032)
- Figure 180: Middle East & Africa Simulation Software Market Market Share Comparison by Component (2016-2032)
- Figure 181: Middle East & Africa Simulation Software Market Market Share Comparison by Application (2016-2032)
- Figure 182: Middle East & Africa Simulation Software Market Market Share Comparison by End-Use Industry (2016-2032)
List of Tables
- Table 1: Global Simulation Software Market Market Comparison by Deployment Mode (2016-2032)
- Table 2: Global Simulation Software Market Market Comparison by Component (2016-2032)
- Table 3: Global Simulation Software Market Market Comparison by Application (2016-2032)
- Table 4: Global Simulation Software Market Market Comparison by End-Use Industry (2016-2032)
- Table 5: Global Simulation Software Market Revenue (US$ Mn) Comparison by Region (2016-2032)
- Table 6: Global Simulation Software Market Market Revenue (US$ Mn) (2016-2032)
- Table 7: Global Simulation Software Market Market Revenue (US$ Mn) Comparison by Region (2016-2032)
- Table 8: Global Simulation Software Market Market Revenue (US$ Mn) Comparison by Deployment Mode (2016-2032)
- Table 9: Global Simulation Software Market Market Revenue (US$ Mn) Comparison by Component (2016-2032)
- Table 10: Global Simulation Software Market Market Revenue (US$ Mn) Comparison by Application (2016-2032)
- Table 11: Global Simulation Software Market Market Revenue (US$ Mn) Comparison by End-Use Industry (2016-2032)
- Table 12: Global Simulation Software Market Market Y-o-Y Growth Rate Comparison by Region (2016-2032)
- Table 13: Global Simulation Software Market Market Y-o-Y Growth Rate Comparison by Deployment Mode (2016-2032)
- Table 14: Global Simulation Software Market Market Y-o-Y Growth Rate Comparison by Component (2016-2032)
- Table 15: Global Simulation Software Market Market Y-o-Y Growth Rate Comparison by Application (2016-2032)
- Table 16: Global Simulation Software Market Market Y-o-Y Growth Rate Comparison by End-Use Industry (2016-2032)
- Table 17: Global Simulation Software Market Market Share Comparison by Region (2016-2032)
- Table 18: Global Simulation Software Market Market Share Comparison by Deployment Mode (2016-2032)
- Table 19: Global Simulation Software Market Market Share Comparison by Component (2016-2032)
- Table 20: Global Simulation Software Market Market Share Comparison by Application (2016-2032)
- Table 21: Global Simulation Software Market Market Share Comparison by End-Use Industry (2016-2032)
- Table 22: North America Simulation Software Market Market Comparison by Component (2016-2032)
- Table 23: North America Simulation Software Market Market Comparison by Application (2016-2032)
- Table 24: North America Simulation Software Market Market Comparison by End-Use Industry (2016-2032)
- Table 25: North America Simulation Software Market Revenue (US$ Mn) Comparison by Country (2016-2032)
- Table 26: North America Simulation Software Market Market Revenue (US$ Mn) (2016-2032)
- Table 27: North America Simulation Software Market Market Revenue (US$ Mn) Comparison by Country (2016-2032)
- Table 28: North America Simulation Software Market Market Revenue (US$ Mn) Comparison by Deployment Mode (2016-2032)
- Table 29: North America Simulation Software Market Market Revenue (US$ Mn) Comparison by Component (2016-2032)
- Table 30: North America Simulation Software Market Market Revenue (US$ Mn) Comparison by Application (2016-2032)
- Table 31: North America Simulation Software Market Market Revenue (US$ Mn) Comparison by End-Use Industry (2016-2032)
- Table 32: North America Simulation Software Market Market Y-o-Y Growth Rate Comparison by Country (2016-2032)
- Table 33: North America Simulation Software Market Market Y-o-Y Growth Rate Comparison by Deployment Mode (2016-2032)
- Table 34: North America Simulation Software Market Market Y-o-Y Growth Rate Comparison by Component (2016-2032)
- Table 35: North America Simulation Software Market Market Y-o-Y Growth Rate Comparison by Application (2016-2032)
- Table 36: North America Simulation Software Market Market Y-o-Y Growth Rate Comparison by End-Use Industry (2016-2032)
- Table 37: North America Simulation Software Market Market Share Comparison by Country (2016-2032)
- Table 38: North America Simulation Software Market Market Share Comparison by Deployment Mode (2016-2032)
- Table 39: North America Simulation Software Market Market Share Comparison by Component (2016-2032)
- Table 40: North America Simulation Software Market Market Share Comparison by Application (2016-2032)
- Table 41: North America Simulation Software Market Market Share Comparison by End-Use Industry (2016-2032)
- Table 42: Western Europe Simulation Software Market Market Comparison by Deployment Mode (2016-2032)
- Table 43: Western Europe Simulation Software Market Market Comparison by Component (2016-2032)
- Table 44: Western Europe Simulation Software Market Market Comparison by Application (2016-2032)
- Table 45: Western Europe Simulation Software Market Market Comparison by End-Use Industry (2016-2032)
- Table 46: Western Europe Simulation Software Market Revenue (US$ Mn) Comparison by Country (2016-2032)
- Table 47: Western Europe Simulation Software Market Market Revenue (US$ Mn) (2016-2032)
- Table 48: Western Europe Simulation Software Market Market Revenue (US$ Mn) Comparison by Country (2016-2032)
- Table 49: Western Europe Simulation Software Market Market Revenue (US$ Mn) Comparison by Deployment Mode (2016-2032)
- Table 50: Western Europe Simulation Software Market Market Revenue (US$ Mn) Comparison by Component (2016-2032)
- Table 51: Western Europe Simulation Software Market Market Revenue (US$ Mn) Comparison by Application (2016-2032)
- Table 52: Western Europe Simulation Software Market Market Revenue (US$ Mn) Comparison by End-Use Industry (2016-2032)
- Table 53: Western Europe Simulation Software Market Market Y-o-Y Growth Rate Comparison by Country (2016-2032)
- Table 54: Western Europe Simulation Software Market Market Y-o-Y Growth Rate Comparison by Deployment Mode (2016-2032)
- Table 55: Western Europe Simulation Software Market Market Y-o-Y Growth Rate Comparison by Component (2016-2032)
- Table 56: Western Europe Simulation Software Market Market Y-o-Y Growth Rate Comparison by Application (2016-2032)
- Table 57: Western Europe Simulation Software Market Market Y-o-Y Growth Rate Comparison by End-Use Industry (2016-2032)
- Table 58: Western Europe Simulation Software Market Market Share Comparison by Country (2016-2032)
- Table 59: Western Europe Simulation Software Market Market Share Comparison by Deployment Mode (2016-2032)
- Table 60: Western Europe Simulation Software Market Market Share Comparison by Component (2016-2032)
- Table 61: Western Europe Simulation Software Market Market Share Comparison by Application (2016-2032)
- Table 62: Western Europe Simulation Software Market Market Share Comparison by End-Use Industry (2016-2032)
- Table 63: Eastern Europe Simulation Software Market Market Comparison by Deployment Mode (2016-2032)
- Table 64: Eastern Europe Simulation Software Market Market Comparison by Component (2016-2032)
- Table 65: Eastern Europe Simulation Software Market Market Comparison by Application (2016-2032)
- Table 66: Eastern Europe Simulation Software Market Market Comparison by End-Use Industry (2016-2032)
- Table 67: Eastern Europe Simulation Software Market Revenue (US$ Mn) Comparison by Country (2016-2032)
- Table 68: Eastern Europe Simulation Software Market Market Revenue (US$ Mn) (2016-2032)
- Table 69: Eastern Europe Simulation Software Market Market Revenue (US$ Mn) Comparison by Country (2016-2032)
- Table 70: Eastern Europe Simulation Software Market Market Revenue (US$ Mn) Comparison by Deployment Mode (2016-2032)
- Table 71: Eastern Europe Simulation Software Market Market Revenue (US$ Mn) Comparison by Component (2016-2032)
- Table 72: Eastern Europe Simulation Software Market Market Revenue (US$ Mn) Comparison by Application (2016-2032)
- Table 73: Eastern Europe Simulation Software Market Market Revenue (US$ Mn) Comparison by End-Use Industry (2016-2032)
- Table 74: Eastern Europe Simulation Software Market Market Y-o-Y Growth Rate Comparison by Country (2016-2032)
- Table 75: Eastern Europe Simulation Software Market Market Y-o-Y Growth Rate Comparison by Deployment Mode (2016-2032)
- Table 76: Eastern Europe Simulation Software Market Market Y-o-Y Growth Rate Comparison by Component (2016-2032)
- Table 77: Eastern Europe Simulation Software Market Market Y-o-Y Growth Rate Comparison by Application (2016-2032)
- Table 78: Eastern Europe Simulation Software Market Market Y-o-Y Growth Rate Comparison by End-Use Industry (2016-2032)
- Table 79: Eastern Europe Simulation Software Market Market Share Comparison by Country (2016-2032)
- Table 80: Eastern Europe Simulation Software Market Market Share Comparison by Deployment Mode (2016-2032)
- Table 81: Eastern Europe Simulation Software Market Market Share Comparison by Component (2016-2032)
- Table 82: Eastern Europe Simulation Software Market Market Share Comparison by Application (2016-2032)
- Table 83: Eastern Europe Simulation Software Market Market Share Comparison by End-Use Industry (2016-2032)
- Table 84: APAC Simulation Software Market Market Comparison by Deployment Mode (2016-2032)
- Table 85: APAC Simulation Software Market Market Comparison by Component (2016-2032)
- Table 86: APAC Simulation Software Market Market Comparison by Application (2016-2032)
- Table 87: APAC Simulation Software Market Market Comparison by End-Use Industry (2016-2032)
- Table 88: APAC Simulation Software Market Revenue (US$ Mn) Comparison by Country (2016-2032)
- Table 89: APAC Simulation Software Market Market Revenue (US$ Mn) (2016-2032)
- Table 90: APAC Simulation Software Market Market Revenue (US$ Mn) Comparison by Country (2016-2032)
- Table 91: APAC Simulation Software Market Market Revenue (US$ Mn) Comparison by Deployment Mode (2016-2032)
- Table 92: APAC Simulation Software Market Market Revenue (US$ Mn) Comparison by Component (2016-2032)
- Table 93: APAC Simulation Software Market Market Revenue (US$ Mn) Comparison by Application (2016-2032)
- Table 94: APAC Simulation Software Market Market Revenue (US$ Mn) Comparison by End-Use Industry (2016-2032)
- Table 95: APAC Simulation Software Market Market Y-o-Y Growth Rate Comparison by Country (2016-2032)
- Table 96: APAC Simulation Software Market Market Y-o-Y Growth Rate Comparison by Deployment Mode (2016-2032)
- Table 97: APAC Simulation Software Market Market Y-o-Y Growth Rate Comparison by Component (2016-2032)
- Table 98: APAC Simulation Software Market Market Y-o-Y Growth Rate Comparison by Application (2016-2032)
- Table 99: APAC Simulation Software Market Market Y-o-Y Growth Rate Comparison by End-Use Industry (2016-2032)
- Table 100: APAC Simulation Software Market Market Share Comparison by Country (2016-2032)
- Table 101: APAC Simulation Software Market Market Share Comparison by Deployment Mode (2016-2032)
- Table 102: APAC Simulation Software Market Market Share Comparison by Component (2016-2032)
- Table 103: APAC Simulation Software Market Market Share Comparison by Application (2016-2032)
- Table 104: APAC Simulation Software Market Market Share Comparison by End-Use Industry (2016-2032)
- Table 105: Latin America Simulation Software Market Market Comparison by Deployment Mode (2016-2032)
- Table 106: Latin America Simulation Software Market Market Comparison by Component (2016-2032)
- Table 107: Latin America Simulation Software Market Market Comparison by Application (2016-2032)
- Table 108: Latin America Simulation Software Market Market Comparison by End-Use Industry (2016-2032)
- Table 109: Latin America Simulation Software Market Revenue (US$ Mn) Comparison by Country (2016-2032)
- Table 110: Latin America Simulation Software Market Market Revenue (US$ Mn) (2016-2032)
- Table 111: Latin America Simulation Software Market Market Revenue (US$ Mn) Comparison by Country (2016-2032)
- Table 112: Latin America Simulation Software Market Market Revenue (US$ Mn) Comparison by Deployment Mode (2016-2032)
- Table 113: Latin America Simulation Software Market Market Revenue (US$ Mn) Comparison by Component (2016-2032)
- Table 114: Latin America Simulation Software Market Market Revenue (US$ Mn) Comparison by Application (2016-2032)
- Table 115: Latin America Simulation Software Market Market Revenue (US$ Mn) Comparison by End-Use Industry (2016-2032)
- Table 116: Latin America Simulation Software Market Market Y-o-Y Growth Rate Comparison by Country (2016-2032)
- Table 117: Latin America Simulation Software Market Market Y-o-Y Growth Rate Comparison by Deployment Mode (2016-2032)
- Table 118: Latin America Simulation Software Market Market Y-o-Y Growth Rate Comparison by Component (2016-2032)
- Table 119: Latin America Simulation Software Market Market Y-o-Y Growth Rate Comparison by Application (2016-2032)
- Table 120: Latin America Simulation Software Market Market Y-o-Y Growth Rate Comparison by End-Use Industry (2016-2032)
- Table 121: Latin America Simulation Software Market Market Share Comparison by Country (2016-2032)
- Table 122: Latin America Simulation Software Market Market Share Comparison by Deployment Mode (2016-2032)
- Table 123: Latin America Simulation Software Market Market Share Comparison by Component (2016-2032)
- Table 124: Latin America Simulation Software Market Market Share Comparison by Application (2016-2032)
- Table 125: Latin America Simulation Software Market Market Share Comparison by End-Use Industry (2016-2032)
- Table 126: Middle East & Africa Simulation Software Market Market Comparison by Deployment Mode (2016-2032)
- Table 127: Middle East & Africa Simulation Software Market Market Comparison by Component (2016-2032)
- Table 128: Middle East & Africa Simulation Software Market Market Comparison by Application (2016-2032)
- Table 129: Middle East & Africa Simulation Software Market Market Comparison by End-Use Industry (2016-2032)
- Table 130: Middle East & Africa Simulation Software Market Revenue (US$ Mn) Comparison by Country (2016-2032)
- Table 131: Middle East & Africa Simulation Software Market Market Revenue (US$ Mn) (2016-2032)
- Table 132: Middle East & Africa Simulation Software Market Market Revenue (US$ Mn) Comparison by Country (2016-2032)
- Table 133: Middle East & Africa Simulation Software Market Market Revenue (US$ Mn) Comparison by Deployment Mode (2016-2032)
- Table 134: Middle East & Africa Simulation Software Market Market Revenue (US$ Mn) Comparison by Component (2016-2032)
- Table 135: Middle East & Africa Simulation Software Market Market Revenue (US$ Mn) Comparison by Application (2016-2032)
- Table 136: Middle East & Africa Simulation Software Market Market Revenue (US$ Mn) Comparison by End-Use Industry (2016-2032)
- Table 137: Middle East & Africa Simulation Software Market Market Y-o-Y Growth Rate Comparison by Country (2016-2032)
- Table 138: Middle East & Africa Simulation Software Market Market Y-o-Y Growth Rate Comparison by Deployment Mode (2016-2032)
- Table 139: Middle East & Africa Simulation Software Market Market Y-o-Y Growth Rate Comparison by Component (2016-2032)
- Table 140: Middle East & Africa Simulation Software Market Market Y-o-Y Growth Rate Comparison by Application (2016-2032)
- Table 141: Middle East & Africa Simulation Software Market Market Y-o-Y Growth Rate Comparison by End-Use Industry (2016-2032)
- Table 142: Middle East & Africa Simulation Software Market Market Share Comparison by Country (2016-2032)
- Table 143: Middle East & Africa Simulation Software Market Market Share Comparison by Deployment Mode (2016-2032)
- Table 144: Middle East & Africa Simulation Software Market Market Share Comparison by Component (2016-2032)
- Table 145: Middle East & Africa Simulation Software Market Market Share Comparison by Application (2016-2032)
- Table 146: Middle East & Africa Simulation Software Market Market Share Comparison by End-Use Industry (2016-2032)
- 1. Executive Summary
-
Our Clients


View Our Licence Options
