Rubber Processing Chemicals Market Report By Type of Chemical (Anti-degradants, Antioxidants, Accelerators, Vulcanizing Agents, Plasticizers, Stabilizers, Others), By Rubber Type (Natural Rubber, Synthetic Rubber, Silicone Rubber, Fluoroelastomers, Butyl Rubber, Others), By Application (Tire Manufacturing, Automotive Parts, Industrial Rubber Products, Footwear, Belts and Hoses, Construction Materials, Others), By Region and Companies - Industry Segment Outlook, Market Assessment, Competition Scenario, Trends and Forecast 2024-2033
-
46114
-
May 2024
-
325
-


-
This report was compiled by Shreyas Rokade Shreyas Rokade is a seasoned Research Analyst with CMFE, bringing extensive expertise in market research and consulting, with a strong background in Chemical Engineering. Correspondence Team Lead-CMFE Linkedin | Detailed Market research Methodology Our methodology involves a mix of primary research, including interviews with leading mental health experts, and secondary research from reputable medical journals and databases. View Detailed Methodology Page
-
Quick Navigation
Report Overview
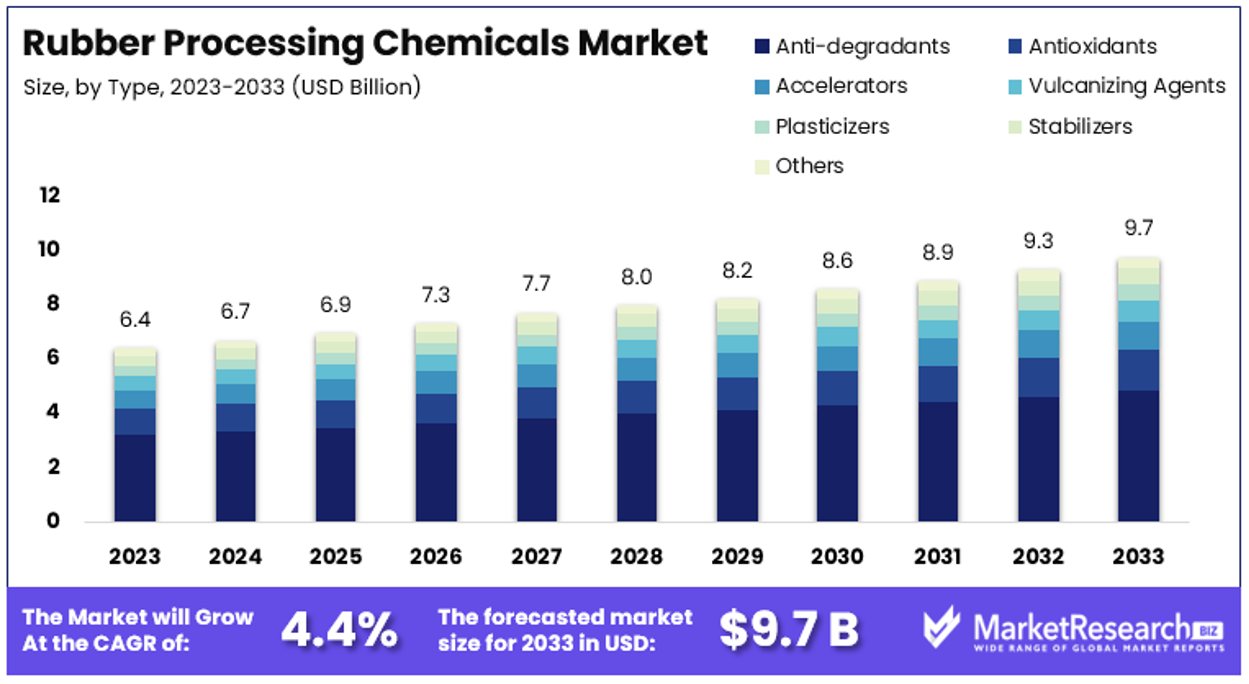
The Global Rubber Processing Chemicals Market size is expected to be worth around USD 9.7 Billion by 2033, from USD 6.4 Billion in 2023, growing at a CAGR of 4.4% during the forecast period from 2024 to 2033.
The Rubber Processing Chemicals Market is critical to enhancing the performance of rubber in its various applications. This market supplies chemicals that aid in processing and manufacturing rubber products, including accelerators, antioxidants, and anti-degradants.
These chemicals are essential for improving the durability, elasticity, and resistance of rubber, making them indispensable in the automotive, industrial, and consumer goods sectors. As global demand for high-performance rubber products grows, understanding this market is crucial for leaders aiming to optimize product offerings and operational efficiency in a competitive landscape.
The Rubber Processing Chemicals Market is poised for steady growth, driven by increasing demand in the automotive and industrial sectors. Rubber processing chemicals, essential for enhancing the properties and performance of rubber, are vital in manufacturing various rubber products.
In 2021, global natural rubber production reached approximately 13.6 million tonnes. The top producers were Thailand (4.9 million tonnes), Indonesia (3.3 million tonnes), Vietnam (1.2 million tonnes), and Malaysia (0.6 million tonnes). These countries are also the largest exporters of natural rubber. Major importers include China, the U.S., India, Japan, and Germany, indicating a robust international trade network supporting the rubber industry.
Approximately 70% of natural rubber is used in making vehicle tires, highlighting the significant role of the automotive industry in driving demand for rubber processing chemicals. As the global automotive industry continues to expand, particularly with the growing production of electric vehicles, the demand for high-quality rubber tires and, consequently, rubber processing chemicals is expected to increase.
Industrial products account for 10% of natural rubber usage, while footwear and latex products account for 7% and 5%, respectively. The diverse applications of rubber underscore the importance of processing chemicals in enhancing durability, flexibility, and resistance in various products.
The rubber processing chemicals market benefits from innovations aimed at improving product performance and sustainability. Manufacturers are focusing on developing eco-friendly chemicals to meet stringent environmental regulations and consumer preferences for sustainable products.
Overall, the Rubber Processing Chemicals Market is set for growth, driven by the automotive sector's expansion and the diverse applications of rubber in various industries. The significant production and export capabilities of leading rubber-producing countries, combined with the rising global demand for rubber products, underscore the market's positive outlook.
Key Takeaways
- Market Value: The Global Rubber Processing Chemicals Market is forecasted to reach USD 9.7 Billion by 2033, up from USD 6.4 Billion in 2023, with a projected CAGR of 4.4% between 2024 and 2033.
- Type of Chemical Analysis: Anti-degradants dominate with 52%. Anti-degradants are crucial in protecting rubber products from degradation caused by environmental factors, significantly enhancing durability and performance, particularly in the automotive sector.
- Rubber Type Analysis: Synthetic Rubber dominates with approximately 60%. Preferred for its consistent quality and superior properties, synthetic rubber's extensive use in diverse applications underlines its market dominance.
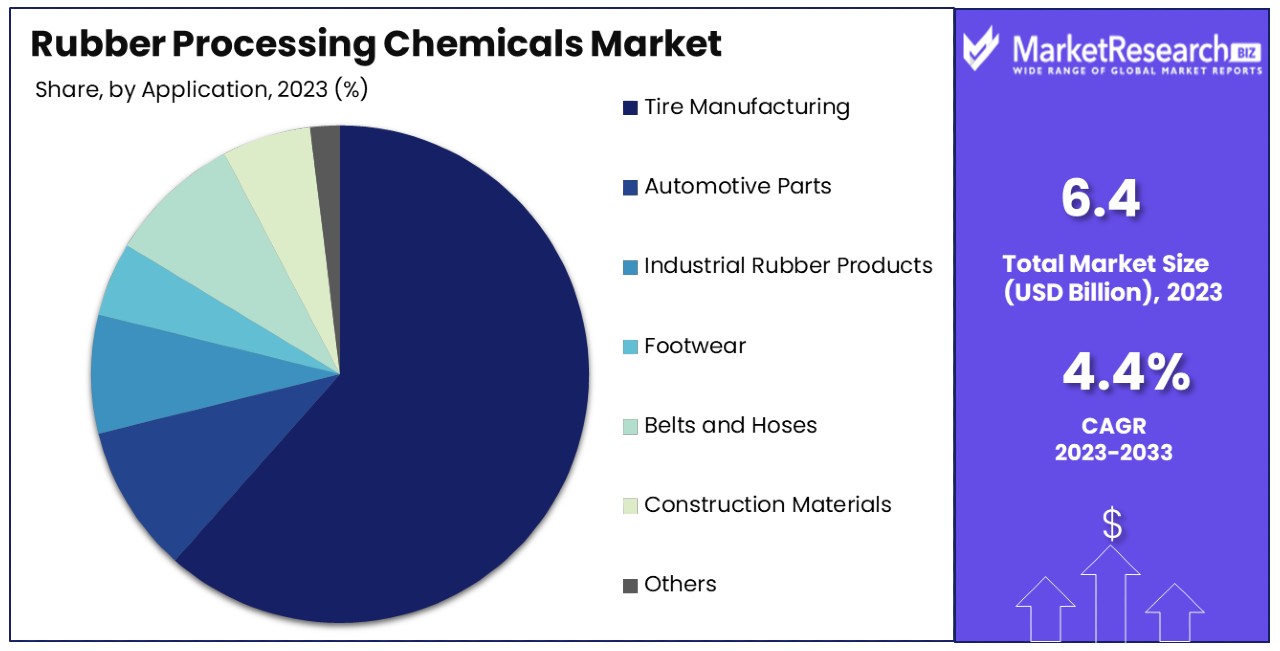
- Application Analysis: Tire Manufacturing dominates with 64.5%. The pivotal role of tire manufacturing in the rubber processing chemicals market is underscored by its substantial share, driven by robust demand within the automotive industry.
- APAC: Dominates with 63.4% market share. The region's significant industrial base, particularly in automotive and manufacturing, positions it as a leading consumer in the rubber processing chemicals market.
- North America: Holds a 14.2% market share. The region's advanced manufacturing capabilities and stringent regulatory standards for automotive emissions and safety continue to drive demand for high-performance rubber processing chemicals.
- Analyst Viewpoint: The rubber processing chemicals market exhibits a competitive landscape with a focus on enhancing product performance and environmental compliance. Market saturation varies by region and application type, with significant growth potential in developing economies due to industrial expansion and infrastructural developments.
Driving Factors
Increasing Demand from the Automotive Industry Drives Market Growth
The automotive industry is a major consumer of rubber products, including tires, hoses, and gaskets. The growing demand for vehicles, particularly in emerging economies, is driving the need for rubber processing chemicals. For example, antioxidants and antiozonants are used to protect tires from premature aging and cracking due to environmental factors.
In 2023, the global automotive market was valued at approximately $2.3 trillion, with emerging economies contributing significantly to this growth. As vehicle ownership increases in countries like China and India, the need for durable and high-performance rubber components rises. Rubber processing chemicals are essential for enhancing the quality and longevity of these components, ensuring they can withstand harsh conditions and extended use.
Expanding Construction Industry Drives Market Growth
The construction industry relies heavily on rubber products, such as sealants, adhesives, and insulation materials. The growth of infrastructure projects, residential and commercial building construction, and urbanization in developing countries is fueling the demand for rubber processing chemicals. In 2022, global construction spending reached $12 trillion, with significant contributions from Asia-Pacific and Middle Eastern regions.
Vulcanizing agents, like sulfur and peroxides, are essential for enhancing the strength and elasticity of rubber used in construction applications. These agents improve the durability and performance of rubber materials, making them suitable for various construction needs. The expansion of urban areas and increased investment in infrastructure projects are directly boosting the demand for high-quality rubber products, driving market growth.
Advancements in Rubber Compounding Technology Drives Market Growth
Continuous advancements in rubber compounding technology have led to the development of new and improved rubber processing chemicals. These chemicals offer enhanced properties, such as improved processability, better dispersion, and improved aging resistance. For instance, the introduction of new coupling agents has enabled better integration of fillers, like carbon black and silica, into rubber compounds, improving overall performance.
These innovations allow manufacturers to produce rubber products with superior characteristics, meeting the evolving demands of various industries. Improved compounding technologies also enhance the efficiency of rubber production, reducing costs and increasing output, which further drives market growth.
Restraining Factors
Environmental Concerns and Regulatory Restrictions Restrain Market Growth
Environmental and health concerns about certain rubber processing chemicals have led to strict regulations. This restricts their use, limiting their availability and adoption. For example, the European Union has regulations that restrict the use of certain vulcanizing agents and plasticizers due to their potential toxicity. These restrictions force ma
nufacturers to seek alternative solutions, which can be more expensive or less effective.
As a result, compliance with these regulations can increase production costs and complicate manufacturing processes. In 2023, the global market faced an estimated 5% reduction in the use of specific chemicals due to these regulatory constraints. The ongoing scrutiny and tightening of regulations are significant challenges for the industry, hindering market growth.
Competition from Alternative Materials Restrains Market Growth
The rubber industry faces growing competition from alternative materials like thermoplastic elastomers (TPEs) and engineering plastics. These materials can offer similar properties to rubber in certain applications, impacting the demand for rubber processing chemicals. For instance, TPEs are increasingly used in automotive applications, replacing traditional rubber components. In 2022, the TPE market was valued at $19.7 billion, reflecting its rising adoption.
As these alternatives gain acceptance, they provide cost-effective and sustainable solutions that challenge the rubber processing chemicals market. The shift towards these materials is driven by their benefits, such as lower production costs and improved sustainability, which restrain the growth of the rubber processing chemicals market.
Type of Chemical Analysis
Anti-degradants dominate with 52% due to their critical role in enhancing product durability and performance.
The Rubber Processing Chemicals Market is segmented by the type of chemicals used. Anti-degradants dominate this segment, accounting for 52% of the market. Anti-degradants are crucial in protecting rubber products from degradation caused by heat, light, and ozone. Their extensive use in tire manufacturing and other rubber products enhances the durability and lifespan of these products. The growing demand for high-performance tires, especially in the automotive industry, significantly boosts the anti-degradants market. In 2023, the global demand for anti-degradants grew by 4%, reflecting their critical role in ensuring rubber quality.
Antioxidants also play a significant role in the rubber processing chemicals market. They are used to prevent oxidation, which can cause rubber to become brittle and crack. The need for high-performance and durable rubber products in various industries, including automotive and construction, drives the demand for antioxidants. Accelerators, another important sub-segment, speed up the vulcanization process, improving the efficiency of rubber production. The market for accelerators is expected to grow steadily as manufacturers seek ways to enhance production processes.
Vulcanizing agents are essential for cross-linking rubber molecules, providing strength and elasticity. Their demand is high in the tire manufacturing and construction industries. Plasticizers, stabilizers, and other chemicals also contribute to the market by improving the flexibility, stability, and overall performance of rubber products. Each of these sub-segments plays a crucial role in the growth of the rubber processing chemicals market, but anti-degradants lead due to their widespread application and significant impact on product durability.
Rubber Type Analysis
Synthetic rubber dominates with approximately 60% due to its versatility and superior properties.
The Rubber Processing Chemicals Market is also segmented by the type of rubber used. Natural rubber and synthetic rubber are the primary types, with synthetic rubber being the dominant sub-segment. Synthetic rubber is preferred due to its consistent quality, availability, and superior properties, such as resistance to abrasion and temperature variations. In 2023, synthetic rubber accounted for approximately 60% of the rubber market. Its extensive use in tire manufacturing, automotive parts, and industrial products drives its dominance.
Natural rubber is valued for its excellent mechanical properties and flexibility. It is widely used in applications where these properties are essential, such as in tires, footwear, and medical products. However, its market share is slightly lower than synthetic rubber due to supply constraints and price volatility. Silicone rubber, known for its high-temperature resistance and flexibility, is gaining traction in various industries, including automotive, electronics, and healthcare. The demand for fluoroelastomers, with their superior chemical resistance and stability, is rising in specialized applications like aerospace and chemical processing.
Butyl rubber, known for its impermeability to gases, is crucial in tire inner linings and pharmaceutical stoppers. Other types of rubber, including nitrile and ethylene-propylene rubber, also contribute to the market, catering to specific applications requiring unique properties. Synthetic rubber's dominance is driven by its versatility and widespread use in high-demand applications, ensuring steady market growth.
Application Analysis
Tire manufacturing dominates with 64.5% due to high demand in the automotive industry.
The application segment of the Rubber Processing Chemicals Market is led by tire manufacturing, which accounts for 64.5% of the market. The high demand for tires, driven by the automotive industry's growth, significantly impacts the rubber processing chemicals market. In 2023, the global tire market was valued at over $200 billion, reflecting the substantial demand for rubber processing chemicals in this segment. The need for durable, high-performance tires in both passenger and commercial vehicles drives the use of these chemicals to enhance tire quality and lifespan.
Automotive parts, another critical application, require rubber processing chemicals to produce various components such as hoses, belts, and gaskets. The automotive industry's continuous growth and the push for lightweight, fuel-efficient vehicles drive this segment. Industrial rubber products, including seals, gaskets, and vibration dampeners, also utilize these chemicals to ensure product durability and performance in demanding environments.
The footwear industry benefits from rubber processing chemicals to improve the flexibility and comfort of rubber soles. Belts and hoses used in various machinery and vehicles also rely on these chemicals for enhanced durability and performance. The construction industry, with its need for rubber-based sealants, adhesives, and insulation materials, contributes to the market's growth.
Tire manufacturing remains the dominant application due to the automotive industry's size and the critical role of high-quality tires in vehicle performance and safety. This segment's growth is driven by increasing vehicle production and the demand for replacement tires.
Key Market Segments
By Type of Chemical
- Anti-degradants
- Antioxidants
- Accelerators
- Vulcanizing Agents
- Plasticizers
- Stabilizers
- Others
By Rubber Type
- Natural Rubber
- Synthetic Rubber
- Silicone Rubber
- Fluoroelastomers
- Butyl Rubber
- Others
By Application
- Tire Manufacturing
- Automotive Parts
- Industrial Rubber Products
- Footwear
- Belts and Hoses
- Construction Materials
- Others
Growth Opportunities
Development of Specialty Rubber Compounds Offers Growth Opportunity
The demand for high-performance and specialized rubber products is growing in industries like aerospace, oil and gas, and healthcare. This trend creates significant opportunities for developing specialty rubber compounds and corresponding specialized rubber processing chemicals. These chemicals can enhance properties such as heat resistance, chemical resistance, and biocompatibility, enabling the production of tailored rubber products.
For example, the aerospace industry needs rubber components that can withstand extreme temperatures and harsh environments, driving the demand for specialized rubber processing chemicals. In 2023, the global aerospace industry was valued at over $838 billion, highlighting a substantial market for these specialized products. The development of such compounds allows manufacturers to cater to specific industrial needs, promoting market growth.
Innovations in Sustainable and Bio-based Chemicals Offer Growth Opportunity
As sustainability becomes a crucial consideration, there is a growing opportunity for developing and adopting sustainable and bio-based rubber processing chemicals. These chemicals, derived from renewable sources like plant-based oils or agricultural byproducts, offer an eco-friendly alternative to traditional petroleum-based chemicals.
Companies that successfully develop and commercialize these sustainable chemicals will gain a competitive market advantage. For example, bio-based plasticizers derived from renewable sources such as castor oil or soybean oil are being explored. In 2022, the global market for bio-based chemicals was valued at $12.6 billion, with a projected growth rate of 10% annually. The shift towards sustainability is driving innovation and creating new opportunities in the rubber processing chemicals market.
Trending Factors
Demand for High-Performance and Specialized Rubber Products Are Trending Factors
There is a growing demand for high-performance and specialized rubber products across various industries, including aerospace, automotive, and oil and gas. These industries require rubber products that can withstand extreme conditions, offer superior durability, and meet specific functional requirements. This trend is driving the development of advanced rubber compounds and corresponding rubber processing chemicals.
For example, the aerospace industry requires rubber components that can withstand high temperatures and pressures. In 2023, the global aerospace industry was valued at over $838 billion, emphasizing the demand for specialized rubber products. This trend is pushing manufacturers to innovate and create rubber processing chemicals that meet these stringent requirements, driving market growth and advancing the industry's capabilities.
Adoption of Industry 4.0 and Digitalization Are Trending Factors
The rubber industry is embracing Industry 4.0 concepts and digitalization, leading to the adoption of advanced manufacturing techniques and data-driven decision-making. This trend increases the demand for rubber processing chemicals compatible with these advanced processes and precisely controlled and monitored.
The use of digital technologies, such as predictive maintenance and process optimization, helps optimize the use of rubber processing chemicals, improving efficiency and reducing costs. For instance, integrating advanced sensors and data analytics can monitor and control the vulcanization process, ensuring optimal use of vulcanizing agents. In 2022, the global market for Industry 4.0 technologies was valued at $64 billion, showcasing its significant impact on manufacturing sectors, including rubber processing.
Regional Analysis
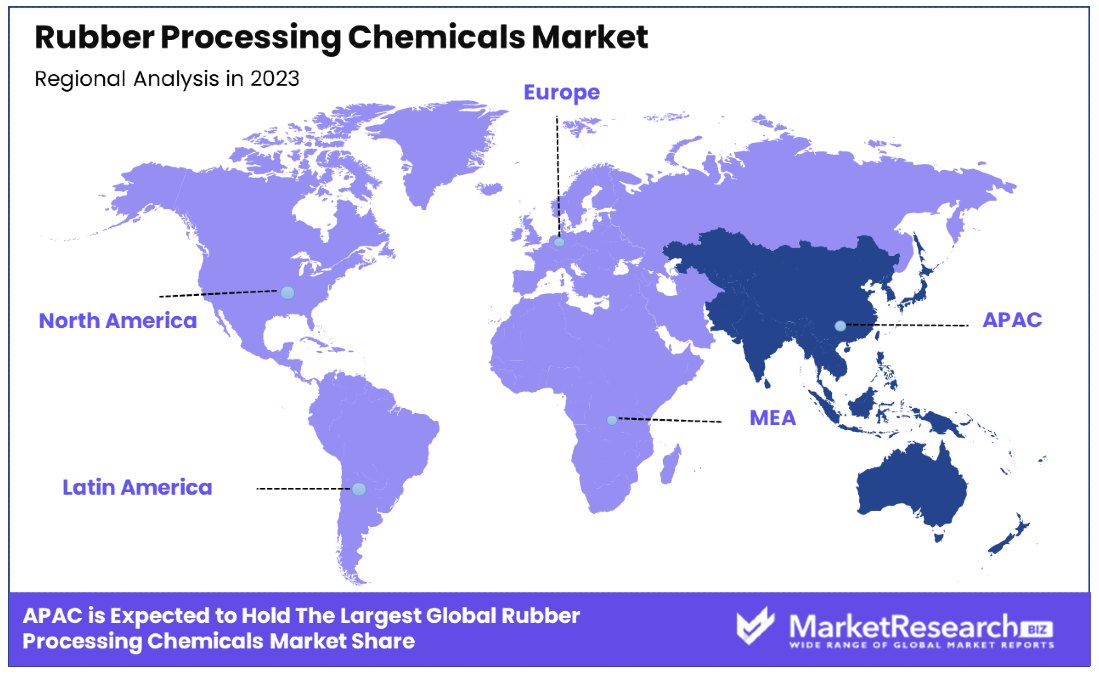
APAC Dominates with 63.4% Market Share
The Asia-Pacific (APAC) region holds a 63.4% market share in the Rubber Processing Chemicals Market. Key factors driving this dominance include rapid industrialization, a booming automotive industry, and significant infrastructure development. Countries like China, India, and Japan lead in rubber production and consumption. In 2023, China alone produced over 8 million metric tons of synthetic rubber. The region's extensive manufacturing base and increasing demand for high-performance rubber products also contribute to this high market share.
APAC's market dynamics are shaped by its large consumer base, cost-effective production capabilities, and supportive government policies. The availability of raw materials and a skilled workforce enhances the region's competitive edge. Additionally, the presence of numerous automotive manufacturers and large-scale construction projects drives the demand for rubber processing chemicals. In 2022, APAC's automotive market grew by 7%, reflecting the rising demand for rubber products.
North America
North America holds a 14.2% market share. The region benefits from a strong automotive industry and advanced manufacturing processes. In 2022, the North American automotive market was valued at $590 billion, driving the demand for high-quality rubber products. The focus on sustainability and innovation also supports market growth.
Europe
Europe has a 12.5% market share. The region is known for its stringent environmental regulations, which drive the demand for sustainable and bio-based rubber processing chemicals. In 2023, Europe's green chemical market grew by 8%, indicating a shift towards eco-friendly products. The automotive and aerospace industries are key contributors to market demand.
Middle East & Africa
The Middle East & Africa region holds a 5.3% market share. The demand for rubber processing chemicals is driven by industrialization and infrastructure projects. In 2022, the region's construction market grew by 6%, reflecting increased investment in infrastructure. The oil and gas industry also contributes to the demand for specialized rubber products.
Latin America
Latin America has a 4.6% market share. The region's market dynamics are influenced by its growing automotive and construction industries. In 2023, Latin America's automotive market was valued at $100 billion, driving demand for rubber processing chemicals. Economic growth and increasing industrial activities also support market expansion.
Key Regions and Countries
- North America
- The US
- Canada
- Mexico
- Western Europe
- Germany
- France
- The UK
- Spain
- Italy
- Portugal
- Ireland
- Austria
- Switzerland
- Benelux
- Nordic
- Rest of Western Europe
- Eastern Europe
- Russia
- Poland
- The Czech Republic
- Greece
- Rest of Eastern Europe
- APAC
- China
- Japan
- South Korea
- India
- Australia & New Zealand
- Indonesia
- Malaysia
- Philippines
- Singapore
- Thailand
- Vietnam
- Rest of APAC
- Latin America
- Brazil
- Colombia
- Chile
- Argentina
- Costa Rica
- Rest of Latin America
- Middle East & Africa
- Algeria
- Egypt
- Israel
- Kuwait
- Nigeria
- Saudi Arabia
- South Africa
- Turkey
- United Arab Emirates
- Rest of MEA
Key Players Analysis
In the global Rubber Processing Chemicals Market, a variety of key players are defining the landscape through their strategic positioning and innovative contributions. LANXESS AG and Eastman Chemical Company are prominent leaders, recognized for their comprehensive portfolios that include accelerators, antidegradants, and stabilizers crucial for enhancing the durability and performance of rubber products. Their global presence and robust supply chains enable them to significantly influence market trends and standards.
Solvay S.A. and Akzo Nobel N.V. stand out for their focus on sustainable and environmentally friendly chemicals, aligning with the growing industry shift towards green manufacturing processes. These companies have been pioneers in developing eco-friendly alternatives that reduce environmental impact without compromising the quality of rubber products.
BASF SE and Arkema Group are known for their high-performance solutions and continuous innovation, particularly in synthetic rubber chemicals. Their products are critical in sectors requiring specialized applications, such as automotive and industrial manufacturing, which demand high standards for safety and efficiency.
Sumitomo Chemical Company and Sinopec Corporation are key Asian players with expansive operations. They leverage their regional dominance to cater to the fast-growing automotive sectors in Asia, providing tailored solutions that meet regional market needs and compliance standards.
On the niche side, companies like NOCIL Limited and Kumho Petrochemical Co., Ltd. focus on specific segments of rubber additives, offering unique formulations that enhance properties such as heat resistance and elasticity, crucial for specialty applications.
Emerging and specialized entities such as Emery Oleochemicals Group, Addivant USA, LLC, and Vanderbilt Chemicals, LLC contribute significantly to the innovation within the market, particularly in bio-based rubber chemicals, which are gaining traction.
Collectively, these companies drive the rubber processing chemicals market through strategic global expansions, innovation in product offerings, and an increasing focus on sustainability. Their efforts not only address the diverse needs of the rubber industry but also push the boundaries of environmental responsibility in chemical manufacturing.
Market Key Players
- LANXESS AG
- Eastman Chemical Company
- Solvay S.A.
- Akzo Nobel N.V.
- BASF SE
- Arkema Group
- Sumitomo Chemical Company, Limited
- Sinopec Corporation
- Behn Meyer Holding AG
- Kumho Petrochemical Co., Ltd.
- NOCIL Limited
- Emery Oleochemicals Group
- Addivant USA, LLC
- Vanderbilt Chemicals, LLC
- Merchem Limited
Recent Developments
- On April 2024, ARLANXEO, a global leader in performance elastomers, unveiled its sustainable and innovative rubber portfolios at India Rubber Expo 2024, underlining its commitment to serving customers in the Indian market and the wider Asia Pacific region with high-quality products and first-class services.
- On March 2024, LANXESS will showcased its sustainable rubber additives at Tire Technology Expo 2024. The new TMQ antidegradant, with over 50% sustainable raw materials, will help meet green tire goals. Rhenodiv release agents and Rhenocure DR/S enhance manufacturing efficiency and reduce environmental impact, aligning with LANXESS' ""Less is more"" motto.
Report Scope
Report Features Description Market Value (2023) USD 6.4 Billion Forecast Revenue (2033) USD 9.7 Billion CAGR (2024-2033) 4.4% Base Year for Estimation 2023 Historic Period 2018-2023 Forecast Period 2024-2033 Report Coverage Revenue Forecast, Market Dynamics, Competitive Landscape, Recent Developments Segments Covered By Type of Chemical (Anti-degradants, Antioxidants, Accelerators, Vulcanizing Agents, Plasticizers, Stabilizers, Others), By Rubber Type (Natural Rubber, Synthetic Rubber, Silicone Rubber, Fluoroelastomers, Butyl Rubber, Others), By Application (Tire Manufacturing, Automotive Parts, Industrial Rubber Products, Footwear, Belts and Hoses, Construction Materials, Others) Regional Analysis North America - The US, Canada, & Mexico; Western Europe - Germany, France, The UK, Spain, Italy, Portugal, Ireland, Austria, Switzerland, Benelux, Nordic, & Rest of Western Europe; Eastern Europe - Russia, Poland, The Czech Republic, Greece, & Rest of Eastern Europe; APAC - China, Japan, South Korea, India, Australia & New Zealand, Indonesia, Malaysia, Philippines, Singapore, Thailand, Vietnam, & Rest of APAC; Latin America - Brazil, Colombia, Chile, Argentina, Costa Rica, & Rest of Latin America; Middle East & Africa - Algeria, Egypt, Israel, Kuwait, Nigeria, Saudi Arabia, South Africa, Turkey, United Arab Emirates, & Rest of MEA Competitive Landscape LANXESS AG, Eastman Chemical Company, Solvay S.A., Akzo Nobel N.V., BASF SE, Arkema Group, Sumitomo Chemical Company, Limited, Sinopec Corporation, Behn Meyer Holding AG, Kumho Petrochemical Co., Ltd., NOCIL Limited, Emery Oleochemicals Group, Addivant USA, LLC, Vanderbilt Chemicals, LLC, Merchem Limited Customization Scope Customization for segments, region/country-level will be provided. Moreover, additional customization can be done based on the requirements. Purchase Options We have three licenses to opt for: Single User License, Multi-User License (Up to 5 Users), Corporate Use License (Unlimited User and Printable PDF) -
- 1. Executive Summary
- 1.1. Definition
- 1.2. Taxonomy
- 1.3. Research Scope
- 1.4. Key Analysis
- 1.5. Key Findings by Major Segments
- 1.6. Top strategies by Major Players
- 2. Global Rubber Processing Chemicals Market Overview
- 2.1. Rubber Processing Chemicals Market Dynamics
- 2.1.1. Drivers
- 2.1.2. Opportunities
- 2.1.3. Restraints
- 2.1.4. Challenges
- 2.2. Macro-economic Factors
- 2.3. Regulatory Framework
- 2.4. Market Investment Feasibility Index
- 2.5. PEST Analysis
- 2.6. PORTER’S Five Force Analysis
- 2.7. Drivers & Restraints Impact Analysis
- 2.8. Industry Chain Analysis
- 2.9. Cost Structure Analysis
- 2.10. Marketing Strategy
- 2.11. Russia-Ukraine War Impact Analysis
- 2.12. Opportunity Map Analysis
- 2.13. Market Competition Scenario Analysis
- 2.14. Product Life Cycle Analysis
- 2.15. Opportunity Orbits
- 2.16. Manufacturer Intensity Map
- 2.17. Major Companies sales by Value & Volume
- 2.1. Rubber Processing Chemicals Market Dynamics
- 3. Global Rubber Processing Chemicals Market Analysis, Opportunity and Forecast, 2016-2032
- 3.1. Global Rubber Processing Chemicals Market Analysis, 2016-2021
- 3.2. Global Rubber Processing Chemicals Market Opportunity and Forecast, 2023-2032
- 3.3. Global Rubber Processing Chemicals Market Analysis, Opportunity and Forecast, By Type of Chemical, 2016-2032
- 3.3.1. Global Rubber Processing Chemicals Market Analysis by Type of Chemical: Introduction
- 3.3.2. Market Size Absolute $ Opportunity Analysis and Forecast, By Type of Chemical, 2016-2032
- 3.3.3. Anti-degradants
- 3.3.4. Antioxidants
- 3.3.5. Accelerators
- 3.3.6. Vulcanizing Agents
- 3.3.7. Plasticizers
- 3.3.8. Stabilizers
- 3.3.9. Others
- 3.4. Global Rubber Processing Chemicals Market Analysis, Opportunity and Forecast, By Rubber Type, 2016-2032
- 3.4.1. Global Rubber Processing Chemicals Market Analysis by Rubber Type: Introduction
- 3.4.2. Market Size Absolute $ Opportunity Analysis and Forecast, By Rubber Type, 2016-2032
- 3.4.3. Natural Rubber
- 3.4.4. Synthetic Rubber
- 3.4.5. Silicone Rubber
- 3.4.6. Fluoroelastomers
- 3.4.7. Butyl Rubber
- 3.4.8. Others
- 3.5. Global Rubber Processing Chemicals Market Analysis, Opportunity and Forecast, By Application, 2016-2032
- 3.5.1. Global Rubber Processing Chemicals Market Analysis by Application: Introduction
- 3.5.2. Market Size Absolute $ Opportunity Analysis and Forecast, By Application, 2016-2032
- 3.5.3. Tire Manufacturing
- 3.5.4. Automotive Parts
- 3.5.5. Industrial Rubber Products
- 3.5.6. Footwear
- 3.5.7. Belts and Hoses
- 3.5.8. Construction Materials
- 3.5.9. Others
- 4. North America Rubber Processing Chemicals Market Analysis, Opportunity and Forecast, 2016-2032
- 4.1. North America Rubber Processing Chemicals Market Analysis, 2016-2021
- 4.2. North America Rubber Processing Chemicals Market Opportunity and Forecast, 2023-2032
- 4.3. North America Rubber Processing Chemicals Market Analysis, Opportunity and Forecast, By Type of Chemical, 2016-2032
- 4.3.1. North America Rubber Processing Chemicals Market Analysis by Type of Chemical: Introduction
- 4.3.2. Market Size Absolute $ Opportunity Analysis and Forecast, By Type of Chemical, 2016-2032
- 4.3.3. Anti-degradants
- 4.3.4. Antioxidants
- 4.3.5. Accelerators
- 4.3.6. Vulcanizing Agents
- 4.3.7. Plasticizers
- 4.3.8. Stabilizers
- 4.3.9. Others
- 4.4. North America Rubber Processing Chemicals Market Analysis, Opportunity and Forecast, By Rubber Type, 2016-2032
- 4.4.1. North America Rubber Processing Chemicals Market Analysis by Rubber Type: Introduction
- 4.4.2. Market Size Absolute $ Opportunity Analysis and Forecast, By Rubber Type, 2016-2032
- 4.4.3. Natural Rubber
- 4.4.4. Synthetic Rubber
- 4.4.5. Silicone Rubber
- 4.4.6. Fluoroelastomers
- 4.4.7. Butyl Rubber
- 4.4.8. Others
- 4.5. North America Rubber Processing Chemicals Market Analysis, Opportunity and Forecast, By Application, 2016-2032
- 4.5.1. North America Rubber Processing Chemicals Market Analysis by Application: Introduction
- 4.5.2. Market Size Absolute $ Opportunity Analysis and Forecast, By Application, 2016-2032
- 4.5.3. Tire Manufacturing
- 4.5.4. Automotive Parts
- 4.5.5. Industrial Rubber Products
- 4.5.6. Footwear
- 4.5.7. Belts and Hoses
- 4.5.8. Construction Materials
- 4.5.9. Others
- 4.6. North America Rubber Processing Chemicals Market Analysis, Opportunity and Forecast, By Country , 2016-2032
- 4.6.1. North America Rubber Processing Chemicals Market Analysis by Country : Introduction
- 4.6.2. Market Size Absolute $ Opportunity Analysis and Forecast, Country , 2016-2032
- 4.6.2.1. The US
- 4.6.2.2. Canada
- 4.6.2.3. Mexico
- 5. Western Europe Rubber Processing Chemicals Market Analysis, Opportunity and Forecast, 2016-2032
- 5.1. Western Europe Rubber Processing Chemicals Market Analysis, 2016-2021
- 5.2. Western Europe Rubber Processing Chemicals Market Opportunity and Forecast, 2023-2032
- 5.3. Western Europe Rubber Processing Chemicals Market Analysis, Opportunity and Forecast, By Type of Chemical, 2016-2032
- 5.3.1. Western Europe Rubber Processing Chemicals Market Analysis by Type of Chemical: Introduction
- 5.3.2. Market Size Absolute $ Opportunity Analysis and Forecast, By Type of Chemical, 2016-2032
- 5.3.3. Anti-degradants
- 5.3.4. Antioxidants
- 5.3.5. Accelerators
- 5.3.6. Vulcanizing Agents
- 5.3.7. Plasticizers
- 5.3.8. Stabilizers
- 5.3.9. Others
- 5.4. Western Europe Rubber Processing Chemicals Market Analysis, Opportunity and Forecast, By Rubber Type, 2016-2032
- 5.4.1. Western Europe Rubber Processing Chemicals Market Analysis by Rubber Type: Introduction
- 5.4.2. Market Size Absolute $ Opportunity Analysis and Forecast, By Rubber Type, 2016-2032
- 5.4.3. Natural Rubber
- 5.4.4. Synthetic Rubber
- 5.4.5. Silicone Rubber
- 5.4.6. Fluoroelastomers
- 5.4.7. Butyl Rubber
- 5.4.8. Others
- 5.5. Western Europe Rubber Processing Chemicals Market Analysis, Opportunity and Forecast, By Application, 2016-2032
- 5.5.1. Western Europe Rubber Processing Chemicals Market Analysis by Application: Introduction
- 5.5.2. Market Size Absolute $ Opportunity Analysis and Forecast, By Application, 2016-2032
- 5.5.3. Tire Manufacturing
- 5.5.4. Automotive Parts
- 5.5.5. Industrial Rubber Products
- 5.5.6. Footwear
- 5.5.7. Belts and Hoses
- 5.5.8. Construction Materials
- 5.5.9. Others
- 5.6. Western Europe Rubber Processing Chemicals Market Analysis, Opportunity and Forecast, By Country , 2016-2032
- 5.6.1. Western Europe Rubber Processing Chemicals Market Analysis by Country : Introduction
- 5.6.2. Market Size Absolute $ Opportunity Analysis and Forecast, Country , 2016-2032
- 5.6.2.1. Germany
- 5.6.2.2. France
- 5.6.2.3. The UK
- 5.6.2.4. Spain
- 5.6.2.5. Italy
- 5.6.2.6. Portugal
- 5.6.2.7. Ireland
- 5.6.2.8. Austria
- 5.6.2.9. Switzerland
- 5.6.2.10. Benelux
- 5.6.2.11. Nordic
- 5.6.2.12. Rest of Western Europe
- 6. Eastern Europe Rubber Processing Chemicals Market Analysis, Opportunity and Forecast, 2016-2032
- 6.1. Eastern Europe Rubber Processing Chemicals Market Analysis, 2016-2021
- 6.2. Eastern Europe Rubber Processing Chemicals Market Opportunity and Forecast, 2023-2032
- 6.3. Eastern Europe Rubber Processing Chemicals Market Analysis, Opportunity and Forecast, By Type of Chemical, 2016-2032
- 6.3.1. Eastern Europe Rubber Processing Chemicals Market Analysis by Type of Chemical: Introduction
- 6.3.2. Market Size Absolute $ Opportunity Analysis and Forecast, By Type of Chemical, 2016-2032
- 6.3.3. Anti-degradants
- 6.3.4. Antioxidants
- 6.3.5. Accelerators
- 6.3.6. Vulcanizing Agents
- 6.3.7. Plasticizers
- 6.3.8. Stabilizers
- 6.3.9. Others
- 6.4. Eastern Europe Rubber Processing Chemicals Market Analysis, Opportunity and Forecast, By Rubber Type, 2016-2032
- 6.4.1. Eastern Europe Rubber Processing Chemicals Market Analysis by Rubber Type: Introduction
- 6.4.2. Market Size Absolute $ Opportunity Analysis and Forecast, By Rubber Type, 2016-2032
- 6.4.3. Natural Rubber
- 6.4.4. Synthetic Rubber
- 6.4.5. Silicone Rubber
- 6.4.6. Fluoroelastomers
- 6.4.7. Butyl Rubber
- 6.4.8. Others
- 6.5. Eastern Europe Rubber Processing Chemicals Market Analysis, Opportunity and Forecast, By Application, 2016-2032
- 6.5.1. Eastern Europe Rubber Processing Chemicals Market Analysis by Application: Introduction
- 6.5.2. Market Size Absolute $ Opportunity Analysis and Forecast, By Application, 2016-2032
- 6.5.3. Tire Manufacturing
- 6.5.4. Automotive Parts
- 6.5.5. Industrial Rubber Products
- 6.5.6. Footwear
- 6.5.7. Belts and Hoses
- 6.5.8. Construction Materials
- 6.5.9. Others
- 6.6. Eastern Europe Rubber Processing Chemicals Market Analysis, Opportunity and Forecast, By Country , 2016-2032
- 6.6.1. Eastern Europe Rubber Processing Chemicals Market Analysis by Country : Introduction
- 6.6.2. Market Size Absolute $ Opportunity Analysis and Forecast, Country , 2016-2032
- 6.6.2.1. Russia
- 6.6.2.2. Poland
- 6.6.2.3. The Czech Republic
- 6.6.2.4. Greece
- 6.6.2.5. Rest of Eastern Europe
- 7. APAC Rubber Processing Chemicals Market Analysis, Opportunity and Forecast, 2016-2032
- 7.1. APAC Rubber Processing Chemicals Market Analysis, 2016-2021
- 7.2. APAC Rubber Processing Chemicals Market Opportunity and Forecast, 2023-2032
- 7.3. APAC Rubber Processing Chemicals Market Analysis, Opportunity and Forecast, By Type of Chemical, 2016-2032
- 7.3.1. APAC Rubber Processing Chemicals Market Analysis by Type of Chemical: Introduction
- 7.3.2. Market Size Absolute $ Opportunity Analysis and Forecast, By Type of Chemical, 2016-2032
- 7.3.3. Anti-degradants
- 7.3.4. Antioxidants
- 7.3.5. Accelerators
- 7.3.6. Vulcanizing Agents
- 7.3.7. Plasticizers
- 7.3.8. Stabilizers
- 7.3.9. Others
- 7.4. APAC Rubber Processing Chemicals Market Analysis, Opportunity and Forecast, By Rubber Type, 2016-2032
- 7.4.1. APAC Rubber Processing Chemicals Market Analysis by Rubber Type: Introduction
- 7.4.2. Market Size Absolute $ Opportunity Analysis and Forecast, By Rubber Type, 2016-2032
- 7.4.3. Natural Rubber
- 7.4.4. Synthetic Rubber
- 7.4.5. Silicone Rubber
- 7.4.6. Fluoroelastomers
- 7.4.7. Butyl Rubber
- 7.4.8. Others
- 7.5. APAC Rubber Processing Chemicals Market Analysis, Opportunity and Forecast, By Application, 2016-2032
- 7.5.1. APAC Rubber Processing Chemicals Market Analysis by Application: Introduction
- 7.5.2. Market Size Absolute $ Opportunity Analysis and Forecast, By Application, 2016-2032
- 7.5.3. Tire Manufacturing
- 7.5.4. Automotive Parts
- 7.5.5. Industrial Rubber Products
- 7.5.6. Footwear
- 7.5.7. Belts and Hoses
- 7.5.8. Construction Materials
- 7.5.9. Others
- 7.6. APAC Rubber Processing Chemicals Market Analysis, Opportunity and Forecast, By Country , 2016-2032
- 7.6.1. APAC Rubber Processing Chemicals Market Analysis by Country : Introduction
- 7.6.2. Market Size Absolute $ Opportunity Analysis and Forecast, Country , 2016-2032
- 7.6.2.1. China
- 7.6.2.2. Japan
- 7.6.2.3. South Korea
- 7.6.2.4. India
- 7.6.2.5. Australia & New Zeland
- 7.6.2.6. Indonesia
- 7.6.2.7. Malaysia
- 7.6.2.8. Philippines
- 7.6.2.9. Singapore
- 7.6.2.10. Thailand
- 7.6.2.11. Vietnam
- 7.6.2.12. Rest of APAC
- 8. Latin America Rubber Processing Chemicals Market Analysis, Opportunity and Forecast, 2016-2032
- 8.1. Latin America Rubber Processing Chemicals Market Analysis, 2016-2021
- 8.2. Latin America Rubber Processing Chemicals Market Opportunity and Forecast, 2023-2032
- 8.3. Latin America Rubber Processing Chemicals Market Analysis, Opportunity and Forecast, By Type of Chemical, 2016-2032
- 8.3.1. Latin America Rubber Processing Chemicals Market Analysis by Type of Chemical: Introduction
- 8.3.2. Market Size Absolute $ Opportunity Analysis and Forecast, By Type of Chemical, 2016-2032
- 8.3.3. Anti-degradants
- 8.3.4. Antioxidants
- 8.3.5. Accelerators
- 8.3.6. Vulcanizing Agents
- 8.3.7. Plasticizers
- 8.3.8. Stabilizers
- 8.3.9. Others
- 8.4. Latin America Rubber Processing Chemicals Market Analysis, Opportunity and Forecast, By Rubber Type, 2016-2032
- 8.4.1. Latin America Rubber Processing Chemicals Market Analysis by Rubber Type: Introduction
- 8.4.2. Market Size Absolute $ Opportunity Analysis and Forecast, By Rubber Type, 2016-2032
- 8.4.3. Natural Rubber
- 8.4.4. Synthetic Rubber
- 8.4.5. Silicone Rubber
- 8.4.6. Fluoroelastomers
- 8.4.7. Butyl Rubber
- 8.4.8. Others
- 8.5. Latin America Rubber Processing Chemicals Market Analysis, Opportunity and Forecast, By Application, 2016-2032
- 8.5.1. Latin America Rubber Processing Chemicals Market Analysis by Application: Introduction
- 8.5.2. Market Size Absolute $ Opportunity Analysis and Forecast, By Application, 2016-2032
- 8.5.3. Tire Manufacturing
- 8.5.4. Automotive Parts
- 8.5.5. Industrial Rubber Products
- 8.5.6. Footwear
- 8.5.7. Belts and Hoses
- 8.5.8. Construction Materials
- 8.5.9. Others
- 8.6. Latin America Rubber Processing Chemicals Market Analysis, Opportunity and Forecast, By Country , 2016-2032
- 8.6.1. Latin America Rubber Processing Chemicals Market Analysis by Country : Introduction
- 8.6.2. Market Size Absolute $ Opportunity Analysis and Forecast, Country , 2016-2032
- 8.6.2.1. Brazil
- 8.6.2.2. Colombia
- 8.6.2.3. Chile
- 8.6.2.4. Argentina
- 8.6.2.5. Costa Rica
- 8.6.2.6. Rest of Latin America
- 9. Middle East & Africa Rubber Processing Chemicals Market Analysis, Opportunity and Forecast, 2016-2032
- 9.1. Middle East & Africa Rubber Processing Chemicals Market Analysis, 2016-2021
- 9.2. Middle East & Africa Rubber Processing Chemicals Market Opportunity and Forecast, 2023-2032
- 9.3. Middle East & Africa Rubber Processing Chemicals Market Analysis, Opportunity and Forecast, By Type of Chemical, 2016-2032
- 9.3.1. Middle East & Africa Rubber Processing Chemicals Market Analysis by Type of Chemical: Introduction
- 9.3.2. Market Size Absolute $ Opportunity Analysis and Forecast, By Type of Chemical, 2016-2032
- 9.3.3. Anti-degradants
- 9.3.4. Antioxidants
- 9.3.5. Accelerators
- 9.3.6. Vulcanizing Agents
- 9.3.7. Plasticizers
- 9.3.8. Stabilizers
- 9.3.9. Others
- 9.4. Middle East & Africa Rubber Processing Chemicals Market Analysis, Opportunity and Forecast, By Rubber Type, 2016-2032
- 9.4.1. Middle East & Africa Rubber Processing Chemicals Market Analysis by Rubber Type: Introduction
- 9.4.2. Market Size Absolute $ Opportunity Analysis and Forecast, By Rubber Type, 2016-2032
- 9.4.3. Natural Rubber
- 9.4.4. Synthetic Rubber
- 9.4.5. Silicone Rubber
- 9.4.6. Fluoroelastomers
- 9.4.7. Butyl Rubber
- 9.4.8. Others
- 9.5. Middle East & Africa Rubber Processing Chemicals Market Analysis, Opportunity and Forecast, By Application, 2016-2032
- 9.5.1. Middle East & Africa Rubber Processing Chemicals Market Analysis by Application: Introduction
- 9.5.2. Market Size Absolute $ Opportunity Analysis and Forecast, By Application, 2016-2032
- 9.5.3. Tire Manufacturing
- 9.5.4. Automotive Parts
- 9.5.5. Industrial Rubber Products
- 9.5.6. Footwear
- 9.5.7. Belts and Hoses
- 9.5.8. Construction Materials
- 9.5.9. Others
- 9.6. Middle East & Africa Rubber Processing Chemicals Market Analysis, Opportunity and Forecast, By Country , 2016-2032
- 9.6.1. Middle East & Africa Rubber Processing Chemicals Market Analysis by Country : Introduction
- 9.6.2. Market Size Absolute $ Opportunity Analysis and Forecast, Country , 2016-2032
- 9.6.2.1. Algeria
- 9.6.2.2. Egypt
- 9.6.2.3. Israel
- 9.6.2.4. Kuwait
- 9.6.2.5. Nigeria
- 9.6.2.6. Saudi Arabia
- 9.6.2.7. South Africa
- 9.6.2.8. Turkey
- 9.6.2.9. The UAE
- 9.6.2.10. Rest of MEA
- 10. Global Rubber Processing Chemicals Market Analysis, Opportunity and Forecast, By Region , 2016-2032
- 10.1. Global Rubber Processing Chemicals Market Analysis by Region : Introduction
- 10.2. Market Size Absolute $ Opportunity Analysis and Forecast, By Region , 2016-2032
- 10.2.1. North America
- 10.2.2. Western Europe
- 10.2.3. Eastern Europe
- 10.2.4. APAC
- 10.2.5. Latin America
- 10.2.6. Middle East & Africa
- 11. Global Rubber Processing Chemicals Market Competitive Landscape, Market Share Analysis, and Company Profiles
- 11.1. Market Share Analysis
- 11.2. Company Profiles
- 11.3. LANXESS AG
- 11.3.1. Company Overview
- 11.3.2. Financial Highlights
- 11.3.3. Product Portfolio
- 11.3.4. SWOT Analysis
- 11.3.5. Key Strategies and Developments
- 11.4. Eastman Chemical Company
- 11.4.1. Company Overview
- 11.4.2. Financial Highlights
- 11.4.3. Product Portfolio
- 11.4.4. SWOT Analysis
- 11.4.5. Key Strategies and Developments
- 11.5. Solvay S.A.
- 11.5.1. Company Overview
- 11.5.2. Financial Highlights
- 11.5.3. Product Portfolio
- 11.5.4. SWOT Analysis
- 11.5.5. Key Strategies and Developments
- 11.6. Akzo Nobel N.V.
- 11.6.1. Company Overview
- 11.6.2. Financial Highlights
- 11.6.3. Product Portfolio
- 11.6.4. SWOT Analysis
- 11.6.5. Key Strategies and Developments
- 11.7. BASF SE
- 11.7.1. Company Overview
- 11.7.2. Financial Highlights
- 11.7.3. Product Portfolio
- 11.7.4. SWOT Analysis
- 11.7.5. Key Strategies and Developments
- 11.8. Arkema Group
- 11.8.1. Company Overview
- 11.8.2. Financial Highlights
- 11.8.3. Product Portfolio
- 11.8.4. SWOT Analysis
- 11.8.5. Key Strategies and Developments
- 11.9. Sumitomo Chemical Company, Limited
- 11.9.1. Company Overview
- 11.9.2. Financial Highlights
- 11.9.3. Product Portfolio
- 11.9.4. SWOT Analysis
- 11.9.5. Key Strategies and Developments
- 11.10. Sinopec Corporation
- 11.10.1. Company Overview
- 11.10.2. Financial Highlights
- 11.10.3. Product Portfolio
- 11.10.4. SWOT Analysis
- 11.10.5. Key Strategies and Developments
- 11.11. Behn Meyer Holding AG
- 11.11.1. Company Overview
- 11.11.2. Financial Highlights
- 11.11.3. Product Portfolio
- 11.11.4. SWOT Analysis
- 11.11.5. Key Strategies and Developments
- 11.12. Kumho Petrochemical Co., Ltd.
- 11.12.1. Company Overview
- 11.12.2. Financial Highlights
- 11.12.3. Product Portfolio
- 11.12.4. SWOT Analysis
- 11.12.5. Key Strategies and Developments
- 11.13.1. Company Overview
- 11.13.2. Financial Highlights
- 11.13.3. Product Portfolio
- 11.13.4. SWOT Analysis
- 11.13.5. Key Strategies and Developments
- 11.14. NOCIL Limited
- 11.14.1. Company Overview
- 11.14.2. Financial Highlights
- 11.14.3. Product Portfolio
- 11.14.4. SWOT Analysis
- 11.14.5. Key Strategies and Developments
- 11.15. Addivant USA, LLC
- 11.15.1. Company Overview
- 11.15.2. Financial Highlights
- 11.15.3. Product Portfolio
- 11.15.4. SWOT Analysis
- 11.15.5. Key Strategies and Developments
- 11.16. Vanderbilt Chemicals, LLC
- 11.16.1. Company Overview
- 11.16.2. Financial Highlights
- 11.16.3. Product Portfolio
- 11.16.4. SWOT Analysis
- 11.16.5. Key Strategies and Developments
- 11.17. Merchem Limited
- 11.17.1. Company Overview
- 11.17.2. Financial Highlights
- 11.17.3. Product Portfolio
- 11.17.4. SWOT Analysis
- 11.17.5. Key Strategies and Developments
- 12. Assumptions and Acronyms
- 13. Research Methodology
- 14. Contact
- List of Figures
- Figure 1: Global Rubber Processing Chemicals Market Revenue (US$ Mn) Market Share by Type of Chemical in 2022
- Figure 2: Global Rubber Processing Chemicals Market Attractiveness Analysis by Type of Chemical, 2016-2032
- Figure 3: Global Rubber Processing Chemicals Market Revenue (US$ Mn) Market Share by Rubber Typein 2022
- Figure 4: Global Rubber Processing Chemicals Market Attractiveness Analysis by Rubber Type, 2016-2032
- Figure 5: Global Rubber Processing Chemicals Market Revenue (US$ Mn) Market Share by Applicationin 2022
- Figure 6: Global Rubber Processing Chemicals Market Attractiveness Analysis by Application, 2016-2032
- Figure 7: Global Rubber Processing Chemicals Market Revenue (US$ Mn) Market Share by Region in 2022
- Figure 8: Global Rubber Processing Chemicals Market Attractiveness Analysis by Region, 2016-2032
- Figure 9: Global Rubber Processing Chemicals Market Revenue (US$ Mn) (2016-2032)
- Figure 10: Global Rubber Processing Chemicals Market Revenue (US$ Mn) Comparison by Region (2016-2032)
- Figure 11: Global Rubber Processing Chemicals Market Revenue (US$ Mn) Comparison by Type of Chemical (2016-2032)
- Figure 12: Global Rubber Processing Chemicals Market Revenue (US$ Mn) Comparison by Rubber Type (2016-2032)
- Figure 13: Global Rubber Processing Chemicals Market Revenue (US$ Mn) Comparison by Application (2016-2032)
- Figure 14: Global Rubber Processing Chemicals Market Y-o-Y Growth Rate Comparison by Region (2016-2032)
- Figure 15: Global Rubber Processing Chemicals Market Y-o-Y Growth Rate Comparison by Type of Chemical (2016-2032)
- Figure 16: Global Rubber Processing Chemicals Market Y-o-Y Growth Rate Comparison by Rubber Type (2016-2032)
- Figure 17: Global Rubber Processing Chemicals Market Y-o-Y Growth Rate Comparison by Application (2016-2032)
- Figure 18: Global Rubber Processing Chemicals Market Share Comparison by Region (2016-2032)
- Figure 19: Global Rubber Processing Chemicals Market Share Comparison by Type of Chemical (2016-2032)
- Figure 20: Global Rubber Processing Chemicals Market Share Comparison by Rubber Type (2016-2032)
- Figure 21: Global Rubber Processing Chemicals Market Share Comparison by Application (2016-2032)
- Figure 22: North America Rubber Processing Chemicals Market Revenue (US$ Mn) Market Share by Type of Chemicalin 2022
- Figure 23: North America Rubber Processing Chemicals Market Attractiveness Analysis by Type of Chemical, 2016-2032
- Figure 24: North America Rubber Processing Chemicals Market Revenue (US$ Mn) Market Share by Rubber Typein 2022
- Figure 25: North America Rubber Processing Chemicals Market Attractiveness Analysis by Rubber Type, 2016-2032
- Figure 26: North America Rubber Processing Chemicals Market Revenue (US$ Mn) Market Share by Applicationin 2022
- Figure 27: North America Rubber Processing Chemicals Market Attractiveness Analysis by Application, 2016-2032
- Figure 28: North America Rubber Processing Chemicals Market Revenue (US$ Mn) Market Share by Country in 2022
- Figure 29: North America Rubber Processing Chemicals Market Attractiveness Analysis by Country, 2016-2032
- Figure 30: North America Rubber Processing Chemicals Market Revenue (US$ Mn) (2016-2032)
- Figure 31: North America Rubber Processing Chemicals Market Revenue (US$ Mn) Comparison by Country (2016-2032)
- Figure 32: North America Rubber Processing Chemicals Market Revenue (US$ Mn) Comparison by Type of Chemical (2016-2032)
- Figure 33: North America Rubber Processing Chemicals Market Revenue (US$ Mn) Comparison by Rubber Type (2016-2032)
- Figure 34: North America Rubber Processing Chemicals Market Revenue (US$ Mn) Comparison by Application (2016-2032)
- Figure 35: North America Rubber Processing Chemicals Market Y-o-Y Growth Rate Comparison by Country (2016-2032)
- Figure 36: North America Rubber Processing Chemicals Market Y-o-Y Growth Rate Comparison by Type of Chemical (2016-2032)
- Figure 37: North America Rubber Processing Chemicals Market Y-o-Y Growth Rate Comparison by Rubber Type (2016-2032)
- Figure 38: North America Rubber Processing Chemicals Market Y-o-Y Growth Rate Comparison by Application (2016-2032)
- Figure 39: North America Rubber Processing Chemicals Market Share Comparison by Country (2016-2032)
- Figure 40: North America Rubber Processing Chemicals Market Share Comparison by Type of Chemical (2016-2032)
- Figure 41: North America Rubber Processing Chemicals Market Share Comparison by Rubber Type (2016-2032)
- Figure 42: North America Rubber Processing Chemicals Market Share Comparison by Application (2016-2032)
- Figure 43: Western Europe Rubber Processing Chemicals Market Revenue (US$ Mn) Market Share by Type of Chemicalin 2022
- Figure 44: Western Europe Rubber Processing Chemicals Market Attractiveness Analysis by Type of Chemical, 2016-2032
- Figure 45: Western Europe Rubber Processing Chemicals Market Revenue (US$ Mn) Market Share by Rubber Typein 2022
- Figure 46: Western Europe Rubber Processing Chemicals Market Attractiveness Analysis by Rubber Type, 2016-2032
- Figure 47: Western Europe Rubber Processing Chemicals Market Revenue (US$ Mn) Market Share by Applicationin 2022
- Figure 48: Western Europe Rubber Processing Chemicals Market Attractiveness Analysis by Application, 2016-2032
- Figure 49: Western Europe Rubber Processing Chemicals Market Revenue (US$ Mn) Market Share by Country in 2022
- Figure 50: Western Europe Rubber Processing Chemicals Market Attractiveness Analysis by Country, 2016-2032
- Figure 51: Western Europe Rubber Processing Chemicals Market Revenue (US$ Mn) (2016-2032)
- Figure 52: Western Europe Rubber Processing Chemicals Market Revenue (US$ Mn) Comparison by Country (2016-2032)
- Figure 53: Western Europe Rubber Processing Chemicals Market Revenue (US$ Mn) Comparison by Type of Chemical (2016-2032)
- Figure 54: Western Europe Rubber Processing Chemicals Market Revenue (US$ Mn) Comparison by Rubber Type (2016-2032)
- Figure 55: Western Europe Rubber Processing Chemicals Market Revenue (US$ Mn) Comparison by Application (2016-2032)
- Figure 56: Western Europe Rubber Processing Chemicals Market Y-o-Y Growth Rate Comparison by Country (2016-2032)
- Figure 57: Western Europe Rubber Processing Chemicals Market Y-o-Y Growth Rate Comparison by Type of Chemical (2016-2032)
- Figure 58: Western Europe Rubber Processing Chemicals Market Y-o-Y Growth Rate Comparison by Rubber Type (2016-2032)
- Figure 59: Western Europe Rubber Processing Chemicals Market Y-o-Y Growth Rate Comparison by Application (2016-2032)
- Figure 60: Western Europe Rubber Processing Chemicals Market Share Comparison by Country (2016-2032)
- Figure 61: Western Europe Rubber Processing Chemicals Market Share Comparison by Type of Chemical (2016-2032)
- Figure 62: Western Europe Rubber Processing Chemicals Market Share Comparison by Rubber Type (2016-2032)
- Figure 63: Western Europe Rubber Processing Chemicals Market Share Comparison by Application (2016-2032)
- Figure 64: Eastern Europe Rubber Processing Chemicals Market Revenue (US$ Mn) Market Share by Type of Chemicalin 2022
- Figure 65: Eastern Europe Rubber Processing Chemicals Market Attractiveness Analysis by Type of Chemical, 2016-2032
- Figure 66: Eastern Europe Rubber Processing Chemicals Market Revenue (US$ Mn) Market Share by Rubber Typein 2022
- Figure 67: Eastern Europe Rubber Processing Chemicals Market Attractiveness Analysis by Rubber Type, 2016-2032
- Figure 68: Eastern Europe Rubber Processing Chemicals Market Revenue (US$ Mn) Market Share by Applicationin 2022
- Figure 69: Eastern Europe Rubber Processing Chemicals Market Attractiveness Analysis by Application, 2016-2032
- Figure 70: Eastern Europe Rubber Processing Chemicals Market Revenue (US$ Mn) Market Share by Country in 2022
- Figure 71: Eastern Europe Rubber Processing Chemicals Market Attractiveness Analysis by Country, 2016-2032
- Figure 72: Eastern Europe Rubber Processing Chemicals Market Revenue (US$ Mn) (2016-2032)
- Figure 73: Eastern Europe Rubber Processing Chemicals Market Revenue (US$ Mn) Comparison by Country (2016-2032)
- Figure 74: Eastern Europe Rubber Processing Chemicals Market Revenue (US$ Mn) Comparison by Type of Chemical (2016-2032)
- Figure 75: Eastern Europe Rubber Processing Chemicals Market Revenue (US$ Mn) Comparison by Rubber Type (2016-2032)
- Figure 76: Eastern Europe Rubber Processing Chemicals Market Revenue (US$ Mn) Comparison by Application (2016-2032)
- Figure 77: Eastern Europe Rubber Processing Chemicals Market Y-o-Y Growth Rate Comparison by Country (2016-2032)
- Figure 78: Eastern Europe Rubber Processing Chemicals Market Y-o-Y Growth Rate Comparison by Type of Chemical (2016-2032)
- Figure 79: Eastern Europe Rubber Processing Chemicals Market Y-o-Y Growth Rate Comparison by Rubber Type (2016-2032)
- Figure 80: Eastern Europe Rubber Processing Chemicals Market Y-o-Y Growth Rate Comparison by Application (2016-2032)
- Figure 81: Eastern Europe Rubber Processing Chemicals Market Share Comparison by Country (2016-2032)
- Figure 82: Eastern Europe Rubber Processing Chemicals Market Share Comparison by Type of Chemical (2016-2032)
- Figure 83: Eastern Europe Rubber Processing Chemicals Market Share Comparison by Rubber Type (2016-2032)
- Figure 84: Eastern Europe Rubber Processing Chemicals Market Share Comparison by Application (2016-2032)
- Figure 85: APAC Rubber Processing Chemicals Market Revenue (US$ Mn) Market Share by Type of Chemicalin 2022
- Figure 86: APAC Rubber Processing Chemicals Market Attractiveness Analysis by Type of Chemical, 2016-2032
- Figure 87: APAC Rubber Processing Chemicals Market Revenue (US$ Mn) Market Share by Rubber Typein 2022
- Figure 88: APAC Rubber Processing Chemicals Market Attractiveness Analysis by Rubber Type, 2016-2032
- Figure 89: APAC Rubber Processing Chemicals Market Revenue (US$ Mn) Market Share by Applicationin 2022
- Figure 90: APAC Rubber Processing Chemicals Market Attractiveness Analysis by Application, 2016-2032
- Figure 91: APAC Rubber Processing Chemicals Market Revenue (US$ Mn) Market Share by Country in 2022
- Figure 92: APAC Rubber Processing Chemicals Market Attractiveness Analysis by Country, 2016-2032
- Figure 93: APAC Rubber Processing Chemicals Market Revenue (US$ Mn) (2016-2032)
- Figure 94: APAC Rubber Processing Chemicals Market Revenue (US$ Mn) Comparison by Country (2016-2032)
- Figure 95: APAC Rubber Processing Chemicals Market Revenue (US$ Mn) Comparison by Type of Chemical (2016-2032)
- Figure 96: APAC Rubber Processing Chemicals Market Revenue (US$ Mn) Comparison by Rubber Type (2016-2032)
- Figure 97: APAC Rubber Processing Chemicals Market Revenue (US$ Mn) Comparison by Application (2016-2032)
- Figure 98: APAC Rubber Processing Chemicals Market Y-o-Y Growth Rate Comparison by Country (2016-2032)
- Figure 99: APAC Rubber Processing Chemicals Market Y-o-Y Growth Rate Comparison by Type of Chemical (2016-2032)
- Figure 100: APAC Rubber Processing Chemicals Market Y-o-Y Growth Rate Comparison by Rubber Type (2016-2032)
- Figure 101: APAC Rubber Processing Chemicals Market Y-o-Y Growth Rate Comparison by Application (2016-2032)
- Figure 102: APAC Rubber Processing Chemicals Market Share Comparison by Country (2016-2032)
- Figure 103: APAC Rubber Processing Chemicals Market Share Comparison by Type of Chemical (2016-2032)
- Figure 104: APAC Rubber Processing Chemicals Market Share Comparison by Rubber Type (2016-2032)
- Figure 105: APAC Rubber Processing Chemicals Market Share Comparison by Application (2016-2032)
- Figure 106: Latin America Rubber Processing Chemicals Market Revenue (US$ Mn) Market Share by Type of Chemicalin 2022
- Figure 107: Latin America Rubber Processing Chemicals Market Attractiveness Analysis by Type of Chemical, 2016-2032
- Figure 108: Latin America Rubber Processing Chemicals Market Revenue (US$ Mn) Market Share by Rubber Typein 2022
- Figure 109: Latin America Rubber Processing Chemicals Market Attractiveness Analysis by Rubber Type, 2016-2032
- Figure 110: Latin America Rubber Processing Chemicals Market Revenue (US$ Mn) Market Share by Applicationin 2022
- Figure 111: Latin America Rubber Processing Chemicals Market Attractiveness Analysis by Application, 2016-2032
- Figure 112: Latin America Rubber Processing Chemicals Market Revenue (US$ Mn) Market Share by Country in 2022
- Figure 113: Latin America Rubber Processing Chemicals Market Attractiveness Analysis by Country, 2016-2032
- Figure 114: Latin America Rubber Processing Chemicals Market Revenue (US$ Mn) (2016-2032)
- Figure 115: Latin America Rubber Processing Chemicals Market Revenue (US$ Mn) Comparison by Country (2016-2032)
- Figure 116: Latin America Rubber Processing Chemicals Market Revenue (US$ Mn) Comparison by Type of Chemical (2016-2032)
- Figure 117: Latin America Rubber Processing Chemicals Market Revenue (US$ Mn) Comparison by Rubber Type (2016-2032)
- Figure 118: Latin America Rubber Processing Chemicals Market Revenue (US$ Mn) Comparison by Application (2016-2032)
- Figure 119: Latin America Rubber Processing Chemicals Market Y-o-Y Growth Rate Comparison by Country (2016-2032)
- Figure 120: Latin America Rubber Processing Chemicals Market Y-o-Y Growth Rate Comparison by Type of Chemical (2016-2032)
- Figure 121: Latin America Rubber Processing Chemicals Market Y-o-Y Growth Rate Comparison by Rubber Type (2016-2032)
- Figure 122: Latin America Rubber Processing Chemicals Market Y-o-Y Growth Rate Comparison by Application (2016-2032)
- Figure 123: Latin America Rubber Processing Chemicals Market Share Comparison by Country (2016-2032)
- Figure 124: Latin America Rubber Processing Chemicals Market Share Comparison by Type of Chemical (2016-2032)
- Figure 125: Latin America Rubber Processing Chemicals Market Share Comparison by Rubber Type (2016-2032)
- Figure 126: Latin America Rubber Processing Chemicals Market Share Comparison by Application (2016-2032)
- Figure 127: Middle East & Africa Rubber Processing Chemicals Market Revenue (US$ Mn) Market Share by Type of Chemicalin 2022
- Figure 128: Middle East & Africa Rubber Processing Chemicals Market Attractiveness Analysis by Type of Chemical, 2016-2032
- Figure 129: Middle East & Africa Rubber Processing Chemicals Market Revenue (US$ Mn) Market Share by Rubber Typein 2022
- Figure 130: Middle East & Africa Rubber Processing Chemicals Market Attractiveness Analysis by Rubber Type, 2016-2032
- Figure 131: Middle East & Africa Rubber Processing Chemicals Market Revenue (US$ Mn) Market Share by Applicationin 2022
- Figure 132: Middle East & Africa Rubber Processing Chemicals Market Attractiveness Analysis by Application, 2016-2032
- Figure 133: Middle East & Africa Rubber Processing Chemicals Market Revenue (US$ Mn) Market Share by Country in 2022
- Figure 134: Middle East & Africa Rubber Processing Chemicals Market Attractiveness Analysis by Country, 2016-2032
- Figure 135: Middle East & Africa Rubber Processing Chemicals Market Revenue (US$ Mn) (2016-2032)
- Figure 136: Middle East & Africa Rubber Processing Chemicals Market Revenue (US$ Mn) Comparison by Country (2016-2032)
- Figure 137: Middle East & Africa Rubber Processing Chemicals Market Revenue (US$ Mn) Comparison by Type of Chemical (2016-2032)
- Figure 138: Middle East & Africa Rubber Processing Chemicals Market Revenue (US$ Mn) Comparison by Rubber Type (2016-2032)
- Figure 139: Middle East & Africa Rubber Processing Chemicals Market Revenue (US$ Mn) Comparison by Application (2016-2032)
- Figure 140: Middle East & Africa Rubber Processing Chemicals Market Y-o-Y Growth Rate Comparison by Country (2016-2032)
- Figure 141: Middle East & Africa Rubber Processing Chemicals Market Y-o-Y Growth Rate Comparison by Type of Chemical (2016-2032)
- Figure 142: Middle East & Africa Rubber Processing Chemicals Market Y-o-Y Growth Rate Comparison by Rubber Type (2016-2032)
- Figure 143: Middle East & Africa Rubber Processing Chemicals Market Y-o-Y Growth Rate Comparison by Application (2016-2032)
- Figure 144: Middle East & Africa Rubber Processing Chemicals Market Share Comparison by Country (2016-2032)
- Figure 145: Middle East & Africa Rubber Processing Chemicals Market Share Comparison by Type of Chemical (2016-2032)
- Figure 146: Middle East & Africa Rubber Processing Chemicals Market Share Comparison by Rubber Type (2016-2032)
- Figure 147: Middle East & Africa Rubber Processing Chemicals Market Share Comparison by Application (2016-2032)
- List of Tables
- Table 1: Global Rubber Processing Chemicals Market Comparison by Type of Chemical (2016-2032)
- Table 2: Global Rubber Processing Chemicals Market Comparison by Rubber Type (2016-2032)
- Table 3: Global Rubber Processing Chemicals Market Comparison by Application (2016-2032)
- Table 4: Global Rubber Processing Chemicals Market Revenue (US$ Mn) Comparison by Region (2016-2032)
- Table 5: Global Rubber Processing Chemicals Market Revenue (US$ Mn) (2016-2032)
- Table 6: Global Rubber Processing Chemicals Market Revenue (US$ Mn) Comparison by Region (2016-2032)
- Table 7: Global Rubber Processing Chemicals Market Revenue (US$ Mn) Comparison by Type of Chemical (2016-2032)
- Table 8: Global Rubber Processing Chemicals Market Revenue (US$ Mn) Comparison by Rubber Type (2016-2032)
- Table 9: Global Rubber Processing Chemicals Market Revenue (US$ Mn) Comparison by Application (2016-2032)
- Table 10: Global Rubber Processing Chemicals Market Y-o-Y Growth Rate Comparison by Region (2016-2032)
- Table 11: Global Rubber Processing Chemicals Market Y-o-Y Growth Rate Comparison by Type of Chemical (2016-2032)
- Table 12: Global Rubber Processing Chemicals Market Y-o-Y Growth Rate Comparison by Rubber Type (2016-2032)
- Table 13: Global Rubber Processing Chemicals Market Y-o-Y Growth Rate Comparison by Application (2016-2032)
- Table 14: Global Rubber Processing Chemicals Market Share Comparison by Region (2016-2032)
- Table 15: Global Rubber Processing Chemicals Market Share Comparison by Type of Chemical (2016-2032)
- Table 16: Global Rubber Processing Chemicals Market Share Comparison by Rubber Type (2016-2032)
- Table 17: Global Rubber Processing Chemicals Market Share Comparison by Application (2016-2032)
- Table 18: North America Rubber Processing Chemicals Market Comparison by Rubber Type (2016-2032)
- Table 19: North America Rubber Processing Chemicals Market Comparison by Application (2016-2032)
- Table 20: North America Rubber Processing Chemicals Market Revenue (US$ Mn) Comparison by Country (2016-2032)
- Table 21: North America Rubber Processing Chemicals Market Revenue (US$ Mn) (2016-2032)
- Table 22: North America Rubber Processing Chemicals Market Revenue (US$ Mn) Comparison by Country (2016-2032)
- Table 23: North America Rubber Processing Chemicals Market Revenue (US$ Mn) Comparison by Type of Chemical (2016-2032)
- Table 24: North America Rubber Processing Chemicals Market Revenue (US$ Mn) Comparison by Rubber Type (2016-2032)
- Table 25: North America Rubber Processing Chemicals Market Revenue (US$ Mn) Comparison by Application (2016-2032)
- Table 26: North America Rubber Processing Chemicals Market Y-o-Y Growth Rate Comparison by Country (2016-2032)
- Table 27: North America Rubber Processing Chemicals Market Y-o-Y Growth Rate Comparison by Type of Chemical (2016-2032)
- Table 28: North America Rubber Processing Chemicals Market Y-o-Y Growth Rate Comparison by Rubber Type (2016-2032)
- Table 29: North America Rubber Processing Chemicals Market Y-o-Y Growth Rate Comparison by Application (2016-2032)
- Table 30: North America Rubber Processing Chemicals Market Share Comparison by Country (2016-2032)
- Table 31: North America Rubber Processing Chemicals Market Share Comparison by Type of Chemical (2016-2032)
- Table 32: North America Rubber Processing Chemicals Market Share Comparison by Rubber Type (2016-2032)
- Table 33: North America Rubber Processing Chemicals Market Share Comparison by Application (2016-2032)
- Table 34: Western Europe Rubber Processing Chemicals Market Comparison by Type of Chemical (2016-2032)
- Table 35: Western Europe Rubber Processing Chemicals Market Comparison by Rubber Type (2016-2032)
- Table 36: Western Europe Rubber Processing Chemicals Market Comparison by Application (2016-2032)
- Table 37: Western Europe Rubber Processing Chemicals Market Revenue (US$ Mn) Comparison by Country (2016-2032)
- Table 38: Western Europe Rubber Processing Chemicals Market Revenue (US$ Mn) (2016-2032)
- Table 39: Western Europe Rubber Processing Chemicals Market Revenue (US$ Mn) Comparison by Country (2016-2032)
- Table 40: Western Europe Rubber Processing Chemicals Market Revenue (US$ Mn) Comparison by Type of Chemical (2016-2032)
- Table 41: Western Europe Rubber Processing Chemicals Market Revenue (US$ Mn) Comparison by Rubber Type (2016-2032)
- Table 42: Western Europe Rubber Processing Chemicals Market Revenue (US$ Mn) Comparison by Application (2016-2032)
- Table 43: Western Europe Rubber Processing Chemicals Market Y-o-Y Growth Rate Comparison by Country (2016-2032)
- Table 44: Western Europe Rubber Processing Chemicals Market Y-o-Y Growth Rate Comparison by Type of Chemical (2016-2032)
- Table 45: Western Europe Rubber Processing Chemicals Market Y-o-Y Growth Rate Comparison by Rubber Type (2016-2032)
- Table 46: Western Europe Rubber Processing Chemicals Market Y-o-Y Growth Rate Comparison by Application (2016-2032)
- Table 47: Western Europe Rubber Processing Chemicals Market Share Comparison by Country (2016-2032)
- Table 48: Western Europe Rubber Processing Chemicals Market Share Comparison by Type of Chemical (2016-2032)
- Table 49: Western Europe Rubber Processing Chemicals Market Share Comparison by Rubber Type (2016-2032)
- Table 50: Western Europe Rubber Processing Chemicals Market Share Comparison by Application (2016-2032)
- Table 51: Eastern Europe Rubber Processing Chemicals Market Comparison by Type of Chemical (2016-2032)
- Table 52: Eastern Europe Rubber Processing Chemicals Market Comparison by Rubber Type (2016-2032)
- Table 53: Eastern Europe Rubber Processing Chemicals Market Comparison by Application (2016-2032)
- Table 54: Eastern Europe Rubber Processing Chemicals Market Revenue (US$ Mn) Comparison by Country (2016-2032)
- Table 55: Eastern Europe Rubber Processing Chemicals Market Revenue (US$ Mn) (2016-2032)
- Table 56: Eastern Europe Rubber Processing Chemicals Market Revenue (US$ Mn) Comparison by Country (2016-2032)
- Table 57: Eastern Europe Rubber Processing Chemicals Market Revenue (US$ Mn) Comparison by Type of Chemical (2016-2032)
- Table 58: Eastern Europe Rubber Processing Chemicals Market Revenue (US$ Mn) Comparison by Rubber Type (2016-2032)
- Table 59: Eastern Europe Rubber Processing Chemicals Market Revenue (US$ Mn) Comparison by Application (2016-2032)
- Table 60: Eastern Europe Rubber Processing Chemicals Market Y-o-Y Growth Rate Comparison by Country (2016-2032)
- Table 61: Eastern Europe Rubber Processing Chemicals Market Y-o-Y Growth Rate Comparison by Type of Chemical (2016-2032)
- Table 62: Eastern Europe Rubber Processing Chemicals Market Y-o-Y Growth Rate Comparison by Rubber Type (2016-2032)
- Table 63: Eastern Europe Rubber Processing Chemicals Market Y-o-Y Growth Rate Comparison by Application (2016-2032)
- Table 64: Eastern Europe Rubber Processing Chemicals Market Share Comparison by Country (2016-2032)
- Table 65: Eastern Europe Rubber Processing Chemicals Market Share Comparison by Type of Chemical (2016-2032)
- Table 66: Eastern Europe Rubber Processing Chemicals Market Share Comparison by Rubber Type (2016-2032)
- Table 67: Eastern Europe Rubber Processing Chemicals Market Share Comparison by Application (2016-2032)
- Table 68: APAC Rubber Processing Chemicals Market Comparison by Type of Chemical (2016-2032)
- Table 69: APAC Rubber Processing Chemicals Market Comparison by Rubber Type (2016-2032)
- Table 70: APAC Rubber Processing Chemicals Market Comparison by Application (2016-2032)
- Table 71: APAC Rubber Processing Chemicals Market Revenue (US$ Mn) Comparison by Country (2016-2032)
- Table 72: APAC Rubber Processing Chemicals Market Revenue (US$ Mn) (2016-2032)
- Table 73: APAC Rubber Processing Chemicals Market Revenue (US$ Mn) Comparison by Country (2016-2032)
- Table 74: APAC Rubber Processing Chemicals Market Revenue (US$ Mn) Comparison by Type of Chemical (2016-2032)
- Table 75: APAC Rubber Processing Chemicals Market Revenue (US$ Mn) Comparison by Rubber Type (2016-2032)
- Table 76: APAC Rubber Processing Chemicals Market Revenue (US$ Mn) Comparison by Application (2016-2032)
- Table 77: APAC Rubber Processing Chemicals Market Y-o-Y Growth Rate Comparison by Country (2016-2032)
- Table 78: APAC Rubber Processing Chemicals Market Y-o-Y Growth Rate Comparison by Type of Chemical (2016-2032)
- Table 79: APAC Rubber Processing Chemicals Market Y-o-Y Growth Rate Comparison by Rubber Type (2016-2032)
- Table 80: APAC Rubber Processing Chemicals Market Y-o-Y Growth Rate Comparison by Application (2016-2032)
- Table 81: APAC Rubber Processing Chemicals Market Share Comparison by Country (2016-2032)
- Table 82: APAC Rubber Processing Chemicals Market Share Comparison by Type of Chemical (2016-2032)
- Table 83: APAC Rubber Processing Chemicals Market Share Comparison by Rubber Type (2016-2032)
- Table 84: APAC Rubber Processing Chemicals Market Share Comparison by Application (2016-2032)
- Table 85: Latin America Rubber Processing Chemicals Market Comparison by Type of Chemical (2016-2032)
- Table 86: Latin America Rubber Processing Chemicals Market Comparison by Rubber Type (2016-2032)
- Table 87: Latin America Rubber Processing Chemicals Market Comparison by Application (2016-2032)
- Table 88: Latin America Rubber Processing Chemicals Market Revenue (US$ Mn) Comparison by Country (2016-2032)
- Table 89: Latin America Rubber Processing Chemicals Market Revenue (US$ Mn) (2016-2032)
- Table 90: Latin America Rubber Processing Chemicals Market Revenue (US$ Mn) Comparison by Country (2016-2032)
- Table 91: Latin America Rubber Processing Chemicals Market Revenue (US$ Mn) Comparison by Type of Chemical (2016-2032)
- Table 92: Latin America Rubber Processing Chemicals Market Revenue (US$ Mn) Comparison by Rubber Type (2016-2032)
- Table 93: Latin America Rubber Processing Chemicals Market Revenue (US$ Mn) Comparison by Application (2016-2032)
- Table 94: Latin America Rubber Processing Chemicals Market Y-o-Y Growth Rate Comparison by Country (2016-2032)
- Table 95: Latin America Rubber Processing Chemicals Market Y-o-Y Growth Rate Comparison by Type of Chemical (2016-2032)
- Table 96: Latin America Rubber Processing Chemicals Market Y-o-Y Growth Rate Comparison by Rubber Type (2016-2032)
- Table 97: Latin America Rubber Processing Chemicals Market Y-o-Y Growth Rate Comparison by Application (2016-2032)
- Table 98: Latin America Rubber Processing Chemicals Market Share Comparison by Country (2016-2032)
- Table 99: Latin America Rubber Processing Chemicals Market Share Comparison by Type of Chemical (2016-2032)
- Table 100: Latin America Rubber Processing Chemicals Market Share Comparison by Rubber Type (2016-2032)
- Table 101: Latin America Rubber Processing Chemicals Market Share Comparison by Application (2016-2032)
- Table 102: Middle East & Africa Rubber Processing Chemicals Market Comparison by Type of Chemical (2016-2032)
- Table 103: Middle East & Africa Rubber Processing Chemicals Market Comparison by Rubber Type (2016-2032)
- Table 104: Middle East & Africa Rubber Processing Chemicals Market Comparison by Application (2016-2032)
- Table 105: Middle East & Africa Rubber Processing Chemicals Market Revenue (US$ Mn) Comparison by Country (2016-2032)
- Table 106: Middle East & Africa Rubber Processing Chemicals Market Revenue (US$ Mn) (2016-2032)
- Table 107: Middle East & Africa Rubber Processing Chemicals Market Revenue (US$ Mn) Comparison by Country (2016-2032)
- Table 108: Middle East & Africa Rubber Processing Chemicals Market Revenue (US$ Mn) Comparison by Type of Chemical (2016-2032)
- Table 109: Middle East & Africa Rubber Processing Chemicals Market Revenue (US$ Mn) Comparison by Rubber Type (2016-2032)
- Table 110: Middle East & Africa Rubber Processing Chemicals Market Revenue (US$ Mn) Comparison by Application (2016-2032)
- Table 111: Middle East & Africa Rubber Processing Chemicals Market Y-o-Y Growth Rate Comparison by Country (2016-2032)
- Table 112: Middle East & Africa Rubber Processing Chemicals Market Y-o-Y Growth Rate Comparison by Type of Chemical (2016-2032)
- Table 113: Middle East & Africa Rubber Processing Chemicals Market Y-o-Y Growth Rate Comparison by Rubber Type (2016-2032)
- Table 114: Middle East & Africa Rubber Processing Chemicals Market Y-o-Y Growth Rate Comparison by Application (2016-2032)
- Table 115: Middle East & Africa Rubber Processing Chemicals Market Share Comparison by Country (2016-2032)
- Table 116: Middle East & Africa Rubber Processing Chemicals Market Share Comparison by Type of Chemical (2016-2032)
- Table 117: Middle East & Africa Rubber Processing Chemicals Market Share Comparison by Rubber Type (2016-2032)
- Table 118: Middle East & Africa Rubber Processing Chemicals Market Share Comparison by Application (2016-2032)
- 1. Executive Summary
-
- LANXESS AG
- Eastman Chemical Company
- Solvay S.A.
- Akzo Nobel N.V.
- BASF SE
- Arkema Group
- Sumitomo Chemical Company, Limited
- Sinopec Corporation
- Behn Meyer Holding AG
- Kumho Petrochemical Co., Ltd.
- NOCIL Limited
- Emery Oleochemicals Group
- Addivant USA, LLC
- Vanderbilt Chemicals, LLC
- Merchem Limited
Our Clients


View Our Licence Options
