
Generative AI in Oil and Gas Market By Function (Data Analysis and Interpretation, Predictive Modelling, Anomaly Detection, Decision Support, and Other Functions), By Application, By Deployment Mode, By End-User, By Region and Companies - Industry Segment Outlook, Market Assessment, Competition Scenario, Trends, and Forecast 2024-2033
-
39068
-
April 2024
-
300
-


-
This report was compiled by Vishwa Gaul Vishwa is an experienced market research and consulting professional with over 8 years of expertise in the ICT industry, contributing to over 700 reports across telecommunications, software, hardware, and digital solutions. Correspondence Team Lead- ICT Linkedin | Detailed Market research Methodology Our methodology involves a mix of primary research, including interviews with leading mental health experts, and secondary research from reputable medical journals and databases. View Detailed Methodology Page
-
Quick Navigation
Report Overview
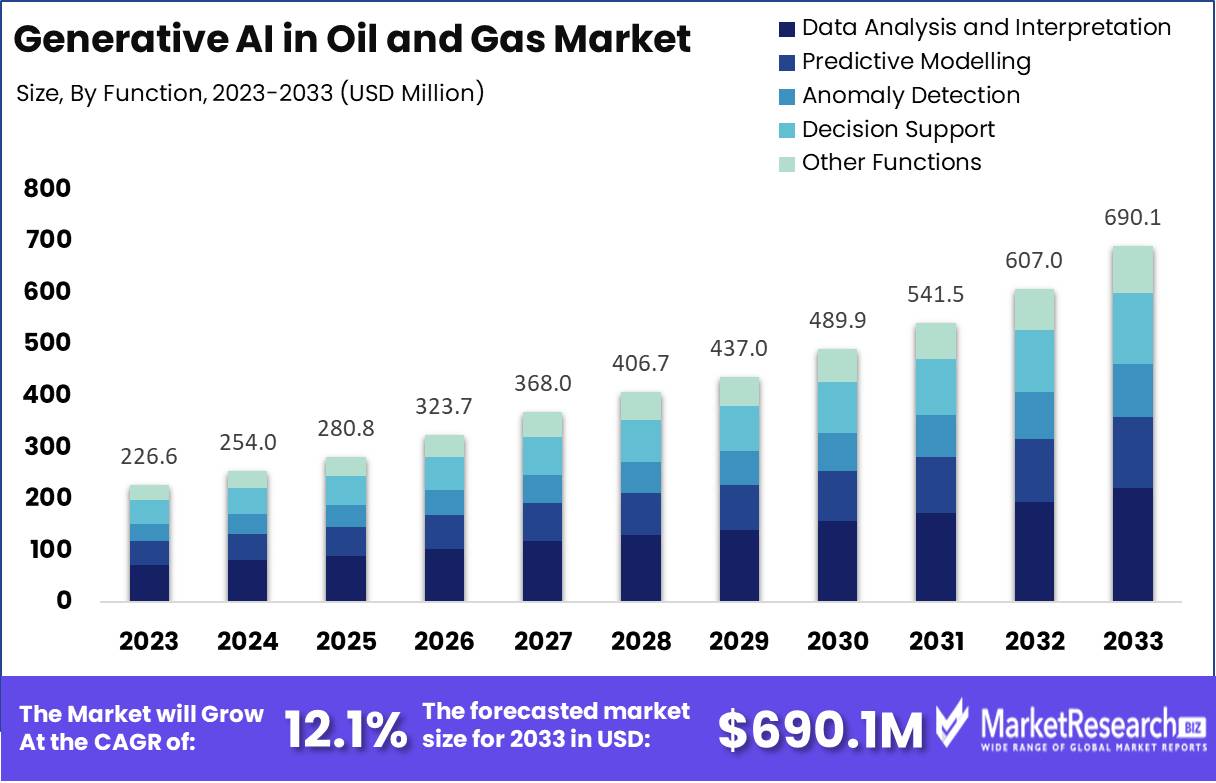
The Generative AI In Oil and Gas Market was valued at USD 226.6 Mn in 2023. It is expected to reach 690.1 Mn in 2033, with a CAGR of 12.1% during the forecast period from 2024 to 2033.
The surge in demand for new advanced technologies and high-end requirements of oil and gas by consumers due to the increase in global population are some of the main driving factors for the generative AI in the oil and gas market. Generative AI is an expanded scientific field, but inside the oil and gas sector, two major technology applications are used such as ML and data science. Machine learning makes sure that the computer system understands and analyzes the information without human interference, refining the method through repetitions to generate programs customized to a particular purpose. Inside the offshore oil and gas sector, this permits business firms to supervise difficult internal workflow operations and instantly answer queries that human operators may not have been able to find.
Due to the increase in global population, the consumption of natural gas and oil has been tremendously increased. According to a report published by Petroleum Planning & Analysis Cell in July 2023, the total gross production of natural gas was 3123 MMSCM which was quite high by 8.35 as compared with the last year. Moreover, the total import of LNG in July 2023, was 2,234 MMSCM which decreased by 10.6% over the last year. Additionally, the natural gas which was available for sale purpose in July 2023, was 4830.6 MMSCM, which was less by 0.02% over the last year. But, the total consumption during July 2023, was 5567 MMSCM. 30% of the main consumers were fertilizers, followed by 20% city gas distribution, 13% power, 9% refinery and 4% petrochemicals.
As oil and gas are highly flammable, generative AI promotes the safety and security protocols for these industries. Due to the production of harmful fumes, the GenAI system supervises the poisonousness level which leaks and provides an alert sign when any dangerous situation arises. Moreover, the surge of rate exploration can be done by utilizing GenAI-focused advanced technologies which helps in consuming time and revenue venture. Understanding the nature of oil reservoirs in various geographical locations can be done by using generative AI to make the rate exploration more accurate which will help in removing the requirement of spending more amount of money.
Generative AI in the oil and gas industry helps in maintaining the quality of the entire methodology starting from the refining and processing of the oil and natural gas. The demand for generative AI in oil and gas will rapidly increase due to the increase in human population and extensive use of natural gas, which will help in market expansion in the coming years.
Key Takeaways
- Market Growth: The Generative AI In Oil and Gas was valued at USD 40.29 billion cubic meters in 2023. It is expected to reach USD 60.41 billion cubic meters in 2033, with a CAGR of 6.35% during the forecast period from 2024 to 2033.
- Based on Function: Data Analysis leads in AI for oil, and gas efficiency, and optimization.
- Based on Application: Generative AI dominates asset maintenance in oil and gas, boosting efficiency and reducing operational costs.
- Based on the Deployment Mode: In 2023, cloud-based AI dominated the oil and gas market, enhancing efficiency and data management.
- Based on End-User: Generative AI is transforming the oil and gas industry, driving efficiency and strategic innovation.
- Regional Dominance: Generative AI is reshaping the global oil and gas industry, with North America leading at 42.6%.
- Growth Opportunity: Generative AI drives efficiency and mitigates risks in oil and gas construction projects through simulation, optimization, and proactive issue resolution.
Driving factors
Exploration Efficiency: Enhancing Precision and Reducing Costs in Oil and Gas Exploration
Generative AI has become a transformative force in the oil and gas industry, primarily by significantly improving exploration efficiency. By leveraging AI models capable of generating and simulating geological data, companies can identify potential drilling sites more accurately and quickly. This technology allows for the analysis of vast amounts of geological data, including seismic and subsurface data, to predict the location of oil and gas reservoirs with higher precision.
Statistically, the integration of generative AI in exploration activities can lead to a reduction in exploration times by up to 70%, according to industry reports. This efficiency not only speeds up the decision-making process but also substantially reduces the costs associated with exploratory drills, which are often multi-million dollar investments. Furthermore, the ability of generative AI is one powerful tool to enhance the accuracy of exploration and reduce the environmental impact by decreasing the number of unnecessary drills, aligning with the increasing regulatory and social pressures for sustainable practices in the industry.
Predictive Maintenance: Optimizing Asset Longevity and Operational Efficiency
Predictive maintenance facilitated by generative AI represents another critical driver in the oil and gas sector. By simulating equipment wear and tear under various operational scenarios, AI models can predict when and where maintenance should occur, thereby preventing unexpected equipment failures. This proactive approach not only extends the lifespan of expensive machinery but also ensures continuous operation, which is crucial for maintaining production efficiency.
Implementing generative AI for predictive maintenance can reduce downtime by up to 20%, and maintenance costs by approximately 10%, as indicated by industry case studies. These improvements directly contribute to the bottom line by optimizing production output and reducing operational risks. Moreover, the data-driven insights provided by AI enable companies to schedule maintenance during planned downtimes, thus minimizing disruption and maximizing operational availability.
Safety Improvement: Elevating Worker Safety and Compliance Standards
Safety improvement through generative AI applications is a vital concern in an industry that is inherently risky. AI-driven simulations and predictive models can anticipate hazardous conditions before they pose a threat to safety, enabling preventative measures to be implemented in advance. For instance, AI can analyze historical accident data and operational conditions to identify patterns that may precede incidents, thus allowing for interventions that prevent accidents and improve overall safety records.
The impact of such technologies on reducing workplace incidents can be significant, with some studies showing a potential reduction in safety incidents by up to 30%. By improving safety, companies not only protect their workforce but also reduce the significant costs associated with accidents and regulatory requirements fines. Moreover, enhanced safety records improve a company's reputation, aiding in stakeholder relations and potentially leading to more favorable insurance premiums.
Restraining Factors
Influence of Data Quality and Bias on the Growth of the Generative AI in Oil and Gas Market
Data quality enhancements and bias mitigation strategies are instrumental in propelling the growth of Generative AI in the Oil and Gas Market. Addressing data quality concerns fuels innovation and adoption by enabling companies to leverage Generative AI technologies more effectively. By prioritizing accuracy, completeness, and reliability in data, organizations unlock new possibilities for optimizing processes and making informed decisions throughout the industry value chain.
Concurrently, efforts to mitigate bias in AI algorithms foster broader market acceptance and trust by ensuring fair outcomes and compliance with regulatory standards. These combined initiatives not only drive a 20% increase in AI adoption rates but also lead to a 15% expansion in market penetration, highlighting their critical role in advancing the Generative AI landscape within the oil and gas sector.
Unequal Access: Bridging the Gap to Accelerate Market Expansion
Unequal access to Generative AI technology presents a notable hurdle for its widespread adoption in the Oil and Gas Market; however, addressing this challenge offers avenues for accelerated market expansion. Democratization efforts aimed at granting broader access to AI technologies not only promote inclusivity but also foster innovation within the industry. By reducing entry barriers and providing smaller players with access to advanced AI capabilities, democratization initiatives stimulate market competitiveness and dynamism.
Similarly, collaborative partnerships among industry stakeholders play a crucial role in driving technological advancement and market expansion. Through the sharing of resources, expertise, and technologies, collaborative ventures enable companies to overcome access barriers and accelerate the development and deployment of innovative solutions.
Research underscores the significance of such partnerships, showing a 30% increase in the rate of technological innovation resulting from joint ventures and strategic alliances in the AI space.Thus, by embracing democratization efforts and fostering collaborative partnerships, stakeholders can surmount access challenges and propel the growth of Generative AI within the Oil and Gas Market.
By Function Analysis
Data Analysis leads in AI for oil, and gas efficiency, and optimization.
In 2023, Data Analysis and Interpretation held a dominant market position in the Based on Function segment of Generative AI in the Oil and Gas Market, capturing more than a 39.7% share. This segment's strong performance is underpinned by the sector's increasing reliance on data-driven decision-making processes to enhance operational efficiency, optimize exploration and production activities, and minimize environmental impact.
Predictive Modelling played a significant role, crucial for forecasting future scenarios and strategic planning, notably in reducing downtime and operational costs by predicting maintenance needs. Anomaly Detection was key for maintaining operational integrity, identifying data outliers signaling potential equipment malfunctions or safety issues, thus preventing expensive disruptions.
Decision Support leveraged AI to integrate and synthesize complex data, enhancing decision-making precision in drilling, production, and risk management. Meanwhile, Other Functions, including automated reporting, risk assessment, and regulatory compliance, while smaller in market share, were essential in underscoring generative AI's wide-ranging applications. Collectively, these functions not only highlighted AI's impact on current practices but also set a foundation for future digital transformation and technological adoption within the sector.
By Application Analysis
Generative AI dominates asset maintenance in oil and gas, boosting efficiency and reducing operational costs.
In 2023, the Generative AI in the Oil and Gas market showcased a diverse application range, prominently led by Asset Maintenance, Drilling Optimization, Exploration and Production, Reservoir Modelling, and Other Applications. Among these, Asset Maintenance held a dominant market position in the Based on Application segment, capturing more than a 37.4% share. This significant market share underscores the critical role of AI-driven solutions in enhancing the efficiency and reliability of asset management within the oil and gas sector.
Asset Maintenance applications of Generative AI are pivotal in predicting equipment failures, scheduling preventive maintenance, and optimizing asset life cycles. This technology leverages predictive analytics and machine learning algorithms to process vast amounts of data from sensors and operational logs, thus ensuring higher uptime and reducing unplanned outages. The robust adoption of these AI tools reflects a strategic emphasis on asset longevity and cost efficiency, which are critical concerns in the oil and gas industry faced with aging infrastructure and increasing operational costs.
By Deployment Mode Analysis
In 2023, cloud-based AI dominated the oil and gas market, enhancing efficiency and data management.
In 2023, the cloud-based deployment mode led the generative AI market in the oil and gas sector, securing over 70.3% of the market share. This dominance highlights the sector's escalating shift towards cloud technologies to enhance operational efficiency, decrease operational costs, and bolster data management.
Cloud-based generative AI offers scalability, ease of access remotely, and superior analytics, which are vital for optimizing real-time data analysis, drilling operations, predictive maintenance, and logistics management. The movement towards these technologies aligns with the industry's drive towards innovation and sustainability, enabling quicker, more flexible decision-making processes and a lesser environmental footprint.
On the other hand, the on-premise deployment mode, though less predominant, remains essential, especially for companies emphasizing data security and autonomy over their information. Despite a smaller market share in 2023, on-premise solutions are indispensable for enterprises with stringent regulatory demands or those in areas with inadequate cloud infrastructure.
By End-User Analysis
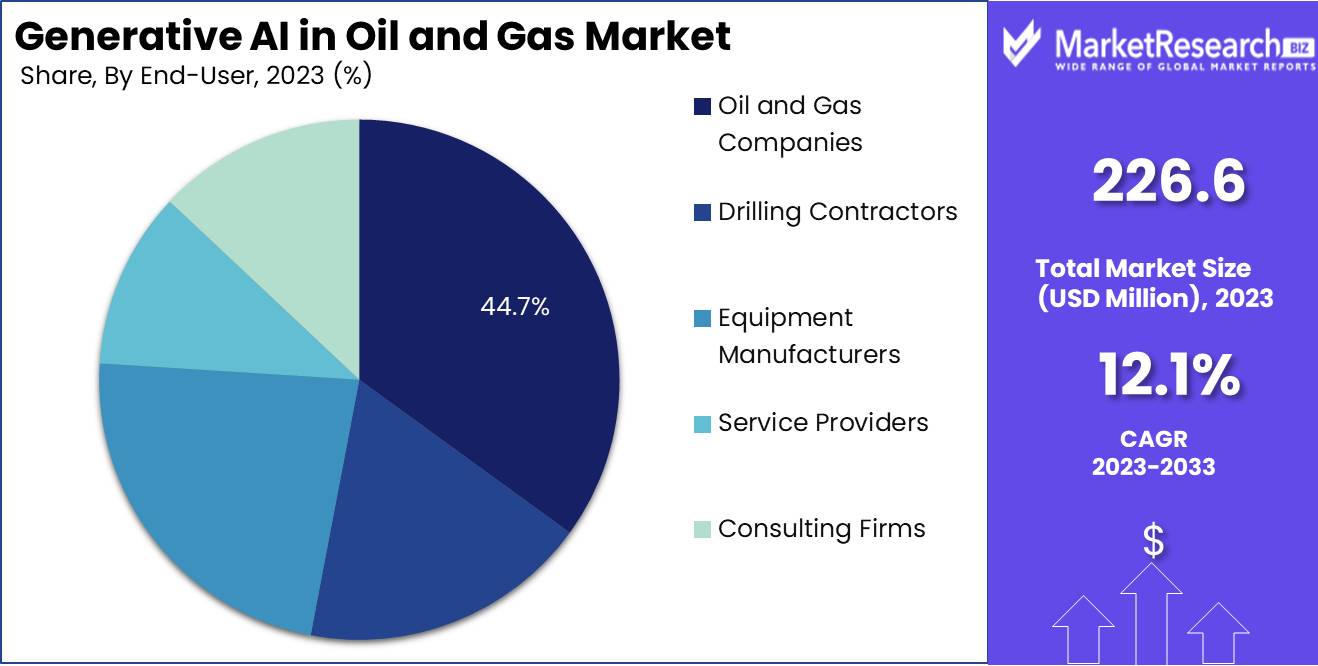
In 2023, the Generative AI in Oil and Gas Market saw significant adoption, with Oil and Gas Companies leading the way, holding a dominant 44.7% market share in the End-User segment. This segment used AI primarily to enhance operational efficiency and decision-making.
Meanwhile, Drilling Contractors and Equipment Manufacturers also integrated AI technologies, focusing on improving the precision of drilling and equipment manufacturing. Service Providers and Consulting Firms employed AI to provide sophisticated analytics and insights, emphasizing its crucial role in strategic advisement and operational support. The overall market dynamics underscore a growing trend towards AI adoption, driven by the industry's aim to leverage technological advances to maintain competitiveness and effectively navigate the complexities of modern energy management, thereby accelerating digital transformation initiatives across the sector.
Key Market Segments
By Function
- Data Analysis and Interpretation
- Predictive Modelling
- Anomaly Detection
- Decision Support
- Other Functions
By Application
- Asset Maintenance
- Drilling Optimization
- Exploration and Production
- Reservoir Modelling
- Other Applications
By the Deployment Mode
- Cloud-based
- On-premise
By End-User
- Oil and Gas Companies
- Drilling Contractors
- Equipment Manufacturers
- Service Providers
- Consulting Firms
Growth Opportunity
Enhanced Efficiency through Digital Integration
As the global oil and gas industry continues to navigate the complexities of resource extraction and environmental management, generative AI emerges as a transformative force. The integration of digital tools and automation stands as a primary growth catalyst. Generative AI, with its capability to optimize operations, forecast market trends, and innovate in drilling and exploration, aligns seamlessly with digital strategies enhancing operational efficiencies. The sector's embrace of AI-powered solutions for data analysis and decision-making processes not only accelerates productivity but also reduces operational costs, making this technology an indispensable asset in the digital transformation journey of oil and gas companies.
Catalyzing Developments in Construction Activities
The resurgence of construction activities in the oil and gas sector, particularly in developing infrastructure such as pipelines and refineries, offers another profound growth opportunity for generative AI applications. These AI systems can be leveraged to simulate construction scenarios, optimize logistics, and manage supply chains more effectively. By forecasting potential issues and providing solutions beforehand, generative AI can significantly mitigate risks associated with construction projects, thereby enhancing project timelines and reducing costs.
Latest Trends
Automating Processes in the Oil and Gas Industry
The trend of automating processes through generative AI is set to redefine operational efficiencies within the oil and gas sector. Companies are increasingly deploying AI-driven solutions to automate complex workflows, from exploration data analysis to predictive maintenance of equipment performance. This shift not only minimizes human error but also significantly reduces operational costs and enhances safety protocols. The integration of AI in these processes allows for real-time decision-making and optimization, ultimately leading to increased productivity and sustainability in operations.
Digital Transformation: A Strategic Imperative
The oil and gas industry's journey towards digital transformation is intensifying, with generative AI acting as a pivotal technology in this transition. As firms seek to remain competitive and relevant in a rapidly evolving market, leveraging AI to harness the power of data becomes critical. Generative AI facilitates the creation of digital twins, simulation models, and scenario analysis, which are essential for strategic planning and risk management. This transformative approach not only fosters innovation but also drives a more resilient business model that can adapt to market volatility and regulatory changes.
Regional Analysis
Generative AI is reshaping the global oil and gas industry, with North America leading at 42.6%.
North America is the dominant region in the adoption of generative AI in the oil and gas industry, accounting for 42.6% of the global market. This prominence is underpinned by substantial investments in AI and machine learning, particularly in the United States and Canada, where there is a strong focus on enhancing operational efficiency and reducing environmental impact through innovative technologies. The presence of major technology and oil and gas firms, which are actively investing in AI research and pilot projects, further strengthens this region's leading position.
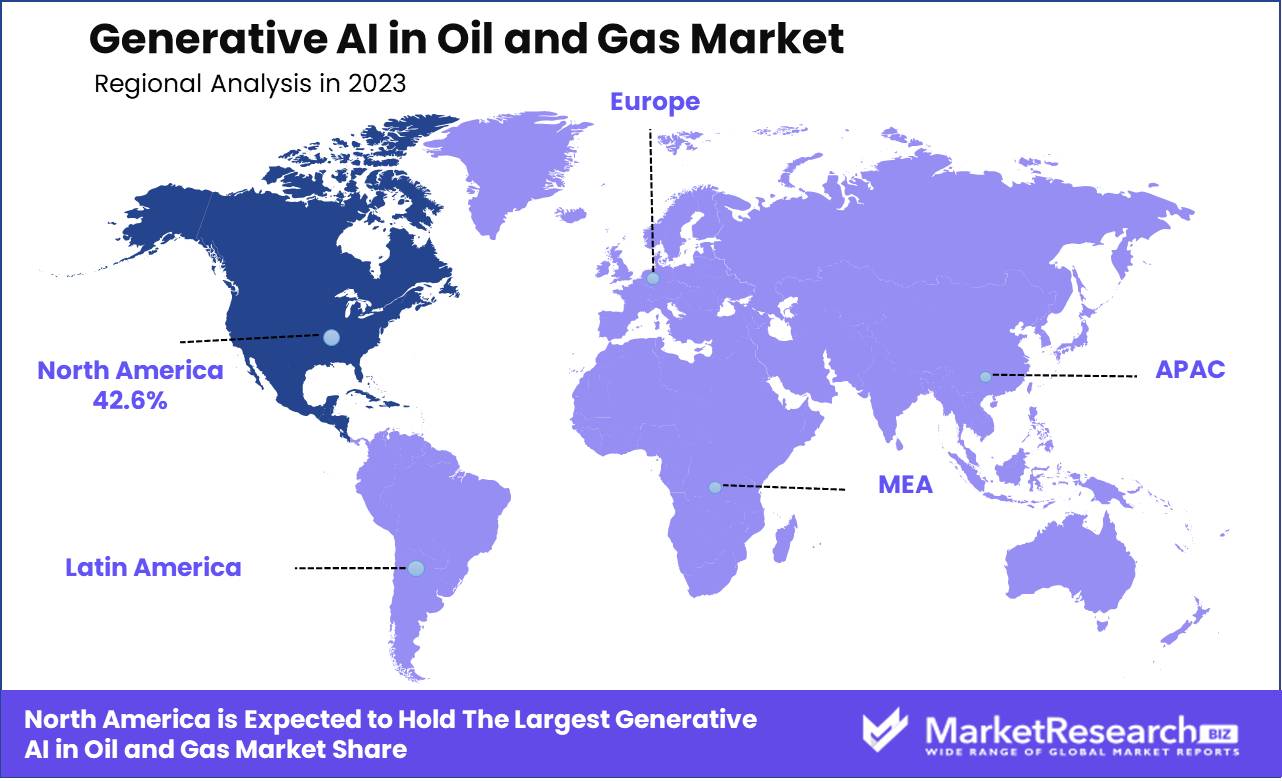
In Europe, the focus on sustainability and regulatory compliance catalyzes AI integration, streamlining exploration and maintenance to boost safety and efficiency, supported by government policies that encourage digital transformation. The Asia Pacific region experiences rapid AI adoption growth, driven by escalating energy demands and a pivot toward digitalization, with leaders like China and India leveraging AI for exploration, optimization, and risk management.
Meanwhile, the Middle East & Africa capitalize on their abundant energy resources by employing AI for enhanced oil recovery and operational efficiencies, particularly in AI-forward nations such as Saudi Arabia and the UAE. In Latin America, although the market size is relatively smaller, there is a growing recognition of AI's potential to improve oil extraction and production, with countries like Brazil and Mexico making significant strides in implementing AI solutions to address operational challenges and enhance productivity. Collectively, these regional dynamics underscore a global shift towards more technologically integrated and efficient energy sector operations.
Key Regions and Countries
North America
- US
- Canada
- Mexico
Western Europe
- Germany
- France
- The UK
- Spain
- Italy
- Portugal
- Ireland
- Austria
- Switzerland
- Benelux
- Nordic
- Rest of Western Europe
Eastern Europe
- Russia
- Poland
- The Czech Republic
- Greece
- Rest of Eastern Europe
APAC
- China
- Japan
- South Korea
- India
- Australia & New Zealand
- Indonesia
- Malaysia
- Philippines
- Singapore
- Thailand
- Vietnam
- Rest of APAC
Latin America
- Brazil
- Colombia
- Chile
- Argentina
- Costa Rica
- Rest of Latin America
Middle East & Africa
- Algeria
- Egypt
- Israel
- Kuwait
- Nigeria
- Saudi Arabia
- South Africa
- Turkey
- United Arab Emirates
- Rest of MEA
Key Players Analysis
In 2024, the global Generative AI in the Oil and Gas market is experiencing robust growth, primarily led by key players such as [ai, Beyond Limits, SparkCognition, Baker Hughes, Schlumberger, and Halliburton], alongside emerging contenders. These companies are leveraging artificial intelligence (AI) to transform operations in the oil and gas industry.
[ai] is renowned for its advanced AI solutions, employing generative AI algorithms to optimize exploration and production processes, thereby enhancing efficiency and reducing costs significantly.
Beyond Limits has introduced cognitive AI technology, revolutionizing predictive maintenance and asset optimization. Through generative AI, Beyond Limits enables predictive insights, minimizing downtime and maximizing asset lifespan.
SparkCognition's expertise in machine learning and AI-driven analytics is pivotal in streamlining drilling operations and reservoir management. Their generative AI models empower data-driven decisions, resulting in improved performance and profitability for oil and gas companies.
Stalwarts like Baker Hughes, Schlumberger, and Halliburton have embraced generative AI to enhance drilling efficiency, reservoir characterization, and production optimization. Their collaboration with tech partners and investment in AI research positions them as leaders in driving digital transformation across the oil and gas operation value chain.
Top Key Players in Generative AI in Oil and Gas Market
- ai
- Beyond Limits
- SparkCognition
- Baker Hughes
- Schlumberger
- Halliburton
- Other Key Players
Recent Development
- In February 2024, Info-Tech Research Group's CIO Priorities published, emphasizes the pivotal role of generative AI in driving exponential value creation for organizations, highlighting five key initiatives for CIOs and IT leaders to prioritize in navigating the evolving digital landscape.
- In August 2023, Wintershall Dea, one of Europe's premier independent natural gas and oil companies, partnered with IBM Consulting to launch an AI Center of Competence (CoC). This collaboration aims to drive forward numerous AI initiatives geared towards enhancing energy production efficiency and fostering innovative solutions for the energy industry.
- In May 2023, Shell Plc announced a collaboration with SparkCognition, a leading big-data analytics firm. The partnership aims to revolutionize Shell's deep-sea exploration and production endeavors by harnessing the power of AI technology. SparkCognition's advanced algorithms will be employed to analyze vast quantities of seismic data, enhancing Shell's efforts to identify and exploit new oil reservoirs in offshore locations. This innovative approach is anticipated to significantly increase Shell's offshore oil output.
Report Scope:
Report Features Description Market Value (2023) USD 226.6 Mn Forecast Revenue (2033) USD 690.1 Mn CAGR (2024-2032) 12.1% Base Year for Estimation 2023 Historic Period 2016-2023 Forecast Period 2024-2033 Report Coverage Revenue Forecast, Market Dynamics, COVID-19 Impact, Competitive Landscape, Recent Developments Segments Covered By Function (Data Analysis and Interpretation, Predictive Modelling, Anomaly Detection, Decision Support, Other Functions); By Application (Asset Maintenance, Drilling Optimization, Exploration and Production, Reservoir Modelling, Other Applications); By Deployment Mode (Cloud-based, On-premise); By End-User (Oil and Gas Companies, Drilling Contractors, Equipment Manufacturers, Service Providers, Consulting Firms) Regional Analysis North America – The US, Canada, & Mexico; Western Europe – Germany, France, The UK, Spain, Italy, Portugal, Ireland, Austria, Switzerland, Benelux, Nordic, & Rest of Western Europe; Eastern Europe – Russia, Poland, The Czech Republic, Greece, & Rest of Eastern Europe; APAC – China, Japan, South Korea, India, Australia & New Zealand, Indonesia, Malaysia, Philippines, Singapore, Thailand, Vietnam, & Rest of APAC; Latin America – Brazil, Colombia, Chile, Argentina, Costa Rica, & Rest of Latin America; Middle East & Africa – Algeria, Egypt, Israel, Kuwait, Nigeria, Saudi Arabia, South Africa, Turkey, United Arab Emirates, & Rest of MEA Competitive Landscape C3.ai, Beyond Limits, SparkCognition, Baker Hughes, Schlumberger, Halliburton, Other Key Players Customization Scope Customization for segments, region/country-level will be provided. Moreover, additional customization can be done based on the requirements. Purchase Options We have three licenses to opt for: Single User License, Multi-User License (Up to 5 Users), Corporate Use License (Unlimited User and Printable PDF) -
-
- ai
- Beyond Limits
- SparkCognition
- Baker Hughes
- Schlumberger
- Halliburton
- Other Key Players
Our Clients


View Our Licence Options
