
Refrigerated Transport Market By Mode of Transportation(Road, Rail, Sea, Air), By temperature(Multi-Temperature, Single Temperature), By application(Food and Beverage, Frozen, Chilled), By Region And Companies - Industry Segment Outlook, Market Assessment, Competition Scenario, Trends, And Forecast 2023-2032
-
7169
-
May 2023
-
167
-


-
This report was compiled by Kalyani Khudsange Kalyani Khudsange is a Research Analyst at Prudour Pvt. Ltd. with 2.5 years of experience in market research and a strong technical background in Chemical Engineering and manufacturing. Correspondence Sr. Research Analyst Linkedin | Detailed Market research Methodology Our methodology involves a mix of primary research, including interviews with leading mental health experts, and secondary research from reputable medical journals and databases. View Detailed Methodology Page
-
Quick Navigation
Report Overview
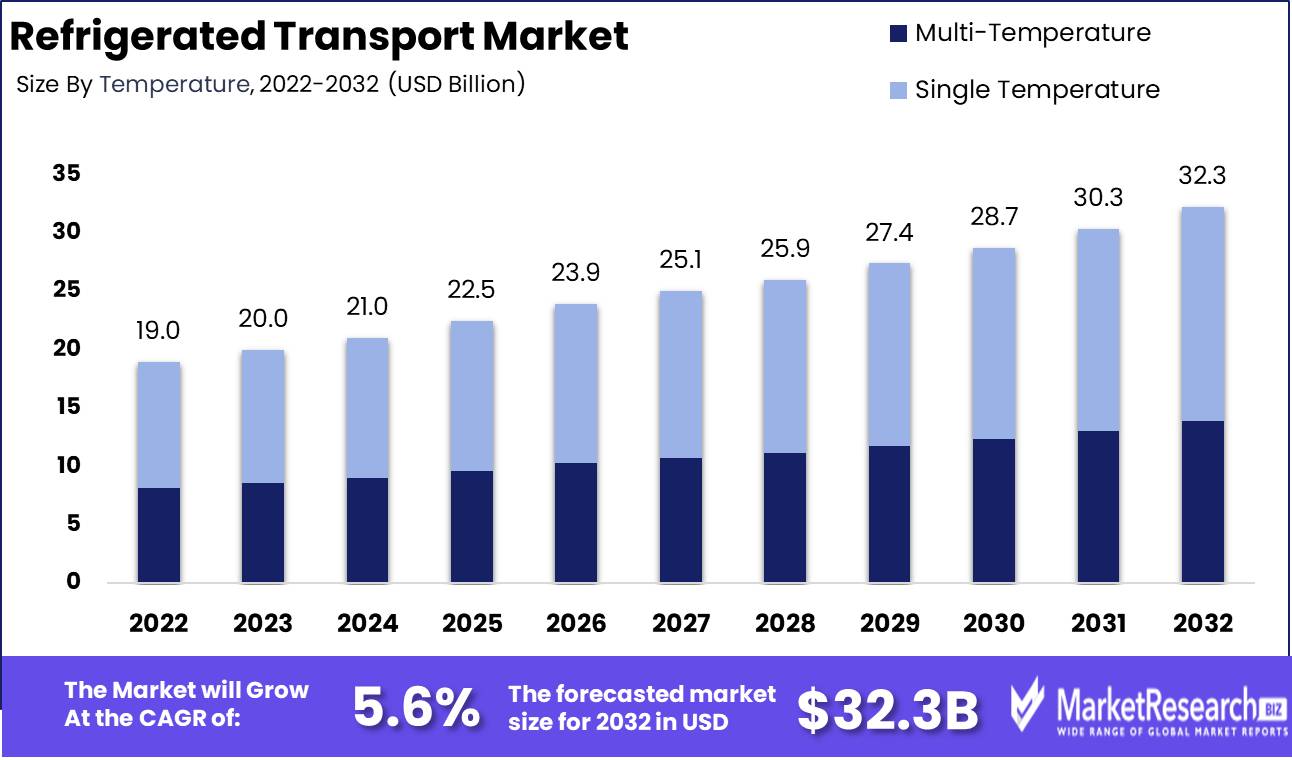
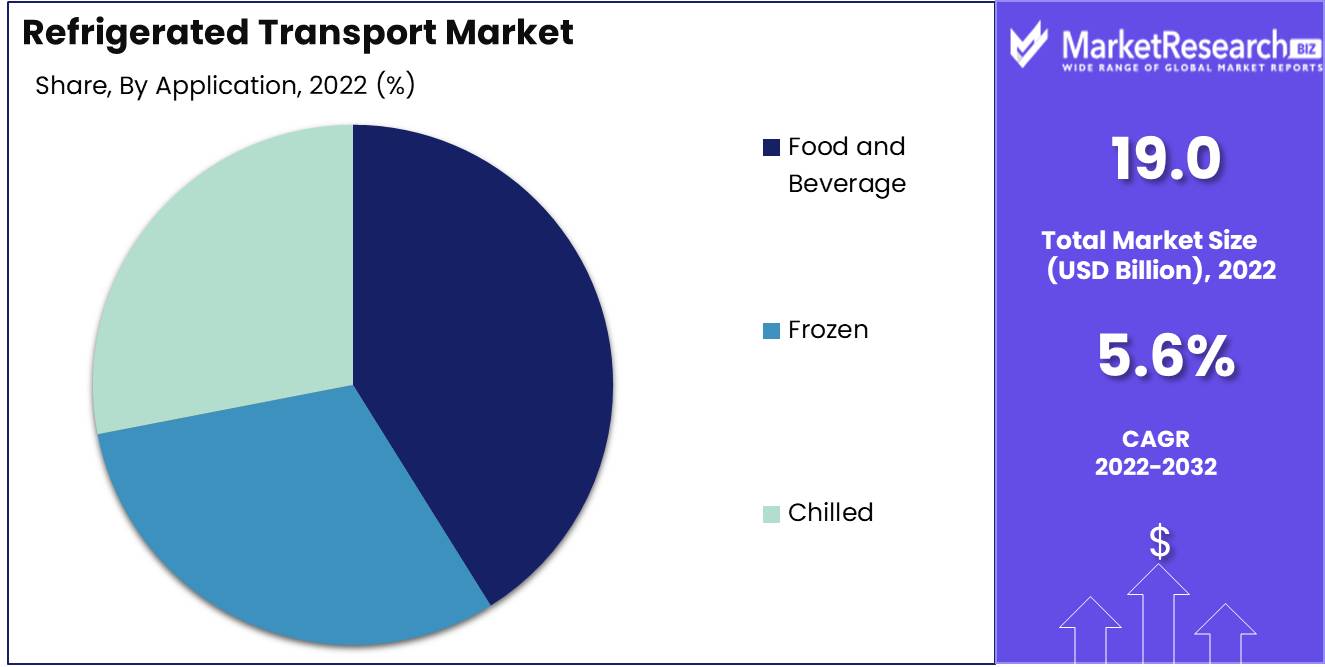
Refrigerated Transport Market size is expected to be worth around USD 32.3 Bn by 2032 from USD 19.0 Bn in 2022, growing at a CAGR of 5.6% during the forecast period from 2023 to 2032.
The refrigerated transport market is a complex and specialized one that involves the safe and secure transportation of temperature-sensitive products from one location to another using refrigerated vehicles. The complexity of this market is exemplified by the fact that these vehicles are designed to maintain a specific temperature range while in motion, either refrigerated or freezing. The market is indispensable, serving various industries such as the food & beverage, pharmaceutical, and floral industries, which rely on it to maintain the quality of their products.
The refrigerated transport market provides numerous advantages to industries that transport temperature-sensitive goods. The greatest benefit is the guarantee of zero quality loss or deterioration of transported products. Thus, the products will arrive at their destination in the same condition in which they were loaded. Moreover, the market provides quick and efficient transportation services that save time for both the transporting and receiving industries, thereby boosting productivity.
Recent years have seen astounding advancements in the refrigerated transport market. One such innovation is the incorporation of telematics technology, which monitors the temperature and location of goods in real-time to ensure the safe transportation of products. The use of GPS tracking technology to provide accurate and up-to-date information on the location of the refrigerated vehicle is yet another revolutionary development. These technological advances have transformed the market, rendering it more efficient and effective.
Numerous companies have invested in the refrigerated transport market in order to improve their transportation services for temperature-sensitive goods. These companies include Carrier, Thermo King, and Daikin, whose products include refrigeration units. Additionally, the market has witnessed an increase in transportation service providers that appeal to various industries, thereby assuring dependable transportation services.
In the future years, there will likely be growth in the refrigerated transport market. The growth is attributable to the increased demand for refrigerated transportation services for goods. The food and beverage and pharmaceutical industries are the primary growth generators for this market, and they are anticipated to continue to do so. In addition, the growth of e-commerce and online food delivery services is projected to increase the demand for refrigerated transportation.
The refrigerated transport market serves industries that require the transportation of goods at specific temperatures in order to maintain the quality and safety of their products. Given the rising demand for medications that are temperature sensitive, the pharmaceutical industry is projected to be the primary contributor to the refrigerated transport market.
The growth of the refrigerated transport market is driven by a number of factors, including the need for appropriate storage and transportation of temperature-sensitive goods, the increase in demand for perishable goods, and the rise of e-commerce and online food delivery. These factors have led to an increase in market investments, which has resulted in technological advancements and improved transportation services.
The refrigerated transport market is not devoid of ethical concerns, especially regarding the use of refrigerants and the environmental impact of refrigerated transportation. In response to these issues, the market is moving towards the adoption of sustainable refrigerants and the reduction of the environmental impact of refrigerated transportation. In addition, the market emphasizes transparency, explainability, and accountability for refrigerated transport companies.
Driving factors
Demand for perishable plant-based products
The increase in demand for plant-based perishable products is another factor driving the growth of the refrigerated transport market. The demand for fresh produce, dairy alternatives, and vegan proteins that need to be transported in refrigerated conditions has increased as more people adopt plant-based diets for health and environmental reasons.
Rise of Ready-to-Eat Food Products
In developing nations, there is also a growing demand for refrigerated transport of ready-to-eat food products. As people in these countries adopt busier lifestyles and seek out convenient meal options, the need for refrigerated transport of these items has increased significantly.
Energy-Efficient Solutions Are Required
The refrigerated transport marketization is also in need of energy-efficient solutions. In response to rising petroleum prices and environmental concerns regarding the impact of cargo, there is a growing demand for more environmentally friendly modes of transportation.
Potential Changes in Regulation
However, prospective regulatory changes may have an impact on the refrigerated transport market. Stricter emission regulations could affect the types of vehicles permitted on the road, which could have an impact on the cost and availability of refrigerated transport solutions.
Influence of New Technologies
Emerging technologies such as electric and hybrid vehicles could have an impact on the refrigerated transport market. These technologies are more energy-efficient and eco-friendly, making them an attractive option for businesses seeking to reduce their carbon footprint.
Disruptive Factors in the Competitive Environment
The competitive landscape of the refrigerated transport market could be disrupted by new market entrants or alterations in consumer behavior that have an impact on the types of products being transported. A transition away from meat consumption, for instance, could have an impact on the demand for refrigerated transport of livestock products.
Impact of Online Shopping and Direct-to-Consumer Shipping
The rise of e-commerce and direct-to-consumer delivery may also have an impact on the refrigerated transport market. The need for refrigerated transport services to keep these perishable products fresh during transit may increase as more people purchase online and demand quicker delivery times.
In the coming years, the refrigerated transport market is expected to expand significantly due to a number of factors, including shifting consumer preferences, emerging technologies, and environmental concerns. To remain competitive, businesses operating in this market will need to anticipate trends and adjust to shifting conditions.
Restraining Factors
Principal Problems and Resolutions
The expansion of the global refrigerated transport market has been fueled by the rising demand for frozen food products. However, this development is accompanied by a number of obstacles that are putting a strain on the industry, particularly in the areas of transportation and environmental sustainability. In this article, we will examine some of the most significant restraining factors impacting the frozen food transportation industry and offer potential solutions for addressing them.
Concerns Relating to the Consumption of Frozen Food
The potential health hazards associated with the consumption of frozen food products is one of the primary concerns associated with their consumption. In the long term, additives, preservatives, and high sodium and cholesterol levels in frozen foods are detrimental to human health. Furthermore, improper thawing, heating, and storage practises can result in food contamination and food-borne illnesses.
To mitigate these health risks, the frozen food transportation industry must adopt stricter quality control measures and adhere to international food safety standards like HACCP (Hazard Analysis and Critical Control Point).
High Cost of Transportation Maintenance
The high cost of refrigerated transport vehicle maintenance and repair is another significant factor that is putting a strain on the frozen food transport industry. Purchase, operation, and maintenance of refrigerated vehicles and containers are costly, with repair costs varying from modest restorations to complete overhauls.
To surmount this obstacle, companies can investigate alternative fuel options and invest in hybrid electric vehicles that are more energy-efficient and cost-effective over time. Additionally, they can elect for improved fleet management practices, routine vehicle maintenance, and training to increase fuel efficiency and decrease repair costs.
Environmental Concerns
The refrigerated transport industry is a significant contributor to greenhouse gas emissions, the leading cause of global warming and climate change. The use of diesel-powered refrigeration units and the inefficient operation of refrigerated transport vehicles are among the most significant contributors to these emissions.
Companies must implement eco-friendly refrigeration systems and invest in renewable energy sources, such as solar and wind-powered transportation, in order to reduce the carbon footprint of the frozen food industry. In addition, they can implement energy-efficient practices such as using GPS tracking to optimize routes, decreasing inactive time, and enhancing logistics management.
Fuel Cost
The refrigerated transportation industry is highly reliant on fossil fuels, specifically diesel, whose prices are subject to market fluctuations. The industry's profitability and operational expenses are substantially impacted by fluctuating fuel prices, making it difficult to pass these costs on to customers.
Companies can look into alternative energy sources like biofuels, hydrogen fuel cells, and electric refrigeration devices to reduce their reliance on fossil fuels. In addition, they can implement fuel-efficient driving practices, optimize routes, and utilize alternative modes of transportation like rail and marine freight.
Mode of Transportation Analysis
Due to its convenience and flexibility, the road segment dominates the refrigerated transport market. To maintain the integrity of the conveyed products, they must be transported in a controlled temperature and humidity environment. This control is provided by the road mode of transportation, which is readily accessible and has the ability to reach the ultimate destination of the goods.
Over the past decade, emerging economies such as China, India, and Brazil have experienced consistent economic growth. The expanding middle class in these nations has increased the demand for processed and organic food products. This is fueling the growth of the refrigerated transport market, as transporting perishable goods requires environments with controlled temperatures and humidity. Due to its flexibility and convenience, the road transport segment is well-positioned to satisfy this growing demand.
Increased consumer awareness of the quality and freshness of their food products has led to an increase in demand for refrigerated transportation. Additionally, the trend toward convenience foods and online purchasing has increased the demand for refrigerated transport due to the need to maintain the quality and integrity of perishable goods. Road transport is the preferable mode of transportation due to its ability to reach the goods' final destination and its flexibility.
Temperature Analysis
Analyzing the temperature range for refrigerated transport reveals that a single segment dominates the market. This is due to the fact that a single temperature range is required for the preponderance of perishable goods that are transported. The single segment mode of transportation provides essential control for transporting these products.
The adoption of the single segment mode of transportation is driven by emerging economies. These countries' economic growth has led to an increase in demand for processed and raw food products. This demand is well-served by the single segment mode of transportation, as it provides the necessary control to transport these products.
Increasing consumer awareness of the quality and freshness of their food products has led to an increase in demand for refrigerated transportation. In addition, there is a growing trend toward healthy dining, which is propelling the demand for fresh produce. Due to its capability to provide the essential temperature range control, the single segment mode of transportation is preferred.
Application Analysis
The food and beverage market segment dominates the refrigerated transport market. This is due to the necessity of transporting perishable food products that require specific temperature ranges to maintain their integrity.
Emerging economies are propelling the adoption of refrigerated transport in the food and beverage segment. The demand for processed and fresh food products has increased as a result of economic growth in these nations, driving the expansion of the refrigerated transport market.
The demand for refrigerated transport in the food and beverage segment has increased as consumers become more concerned with the quality and freshness of their food products. Transport is necessary to maintain the integrity of the fresh and nutritious food products that consumers are demanding more and more.
Key Market Segments
By mode of transportation:
- Road
- Light Commercial Vehicle (LCV)
- Heavy Commercial Vehicle (HCV)
- Medium and Heavy Commercial Vehicles (MHCV)
- Rail
- Sea
- Air
By Temperature:
- Multi-Temperature
- Single Temperature
By Application:
- Food and Beverage
- Frozen
- Chilled
Growth Opportunity
Food and beverages sector expansion
In recent years, the food and beverage industry has experienced exceptional growth. This development is driven by a number of factors, including a growing population, a growing demand for convenience among consumers, and rising disposable income levels.
As the food and beverage industry continues to grow, frozen and perishable goods have become a crucial subsector. To preserve the quality and freshness of these products, they must be transported rapidly and efficiently. There is a growing demand for refrigerated transport services because refrigerated transport is essential to ensuring that these goods arrive at their destination in pristine condition.
augmented demand for frozen and perishable goods
As consumers become more health-conscious and seek out fresh, nutrient-dense foods, the demand for frozen and perishable food has increased and is expected to continue growing at a consistent rate. The trend is driven by a number of factors, including an increase in the number of households with two working parents, a rise in the number of seniors, and the expansion of the middle class in emergent countries.
To meet this growing demand, numerous food companies are expanding their production capacities and product lines to include frozen and perishable goods. To transport these perishable goods at the required temperature and expiration life, refrigerated transport services are extensively used.
escalating demand for natural and organic products
As consumers become more health-conscious and cognizant of the benefits of consuming organic and natural foods, the demand for organic and natural products has increased. Organic and natural products require specialized transport to accommodate their unique requirements, such as temperature and humidity restrictions.
Since organic and natural products are extremely perishable and require precise temperature control, refrigerated transport is essential for their transportation. The demand for refrigerated transport is anticipated to increase in the future years, as the market for organic and natural products is expected to continue growing.
Increasing demand for supper delivery services
As time-strapped consumers seek quick and simple solutions to their mealtime dilemmas, the popularity of meal delivery services has been growing. Meal delivery services, such as fresh food delivery, provide consumers with a variety of options, including organic and healthful foods.
Refrigerated transport is essential to the success of meal delivery services, ensuring that perishable goods arrive at their destination promptly and safely. As the demand for supper delivery services increases, so will the demand for effective refrigerated transportation services.
Latest Trends
Demand Increase for Fresh and Organic Produce
Today's consumers are increasingly health-conscious and actively search for fresh and organic produce. Retailers and wholesalers are rushing to satisfy the increased demand for cold-chain logistics services caused by this trend.
This necessitates the optimization of supply chain solutions for the transportation of fresh and organic produce, such as the use of temperature-controlled vehicles that provide the optimal environment for transporting these products. In order to keep the product in the best possible condition throughout its voyage, technologies like Internet of Things (IoT) sensors that monitor temperature, humidity, and air quality are being adopted.
Demand for temperature-controlled pharmaceuticals is increasing
Pharmaceutical companies are among the largest players in refrigerated transportation, necessitating specialized services to transport their temperature-sensitive products. With market trends indicating a growing demand for refrigerated biologics, personalized medicine, and cell and gene therapies, this sector has emerged as a crucial variable in the cold-chain logistics equation.
Pharmaceuticals can now be printed on demand due to the use of 3D printers in the production of medication, increasing the demand for specialized transport services. Utilizing technologies like real-time monitoring and visibility, predictive analytics, and temperature-sensitive packaging, the sector is optimizing operational efficiencies and safety.
Demand for sustainability and energy efficiency is Increasing
Sustainability and energy efficiency are now major concerns in the refrigerated transportation industry, with an increasing number of businesses adopting more eco-friendly practices. This trend is primarily driven by a growing awareness of the negative effects carbon emissions have on the environment.
As a response to this demand for more sustainable practices, electric transport solutions like electric refrigerated vehicles, trucks, and trailers are gaining popularity. In order to reduce carbon intensity and create a more sustainable future, energy-efficient technologies like hybrid diesel-electric power units and solar panels are also being integrated into supply chain operations.
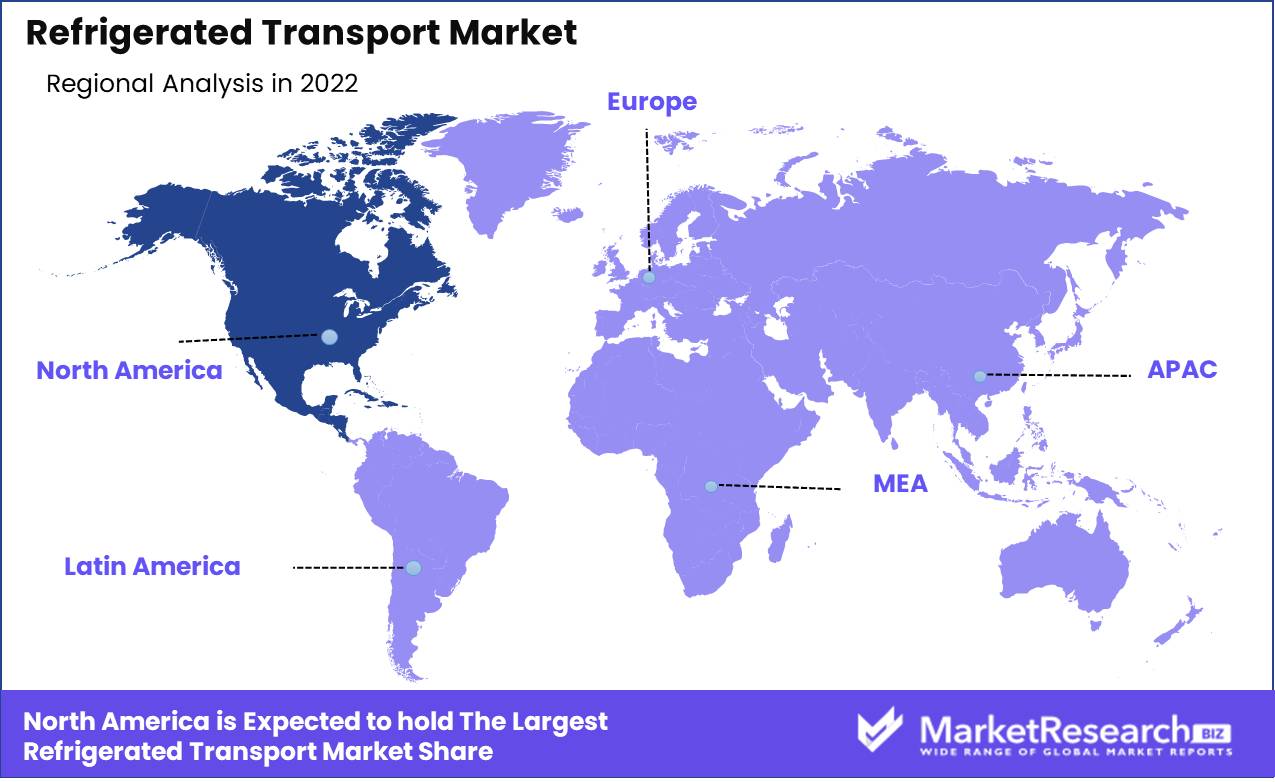
Regional Analysis
North America has emerged as the dominant region in the global refrigerated transport market, accounting for a sizable portion of industry revenue. The growth of the region can be attributed to a number of factors, including the rising demand for perishable goods, the expansion of the e-commerce industry, and strict government regulations governing the transportation of food and pharmaceutical products.
Increasing demand for perishable products is one of the key factors driving the refrigerated transport market in North America. Due to rising disposable incomes and shifting consumer preferences, the consumption of frozen and chilled food products in the region has increased significantly. This has increased the demand for temperature-controlled transportation services, as these products require a specific temperature range to ensure their quality and freshness during transit.
The growth of the e-commerce industry has contributed to North America's dominance in the refrigerated transport market. Due to the growing popularity of online purchasing, consumers are increasingly acquiring perishable products online, which has led to a surge in demand for refrigerated transport services. E-commerce companies such as Amazon, Walmart, and Target have expanded their logistics capabilities to ensure that perishable products are delivered to consumers in a timely and secure manner, which has fueled the growth of the refrigerated transport market in North America.
The stringent government regulations regarding the transportation of food and pharmaceutical products have contributed to the growth of the refrigerated transport market in North America. The United States Department of Agriculture (USDA) and the Food and Drug Administration (FDA) have enacted food safety and transportation regulations that mandate temperature-controlled transportation for certain products. These regulations have made it mandatory for companies to adhere to the required temperature requirements during transportation, which has led to an increase in demand for refrigerated transport services.
The North American refrigerated transport market is extremely fragmented, with numerous participants offering a vast array of temperature-controlled transportation services. The region's well-established logistics infrastructure and cutting-edge technology allow for the efficient and effective transportation of perishable products. Companies such as C.H. Robinson, Americold, and Lineage Logistics have invested in cutting-edge technologies such as real-time monitoring and tracking systems, which have enhanced the safety and effectiveness of temperature-controlled transportation services.
Key Regions and Countries
North America
- US
- Canada
- Mexico
Western Europe
- Germany
- France
- The UK
- Spain
- Italy
- Portugal
- Ireland
- Austria
- Switzerland
- Benelux
- Nordic
- Rest of Western Europe
Eastern Europe
- Russia
- Poland
- The Czech Republic
- Greece
- Rest of Eastern Europe
APAC
- China
- Japan
- South Korea
- India
- Australia & New Zealand
- Indonesia
- Malaysia
- Philippines
- Singapore
- Thailand
- Vietnam
- Rest of APAC
Latin America
- Brazil
- Colombia
- Chile
- Argentina
- Costa Rica
- Rest of Latin America
Middle East & Africa
- Algeria
- Egypt
- Israel
- Kuwait
- Nigeria
- Saudi Arabia
- South Africa
- Turkey
- United Arab Emirates
- Rest of MEA
Key Players Analysis
The refrigerated transport market is a highly competitive industry with numerous major competitors contending for market share. Carrier Transicold, Thermo King, Schmitz Cargobull AG, GAH Refrigeration Ltd, Daikin Industries Ltd, and Fleet Masters are among the leading companies in this industry. These businesses provide a range of refrigerated transport services, including the manufacturing and distribution of refrigerated vehicles, the rental of temperature-controlled containers, and the provision of logistics solutions.
Carrier Transicold is one of the primary players in the refrigerated transport market, providing a range of products and services including refrigerated truck trailers, temperature-controlled containers, and a telematics platform for tracking and monitoring cargo. Thermo King, another market leader, is renowned for its innovative products and services, which include refrigeration units, transportation solutions, and refrigeration monitoring systems.
Schmitz Cargobull AG is a German company that manufactures and sells refrigerated trailers and semitrailers. GAH Refrigeration Ltd, on the other hand, is a UK-based company that provides refrigeration systems to a broad range of industries, including the medical, pharmaceutical, and food and beverage sectors.
Daikin Industries Ltd is a Japanese multinational company that provides a range of refrigeration and air conditioning solutions, including marine refrigeration systems and commercial refrigeration systems. The logistics company Fleet Masters, situated in the United States, offers temperature-controlled conveyance services to the healthcare and hospitality industries.
Top Key Players in Refrigerated Transport Market
- United Technologies Corporation (Carrier Corporation)
- Daikin Industries, Ltd.
- Ingersoll-Rand plc (Thermo King Corporation)
- China International Marine Containers (Group) Co., Ltd.
- Utility Trailer Manufacturing Company
- Singamas Container Holdings Limited
- Hyundai Motor Company
- Schmitz Cargobull AG
- Krone Fahrzeugwerk Bernard Krone GmbH
- Lamberet SAS
Recent Development
In March 2022 Renowned giant in the technology industry, United Technologies Corporation (UTC), has recently announced its partnership with Phillips Connect, a prominent provider of connected asset solutions, through the introduction of a revolutionary product called Utility Connect. By providing real-time data monitoring and insights into the performance of onboard refrigeration units, this innovative solution is set to strengthen the refrigerated transport industry.
Utility Connect is a comprehensive solution that combines UTC's sophisticated telematics expertise with Phillips Connect's cutting-edge monitoring technology in order to provide fleet operators with greater visibility into the condition and performance of their refrigerated units. With the ability to detect anomalies and trends in real time, fleet managers can proactively maintain their vehicles and reduce the likelihood of spoilage or equipment failure.
In addition to real-time monitoring, Utility Connect also provides predictive analytics, giving fleet managers the ability to spot problems and make data-driven decisions early. This ensures that potential issues are addressed before they become severe, reducing repair costs and vehicle downtime.
The introduction of Utility Connect signifies a major milestone in the refrigerated transport industry, granting manufacturers and distributors full control over cold chain logistics. With its ability to provide real-time monitoring, predictive analytics, and enhanced visibility across the entire fleet, this innovative solution is poised to set a new standard for efficiency, safety, and quality in the refrigerated transport market.
Report Scope:
Report Features Description Market Value (2022) USD 19.0 Bn Forecast Revenue (2032) USD 32.3 Bn CAGR (2023-2032) 5.6% Base Year for Estimation 2022 Historic Period 2016-2022 Forecast Period 2023-2032 Report Coverage Revenue Forecast, Market Dynamics, COVID-19 Impact, Competitive Landscape, Recent Developments Segments Covered By Mode of Transportation(Road, Rail, Sea, Air), By temperature(Multi-Temperature, Single Temperature), By application(Food and Beverage, Frozen, Chilled) Regional Analysis North America – The US, Canada, & Mexico; Western Europe – Germany, France, The UK, Spain, Italy, Portugal, Ireland, Austria, Switzerland, Benelux, Nordic, & Rest of Western Europe; Eastern Europe – Russia, Poland, The Czech Republic, Greece, & Rest of Eastern Europe; APAC – China, Japan, South Korea, India, Australia & New Zealand, Indonesia, Malaysia, Philippines, Singapore, Thailand, Vietnam, & Rest of APAC; Latin America – Brazil, Colombia, Chile, Argentina, Costa Rica, & Rest of Latin America; Middle East & Africa – Algeria, Egypt, Israel, Kuwait, Nigeria, Saudi Arabia, South Africa, Turkey, United Arab Emirates, & Rest of MEA Competitive Landscape United Technologies Corporation (Carrier Corporation), Daikin Industries, Ltd., Ingersoll-Rand plc (Thermo King Corporation), China International Marine Containers (Group) Co., Ltd., Utility Trailer Manufacturing Company, Singamas Container Holdings Limited, Hyundai Motor Company, Schmitz Cargobull AG, Krone Fahrzeugwerk Bernard Krone GmbH, Lamberet SAS Customization Scope Customization for segments, region/country-level will be provided. Moreover, additional customization can be done based on the requirements. Purchase Options We have three licenses to opt for: Single User License, Multi-User License (Up to 5 Users), Corporate Use License (Unlimited User and Printable PDF) - Road
-
- 1. Executive Summary
- 1.1. Definition
- 1.2. Taxonomy
- 1.3. Research Scope
- 1.4. Key Analysis
- 1.5. Key Findings by Major Segments
- 1.6. Top strategies by Major Players
- 2. Global Refrigerated Transport Market Overview
- 2.1. Refrigerated Transport Market Dynamics
- 2.1.1. Drivers
- 2.1.2. Opportunities
- 2.1.3. Restraints
- 2.1.4. Challenges
- 2.2. Macro-economic Factors
- 2.3. Regulatory Framework
- 2.4. Market Investment Feasibility Index
- 2.5. PEST Analysis
- 2.6. PORTER’S Five Force Analysis
- 2.7. Drivers & Restraints Impact Analysis
- 2.8. Industry Chain Analysis
- 2.9. Cost Structure Analysis
- 2.10. Marketing Strategy
- 2.11. Russia-Ukraine War Impact Analysis
- 2.12. Opportunity Map Analysis
- 2.13. Market Competition Scenario Analysis
- 2.14. Product Life Cycle Analysis
- 2.15. Opportunity Orbits
- 2.16. Manufacturer Intensity Map
- 2.17. Major Companies sales by Value & Volume
- 2.1. Refrigerated Transport Market Dynamics
- 3. Global Refrigerated Transport Market Analysis, Opportunity and Forecast, 2016-2032
- 3.1. Global Refrigerated Transport Market Analysis, 2016-2021
- 3.2. Global Refrigerated Transport Market Opportunity and Forecast, 2023-2032
- 3.3. Global Refrigerated Transport Market Analysis, Opportunity and Forecast, By By mode of transportation:, 2016-2032
- 3.3.1. Global Refrigerated Transport Market Analysis by By mode of transportation:: Introduction
- 3.3.2. Market Size Absolute $ Opportunity Analysis and Forecast, By By mode of transportation:, 2016-2032
- 3.3.5. Road
- 3.3.6. Light Commercial Vehicle (LCV)
- 3.3.7. Heavy Commercial Vehicle (HCV)
- 3.3.8. Medium and Heavy Commercial Vehicles (MHCV)
- 3.3.9. Rail
- 3.3.10. Sea
- 3.3.11. Air
- 3.4. Global Refrigerated Transport Market Analysis, Opportunity and Forecast, By By Temperature:, 2016-2032
- 3.4.1. Global Refrigerated Transport Market Analysis by By Temperature:: Introduction
- 3.4.2. Market Size Absolute $ Opportunity Analysis and Forecast, By By Temperature:, 2016-2032
- 3.4.3. Multi-Temperature
- 3.4.4. Single Temperature
- 3.5. Global Refrigerated Transport Market Analysis, Opportunity and Forecast, By By Application:, 2016-2032
- 3.5.1. Global Refrigerated Transport Market Analysis by By Application:: Introduction
- 3.5.2. Market Size Absolute $ Opportunity Analysis and Forecast, By By Application:, 2016-2032
- 3.5.3. Food and Beverage
- 3.5.4. Frozen
- 3.5.5. Chilled
- 4. North America Refrigerated Transport Market Analysis, Opportunity and Forecast, 2016-2032
- 4.1. North America Refrigerated Transport Market Analysis, 2016-2021
- 4.2. North America Refrigerated Transport Market Opportunity and Forecast, 2023-2032
- 4.3. North America Refrigerated Transport Market Analysis, Opportunity and Forecast, By By mode of transportation:, 2016-2032
- 4.3.1. North America Refrigerated Transport Market Analysis by By mode of transportation:: Introduction
- 4.3.2. Market Size Absolute $ Opportunity Analysis and Forecast, By By mode of transportation:, 2016-2032
- 4.3.5. Road
- 4.3.6. Light Commercial Vehicle (LCV)
- 4.3.7. Heavy Commercial Vehicle (HCV)
- 4.3.8. Medium and Heavy Commercial Vehicles (MHCV)
- 4.3.9. Rail
- 4.3.10. Sea
- 4.3.11. Air
- 4.4. North America Refrigerated Transport Market Analysis, Opportunity and Forecast, By By Temperature:, 2016-2032
- 4.4.1. North America Refrigerated Transport Market Analysis by By Temperature:: Introduction
- 4.4.2. Market Size Absolute $ Opportunity Analysis and Forecast, By By Temperature:, 2016-2032
- 4.4.3. Multi-Temperature
- 4.4.4. Single Temperature
- 4.5. North America Refrigerated Transport Market Analysis, Opportunity and Forecast, By By Application:, 2016-2032
- 4.5.1. North America Refrigerated Transport Market Analysis by By Application:: Introduction
- 4.5.2. Market Size Absolute $ Opportunity Analysis and Forecast, By By Application:, 2016-2032
- 4.5.3. Food and Beverage
- 4.5.4. Frozen
- 4.5.5. Chilled
- 4.6. North America Refrigerated Transport Market Analysis, Opportunity and Forecast, By Country , 2016-2032
- 4.6.1. North America Refrigerated Transport Market Analysis by Country : Introduction
- 4.6.2. Market Size Absolute $ Opportunity Analysis and Forecast, Country , 2016-2032
- 4.6.2.1. The US
- 4.6.2.2. Canada
- 4.6.2.3. Mexico
- 5. Western Europe Refrigerated Transport Market Analysis, Opportunity and Forecast, 2016-2032
- 5.1. Western Europe Refrigerated Transport Market Analysis, 2016-2021
- 5.2. Western Europe Refrigerated Transport Market Opportunity and Forecast, 2023-2032
- 5.3. Western Europe Refrigerated Transport Market Analysis, Opportunity and Forecast, By By mode of transportation:, 2016-2032
- 5.3.1. Western Europe Refrigerated Transport Market Analysis by By mode of transportation:: Introduction
- 5.3.2. Market Size Absolute $ Opportunity Analysis and Forecast, By By mode of transportation:, 2016-2032
- 5.3.5. Road
- 5.3.6. Light Commercial Vehicle (LCV)
- 5.3.7. Heavy Commercial Vehicle (HCV)
- 5.3.8. Medium and Heavy Commercial Vehicles (MHCV)
- 5.3.9. Rail
- 5.3.10. Sea
- 5.3.11. Air
- 5.4. Western Europe Refrigerated Transport Market Analysis, Opportunity and Forecast, By By Temperature:, 2016-2032
- 5.4.1. Western Europe Refrigerated Transport Market Analysis by By Temperature:: Introduction
- 5.4.2. Market Size Absolute $ Opportunity Analysis and Forecast, By By Temperature:, 2016-2032
- 5.4.3. Multi-Temperature
- 5.4.4. Single Temperature
- 5.5. Western Europe Refrigerated Transport Market Analysis, Opportunity and Forecast, By By Application:, 2016-2032
- 5.5.1. Western Europe Refrigerated Transport Market Analysis by By Application:: Introduction
- 5.5.2. Market Size Absolute $ Opportunity Analysis and Forecast, By By Application:, 2016-2032
- 5.5.3. Food and Beverage
- 5.5.4. Frozen
- 5.5.5. Chilled
- 5.6. Western Europe Refrigerated Transport Market Analysis, Opportunity and Forecast, By Country , 2016-2032
- 5.6.1. Western Europe Refrigerated Transport Market Analysis by Country : Introduction
- 5.6.2. Market Size Absolute $ Opportunity Analysis and Forecast, Country , 2016-2032
- 5.6.2.1. Germany
- 5.6.2.2. France
- 5.6.2.3. The UK
- 5.6.2.4. Spain
- 5.6.2.5. Italy
- 5.6.2.6. Portugal
- 5.6.2.7. Ireland
- 5.6.2.8. Austria
- 5.6.2.9. Switzerland
- 5.6.2.10. Benelux
- 5.6.2.11. Nordic
- 5.6.2.12. Rest of Western Europe
- 6. Eastern Europe Refrigerated Transport Market Analysis, Opportunity and Forecast, 2016-2032
- 6.1. Eastern Europe Refrigerated Transport Market Analysis, 2016-2021
- 6.2. Eastern Europe Refrigerated Transport Market Opportunity and Forecast, 2023-2032
- 6.3. Eastern Europe Refrigerated Transport Market Analysis, Opportunity and Forecast, By By mode of transportation:, 2016-2032
- 6.3.1. Eastern Europe Refrigerated Transport Market Analysis by By mode of transportation:: Introduction
- 6.3.2. Market Size Absolute $ Opportunity Analysis and Forecast, By By mode of transportation:, 2016-2032
- 6.3.5. Road
- 6.3.6. Light Commercial Vehicle (LCV)
- 6.3.7. Heavy Commercial Vehicle (HCV)
- 6.3.8. Medium and Heavy Commercial Vehicles (MHCV)
- 6.3.9. Rail
- 6.3.10. Sea
- 6.3.11. Air
- 6.4. Eastern Europe Refrigerated Transport Market Analysis, Opportunity and Forecast, By By Temperature:, 2016-2032
- 6.4.1. Eastern Europe Refrigerated Transport Market Analysis by By Temperature:: Introduction
- 6.4.2. Market Size Absolute $ Opportunity Analysis and Forecast, By By Temperature:, 2016-2032
- 6.4.3. Multi-Temperature
- 6.4.4. Single Temperature
- 6.5. Eastern Europe Refrigerated Transport Market Analysis, Opportunity and Forecast, By By Application:, 2016-2032
- 6.5.1. Eastern Europe Refrigerated Transport Market Analysis by By Application:: Introduction
- 6.5.2. Market Size Absolute $ Opportunity Analysis and Forecast, By By Application:, 2016-2032
- 6.5.3. Food and Beverage
- 6.5.4. Frozen
- 6.5.5. Chilled
- 6.6. Eastern Europe Refrigerated Transport Market Analysis, Opportunity and Forecast, By Country , 2016-2032
- 6.6.1. Eastern Europe Refrigerated Transport Market Analysis by Country : Introduction
- 6.6.2. Market Size Absolute $ Opportunity Analysis and Forecast, Country , 2016-2032
- 6.6.2.1. Russia
- 6.6.2.2. Poland
- 6.6.2.3. The Czech Republic
- 6.6.2.4. Greece
- 6.6.2.5. Rest of Eastern Europe
- 7. APAC Refrigerated Transport Market Analysis, Opportunity and Forecast, 2016-2032
- 7.1. APAC Refrigerated Transport Market Analysis, 2016-2021
- 7.2. APAC Refrigerated Transport Market Opportunity and Forecast, 2023-2032
- 7.3. APAC Refrigerated Transport Market Analysis, Opportunity and Forecast, By By mode of transportation:, 2016-2032
- 7.3.1. APAC Refrigerated Transport Market Analysis by By mode of transportation:: Introduction
- 7.3.2. Market Size Absolute $ Opportunity Analysis and Forecast, By By mode of transportation:, 2016-2032
- 7.3.5. Road
- 7.3.6. Light Commercial Vehicle (LCV)
- 7.3.7. Heavy Commercial Vehicle (HCV)
- 7.3.8. Medium and Heavy Commercial Vehicles (MHCV)
- 7.3.9. Rail
- 7.3.10. Sea
- 7.3.11. Air
- 7.4. APAC Refrigerated Transport Market Analysis, Opportunity and Forecast, By By Temperature:, 2016-2032
- 7.4.1. APAC Refrigerated Transport Market Analysis by By Temperature:: Introduction
- 7.4.2. Market Size Absolute $ Opportunity Analysis and Forecast, By By Temperature:, 2016-2032
- 7.4.3. Multi-Temperature
- 7.4.4. Single Temperature
- 7.5. APAC Refrigerated Transport Market Analysis, Opportunity and Forecast, By By Application:, 2016-2032
- 7.5.1. APAC Refrigerated Transport Market Analysis by By Application:: Introduction
- 7.5.2. Market Size Absolute $ Opportunity Analysis and Forecast, By By Application:, 2016-2032
- 7.5.3. Food and Beverage
- 7.5.4. Frozen
- 7.5.5. Chilled
- 7.6. APAC Refrigerated Transport Market Analysis, Opportunity and Forecast, By Country , 2016-2032
- 7.6.1. APAC Refrigerated Transport Market Analysis by Country : Introduction
- 7.6.2. Market Size Absolute $ Opportunity Analysis and Forecast, Country , 2016-2032
- 7.6.2.1. China
- 7.6.2.2. Japan
- 7.6.2.3. South Korea
- 7.6.2.4. India
- 7.6.2.5. Australia & New Zeland
- 7.6.2.6. Indonesia
- 7.6.2.7. Malaysia
- 7.6.2.8. Philippines
- 7.6.2.9. Singapore
- 7.6.2.10. Thailand
- 7.6.2.11. Vietnam
- 7.6.2.12. Rest of APAC
- 8. Latin America Refrigerated Transport Market Analysis, Opportunity and Forecast, 2016-2032
- 8.1. Latin America Refrigerated Transport Market Analysis, 2016-2021
- 8.2. Latin America Refrigerated Transport Market Opportunity and Forecast, 2023-2032
- 8.3. Latin America Refrigerated Transport Market Analysis, Opportunity and Forecast, By By mode of transportation:, 2016-2032
- 8.3.1. Latin America Refrigerated Transport Market Analysis by By mode of transportation:: Introduction
- 8.3.2. Market Size Absolute $ Opportunity Analysis and Forecast, By By mode of transportation:, 2016-2032
- 8.3.5. Road
- 8.3.6. Light Commercial Vehicle (LCV)
- 8.3.7. Heavy Commercial Vehicle (HCV)
- 8.3.8. Medium and Heavy Commercial Vehicles (MHCV)
- 8.3.9. Rail
- 8.3.10. Sea
- 8.3.11. Air
- 8.4. Latin America Refrigerated Transport Market Analysis, Opportunity and Forecast, By By Temperature:, 2016-2032
- 8.4.1. Latin America Refrigerated Transport Market Analysis by By Temperature:: Introduction
- 8.4.2. Market Size Absolute $ Opportunity Analysis and Forecast, By By Temperature:, 2016-2032
- 8.4.3. Multi-Temperature
- 8.4.4. Single Temperature
- 8.5. Latin America Refrigerated Transport Market Analysis, Opportunity and Forecast, By By Application:, 2016-2032
- 8.5.1. Latin America Refrigerated Transport Market Analysis by By Application:: Introduction
- 8.5.2. Market Size Absolute $ Opportunity Analysis and Forecast, By By Application:, 2016-2032
- 8.5.3. Food and Beverage
- 8.5.4. Frozen
- 8.5.5. Chilled
- 8.6. Latin America Refrigerated Transport Market Analysis, Opportunity and Forecast, By Country , 2016-2032
- 8.6.1. Latin America Refrigerated Transport Market Analysis by Country : Introduction
- 8.6.2. Market Size Absolute $ Opportunity Analysis and Forecast, Country , 2016-2032
- 8.6.2.1. Brazil
- 8.6.2.2. Colombia
- 8.6.2.3. Chile
- 8.6.2.4. Argentina
- 8.6.2.5. Costa Rica
- 8.6.2.6. Rest of Latin America
- 9. Middle East & Africa Refrigerated Transport Market Analysis, Opportunity and Forecast, 2016-2032
- 9.1. Middle East & Africa Refrigerated Transport Market Analysis, 2016-2021
- 9.2. Middle East & Africa Refrigerated Transport Market Opportunity and Forecast, 2023-2032
- 9.3. Middle East & Africa Refrigerated Transport Market Analysis, Opportunity and Forecast, By By mode of transportation:, 2016-2032
- 9.3.1. Middle East & Africa Refrigerated Transport Market Analysis by By mode of transportation:: Introduction
- 9.3.2. Market Size Absolute $ Opportunity Analysis and Forecast, By By mode of transportation:, 2016-2032
- 9.3.5. Road
- 9.3.6. Light Commercial Vehicle (LCV)
- 9.3.7. Heavy Commercial Vehicle (HCV)
- 9.3.8. Medium and Heavy Commercial Vehicles (MHCV)
- 9.3.9. Rail
- 9.3.10. Sea
- 9.3.11. Air
- 9.4. Middle East & Africa Refrigerated Transport Market Analysis, Opportunity and Forecast, By By Temperature:, 2016-2032
- 9.4.1. Middle East & Africa Refrigerated Transport Market Analysis by By Temperature:: Introduction
- 9.4.2. Market Size Absolute $ Opportunity Analysis and Forecast, By By Temperature:, 2016-2032
- 9.4.3. Multi-Temperature
- 9.4.4. Single Temperature
- 9.5. Middle East & Africa Refrigerated Transport Market Analysis, Opportunity and Forecast, By By Application:, 2016-2032
- 9.5.1. Middle East & Africa Refrigerated Transport Market Analysis by By Application:: Introduction
- 9.5.2. Market Size Absolute $ Opportunity Analysis and Forecast, By By Application:, 2016-2032
- 9.5.3. Food and Beverage
- 9.5.4. Frozen
- 9.5.5. Chilled
- 9.6. Middle East & Africa Refrigerated Transport Market Analysis, Opportunity and Forecast, By Country , 2016-2032
- 9.6.1. Middle East & Africa Refrigerated Transport Market Analysis by Country : Introduction
- 9.6.2. Market Size Absolute $ Opportunity Analysis and Forecast, Country , 2016-2032
- 9.6.2.1. Algeria
- 9.6.2.2. Egypt
- 9.6.2.3. Israel
- 9.6.2.4. Kuwait
- 9.6.2.5. Nigeria
- 9.6.2.6. Saudi Arabia
- 9.6.2.7. South Africa
- 9.6.2.8. Turkey
- 9.6.2.9. The UAE
- 9.6.2.10. Rest of MEA
- 10. Global Refrigerated Transport Market Analysis, Opportunity and Forecast, By Region , 2016-2032
- 10.1. Global Refrigerated Transport Market Analysis by Region : Introduction
- 10.2. Market Size Absolute $ Opportunity Analysis and Forecast, By Region , 2016-2032
- 10.2.1. North America
- 10.2.2. Western Europe
- 10.2.3. Eastern Europe
- 10.2.4. APAC
- 10.2.5. Latin America
- 10.2.6. Middle East & Africa
- 11. Global Refrigerated Transport Market Competitive Landscape, Market Share Analysis, and Company Profiles
- 11.1. Market Share Analysis
- 11.2. Company Profiles
- 11.3. (US$ Mn & Units)ed Technologies Corporation (Carrier Corporation)
- 11.3.1. Company Overview
- 11.3.2. Financial Highlights
- 11.3.3. Product Portfolio
- 11.3.4. SWOT Analysis
- 11.3.5. Key Strategies and Developments
- 11.4. Daikin Industries, Ltd.
- 11.4.1. Company Overview
- 11.4.2. Financial Highlights
- 11.4.3. Product Portfolio
- 11.4.4. SWOT Analysis
- 11.4.5. Key Strategies and Developments
- 11.5. Ingersoll-Rand plc (Thermo King Corporation)
- 11.5.1. Company Overview
- 11.5.2. Financial Highlights
- 11.5.3. Product Portfolio
- 11.5.4. SWOT Analysis
- 11.5.5. Key Strategies and Developments
- 11.6. China International Marine Containers (Group) Co., Ltd.
- 11.6.1. Company Overview
- 11.6.2. Financial Highlights
- 11.6.3. Product Portfolio
- 11.6.4. SWOT Analysis
- 11.6.5. Key Strategies and Developments
- 11.7. Utility Trailer Manufacturing Company
- 11.7.1. Company Overview
- 11.7.2. Financial Highlights
- 11.7.3. Product Portfolio
- 11.7.4. SWOT Analysis
- 11.7.5. Key Strategies and Developments
- 11.8. Singamas Container Holdings Limited
- 11.8.1. Company Overview
- 11.8.2. Financial Highlights
- 11.8.3. Product Portfolio
- 11.8.4. SWOT Analysis
- 11.8.5. Key Strategies and Developments
- 11.9. Hyundai Motor Company
- 11.9.1. Company Overview
- 11.9.2. Financial Highlights
- 11.9.3. Product Portfolio
- 11.9.4. SWOT Analysis
- 11.9.5. Key Strategies and Developments
- 11.10. Schmitz Cargobull AG
- 11.10.1. Company Overview
- 11.10.2. Financial Highlights
- 11.10.3. Product Portfolio
- 11.10.4. SWOT Analysis
- 11.10.5. Key Strategies and Developments
- 11.11. Krone Fahrzeugwerk Bernard Krone GmbH
- 11.11.1. Company Overview
- 11.11.2. Financial Highlights
- 11.11.3. Product Portfolio
- 11.11.4. SWOT Analysis
- 11.11.5. Key Strategies and Developments
- 11.12. Lamberet SAS
- 11.12.1. Company Overview
- 11.12.2. Financial Highlights
- 11.12.3. Product Portfolio
- 11.12.4. SWOT Analysis
- 11.12.5. Key Strategies and Developments
- 12. Assumptions and Acronyms
- 13. Research Methodology
- 14. Contact
- List of Figures
- Figure 1: Global Refrigerated Transport Market Revenue (US$ Mn) Market Share by By mode of transportation: in 2022
- Figure 2: Global Refrigerated Transport Market Attractiveness Analysis by By mode of transportation:, 2016-2032
- Figure 3: Global Refrigerated Transport Market Revenue (US$ Mn) Market Share by By Temperature:in 2022
- Figure 4: Global Refrigerated Transport Market Attractiveness Analysis by By Temperature:, 2016-2032
- Figure 5: Global Refrigerated Transport Market Revenue (US$ Mn) Market Share by By Application:in 2022
- Figure 6: Global Refrigerated Transport Market Attractiveness Analysis by By Application:, 2016-2032
- Figure 7: Global Refrigerated Transport Market Revenue (US$ Mn) Market Share by Region in 2022
- Figure 8: Global Refrigerated Transport Market Attractiveness Analysis by Region, 2016-2032
- Figure 9: Global Refrigerated Transport Market Revenue (US$ Mn) (2016-2032)
- Figure 10: Global Refrigerated Transport Market Revenue (US$ Mn) Comparison by Region (2016-2032)
- Figure 11: Global Refrigerated Transport Market Revenue (US$ Mn) Comparison by By mode of transportation: (2016-2032)
- Figure 12: Global Refrigerated Transport Market Revenue (US$ Mn) Comparison by By Temperature: (2016-2032)
- Figure 13: Global Refrigerated Transport Market Revenue (US$ Mn) Comparison by By Application: (2016-2032)
- Figure 14: Global Refrigerated Transport Market Y-o-Y Growth Rate Comparison by Region (2016-2032)
- Figure 15: Global Refrigerated Transport Market Y-o-Y Growth Rate Comparison by By mode of transportation: (2016-2032)
- Figure 16: Global Refrigerated Transport Market Y-o-Y Growth Rate Comparison by By Temperature: (2016-2032)
- Figure 17: Global Refrigerated Transport Market Y-o-Y Growth Rate Comparison by By Application: (2016-2032)
- Figure 18: Global Refrigerated Transport Market Share Comparison by Region (2016-2032)
- Figure 19: Global Refrigerated Transport Market Share Comparison by By mode of transportation: (2016-2032)
- Figure 20: Global Refrigerated Transport Market Share Comparison by By Temperature: (2016-2032)
- Figure 21: Global Refrigerated Transport Market Share Comparison by By Application: (2016-2032)
- Figure 22: North America Refrigerated Transport Market Revenue (US$ Mn) Market Share by By mode of transportation:in 2022
- Figure 23: North America Refrigerated Transport Market Attractiveness Analysis by By mode of transportation:, 2016-2032
- Figure 24: North America Refrigerated Transport Market Revenue (US$ Mn) Market Share by By Temperature:in 2022
- Figure 25: North America Refrigerated Transport Market Attractiveness Analysis by By Temperature:, 2016-2032
- Figure 26: North America Refrigerated Transport Market Revenue (US$ Mn) Market Share by By Application:in 2022
- Figure 27: North America Refrigerated Transport Market Attractiveness Analysis by By Application:, 2016-2032
- Figure 28: North America Refrigerated Transport Market Revenue (US$ Mn) Market Share by Country in 2022
- Figure 29: North America Refrigerated Transport Market Attractiveness Analysis by Country, 2016-2032
- Figure 30: North America Refrigerated Transport Market Revenue (US$ Mn) (2016-2032)
- Figure 31: North America Refrigerated Transport Market Revenue (US$ Mn) Comparison by Country (2016-2032)
- Figure 32: North America Refrigerated Transport Market Revenue (US$ Mn) Comparison by By mode of transportation: (2016-2032)
- Figure 33: North America Refrigerated Transport Market Revenue (US$ Mn) Comparison by By Temperature: (2016-2032)
- Figure 34: North America Refrigerated Transport Market Revenue (US$ Mn) Comparison by By Application: (2016-2032)
- Figure 35: North America Refrigerated Transport Market Y-o-Y Growth Rate Comparison by Country (2016-2032)
- Figure 36: North America Refrigerated Transport Market Y-o-Y Growth Rate Comparison by By mode of transportation: (2016-2032)
- Figure 37: North America Refrigerated Transport Market Y-o-Y Growth Rate Comparison by By Temperature: (2016-2032)
- Figure 38: North America Refrigerated Transport Market Y-o-Y Growth Rate Comparison by By Application: (2016-2032)
- Figure 39: North America Refrigerated Transport Market Share Comparison by Country (2016-2032)
- Figure 40: North America Refrigerated Transport Market Share Comparison by By mode of transportation: (2016-2032)
- Figure 41: North America Refrigerated Transport Market Share Comparison by By Temperature: (2016-2032)
- Figure 42: North America Refrigerated Transport Market Share Comparison by By Application: (2016-2032)
- Figure 43: Western Europe Refrigerated Transport Market Revenue (US$ Mn) Market Share by By mode of transportation:in 2022
- Figure 44: Western Europe Refrigerated Transport Market Attractiveness Analysis by By mode of transportation:, 2016-2032
- Figure 45: Western Europe Refrigerated Transport Market Revenue (US$ Mn) Market Share by By Temperature:in 2022
- Figure 46: Western Europe Refrigerated Transport Market Attractiveness Analysis by By Temperature:, 2016-2032
- Figure 47: Western Europe Refrigerated Transport Market Revenue (US$ Mn) Market Share by By Application:in 2022
- Figure 48: Western Europe Refrigerated Transport Market Attractiveness Analysis by By Application:, 2016-2032
- Figure 49: Western Europe Refrigerated Transport Market Revenue (US$ Mn) Market Share by Country in 2022
- Figure 50: Western Europe Refrigerated Transport Market Attractiveness Analysis by Country, 2016-2032
- Figure 51: Western Europe Refrigerated Transport Market Revenue (US$ Mn) (2016-2032)
- Figure 52: Western Europe Refrigerated Transport Market Revenue (US$ Mn) Comparison by Country (2016-2032)
- Figure 53: Western Europe Refrigerated Transport Market Revenue (US$ Mn) Comparison by By mode of transportation: (2016-2032)
- Figure 54: Western Europe Refrigerated Transport Market Revenue (US$ Mn) Comparison by By Temperature: (2016-2032)
- Figure 55: Western Europe Refrigerated Transport Market Revenue (US$ Mn) Comparison by By Application: (2016-2032)
- Figure 56: Western Europe Refrigerated Transport Market Y-o-Y Growth Rate Comparison by Country (2016-2032)
- Figure 57: Western Europe Refrigerated Transport Market Y-o-Y Growth Rate Comparison by By mode of transportation: (2016-2032)
- Figure 58: Western Europe Refrigerated Transport Market Y-o-Y Growth Rate Comparison by By Temperature: (2016-2032)
- Figure 59: Western Europe Refrigerated Transport Market Y-o-Y Growth Rate Comparison by By Application: (2016-2032)
- Figure 60: Western Europe Refrigerated Transport Market Share Comparison by Country (2016-2032)
- Figure 61: Western Europe Refrigerated Transport Market Share Comparison by By mode of transportation: (2016-2032)
- Figure 62: Western Europe Refrigerated Transport Market Share Comparison by By Temperature: (2016-2032)
- Figure 63: Western Europe Refrigerated Transport Market Share Comparison by By Application: (2016-2032)
- Figure 64: Eastern Europe Refrigerated Transport Market Revenue (US$ Mn) Market Share by By mode of transportation:in 2022
- Figure 65: Eastern Europe Refrigerated Transport Market Attractiveness Analysis by By mode of transportation:, 2016-2032
- Figure 66: Eastern Europe Refrigerated Transport Market Revenue (US$ Mn) Market Share by By Temperature:in 2022
- Figure 67: Eastern Europe Refrigerated Transport Market Attractiveness Analysis by By Temperature:, 2016-2032
- Figure 68: Eastern Europe Refrigerated Transport Market Revenue (US$ Mn) Market Share by By Application:in 2022
- Figure 69: Eastern Europe Refrigerated Transport Market Attractiveness Analysis by By Application:, 2016-2032
- Figure 70: Eastern Europe Refrigerated Transport Market Revenue (US$ Mn) Market Share by Country in 2022
- Figure 71: Eastern Europe Refrigerated Transport Market Attractiveness Analysis by Country, 2016-2032
- Figure 72: Eastern Europe Refrigerated Transport Market Revenue (US$ Mn) (2016-2032)
- Figure 73: Eastern Europe Refrigerated Transport Market Revenue (US$ Mn) Comparison by Country (2016-2032)
- Figure 74: Eastern Europe Refrigerated Transport Market Revenue (US$ Mn) Comparison by By mode of transportation: (2016-2032)
- Figure 75: Eastern Europe Refrigerated Transport Market Revenue (US$ Mn) Comparison by By Temperature: (2016-2032)
- Figure 76: Eastern Europe Refrigerated Transport Market Revenue (US$ Mn) Comparison by By Application: (2016-2032)
- Figure 77: Eastern Europe Refrigerated Transport Market Y-o-Y Growth Rate Comparison by Country (2016-2032)
- Figure 78: Eastern Europe Refrigerated Transport Market Y-o-Y Growth Rate Comparison by By mode of transportation: (2016-2032)
- Figure 79: Eastern Europe Refrigerated Transport Market Y-o-Y Growth Rate Comparison by By Temperature: (2016-2032)
- Figure 80: Eastern Europe Refrigerated Transport Market Y-o-Y Growth Rate Comparison by By Application: (2016-2032)
- Figure 81: Eastern Europe Refrigerated Transport Market Share Comparison by Country (2016-2032)
- Figure 82: Eastern Europe Refrigerated Transport Market Share Comparison by By mode of transportation: (2016-2032)
- Figure 83: Eastern Europe Refrigerated Transport Market Share Comparison by By Temperature: (2016-2032)
- Figure 84: Eastern Europe Refrigerated Transport Market Share Comparison by By Application: (2016-2032)
- Figure 85: APAC Refrigerated Transport Market Revenue (US$ Mn) Market Share by By mode of transportation:in 2022
- Figure 86: APAC Refrigerated Transport Market Attractiveness Analysis by By mode of transportation:, 2016-2032
- Figure 87: APAC Refrigerated Transport Market Revenue (US$ Mn) Market Share by By Temperature:in 2022
- Figure 88: APAC Refrigerated Transport Market Attractiveness Analysis by By Temperature:, 2016-2032
- Figure 89: APAC Refrigerated Transport Market Revenue (US$ Mn) Market Share by By Application:in 2022
- Figure 90: APAC Refrigerated Transport Market Attractiveness Analysis by By Application:, 2016-2032
- Figure 91: APAC Refrigerated Transport Market Revenue (US$ Mn) Market Share by Country in 2022
- Figure 92: APAC Refrigerated Transport Market Attractiveness Analysis by Country, 2016-2032
- Figure 93: APAC Refrigerated Transport Market Revenue (US$ Mn) (2016-2032)
- Figure 94: APAC Refrigerated Transport Market Revenue (US$ Mn) Comparison by Country (2016-2032)
- Figure 95: APAC Refrigerated Transport Market Revenue (US$ Mn) Comparison by By mode of transportation: (2016-2032)
- Figure 96: APAC Refrigerated Transport Market Revenue (US$ Mn) Comparison by By Temperature: (2016-2032)
- Figure 97: APAC Refrigerated Transport Market Revenue (US$ Mn) Comparison by By Application: (2016-2032)
- Figure 98: APAC Refrigerated Transport Market Y-o-Y Growth Rate Comparison by Country (2016-2032)
- Figure 99: APAC Refrigerated Transport Market Y-o-Y Growth Rate Comparison by By mode of transportation: (2016-2032)
- Figure 100: APAC Refrigerated Transport Market Y-o-Y Growth Rate Comparison by By Temperature: (2016-2032)
- Figure 101: APAC Refrigerated Transport Market Y-o-Y Growth Rate Comparison by By Application: (2016-2032)
- Figure 102: APAC Refrigerated Transport Market Share Comparison by Country (2016-2032)
- Figure 103: APAC Refrigerated Transport Market Share Comparison by By mode of transportation: (2016-2032)
- Figure 104: APAC Refrigerated Transport Market Share Comparison by By Temperature: (2016-2032)
- Figure 105: APAC Refrigerated Transport Market Share Comparison by By Application: (2016-2032)
- Figure 106: Latin America Refrigerated Transport Market Revenue (US$ Mn) Market Share by By mode of transportation:in 2022
- Figure 107: Latin America Refrigerated Transport Market Attractiveness Analysis by By mode of transportation:, 2016-2032
- Figure 108: Latin America Refrigerated Transport Market Revenue (US$ Mn) Market Share by By Temperature:in 2022
- Figure 109: Latin America Refrigerated Transport Market Attractiveness Analysis by By Temperature:, 2016-2032
- Figure 110: Latin America Refrigerated Transport Market Revenue (US$ Mn) Market Share by By Application:in 2022
- Figure 111: Latin America Refrigerated Transport Market Attractiveness Analysis by By Application:, 2016-2032
- Figure 112: Latin America Refrigerated Transport Market Revenue (US$ Mn) Market Share by Country in 2022
- Figure 113: Latin America Refrigerated Transport Market Attractiveness Analysis by Country, 2016-2032
- Figure 114: Latin America Refrigerated Transport Market Revenue (US$ Mn) (2016-2032)
- Figure 115: Latin America Refrigerated Transport Market Revenue (US$ Mn) Comparison by Country (2016-2032)
- Figure 116: Latin America Refrigerated Transport Market Revenue (US$ Mn) Comparison by By mode of transportation: (2016-2032)
- Figure 117: Latin America Refrigerated Transport Market Revenue (US$ Mn) Comparison by By Temperature: (2016-2032)
- Figure 118: Latin America Refrigerated Transport Market Revenue (US$ Mn) Comparison by By Application: (2016-2032)
- Figure 119: Latin America Refrigerated Transport Market Y-o-Y Growth Rate Comparison by Country (2016-2032)
- Figure 120: Latin America Refrigerated Transport Market Y-o-Y Growth Rate Comparison by By mode of transportation: (2016-2032)
- Figure 121: Latin America Refrigerated Transport Market Y-o-Y Growth Rate Comparison by By Temperature: (2016-2032)
- Figure 122: Latin America Refrigerated Transport Market Y-o-Y Growth Rate Comparison by By Application: (2016-2032)
- Figure 123: Latin America Refrigerated Transport Market Share Comparison by Country (2016-2032)
- Figure 124: Latin America Refrigerated Transport Market Share Comparison by By mode of transportation: (2016-2032)
- Figure 125: Latin America Refrigerated Transport Market Share Comparison by By Temperature: (2016-2032)
- Figure 126: Latin America Refrigerated Transport Market Share Comparison by By Application: (2016-2032)
- Figure 127: Middle East & Africa Refrigerated Transport Market Revenue (US$ Mn) Market Share by By mode of transportation:in 2022
- Figure 128: Middle East & Africa Refrigerated Transport Market Attractiveness Analysis by By mode of transportation:, 2016-2032
- Figure 129: Middle East & Africa Refrigerated Transport Market Revenue (US$ Mn) Market Share by By Temperature:in 2022
- Figure 130: Middle East & Africa Refrigerated Transport Market Attractiveness Analysis by By Temperature:, 2016-2032
- Figure 131: Middle East & Africa Refrigerated Transport Market Revenue (US$ Mn) Market Share by By Application:in 2022
- Figure 132: Middle East & Africa Refrigerated Transport Market Attractiveness Analysis by By Application:, 2016-2032
- Figure 133: Middle East & Africa Refrigerated Transport Market Revenue (US$ Mn) Market Share by Country in 2022
- Figure 134: Middle East & Africa Refrigerated Transport Market Attractiveness Analysis by Country, 2016-2032
- Figure 135: Middle East & Africa Refrigerated Transport Market Revenue (US$ Mn) (2016-2032)
- Figure 136: Middle East & Africa Refrigerated Transport Market Revenue (US$ Mn) Comparison by Country (2016-2032)
- Figure 137: Middle East & Africa Refrigerated Transport Market Revenue (US$ Mn) Comparison by By mode of transportation: (2016-2032)
- Figure 138: Middle East & Africa Refrigerated Transport Market Revenue (US$ Mn) Comparison by By Temperature: (2016-2032)
- Figure 139: Middle East & Africa Refrigerated Transport Market Revenue (US$ Mn) Comparison by By Application: (2016-2032)
- Figure 140: Middle East & Africa Refrigerated Transport Market Y-o-Y Growth Rate Comparison by Country (2016-2032)
- Figure 141: Middle East & Africa Refrigerated Transport Market Y-o-Y Growth Rate Comparison by By mode of transportation: (2016-2032)
- Figure 142: Middle East & Africa Refrigerated Transport Market Y-o-Y Growth Rate Comparison by By Temperature: (2016-2032)
- Figure 143: Middle East & Africa Refrigerated Transport Market Y-o-Y Growth Rate Comparison by By Application: (2016-2032)
- Figure 144: Middle East & Africa Refrigerated Transport Market Share Comparison by Country (2016-2032)
- Figure 145: Middle East & Africa Refrigerated Transport Market Share Comparison by By mode of transportation: (2016-2032)
- Figure 146: Middle East & Africa Refrigerated Transport Market Share Comparison by By Temperature: (2016-2032)
- Figure 147: Middle East & Africa Refrigerated Transport Market Share Comparison by By Application: (2016-2032)
- List of Tables
- Table 1: Global Refrigerated Transport Market Comparison by By mode of transportation: (2016-2032)
- Table 2: Global Refrigerated Transport Market Comparison by By Temperature: (2016-2032)
- Table 3: Global Refrigerated Transport Market Comparison by By Application: (2016-2032)
- Table 4: Global Refrigerated Transport Market Revenue (US$ Mn) Comparison by Region (2016-2032)
- Table 5: Global Refrigerated Transport Market Revenue (US$ Mn) (2016-2032)
- Table 6: Global Refrigerated Transport Market Revenue (US$ Mn) Comparison by Region (2016-2032)
- Table 7: Global Refrigerated Transport Market Revenue (US$ Mn) Comparison by By mode of transportation: (2016-2032)
- Table 8: Global Refrigerated Transport Market Revenue (US$ Mn) Comparison by By Temperature: (2016-2032)
- Table 9: Global Refrigerated Transport Market Revenue (US$ Mn) Comparison by By Application: (2016-2032)
- Table 10: Global Refrigerated Transport Market Y-o-Y Growth Rate Comparison by Region (2016-2032)
- Table 11: Global Refrigerated Transport Market Y-o-Y Growth Rate Comparison by By mode of transportation: (2016-2032)
- Table 12: Global Refrigerated Transport Market Y-o-Y Growth Rate Comparison by By Temperature: (2016-2032)
- Table 13: Global Refrigerated Transport Market Y-o-Y Growth Rate Comparison by By Application: (2016-2032)
- Table 14: Global Refrigerated Transport Market Share Comparison by Region (2016-2032)
- Table 15: Global Refrigerated Transport Market Share Comparison by By mode of transportation: (2016-2032)
- Table 16: Global Refrigerated Transport Market Share Comparison by By Temperature: (2016-2032)
- Table 17: Global Refrigerated Transport Market Share Comparison by By Application: (2016-2032)
- Table 18: North America Refrigerated Transport Market Comparison by By Temperature: (2016-2032)
- Table 19: North America Refrigerated Transport Market Comparison by By Application: (2016-2032)
- Table 20: North America Refrigerated Transport Market Revenue (US$ Mn) Comparison by Country (2016-2032)
- Table 21: North America Refrigerated Transport Market Revenue (US$ Mn) (2016-2032)
- Table 22: North America Refrigerated Transport Market Revenue (US$ Mn) Comparison by Country (2016-2032)
- Table 23: North America Refrigerated Transport Market Revenue (US$ Mn) Comparison by By mode of transportation: (2016-2032)
- Table 24: North America Refrigerated Transport Market Revenue (US$ Mn) Comparison by By Temperature: (2016-2032)
- Table 25: North America Refrigerated Transport Market Revenue (US$ Mn) Comparison by By Application: (2016-2032)
- Table 26: North America Refrigerated Transport Market Y-o-Y Growth Rate Comparison by Country (2016-2032)
- Table 27: North America Refrigerated Transport Market Y-o-Y Growth Rate Comparison by By mode of transportation: (2016-2032)
- Table 28: North America Refrigerated Transport Market Y-o-Y Growth Rate Comparison by By Temperature: (2016-2032)
- Table 29: North America Refrigerated Transport Market Y-o-Y Growth Rate Comparison by By Application: (2016-2032)
- Table 30: North America Refrigerated Transport Market Share Comparison by Country (2016-2032)
- Table 31: North America Refrigerated Transport Market Share Comparison by By mode of transportation: (2016-2032)
- Table 32: North America Refrigerated Transport Market Share Comparison by By Temperature: (2016-2032)
- Table 33: North America Refrigerated Transport Market Share Comparison by By Application: (2016-2032)
- Table 34: Western Europe Refrigerated Transport Market Comparison by By mode of transportation: (2016-2032)
- Table 35: Western Europe Refrigerated Transport Market Comparison by By Temperature: (2016-2032)
- Table 36: Western Europe Refrigerated Transport Market Comparison by By Application: (2016-2032)
- Table 37: Western Europe Refrigerated Transport Market Revenue (US$ Mn) Comparison by Country (2016-2032)
- Table 38: Western Europe Refrigerated Transport Market Revenue (US$ Mn) (2016-2032)
- Table 39: Western Europe Refrigerated Transport Market Revenue (US$ Mn) Comparison by Country (2016-2032)
- Table 40: Western Europe Refrigerated Transport Market Revenue (US$ Mn) Comparison by By mode of transportation: (2016-2032)
- Table 41: Western Europe Refrigerated Transport Market Revenue (US$ Mn) Comparison by By Temperature: (2016-2032)
- Table 42: Western Europe Refrigerated Transport Market Revenue (US$ Mn) Comparison by By Application: (2016-2032)
- Table 43: Western Europe Refrigerated Transport Market Y-o-Y Growth Rate Comparison by Country (2016-2032)
- Table 44: Western Europe Refrigerated Transport Market Y-o-Y Growth Rate Comparison by By mode of transportation: (2016-2032)
- Table 45: Western Europe Refrigerated Transport Market Y-o-Y Growth Rate Comparison by By Temperature: (2016-2032)
- Table 46: Western Europe Refrigerated Transport Market Y-o-Y Growth Rate Comparison by By Application: (2016-2032)
- Table 47: Western Europe Refrigerated Transport Market Share Comparison by Country (2016-2032)
- Table 48: Western Europe Refrigerated Transport Market Share Comparison by By mode of transportation: (2016-2032)
- Table 49: Western Europe Refrigerated Transport Market Share Comparison by By Temperature: (2016-2032)
- Table 50: Western Europe Refrigerated Transport Market Share Comparison by By Application: (2016-2032)
- Table 51: Eastern Europe Refrigerated Transport Market Comparison by By mode of transportation: (2016-2032)
- Table 52: Eastern Europe Refrigerated Transport Market Comparison by By Temperature: (2016-2032)
- Table 53: Eastern Europe Refrigerated Transport Market Comparison by By Application: (2016-2032)
- Table 54: Eastern Europe Refrigerated Transport Market Revenue (US$ Mn) Comparison by Country (2016-2032)
- Table 55: Eastern Europe Refrigerated Transport Market Revenue (US$ Mn) (2016-2032)
- Table 56: Eastern Europe Refrigerated Transport Market Revenue (US$ Mn) Comparison by Country (2016-2032)
- Table 57: Eastern Europe Refrigerated Transport Market Revenue (US$ Mn) Comparison by By mode of transportation: (2016-2032)
- Table 58: Eastern Europe Refrigerated Transport Market Revenue (US$ Mn) Comparison by By Temperature: (2016-2032)
- Table 59: Eastern Europe Refrigerated Transport Market Revenue (US$ Mn) Comparison by By Application: (2016-2032)
- Table 60: Eastern Europe Refrigerated Transport Market Y-o-Y Growth Rate Comparison by Country (2016-2032)
- Table 61: Eastern Europe Refrigerated Transport Market Y-o-Y Growth Rate Comparison by By mode of transportation: (2016-2032)
- Table 62: Eastern Europe Refrigerated Transport Market Y-o-Y Growth Rate Comparison by By Temperature: (2016-2032)
- Table 63: Eastern Europe Refrigerated Transport Market Y-o-Y Growth Rate Comparison by By Application: (2016-2032)
- Table 64: Eastern Europe Refrigerated Transport Market Share Comparison by Country (2016-2032)
- Table 65: Eastern Europe Refrigerated Transport Market Share Comparison by By mode of transportation: (2016-2032)
- Table 66: Eastern Europe Refrigerated Transport Market Share Comparison by By Temperature: (2016-2032)
- Table 67: Eastern Europe Refrigerated Transport Market Share Comparison by By Application: (2016-2032)
- Table 68: APAC Refrigerated Transport Market Comparison by By mode of transportation: (2016-2032)
- Table 69: APAC Refrigerated Transport Market Comparison by By Temperature: (2016-2032)
- Table 70: APAC Refrigerated Transport Market Comparison by By Application: (2016-2032)
- Table 71: APAC Refrigerated Transport Market Revenue (US$ Mn) Comparison by Country (2016-2032)
- Table 72: APAC Refrigerated Transport Market Revenue (US$ Mn) (2016-2032)
- Table 73: APAC Refrigerated Transport Market Revenue (US$ Mn) Comparison by Country (2016-2032)
- Table 74: APAC Refrigerated Transport Market Revenue (US$ Mn) Comparison by By mode of transportation: (2016-2032)
- Table 75: APAC Refrigerated Transport Market Revenue (US$ Mn) Comparison by By Temperature: (2016-2032)
- Table 76: APAC Refrigerated Transport Market Revenue (US$ Mn) Comparison by By Application: (2016-2032)
- Table 77: APAC Refrigerated Transport Market Y-o-Y Growth Rate Comparison by Country (2016-2032)
- Table 78: APAC Refrigerated Transport Market Y-o-Y Growth Rate Comparison by By mode of transportation: (2016-2032)
- Table 79: APAC Refrigerated Transport Market Y-o-Y Growth Rate Comparison by By Temperature: (2016-2032)
- Table 80: APAC Refrigerated Transport Market Y-o-Y Growth Rate Comparison by By Application: (2016-2032)
- Table 81: APAC Refrigerated Transport Market Share Comparison by Country (2016-2032)
- Table 82: APAC Refrigerated Transport Market Share Comparison by By mode of transportation: (2016-2032)
- Table 83: APAC Refrigerated Transport Market Share Comparison by By Temperature: (2016-2032)
- Table 84: APAC Refrigerated Transport Market Share Comparison by By Application: (2016-2032)
- Table 85: Latin America Refrigerated Transport Market Comparison by By mode of transportation: (2016-2032)
- Table 86: Latin America Refrigerated Transport Market Comparison by By Temperature: (2016-2032)
- Table 87: Latin America Refrigerated Transport Market Comparison by By Application: (2016-2032)
- Table 88: Latin America Refrigerated Transport Market Revenue (US$ Mn) Comparison by Country (2016-2032)
- Table 89: Latin America Refrigerated Transport Market Revenue (US$ Mn) (2016-2032)
- Table 90: Latin America Refrigerated Transport Market Revenue (US$ Mn) Comparison by Country (2016-2032)
- Table 91: Latin America Refrigerated Transport Market Revenue (US$ Mn) Comparison by By mode of transportation: (2016-2032)
- Table 92: Latin America Refrigerated Transport Market Revenue (US$ Mn) Comparison by By Temperature: (2016-2032)
- Table 93: Latin America Refrigerated Transport Market Revenue (US$ Mn) Comparison by By Application: (2016-2032)
- Table 94: Latin America Refrigerated Transport Market Y-o-Y Growth Rate Comparison by Country (2016-2032)
- Table 95: Latin America Refrigerated Transport Market Y-o-Y Growth Rate Comparison by By mode of transportation: (2016-2032)
- Table 96: Latin America Refrigerated Transport Market Y-o-Y Growth Rate Comparison by By Temperature: (2016-2032)
- Table 97: Latin America Refrigerated Transport Market Y-o-Y Growth Rate Comparison by By Application: (2016-2032)
- Table 98: Latin America Refrigerated Transport Market Share Comparison by Country (2016-2032)
- Table 99: Latin America Refrigerated Transport Market Share Comparison by By mode of transportation: (2016-2032)
- Table 100: Latin America Refrigerated Transport Market Share Comparison by By Temperature: (2016-2032)
- Table 101: Latin America Refrigerated Transport Market Share Comparison by By Application: (2016-2032)
- Table 102: Middle East & Africa Refrigerated Transport Market Comparison by By mode of transportation: (2016-2032)
- Table 103: Middle East & Africa Refrigerated Transport Market Comparison by By Temperature: (2016-2032)
- Table 104: Middle East & Africa Refrigerated Transport Market Comparison by By Application: (2016-2032)
- Table 105: Middle East & Africa Refrigerated Transport Market Revenue (US$ Mn) Comparison by Country (2016-2032)
- Table 106: Middle East & Africa Refrigerated Transport Market Revenue (US$ Mn) (2016-2032)
- Table 107: Middle East & Africa Refrigerated Transport Market Revenue (US$ Mn) Comparison by Country (2016-2032)
- Table 108: Middle East & Africa Refrigerated Transport Market Revenue (US$ Mn) Comparison by By mode of transportation: (2016-2032)
- Table 109: Middle East & Africa Refrigerated Transport Market Revenue (US$ Mn) Comparison by By Temperature: (2016-2032)
- Table 110: Middle East & Africa Refrigerated Transport Market Revenue (US$ Mn) Comparison by By Application: (2016-2032)
- Table 111: Middle East & Africa Refrigerated Transport Market Y-o-Y Growth Rate Comparison by Country (2016-2032)
- Table 112: Middle East & Africa Refrigerated Transport Market Y-o-Y Growth Rate Comparison by By mode of transportation: (2016-2032)
- Table 113: Middle East & Africa Refrigerated Transport Market Y-o-Y Growth Rate Comparison by By Temperature: (2016-2032)
- Table 114: Middle East & Africa Refrigerated Transport Market Y-o-Y Growth Rate Comparison by By Application: (2016-2032)
- Table 115: Middle East & Africa Refrigerated Transport Market Share Comparison by Country (2016-2032)
- Table 116: Middle East & Africa Refrigerated Transport Market Share Comparison by By mode of transportation: (2016-2032)
- Table 117: Middle East & Africa Refrigerated Transport Market Share Comparison by By Temperature: (2016-2032)
- Table 118: Middle East & Africa Refrigerated Transport Market Share Comparison by By Application: (2016-2032)
- 1. Executive Summary
-
- United Technologies Corporation (Carrier Corporation)
- Daikin Industries, Ltd.
- Ingersoll-Rand plc (Thermo King Corporation)
- China International Marine Containers (Group) Co., Ltd.
- Utility Trailer Manufacturing Company
- Singamas Container Holdings Limited
- Hyundai Motor Company
- Schmitz Cargobull AG
- Krone Fahrzeugwerk Bernard Krone GmbH
- Lamberet SAS
Our Clients


View Our Licence Options
