
Ready Drink Tea Coffee Market By Product (Tea and Coffee), By Packaging Type (Glass Bottle, PET Bottle, Canned, Others), By Distribution Channel (Supermarkets/Hypermarkets, Convenience Stores, Online, Others), By Region And Companies - Industry Segment Outlook, Market Assessment, Competition Scenario, Trends, And Forecast 2024-2033
-
49190
-
July 2024
-
300
-


-
This report was compiled by Research Team Research team of over 50 passionate professionals leverages advanced research methodologies and analytical expertise to deliver insightful, data-driven market intelligence that empowers businesses across diverse industries to make strategic, well-informed Correspondence Research Team Linkedin | Detailed Market research Methodology Our methodology involves a mix of primary research, including interviews with leading mental health experts, and secondary research from reputable medical journals and databases. View Detailed Methodology Page
-
Quick Navigation
Report Overview
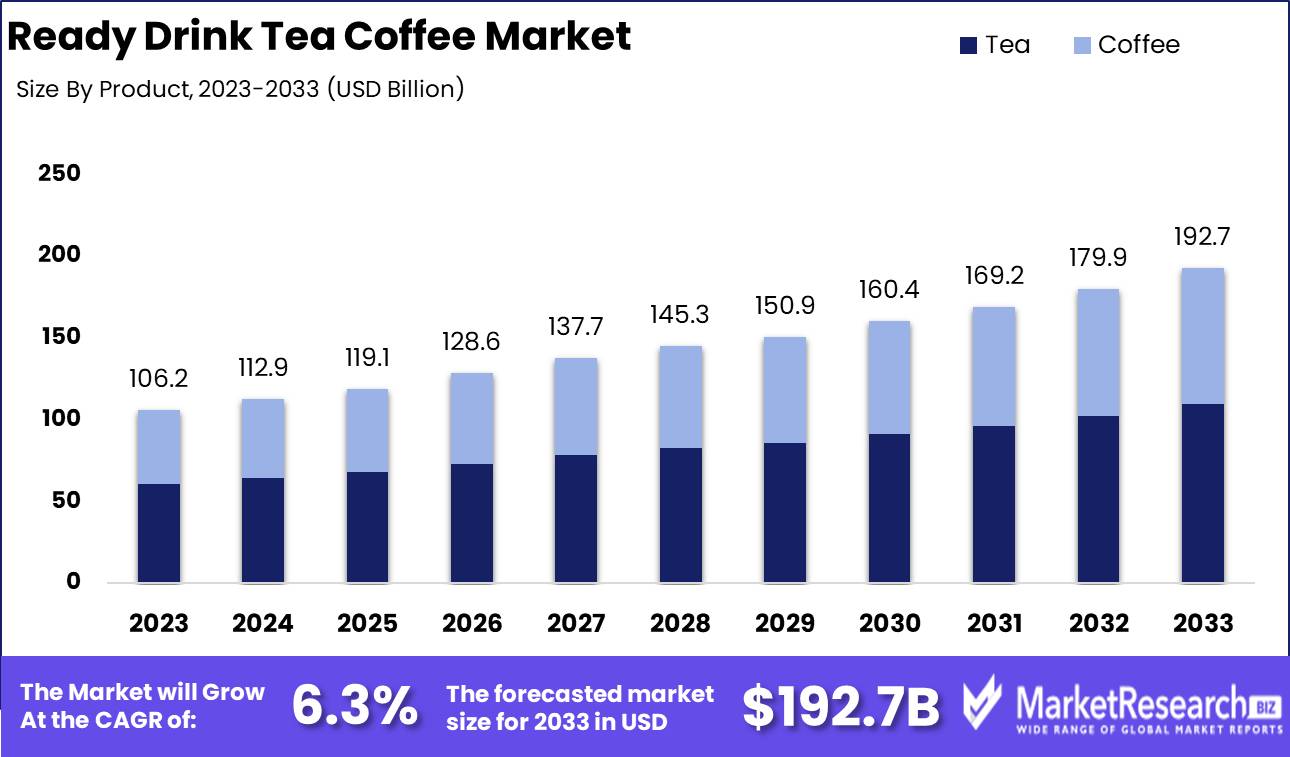
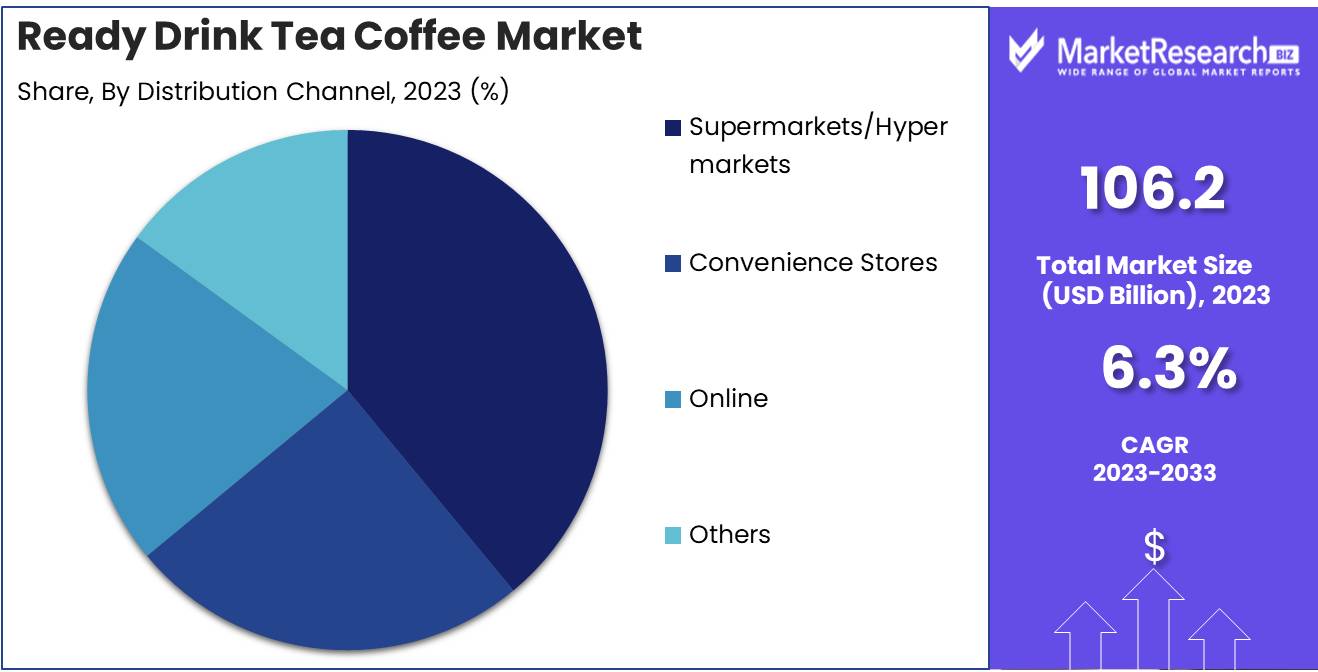
The Ready Drink Tea Coffee Market was valued at USD 106.2 billion in 2023. It is expected to reach USD 192.7 billion by 2033, with a CAGR of 6.3% during the forecast period from 2024 to 2033.
The Ready-to-Drink (RTD) Tea and Coffee Market encompasses pre-packaged beverages that provide consumers with the convenience of enjoying tea and coffee flavors without the need for brewing or preparation. This market segment is driven by a growing demand for on-the-go lifestyle products that offer both refreshment and functional benefits such as energy boosts and health-oriented ingredients. RTD tea and coffee products vary widely, ranging from sweetened and flavored options to organic and low-calorie alternatives, catering to a diverse palette of consumer preferences.
The Ready-to-Drink (RTD) Tea and Coffee market continues to capture the attention of health-conscious consumers, aligning with broader trends that favor wellness-oriented beverage choices. These products offer a healthier alternative to traditional carbonated drinks by integrating functional ingredients that appeal to those seeking nutritional benefits. The market's expansion is notably driven by the increasing consumer inclination towards beverages that support a wellness-oriented lifestyle, coupled with the convenience these products offer. RTD tea and coffee perfectly cater to the on-the-go lifestyle prevalent among modern consumers, providing an easy and efficient way to enjoy a beverage without the time-consuming preparation process.
However, the Ready-to-Drink Tea and Coffee sector is not without its challenges. The market is currently navigating the complexities of fluctuating raw material costs, such as tea leaves and coffee beans, which introduce a layer of unpredictability to product pricing. This volatility can complicate budgeting and pricing strategies for manufacturers, potentially affecting overall market stability.
Moreover, there is a pronounced shift towards sustainable packaging solutions within the industry. Consumers increasingly prefer environmentally friendly packaging options, such as recyclable PET bottles and glass, which not only align with ecological values but also preserve the taste and quality of the product. This trend towards sustainability is prompting companies to innovate in their packaging solutions, ensuring they meet consumer expectations and regulatory standards while maintaining product integrity.
Key Takeaways
- Market Growth: The Ready Drink Tea Coffee Market was valued at USD 106.2 billion in 2023. It is expected to reach USD 192.7 billion by 2033, with a CAGR of 6.3% during the forecast period from 2024 to 2033.
- By Product: Tea dominated the Ready-to-Drink Market, outpacing coffee significantly.
- By Packaging Type: Glass bottles dominate the RTD tea and coffee market, valued for sustainability.
- By Distribution Channel: Supermarkets/hypermarkets dominate Ready-to-Drink Tea and Coffee Market distribution in 2023.
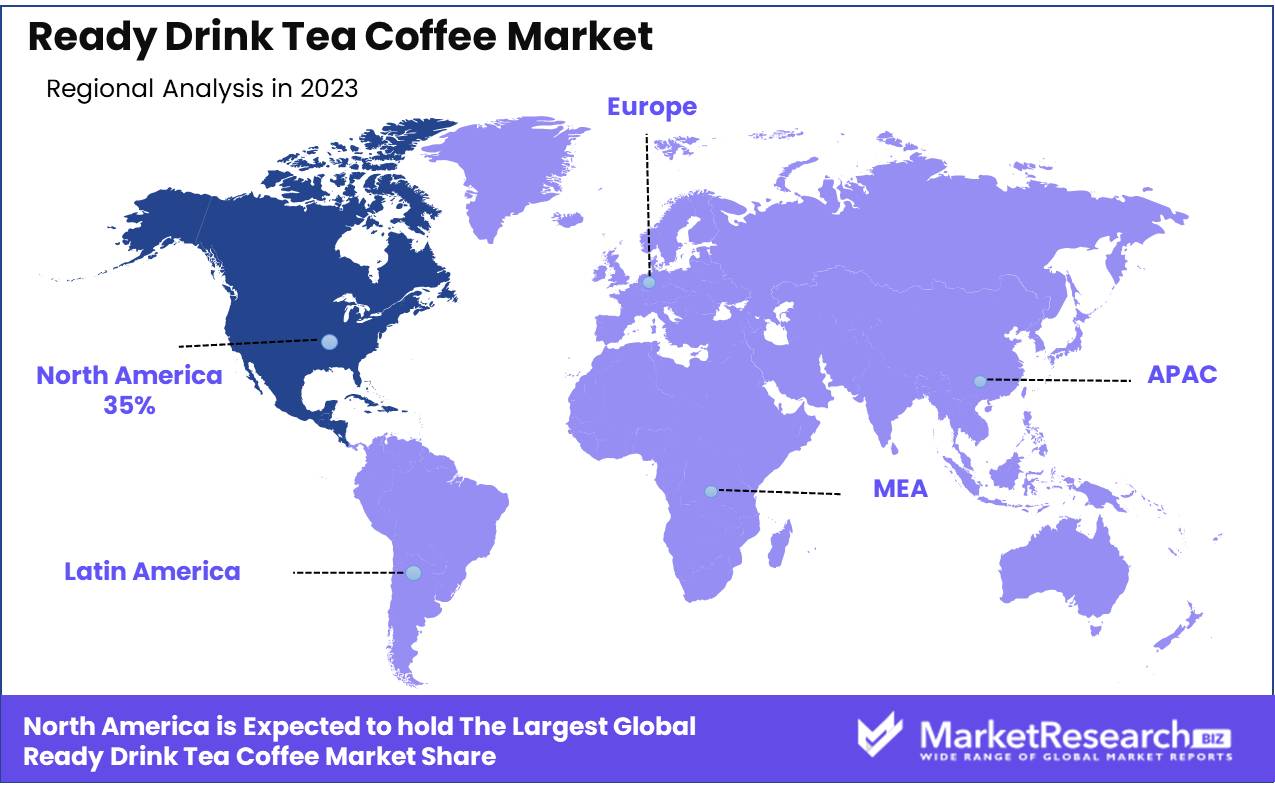
- Regional Dominance: North America dominates the Ready Drink Tea and Coffee Market at a 35% largest share.
- Growth Opportunity: The RTD tea and coffee market in 2024 is set to capitalize on these key trends. By leveraging the growing preference for natural ingredients and the need for portable drink solutions, industry players can unlock substantial growth opportunities, enhancing their market presence and profitability.
Driving factors
Growing Demand for Healthy Substitutes for Carbonated Drinks
The increasing health consciousness among consumers globally has been a significant catalyst in propelling the demand for ready-to-drink (RTD) tea and coffee. These beverages are often perceived as healthier alternatives to carbonated drinks, which are typically high in sugar and calories. This shift is reflected in the market data, where health-driven choices are directly contributing to the growth of the RTD tea and coffee sector. For instance, consumers are now more aware of the benefits associated with tea such as antioxidants and reduced caffeine content compared to traditional coffee or carbonated beverages. Similarly, RTD coffee is often marketed as a natural and preservative-free option, appealing to health-conscious consumers seeking convenience without compromising on health.
Convenience, Easy Availability, and Portability of RTD Tea and Coffee
The convenience factor of RTD tea and coffee significantly drives their market appeal. These products cater to the busy lifestyles of modern consumers who prioritize quick and accessible options. The availability of these beverages in various distribution channels, including supermarkets, convenience stores, and e-commerce platforms, enhances their accessibility, thus boosting market growth. Portability also plays a crucial role, as RTD beverages are typically packaged in user-friendly formats that support on-the-go consumption, aligning with the increasing mobility of the consumer base.
Gradual Shift in Consumer Preferences
There has been a notable shift in consumer preferences toward more diverse and sophisticated beverage options. RTD tea and coffee have benefited from this trend as they offer a wide range of flavors, from traditional to exotic, catering to a broad palette. This diversity attracts a wider audience, driving market expansion. Additionally, the integration of cultural tea-drinking habits and the rising popularity of coffee culture across various regions have further entrenched RTD tea and coffee as staple beverages in daily consumption patterns. This alignment with consumer lifestyle and cultural trends underscores the growth trajectory of the RTD tea and coffee market.
Restraining Factors
Preference for Fresh/Ground Coffee: A Challenge to Market Penetration
The growing consumer preference for fresh and ground coffee poses a significant challenge to the expansion of the Ready-to-Drink (RTD) Tea and Coffee market. This trend reflects a broader consumer shift towards premiumization in beverage choices, where individuals seek higher quality, freshly prepared options over pre-packaged alternatives. Fresh and ground coffee are often perceived as offering superior taste and a more authentic experience compared to RTD counterparts. Market statistics indicate that the global coffee market, emphasizing fresh and specialty coffees, has been growing steadily, suggesting a competitive landscape where RTD products may struggle to increase their market share without innovative strategies that align with consumer preferences for quality and freshness.
Raw Material Price Volatility: Impact on Cost Structure and Pricing Strategy
The volatility in raw material prices significantly impacts the RTD Tea and Coffee market, particularly concerning the cost of key ingredients such as coffee beans and tea leaves. Fluctuations in these prices can lead to unpredictable costs, challenging manufacturers to maintain consistent pricing and profit margins. For instance, any increase in coffee bean prices directly affects the production costs of RTD coffee products, potentially leading to higher retail prices that could deter price-sensitive consumers. This economic dynamic necessitates agile supply chain strategies and effective risk management practices to mitigate the adverse effects of price volatility on market growth. Additionally, manufacturers might need to explore alternative sourcing strategies or hedge commodity prices to stabilize their cost base in the face of such fluctuations.
By Product Analysis
In 2023, Tea dominated the Ready-to-Drink Market, outpacing coffee significantly.
In 2023, Tea held a dominant market position in the "By Product" segment of the Ready-to-Drink Tea and Coffee Market. Tea's supremacy can be attributed to its widespread cultural acceptance and the growing consumer inclination towards healthier beverages. Its market dominance is reinforced by innovations in flavor and packaging, alongside its perceived health benefits, which resonate well with health-conscious consumers globally. Meanwhile, coffee continues to secure a substantial share, driven by an increasing demand for convenience and a surge in coffee consumption among younger demographics.
Coffee's market presence is bolstered by the introduction of specialty coffee drinks and the expansion of coffee chains offering ready-to-drink options. Both segments benefit from the rise in consumer preferences for on-the-go drink options and the expanding retail distribution channels, which facilitate easy access to these beverages. Furthermore, advancements in product preservation and sustainability practices are expected to propel the growth of both tea and coffee segments, although tea currently enjoys a slight advantage in market preferences.
By Packaging Type Analysis
Glass bottles dominate the RTD tea and coffee market, valued for sustainability.
In 2023, The Glass Bottle held a dominant market position in the By Packaging Type segment of the Ready-to-Drink Tea and Coffee Market. This preference can be attributed to the consumer perception of glass as a premium, environmentally friendly packaging solution that preserves flavor and freshness more effectively than other materials. Glass bottles are highly recyclable, which aligns with the growing consumer trend towards sustainable and eco-conscious choices. Furthermore, the aesthetic appeal of glass bottles enhances brand visibility and consumer attraction, particularly in the premium product lines.
Following closely, PET bottles also command a significant market share, driven by their lightweight nature and cost-effectiveness, which reduces shipping costs and overall carbon footprint. PET bottles are favored for their versatility in design and robustness, which makes them suitable for a wide range of beverages.
Canned packaging, while less popular than glass and PET, remains relevant due to its convenience, long shelf life, and strong barrier properties. It appeals particularly to younger demographics who prioritize convenience and portability.
The Others category, which includes various innovative and niche packaging types such as cartons and pouches, caters to specific market segments looking for unique and differentiated packaging solutions. These alternatives often focus on portability and sustainability, albeit with a smaller market penetration compared to the leading types.
By Distribution Channel Analysis
Supermarkets/Hypermarkets dominate Ready-to-Drink Tea and Coffee Market distribution in 2023.
In 2023, Supermarkets/Hypermarkets held a dominant market position in the By Distribution Channel segment of the Ready-to-Drink Tea and Coffee Market. This distribution channel captured the largest market share due to its widespread accessibility and the ability to stock a diverse array of brands and product types, appealing to a broad consumer base. The convenience offered by supermarkets/hypermarkets, coupled with their promotional strategies, significantly drives consumer traffic and sales volumes in this category.
Following Supermarkets/Hypermarkets, Convenience Stores represent a vital distribution channel, favored for their ease of access and quick purchase options. These stores cater to on-the-go consumers looking for immediate refreshment options, thus supporting the steady demand for ready-to-drink tea and coffee products in various demographic segments.
The Online distribution channel has seen a robust growth trajectory, driven by the rise in e-commerce and changing consumer shopping behaviors. Online platforms offer the advantage of direct-to-consumer delivery services, which has been particularly appealing due to the convenience and often competitive pricing.
Lastly, the Others category encompasses various additional retail formats, including specialty stores and vending machines, which, although smaller in scale, play a niche role in market penetration and accessibility in less urbanized areas. This diverse distribution strategy ensures comprehensive market coverage and availability to all consumer segments.
Key Market Segments
By Product
- Tea
- Coffee
By Packaging Type
- Glass Bottle
- PET Bottle
- Canned
- Others
By Distribution Channel
- Supermarkets/Hypermarkets
- Convenience Stores
- Online
- Others
Growth Opportunity
Embracing Natural Ingredients: A Key Driver for Market Expansion
The global market for ready-to-drink (RTD) tea and coffee is poised for significant growth, largely fueled by the increasing consumer preference for natural ingredients. This shift is not just a trend but a fundamental change in consumer behavior, as health-conscious buyers are actively seeking products with organic, natural compositions. This demand is catalyzing manufacturers to innovate and expand their product lines to include beverages that are not only convenient but also align with healthier lifestyle choices. The integration of natural ingredients is expected to open new avenues for market players, enhancing product appeal and fostering consumer loyalty.
Portable Drinks: Catering to the On-the-Go Consumer
Another pivotal growth opportunity in the RTD tea and coffee market is the rising demand for portable drink options. In today's fast-paced world, convenience plays a crucial role in consumer choices. RTD beverages, with their easy-to-carry nature, meet this need effectively, enabling consumers to enjoy a range of teas and coffees while on the move. The availability of these portable options is crucial in attracting a broader customer base, from commuters to outdoor enthusiasts, thereby expanding the market's reach and potential.
Latest Trends
Diversification of Flavors and Varieties
The Ready-to-Drink (RTD) Tea and Coffee Market is experiencing a significant shift toward the diversification of flavors and varieties, catering to an increasingly sophisticated consumer palate. This trend is driven by the growing demand for unique and exotic beverage options that offer a departure from traditional tastes. Manufacturers are responding by broadening their portfolios to include a wider range of herbal, fruit-infused, and spiced teas, as well as artisanal and single-origin coffees. This expansion not only attracts a broader customer base but also enhances brand visibility and market penetration. As consumers continue to seek novel experiences and personalized options, the introduction of innovative flavors is pivotal for brands aiming to differentiate themselves in a competitive landscape.
Premiumization and Specialty Offerings
Parallel to flavor diversification, there is a clear trend toward premiumization and specialty offerings within the RTD tea and coffee market. This movement is characterized by an emphasis on high-quality, ethically sourced ingredients and sophisticated packaging. Consumers are increasingly willing to pay a premium for products that promise superior taste and offer transparency regarding their origin and production processes. Specialty products such as cold brew coffees and matcha or yerba mate teas are gaining traction, reflecting a shift towards more health-conscious and environmentally aware consumption. This trend not only elevates consumer expectations but also pushes companies towards innovation and sustainability, factors that are becoming critical for maintaining competitiveness and fostering consumer loyalty in the RTD beverage sector.
Regional Analysis
North America dominates the Ready Drink Tea and Coffee Market at a 35% largest share.
The Ready Drink Tea and Coffee Market is experiencing varied levels of growth across different global regions, with North America emerging as the dominant player. In North America, the market has captured approximately 35% of the global share, driven by a growing consumer preference for convenience and healthier beverage options. The increasing presence of major market players and the introduction of a variety of new flavors and fortified options are significant contributors to this trend.
In Europe, the market is also robust, influenced by a strong café culture and the high demand for organic and premium products. The Asia Pacific region shows the fastest growth rate due to rising urbanization and changing lifestyles, particularly in countries like China and India, which are becoming huge markets for ready-to-drink beverages.
Meanwhile, Latin America and the Middle East & Africa are experiencing moderate growth. In Latin America, the expansion is partly due to the increasing young population and urbanization, whereas in the Middle East & Africa, the market is just beginning to explore the potential of ready-drink tea and coffee amidst traditional tea-consuming cultures. Each region's market dynamics are shaped by local consumer preferences, regulatory environments, and the strategic initiatives of regional and global players.
Key Regions and Countries
North America
- The US
- Canada
- Rest of North America
Europe
- Germany
- France
- The UK
- Spain
- Netherlands
- Russia
- Italy
- Rest of Europe
Asia-Pacific
- China
- Japan
- Singapore
- Thailand
- South Korea
- Vietnam
- India
- New Zealand
- Rest of Asia Pacific
Latin America
- Mexico
- Brazil
- Rest of Latin America
Middle East & Africa
- Saudi Arabia
- South Africa
- UAE
- Rest of the Middle East & Africa
Key Players Analysis
In the dynamic landscape of the global Ready-to-Drink (RTD) Tea and Coffee market, the year has seen substantial contributions from major corporations that are pivotal in shaping the industry's trajectory. Among these, PepsiCo and Coca-Cola continue to dominate, leveraging extensive distribution networks and strong brand portfolios to expand their market share. These giants excel in innovation, frequently introducing new flavors and health-oriented products to cater to evolving consumer preferences.
Nestlé capitalizes on its global presence and robust research and development capabilities to enhance its product offerings, particularly in coffee-based RTD beverages. Meanwhile, Ting Hsin International Group and Uni-President Enterprises, significant in the Asia Pacific market, focus on local consumer tastes to drive growth, often integrating traditional flavors in their offerings.
Suntory Beverage & Food and Monster Beverage Corporation are aggressively pursuing market expansion strategies, with Suntory enhancing its focus on sustainability and Monster leveraging aggressive marketing techniques to boost its energy drink line. Starbucks Corporation, with its premium branding, continues to excel in coffee-based RTD products, offering a seamless experience from café to can.
Other notable players such as Asahi Group Holdings and Dr Pepper Snapple Group have focused on diversified portfolios and strategic partnerships to secure their positions in the market. Emerging trends indicate a growing preference for healthier, low-sugar options, pushing companies like Danone and San Benedetto to innovate in herbal and fruit-infused RTD teas.
Market Key Players
- PepsiCo
- Coca-Cola
- Nestle
- Ting Hsin International Group
- Uni-President Enterprises
- Suntory Beverage & Food
- Monster Beverage Corporation
- Starbucks Corporation
- Asahi Group Holdings
- Dr Pepper Snapple Group
- Danone
- San Benedetto
- Hangzhou Wahaha Group
- Lotte Chilsung Beverage
- Amul
- Monster Energy Company
- Arizona Beverage Company
- JAB Holding Company
- Keurig Dr Pepper
- Illycaffè
- The Coca-Cola Company
- F&N Foods
Recent Development
- In March 2024, Beam's health and wellness brand, "Be Amazing," introduced "Greens On The Go," a new RTD nutritional beverage. This product is designed for health-conscious consumers and includes 10 organic vegetables and fruits, emphasizing the brand's commitment to healthy, convenient options for on-the-go consumption.
- In January 2024, The RYL Company, known for its wellness-focused RTD tea, expanded its presence to Wegmans and select Whole Foods Market stores across the Northeastern U.S. This brand is distinctive for its "Ryl Polyphenol Technology," which ensures each can contain a consistent 200mg of tea polyphenols. The products are also noted for being zero sugar, zero calories, and packaged in recyclable aluminum cans.
- In November 2023, Coca-Cola India expanded into the RTD tea beverage sector with its "Honest Tea" brand, which is set to offer new variants such as Mango and Lemon-Tulsi iced green tea. This move signifies Coca-Cola's strategy to diversify its beverage options and cater to a broader range of consumer tastes.
Report Scope
Report Features Description Market Value (2023) USD 106.2 Billion Forecast Revenue (2033) USD 192.7 Billion CAGR (2024-2032) 6.3% Base Year for Estimation 2023 Historic Period 2016-2023 Forecast Period 2024-2033 Report Coverage Revenue Forecast, Market Dynamics, COVID-19 Impact, Competitive Landscape, Recent Developments Segments Covered By Product (Tea and Coffee), By Packaging Type (Glass Bottle, PET Bottle, Canned, Others), By Distribution Channel (Supermarkets/Hypermarkets, Convenience Stores, Online, Others) Regional Analysis North America - The US, Canada, Rest of North America, Europe - Germany, France, The UK, Spain, Italy, Russia, Netherlands, Rest of Europe, Asia-Pacific - China, Japan, South Korea, India, New Zealand, Singapore, Thailand, Vietnam, Rest of Asia Pacific, Latin America - Brazil, Mexico, Rest of Latin America, Middle East & Africa - South Africa, Saudi Arabia, UAE, Rest of Middle East & Africa Competitive Landscape PepsiCo, Coca-Cola, Nestle, Ting Hsin International Group, Uni-President Enterprises, Suntory Beverage & Food, Monster Beverage Corporation, Starbucks Corporation, Asahi Group Holdings, Dr Pepper Snapple Group, Danone, San Benedetto, Hangzhou Wahaha Group, Lotte Chilsung Beverage, Amul, Monster Energy Company, Arizona Beverage Company, JAB Holding Company, Keurig Dr Pepper, Illycaffè, The Coca-Cola Company, F&N Foods Customization Scope Customization for segments, region/country-level will be provided. Moreover, additional customization can be done based on the requirements. Purchase Options We have three licenses to opt for Single User License, Multi-User License (Up to 5 Users), Corporate Use License (Unlimited User and Printable PDF) -
- 1. Executive Summary
- 1.1. Definition
- 1.2. Taxonomy
- 1.3. Research Scope
- 1.4. Key Analysis
- 1.5. Key Findings by Major Segments
- 1.6. Top strategies by Major Players
- 2. Global Ready Drink Tea Coffee Market Overview
- 2.1. Ready Drink Tea Coffee Market Dynamics
- 2.1.1. Drivers
- 2.1.2. Opportunities
- 2.1.3. Restraints
- 2.1.4. Challenges
- 2.2. Macro-economic Factors
- 2.3. Regulatory Framework
- 2.4. Market Investment Feasibility Index
- 2.5. PEST Analysis
- 2.6. PORTER’S Five Force Analysis
- 2.7. Drivers & Restraints Impact Analysis
- 2.8. Industry Chain Analysis
- 2.9. Cost Structure Analysis
- 2.10. Marketing Strategy
- 2.11. Russia-Ukraine War Impact Analysis
- 2.12. Opportunity Map Analysis
- 2.13. Market Competition Scenario Analysis
- 2.14. Product Life Cycle Analysis
- 2.15. Opportunity Orbits
- 2.16. Manufacturer Intensity Map
- 2.17. Major Companies sales by Value & Volume
- 2.1. Ready Drink Tea Coffee Market Dynamics
- 3. Global Ready Drink Tea Coffee Market Analysis, Opportunity and Forecast, 2016-2032
- 3.1. Global Ready Drink Tea Coffee Market Analysis, 2016-2021
- 3.2. Global Ready Drink Tea Coffee Market Opportunity and Forecast, 2023-2032
- 3.3. Global Ready Drink Tea Coffee Market Analysis, Opportunity and Forecast, By Product, 2016-2032
- 3.3.1. Global Ready Drink Tea Coffee Market Analysis by Product: Introduction
- 3.3.2. Market Size Absolute $ Opportunity Analysis and Forecast, By Product, 2016-2032
- 3.3.3. Tea
- 3.3.4. Coffee
- 3.4. Global Ready Drink Tea Coffee Market Analysis, Opportunity and Forecast, By Packaging Type, 2016-2032
- 3.4.1. Global Ready Drink Tea Coffee Market Analysis by Packaging Type: Introduction
- 3.4.2. Market Size Absolute $ Opportunity Analysis and Forecast, By Packaging Type, 2016-2032
- 3.4.3. Glass Bottle
- 3.4.4. PET Bottle
- 3.4.5. Canned
- 3.4.6. Others
- 3.5. Global Ready Drink Tea Coffee Market Analysis, Opportunity and Forecast, By Distribution Channel, 2016-2032
- 3.5.1. Global Ready Drink Tea Coffee Market Analysis by Distribution Channel: Introduction
- 3.5.2. Market Size Absolute $ Opportunity Analysis and Forecast, By Distribution Channel, 2016-2032
- 3.5.3. Supermarkets/Hypermarkets
- 3.5.4. Convenience Stores
- 3.5.5. Online
- 3.5.6. Others
- 4. North America Ready Drink Tea Coffee Market Analysis, Opportunity and Forecast, 2016-2032
- 4.1. North America Ready Drink Tea Coffee Market Analysis, 2016-2021
- 4.2. North America Ready Drink Tea Coffee Market Opportunity and Forecast, 2023-2032
- 4.3. North America Ready Drink Tea Coffee Market Analysis, Opportunity and Forecast, By Product, 2016-2032
- 4.3.1. North America Ready Drink Tea Coffee Market Analysis by Product: Introduction
- 4.3.2. Market Size Absolute $ Opportunity Analysis and Forecast, By Product, 2016-2032
- 4.3.3. Tea
- 4.3.4. Coffee
- 4.4. North America Ready Drink Tea Coffee Market Analysis, Opportunity and Forecast, By Packaging Type, 2016-2032
- 4.4.1. North America Ready Drink Tea Coffee Market Analysis by Packaging Type: Introduction
- 4.4.2. Market Size Absolute $ Opportunity Analysis and Forecast, By Packaging Type, 2016-2032
- 4.4.3. Glass Bottle
- 4.4.4. PET Bottle
- 4.4.5. Canned
- 4.4.6. Others
- 4.5. North America Ready Drink Tea Coffee Market Analysis, Opportunity and Forecast, By Distribution Channel, 2016-2032
- 4.5.1. North America Ready Drink Tea Coffee Market Analysis by Distribution Channel: Introduction
- 4.5.2. Market Size Absolute $ Opportunity Analysis and Forecast, By Distribution Channel, 2016-2032
- 4.5.3. Supermarkets/Hypermarkets
- 4.5.4. Convenience Stores
- 4.5.5. Online
- 4.5.6. Others
- 4.6. North America Ready Drink Tea Coffee Market Analysis, Opportunity and Forecast, By Country , 2016-2032
- 4.6.1. North America Ready Drink Tea Coffee Market Analysis by Country : Introduction
- 4.6.2. Market Size Absolute $ Opportunity Analysis and Forecast, Country , 2016-2032
- 4.6.2.1. The US
- 4.6.2.2. Canada
- 4.6.2.3. Mexico
- 5. Western Europe Ready Drink Tea Coffee Market Analysis, Opportunity and Forecast, 2016-2032
- 5.1. Western Europe Ready Drink Tea Coffee Market Analysis, 2016-2021
- 5.2. Western Europe Ready Drink Tea Coffee Market Opportunity and Forecast, 2023-2032
- 5.3. Western Europe Ready Drink Tea Coffee Market Analysis, Opportunity and Forecast, By Product, 2016-2032
- 5.3.1. Western Europe Ready Drink Tea Coffee Market Analysis by Product: Introduction
- 5.3.2. Market Size Absolute $ Opportunity Analysis and Forecast, By Product, 2016-2032
- 5.3.3. Tea
- 5.3.4. Coffee
- 5.4. Western Europe Ready Drink Tea Coffee Market Analysis, Opportunity and Forecast, By Packaging Type, 2016-2032
- 5.4.1. Western Europe Ready Drink Tea Coffee Market Analysis by Packaging Type: Introduction
- 5.4.2. Market Size Absolute $ Opportunity Analysis and Forecast, By Packaging Type, 2016-2032
- 5.4.3. Glass Bottle
- 5.4.4. PET Bottle
- 5.4.5. Canned
- 5.4.6. Others
- 5.5. Western Europe Ready Drink Tea Coffee Market Analysis, Opportunity and Forecast, By Distribution Channel, 2016-2032
- 5.5.1. Western Europe Ready Drink Tea Coffee Market Analysis by Distribution Channel: Introduction
- 5.5.2. Market Size Absolute $ Opportunity Analysis and Forecast, By Distribution Channel, 2016-2032
- 5.5.3. Supermarkets/Hypermarkets
- 5.5.4. Convenience Stores
- 5.5.5. Online
- 5.5.6. Others
- 5.6. Western Europe Ready Drink Tea Coffee Market Analysis, Opportunity and Forecast, By Country , 2016-2032
- 5.6.1. Western Europe Ready Drink Tea Coffee Market Analysis by Country : Introduction
- 5.6.2. Market Size Absolute $ Opportunity Analysis and Forecast, Country , 2016-2032
- 5.6.2.1. Germany
- 5.6.2.2. France
- 5.6.2.3. The UK
- 5.6.2.4. Spain
- 5.6.2.5. Italy
- 5.6.2.6. Portugal
- 5.6.2.7. Ireland
- 5.6.2.8. Austria
- 5.6.2.9. Switzerland
- 5.6.2.10. Benelux
- 5.6.2.11. Nordic
- 5.6.2.12. Rest of Western Europe
- 6. Eastern Europe Ready Drink Tea Coffee Market Analysis, Opportunity and Forecast, 2016-2032
- 6.1. Eastern Europe Ready Drink Tea Coffee Market Analysis, 2016-2021
- 6.2. Eastern Europe Ready Drink Tea Coffee Market Opportunity and Forecast, 2023-2032
- 6.3. Eastern Europe Ready Drink Tea Coffee Market Analysis, Opportunity and Forecast, By Product, 2016-2032
- 6.3.1. Eastern Europe Ready Drink Tea Coffee Market Analysis by Product: Introduction
- 6.3.2. Market Size Absolute $ Opportunity Analysis and Forecast, By Product, 2016-2032
- 6.3.3. Tea
- 6.3.4. Coffee
- 6.4. Eastern Europe Ready Drink Tea Coffee Market Analysis, Opportunity and Forecast, By Packaging Type, 2016-2032
- 6.4.1. Eastern Europe Ready Drink Tea Coffee Market Analysis by Packaging Type: Introduction
- 6.4.2. Market Size Absolute $ Opportunity Analysis and Forecast, By Packaging Type, 2016-2032
- 6.4.3. Glass Bottle
- 6.4.4. PET Bottle
- 6.4.5. Canned
- 6.4.6. Others
- 6.5. Eastern Europe Ready Drink Tea Coffee Market Analysis, Opportunity and Forecast, By Distribution Channel, 2016-2032
- 6.5.1. Eastern Europe Ready Drink Tea Coffee Market Analysis by Distribution Channel: Introduction
- 6.5.2. Market Size Absolute $ Opportunity Analysis and Forecast, By Distribution Channel, 2016-2032
- 6.5.3. Supermarkets/Hypermarkets
- 6.5.4. Convenience Stores
- 6.5.5. Online
- 6.5.6. Others
- 6.6. Eastern Europe Ready Drink Tea Coffee Market Analysis, Opportunity and Forecast, By Country , 2016-2032
- 6.6.1. Eastern Europe Ready Drink Tea Coffee Market Analysis by Country : Introduction
- 6.6.2. Market Size Absolute $ Opportunity Analysis and Forecast, Country , 2016-2032
- 6.6.2.1. Russia
- 6.6.2.2. Poland
- 6.6.2.3. The Czech Republic
- 6.6.2.4. Greece
- 6.6.2.5. Rest of Eastern Europe
- 7. APAC Ready Drink Tea Coffee Market Analysis, Opportunity and Forecast, 2016-2032
- 7.1. APAC Ready Drink Tea Coffee Market Analysis, 2016-2021
- 7.2. APAC Ready Drink Tea Coffee Market Opportunity and Forecast, 2023-2032
- 7.3. APAC Ready Drink Tea Coffee Market Analysis, Opportunity and Forecast, By Product, 2016-2032
- 7.3.1. APAC Ready Drink Tea Coffee Market Analysis by Product: Introduction
- 7.3.2. Market Size Absolute $ Opportunity Analysis and Forecast, By Product, 2016-2032
- 7.3.3. Tea
- 7.3.4. Coffee
- 7.4. APAC Ready Drink Tea Coffee Market Analysis, Opportunity and Forecast, By Packaging Type, 2016-2032
- 7.4.1. APAC Ready Drink Tea Coffee Market Analysis by Packaging Type: Introduction
- 7.4.2. Market Size Absolute $ Opportunity Analysis and Forecast, By Packaging Type, 2016-2032
- 7.4.3. Glass Bottle
- 7.4.4. PET Bottle
- 7.4.5. Canned
- 7.4.6. Others
- 7.5. APAC Ready Drink Tea Coffee Market Analysis, Opportunity and Forecast, By Distribution Channel, 2016-2032
- 7.5.1. APAC Ready Drink Tea Coffee Market Analysis by Distribution Channel: Introduction
- 7.5.2. Market Size Absolute $ Opportunity Analysis and Forecast, By Distribution Channel, 2016-2032
- 7.5.3. Supermarkets/Hypermarkets
- 7.5.4. Convenience Stores
- 7.5.5. Online
- 7.5.6. Others
- 7.6. APAC Ready Drink Tea Coffee Market Analysis, Opportunity and Forecast, By Country , 2016-2032
- 7.6.1. APAC Ready Drink Tea Coffee Market Analysis by Country : Introduction
- 7.6.2. Market Size Absolute $ Opportunity Analysis and Forecast, Country , 2016-2032
- 7.6.2.1. China
- 7.6.2.2. Japan
- 7.6.2.3. South Korea
- 7.6.2.4. India
- 7.6.2.5. Australia & New Zeland
- 7.6.2.6. Indonesia
- 7.6.2.7. Malaysia
- 7.6.2.8. Philippines
- 7.6.2.9. Singapore
- 7.6.2.10. Thailand
- 7.6.2.11. Vietnam
- 7.6.2.12. Rest of APAC
- 8. Latin America Ready Drink Tea Coffee Market Analysis, Opportunity and Forecast, 2016-2032
- 8.1. Latin America Ready Drink Tea Coffee Market Analysis, 2016-2021
- 8.2. Latin America Ready Drink Tea Coffee Market Opportunity and Forecast, 2023-2032
- 8.3. Latin America Ready Drink Tea Coffee Market Analysis, Opportunity and Forecast, By Product, 2016-2032
- 8.3.1. Latin America Ready Drink Tea Coffee Market Analysis by Product: Introduction
- 8.3.2. Market Size Absolute $ Opportunity Analysis and Forecast, By Product, 2016-2032
- 8.3.3. Tea
- 8.3.4. Coffee
- 8.4. Latin America Ready Drink Tea Coffee Market Analysis, Opportunity and Forecast, By Packaging Type, 2016-2032
- 8.4.1. Latin America Ready Drink Tea Coffee Market Analysis by Packaging Type: Introduction
- 8.4.2. Market Size Absolute $ Opportunity Analysis and Forecast, By Packaging Type, 2016-2032
- 8.4.3. Glass Bottle
- 8.4.4. PET Bottle
- 8.4.5. Canned
- 8.4.6. Others
- 8.5. Latin America Ready Drink Tea Coffee Market Analysis, Opportunity and Forecast, By Distribution Channel, 2016-2032
- 8.5.1. Latin America Ready Drink Tea Coffee Market Analysis by Distribution Channel: Introduction
- 8.5.2. Market Size Absolute $ Opportunity Analysis and Forecast, By Distribution Channel, 2016-2032
- 8.5.3. Supermarkets/Hypermarkets
- 8.5.4. Convenience Stores
- 8.5.5. Online
- 8.5.6. Others
- 8.6. Latin America Ready Drink Tea Coffee Market Analysis, Opportunity and Forecast, By Country , 2016-2032
- 8.6.1. Latin America Ready Drink Tea Coffee Market Analysis by Country : Introduction
- 8.6.2. Market Size Absolute $ Opportunity Analysis and Forecast, Country , 2016-2032
- 8.6.2.1. Brazil
- 8.6.2.2. Colombia
- 8.6.2.3. Chile
- 8.6.2.4. Argentina
- 8.6.2.5. Costa Rica
- 8.6.2.6. Rest of Latin America
- 9. Middle East & Africa Ready Drink Tea Coffee Market Analysis, Opportunity and Forecast, 2016-2032
- 9.1. Middle East & Africa Ready Drink Tea Coffee Market Analysis, 2016-2021
- 9.2. Middle East & Africa Ready Drink Tea Coffee Market Opportunity and Forecast, 2023-2032
- 9.3. Middle East & Africa Ready Drink Tea Coffee Market Analysis, Opportunity and Forecast, By Product, 2016-2032
- 9.3.1. Middle East & Africa Ready Drink Tea Coffee Market Analysis by Product: Introduction
- 9.3.2. Market Size Absolute $ Opportunity Analysis and Forecast, By Product, 2016-2032
- 9.3.3. Tea
- 9.3.4. Coffee
- 9.4. Middle East & Africa Ready Drink Tea Coffee Market Analysis, Opportunity and Forecast, By Packaging Type, 2016-2032
- 9.4.1. Middle East & Africa Ready Drink Tea Coffee Market Analysis by Packaging Type: Introduction
- 9.4.2. Market Size Absolute $ Opportunity Analysis and Forecast, By Packaging Type, 2016-2032
- 9.4.3. Glass Bottle
- 9.4.4. PET Bottle
- 9.4.5. Canned
- 9.4.6. Others
- 9.5. Middle East & Africa Ready Drink Tea Coffee Market Analysis, Opportunity and Forecast, By Distribution Channel, 2016-2032
- 9.5.1. Middle East & Africa Ready Drink Tea Coffee Market Analysis by Distribution Channel: Introduction
- 9.5.2. Market Size Absolute $ Opportunity Analysis and Forecast, By Distribution Channel, 2016-2032
- 9.5.3. Supermarkets/Hypermarkets
- 9.5.4. Convenience Stores
- 9.5.5. Online
- 9.5.6. Others
- 9.6. Middle East & Africa Ready Drink Tea Coffee Market Analysis, Opportunity and Forecast, By Country , 2016-2032
- 9.6.1. Middle East & Africa Ready Drink Tea Coffee Market Analysis by Country : Introduction
- 9.6.2. Market Size Absolute $ Opportunity Analysis and Forecast, Country , 2016-2032
- 9.6.2.1. Algeria
- 9.6.2.2. Egypt
- 9.6.2.3. Israel
- 9.6.2.4. Kuwait
- 9.6.2.5. Nigeria
- 9.6.2.6. Saudi Arabia
- 9.6.2.7. South Africa
- 9.6.2.8. Turkey
- 9.6.2.9. The UAE
- 9.6.2.10. Rest of MEA
- 10. Global Ready Drink Tea Coffee Market Analysis, Opportunity and Forecast, By Region , 2016-2032
- 10.1. Global Ready Drink Tea Coffee Market Analysis by Region : Introduction
- 10.2. Market Size Absolute $ Opportunity Analysis and Forecast, By Region , 2016-2032
- 10.2.1. North America
- 10.2.2. Western Europe
- 10.2.3. Eastern Europe
- 10.2.4. APAC
- 10.2.5. Latin America
- 10.2.6. Middle East & Africa
- 11. Global Ready Drink Tea Coffee Market Competitive Landscape, Market Share Analysis, and Company Profiles
- 11.1. Market Share Analysis
- 11.2. Company Profiles
- 11.3. PepsiCo
- 11.3.1. Company Overview
- 11.3.2. Financial Highlights
- 11.3.3. Product Portfolio
- 11.3.4. SWOT Analysis
- 11.3.5. Key Strategies and Developments
- 11.4. Coca-Cola
- 11.4.1. Company Overview
- 11.4.2. Financial Highlights
- 11.4.3. Product Portfolio
- 11.4.4. SWOT Analysis
- 11.4.5. Key Strategies and Developments
- 11.5. Nestle
- 11.5.1. Company Overview
- 11.5.2. Financial Highlights
- 11.5.3. Product Portfolio
- 11.5.4. SWOT Analysis
- 11.5.5. Key Strategies and Developments
- 11.6. Ting Hsin International Group
- 11.6.1. Company Overview
- 11.6.2. Financial Highlights
- 11.6.3. Product Portfolio
- 11.6.4. SWOT Analysis
- 11.6.5. Key Strategies and Developments
- 11.7. Uni-President Enterprises
- 11.7.1. Company Overview
- 11.7.2. Financial Highlights
- 11.7.3. Product Portfolio
- 11.7.4. SWOT Analysis
- 11.7.5. Key Strategies and Developments
- 11.8. Suntory Beverage & Food
- 11.8.1. Company Overview
- 11.8.2. Financial Highlights
- 11.8.3. Product Portfolio
- 11.8.4. SWOT Analysis
- 11.8.5. Key Strategies and Developments
- 11.9. Monster Beverage Corporation
- 11.9.1. Company Overview
- 11.9.2. Financial Highlights
- 11.9.3. Product Portfolio
- 11.9.4. SWOT Analysis
- 11.9.5. Key Strategies and Developments
- 11.10. Starbucks Corporation
- 11.10.1. Company Overview
- 11.10.2. Financial Highlights
- 11.10.3. Product Portfolio
- 11.10.4. SWOT Analysis
- 11.10.5. Key Strategies and Developments
- 11.11. Asahi Group Holdings
- 11.11.1. Company Overview
- 11.11.2. Financial Highlights
- 11.11.3. Product Portfolio
- 11.11.4. SWOT Analysis
- 11.11.5. Key Strategies and Developments
- 11.12. Dr Pepper Snapple Group
- 11.12.1. Company Overview
- 11.12.2. Financial Highlights
- 11.12.3. Product Portfolio
- 11.12.4. SWOT Analysis
- 11.12.5. Key Strategies and Developments
- 11.13.1. Company Overview
- 11.13.2. Financial Highlights
- 11.13.3. Product Portfolio
- 11.13.4. SWOT Analysis
- 11.13.5. Key Strategies and Developments
- 11.14. Danone
- 11.14.1. Company Overview
- 11.14.2. Financial Highlights
- 11.14.3. Product Portfolio
- 11.14.4. SWOT Analysis
- 11.14.5. Key Strategies and Developments
- 11.15. Hangzhou Wahaha Group
- 11.15.1. Company Overview
- 11.15.2. Financial Highlights
- 11.15.3. Product Portfolio
- 11.15.4. SWOT Analysis
- 11.15.5. Key Strategies and Developments
- 11.16. Lotte Chilsung Beverage
- 11.16.1. Company Overview
- 11.16.2. Financial Highlights
- 11.16.3. Product Portfolio
- 11.16.4. SWOT Analysis
- 11.16.5. Key Strategies and Developments
- 11.17. Amul
- 11.17.1. Company Overview
- 11.17.2. Financial Highlights
- 11.17.3. Product Portfolio
- 11.17.4. SWOT Analysis
- 11.17.5. Key Strategies and Developments
- 11.18. Monster Energy Company
- 11.18.1. Company Overview
- 11.18.2. Financial Highlights
- 11.18.3. Product Portfolio
- 11.18.4. SWOT Analysis
- 11.18.5. Key Strategies and Developments
- 11.19. Arizona Beverage Company
- 11.19.1. Company Overview
- 11.19.2. Financial Highlights
- 11.19.3. Product Portfolio
- 11.19.4. SWOT Analysis
- 11.19.5. Key Strategies and Developments
- 11.20. JAB Holding Company
- 11.20.1. Company Overview
- 11.20.2. Financial Highlights
- 11.20.3. Product Portfolio
- 11.20.4. SWOT Analysis
- 11.20.5. Key Strategies and Developments
- 11.21. Keurig Dr Pepper
- 11.21.1. Company Overview
- 11.21.2. Financial Highlights
- 11.21.3. Product Portfolio
- 11.21.4. SWOT Analysis
- 11.21.5. Key Strategies and Developments
- 11.22. Illycaffè
- 11.22.1. Company Overview
- 11.22.2. Financial Highlights
- 11.22.3. Product Portfolio
- 11.22.4. SWOT Analysis
- 11.22.5. Key Strategies and Developments
- 12. Assumptions and Acronyms
- 13. Research Methodology
- 14. Contact
"
- List of Figures
- "
- Figure 1: Global Ready Drink Tea Coffee Market Revenue (US$ Mn) Market Share by Product in 2022
- Figure 2: Global Ready Drink Tea Coffee Market Market Attractiveness Analysis by Product, 2016-2032
- Figure 3: Global Ready Drink Tea Coffee Market Revenue (US$ Mn) Market Share by Packaging Typein 2022
- Figure 4: Global Ready Drink Tea Coffee Market Market Attractiveness Analysis by Packaging Type, 2016-2032
- Figure 5: Global Ready Drink Tea Coffee Market Revenue (US$ Mn) Market Share by Distribution Channelin 2022
- Figure 6: Global Ready Drink Tea Coffee Market Market Attractiveness Analysis by Distribution Channel, 2016-2032
- Figure 7: Global Ready Drink Tea Coffee Market Revenue (US$ Mn) Market Share by Region in 2022
- Figure 8: Global Ready Drink Tea Coffee Market Market Attractiveness Analysis by Region, 2016-2032
- Figure 9: Global Ready Drink Tea Coffee Market Market Revenue (US$ Mn) (2016-2032)
- Figure 10: Global Ready Drink Tea Coffee Market Market Revenue (US$ Mn) Comparison by Region (2016-2032)
- Figure 11: Global Ready Drink Tea Coffee Market Market Revenue (US$ Mn) Comparison by Product (2016-2032)
- Figure 12: Global Ready Drink Tea Coffee Market Market Revenue (US$ Mn) Comparison by Packaging Type (2016-2032)
- Figure 13: Global Ready Drink Tea Coffee Market Market Revenue (US$ Mn) Comparison by Distribution Channel (2016-2032)
- Figure 14: Global Ready Drink Tea Coffee Market Market Y-o-Y Growth Rate Comparison by Region (2016-2032)
- Figure 15: Global Ready Drink Tea Coffee Market Market Y-o-Y Growth Rate Comparison by Product (2016-2032)
- Figure 16: Global Ready Drink Tea Coffee Market Market Y-o-Y Growth Rate Comparison by Packaging Type (2016-2032)
- Figure 17: Global Ready Drink Tea Coffee Market Market Y-o-Y Growth Rate Comparison by Distribution Channel (2016-2032)
- Figure 18: Global Ready Drink Tea Coffee Market Market Share Comparison by Region (2016-2032)
- Figure 19: Global Ready Drink Tea Coffee Market Market Share Comparison by Product (2016-2032)
- Figure 20: Global Ready Drink Tea Coffee Market Market Share Comparison by Packaging Type (2016-2032)
- Figure 21: Global Ready Drink Tea Coffee Market Market Share Comparison by Distribution Channel (2016-2032)
- Figure 22: North America Ready Drink Tea Coffee Market Revenue (US$ Mn) Market Share by Productin 2022
- Figure 23: North America Ready Drink Tea Coffee Market Market Attractiveness Analysis by Product, 2016-2032
- Figure 24: North America Ready Drink Tea Coffee Market Revenue (US$ Mn) Market Share by Packaging Typein 2022
- Figure 25: North America Ready Drink Tea Coffee Market Market Attractiveness Analysis by Packaging Type, 2016-2032
- Figure 26: North America Ready Drink Tea Coffee Market Revenue (US$ Mn) Market Share by Distribution Channelin 2022
- Figure 27: North America Ready Drink Tea Coffee Market Market Attractiveness Analysis by Distribution Channel, 2016-2032
- Figure 28: North America Ready Drink Tea Coffee Market Revenue (US$ Mn) Market Share by Country in 2022
- Figure 29: North America Ready Drink Tea Coffee Market Market Attractiveness Analysis by Country, 2016-2032
- Figure 30: North America Ready Drink Tea Coffee Market Market Revenue (US$ Mn) (2016-2032)
- Figure 31: North America Ready Drink Tea Coffee Market Market Revenue (US$ Mn) Comparison by Country (2016-2032)
- Figure 32: North America Ready Drink Tea Coffee Market Market Revenue (US$ Mn) Comparison by Product (2016-2032)
- Figure 33: North America Ready Drink Tea Coffee Market Market Revenue (US$ Mn) Comparison by Packaging Type (2016-2032)
- Figure 34: North America Ready Drink Tea Coffee Market Market Revenue (US$ Mn) Comparison by Distribution Channel (2016-2032)
- Figure 35: North America Ready Drink Tea Coffee Market Market Y-o-Y Growth Rate Comparison by Country (2016-2032)
- Figure 36: North America Ready Drink Tea Coffee Market Market Y-o-Y Growth Rate Comparison by Product (2016-2032)
- Figure 37: North America Ready Drink Tea Coffee Market Market Y-o-Y Growth Rate Comparison by Packaging Type (2016-2032)
- Figure 38: North America Ready Drink Tea Coffee Market Market Y-o-Y Growth Rate Comparison by Distribution Channel (2016-2032)
- Figure 39: North America Ready Drink Tea Coffee Market Market Share Comparison by Country (2016-2032)
- Figure 40: North America Ready Drink Tea Coffee Market Market Share Comparison by Product (2016-2032)
- Figure 41: North America Ready Drink Tea Coffee Market Market Share Comparison by Packaging Type (2016-2032)
- Figure 42: North America Ready Drink Tea Coffee Market Market Share Comparison by Distribution Channel (2016-2032)
- Figure 43: Western Europe Ready Drink Tea Coffee Market Revenue (US$ Mn) Market Share by Productin 2022
- Figure 44: Western Europe Ready Drink Tea Coffee Market Market Attractiveness Analysis by Product, 2016-2032
- Figure 45: Western Europe Ready Drink Tea Coffee Market Revenue (US$ Mn) Market Share by Packaging Typein 2022
- Figure 46: Western Europe Ready Drink Tea Coffee Market Market Attractiveness Analysis by Packaging Type, 2016-2032
- Figure 47: Western Europe Ready Drink Tea Coffee Market Revenue (US$ Mn) Market Share by Distribution Channelin 2022
- Figure 48: Western Europe Ready Drink Tea Coffee Market Market Attractiveness Analysis by Distribution Channel, 2016-2032
- Figure 49: Western Europe Ready Drink Tea Coffee Market Revenue (US$ Mn) Market Share by Country in 2022
- Figure 50: Western Europe Ready Drink Tea Coffee Market Market Attractiveness Analysis by Country, 2016-2032
- Figure 51: Western Europe Ready Drink Tea Coffee Market Market Revenue (US$ Mn) (2016-2032)
- Figure 52: Western Europe Ready Drink Tea Coffee Market Market Revenue (US$ Mn) Comparison by Country (2016-2032)
- Figure 53: Western Europe Ready Drink Tea Coffee Market Market Revenue (US$ Mn) Comparison by Product (2016-2032)
- Figure 54: Western Europe Ready Drink Tea Coffee Market Market Revenue (US$ Mn) Comparison by Packaging Type (2016-2032)
- Figure 55: Western Europe Ready Drink Tea Coffee Market Market Revenue (US$ Mn) Comparison by Distribution Channel (2016-2032)
- Figure 56: Western Europe Ready Drink Tea Coffee Market Market Y-o-Y Growth Rate Comparison by Country (2016-2032)
- Figure 57: Western Europe Ready Drink Tea Coffee Market Market Y-o-Y Growth Rate Comparison by Product (2016-2032)
- Figure 58: Western Europe Ready Drink Tea Coffee Market Market Y-o-Y Growth Rate Comparison by Packaging Type (2016-2032)
- Figure 59: Western Europe Ready Drink Tea Coffee Market Market Y-o-Y Growth Rate Comparison by Distribution Channel (2016-2032)
- Figure 60: Western Europe Ready Drink Tea Coffee Market Market Share Comparison by Country (2016-2032)
- Figure 61: Western Europe Ready Drink Tea Coffee Market Market Share Comparison by Product (2016-2032)
- Figure 62: Western Europe Ready Drink Tea Coffee Market Market Share Comparison by Packaging Type (2016-2032)
- Figure 63: Western Europe Ready Drink Tea Coffee Market Market Share Comparison by Distribution Channel (2016-2032)
- Figure 64: Eastern Europe Ready Drink Tea Coffee Market Revenue (US$ Mn) Market Share by Productin 2022
- Figure 65: Eastern Europe Ready Drink Tea Coffee Market Market Attractiveness Analysis by Product, 2016-2032
- Figure 66: Eastern Europe Ready Drink Tea Coffee Market Revenue (US$ Mn) Market Share by Packaging Typein 2022
- Figure 67: Eastern Europe Ready Drink Tea Coffee Market Market Attractiveness Analysis by Packaging Type, 2016-2032
- Figure 68: Eastern Europe Ready Drink Tea Coffee Market Revenue (US$ Mn) Market Share by Distribution Channelin 2022
- Figure 69: Eastern Europe Ready Drink Tea Coffee Market Market Attractiveness Analysis by Distribution Channel, 2016-2032
- Figure 70: Eastern Europe Ready Drink Tea Coffee Market Revenue (US$ Mn) Market Share by Country in 2022
- Figure 71: Eastern Europe Ready Drink Tea Coffee Market Market Attractiveness Analysis by Country, 2016-2032
- Figure 72: Eastern Europe Ready Drink Tea Coffee Market Market Revenue (US$ Mn) (2016-2032)
- Figure 73: Eastern Europe Ready Drink Tea Coffee Market Market Revenue (US$ Mn) Comparison by Country (2016-2032)
- Figure 74: Eastern Europe Ready Drink Tea Coffee Market Market Revenue (US$ Mn) Comparison by Product (2016-2032)
- Figure 75: Eastern Europe Ready Drink Tea Coffee Market Market Revenue (US$ Mn) Comparison by Packaging Type (2016-2032)
- Figure 76: Eastern Europe Ready Drink Tea Coffee Market Market Revenue (US$ Mn) Comparison by Distribution Channel (2016-2032)
- Figure 77: Eastern Europe Ready Drink Tea Coffee Market Market Y-o-Y Growth Rate Comparison by Country (2016-2032)
- Figure 78: Eastern Europe Ready Drink Tea Coffee Market Market Y-o-Y Growth Rate Comparison by Product (2016-2032)
- Figure 79: Eastern Europe Ready Drink Tea Coffee Market Market Y-o-Y Growth Rate Comparison by Packaging Type (2016-2032)
- Figure 80: Eastern Europe Ready Drink Tea Coffee Market Market Y-o-Y Growth Rate Comparison by Distribution Channel (2016-2032)
- Figure 81: Eastern Europe Ready Drink Tea Coffee Market Market Share Comparison by Country (2016-2032)
- Figure 82: Eastern Europe Ready Drink Tea Coffee Market Market Share Comparison by Product (2016-2032)
- Figure 83: Eastern Europe Ready Drink Tea Coffee Market Market Share Comparison by Packaging Type (2016-2032)
- Figure 84: Eastern Europe Ready Drink Tea Coffee Market Market Share Comparison by Distribution Channel (2016-2032)
- Figure 85: APAC Ready Drink Tea Coffee Market Revenue (US$ Mn) Market Share by Productin 2022
- Figure 86: APAC Ready Drink Tea Coffee Market Market Attractiveness Analysis by Product, 2016-2032
- Figure 87: APAC Ready Drink Tea Coffee Market Revenue (US$ Mn) Market Share by Packaging Typein 2022
- Figure 88: APAC Ready Drink Tea Coffee Market Market Attractiveness Analysis by Packaging Type, 2016-2032
- Figure 89: APAC Ready Drink Tea Coffee Market Revenue (US$ Mn) Market Share by Distribution Channelin 2022
- Figure 90: APAC Ready Drink Tea Coffee Market Market Attractiveness Analysis by Distribution Channel, 2016-2032
- Figure 91: APAC Ready Drink Tea Coffee Market Revenue (US$ Mn) Market Share by Country in 2022
- Figure 92: APAC Ready Drink Tea Coffee Market Market Attractiveness Analysis by Country, 2016-2032
- Figure 93: APAC Ready Drink Tea Coffee Market Market Revenue (US$ Mn) (2016-2032)
- Figure 94: APAC Ready Drink Tea Coffee Market Market Revenue (US$ Mn) Comparison by Country (2016-2032)
- Figure 95: APAC Ready Drink Tea Coffee Market Market Revenue (US$ Mn) Comparison by Product (2016-2032)
- Figure 96: APAC Ready Drink Tea Coffee Market Market Revenue (US$ Mn) Comparison by Packaging Type (2016-2032)
- Figure 97: APAC Ready Drink Tea Coffee Market Market Revenue (US$ Mn) Comparison by Distribution Channel (2016-2032)
- Figure 98: APAC Ready Drink Tea Coffee Market Market Y-o-Y Growth Rate Comparison by Country (2016-2032)
- Figure 99: APAC Ready Drink Tea Coffee Market Market Y-o-Y Growth Rate Comparison by Product (2016-2032)
- Figure 100: APAC Ready Drink Tea Coffee Market Market Y-o-Y Growth Rate Comparison by Packaging Type (2016-2032)
- Figure 101: APAC Ready Drink Tea Coffee Market Market Y-o-Y Growth Rate Comparison by Distribution Channel (2016-2032)
- Figure 102: APAC Ready Drink Tea Coffee Market Market Share Comparison by Country (2016-2032)
- Figure 103: APAC Ready Drink Tea Coffee Market Market Share Comparison by Product (2016-2032)
- Figure 104: APAC Ready Drink Tea Coffee Market Market Share Comparison by Packaging Type (2016-2032)
- Figure 105: APAC Ready Drink Tea Coffee Market Market Share Comparison by Distribution Channel (2016-2032)
- Figure 106: Latin America Ready Drink Tea Coffee Market Revenue (US$ Mn) Market Share by Productin 2022
- Figure 107: Latin America Ready Drink Tea Coffee Market Market Attractiveness Analysis by Product, 2016-2032
- Figure 108: Latin America Ready Drink Tea Coffee Market Revenue (US$ Mn) Market Share by Packaging Typein 2022
- Figure 109: Latin America Ready Drink Tea Coffee Market Market Attractiveness Analysis by Packaging Type, 2016-2032
- Figure 110: Latin America Ready Drink Tea Coffee Market Revenue (US$ Mn) Market Share by Distribution Channelin 2022
- Figure 111: Latin America Ready Drink Tea Coffee Market Market Attractiveness Analysis by Distribution Channel, 2016-2032
- Figure 112: Latin America Ready Drink Tea Coffee Market Revenue (US$ Mn) Market Share by Country in 2022
- Figure 113: Latin America Ready Drink Tea Coffee Market Market Attractiveness Analysis by Country, 2016-2032
- Figure 114: Latin America Ready Drink Tea Coffee Market Market Revenue (US$ Mn) (2016-2032)
- Figure 115: Latin America Ready Drink Tea Coffee Market Market Revenue (US$ Mn) Comparison by Country (2016-2032)
- Figure 116: Latin America Ready Drink Tea Coffee Market Market Revenue (US$ Mn) Comparison by Product (2016-2032)
- Figure 117: Latin America Ready Drink Tea Coffee Market Market Revenue (US$ Mn) Comparison by Packaging Type (2016-2032)
- Figure 118: Latin America Ready Drink Tea Coffee Market Market Revenue (US$ Mn) Comparison by Distribution Channel (2016-2032)
- Figure 119: Latin America Ready Drink Tea Coffee Market Market Y-o-Y Growth Rate Comparison by Country (2016-2032)
- Figure 120: Latin America Ready Drink Tea Coffee Market Market Y-o-Y Growth Rate Comparison by Product (2016-2032)
- Figure 121: Latin America Ready Drink Tea Coffee Market Market Y-o-Y Growth Rate Comparison by Packaging Type (2016-2032)
- Figure 122: Latin America Ready Drink Tea Coffee Market Market Y-o-Y Growth Rate Comparison by Distribution Channel (2016-2032)
- Figure 123: Latin America Ready Drink Tea Coffee Market Market Share Comparison by Country (2016-2032)
- Figure 124: Latin America Ready Drink Tea Coffee Market Market Share Comparison by Product (2016-2032)
- Figure 125: Latin America Ready Drink Tea Coffee Market Market Share Comparison by Packaging Type (2016-2032)
- Figure 126: Latin America Ready Drink Tea Coffee Market Market Share Comparison by Distribution Channel (2016-2032)
- Figure 127: Middle East & Africa Ready Drink Tea Coffee Market Revenue (US$ Mn) Market Share by Productin 2022
- Figure 128: Middle East & Africa Ready Drink Tea Coffee Market Market Attractiveness Analysis by Product, 2016-2032
- Figure 129: Middle East & Africa Ready Drink Tea Coffee Market Revenue (US$ Mn) Market Share by Packaging Typein 2022
- Figure 130: Middle East & Africa Ready Drink Tea Coffee Market Market Attractiveness Analysis by Packaging Type, 2016-2032
- Figure 131: Middle East & Africa Ready Drink Tea Coffee Market Revenue (US$ Mn) Market Share by Distribution Channelin 2022
- Figure 132: Middle East & Africa Ready Drink Tea Coffee Market Market Attractiveness Analysis by Distribution Channel, 2016-2032
- Figure 133: Middle East & Africa Ready Drink Tea Coffee Market Revenue (US$ Mn) Market Share by Country in 2022
- Figure 134: Middle East & Africa Ready Drink Tea Coffee Market Market Attractiveness Analysis by Country, 2016-2032
- Figure 135: Middle East & Africa Ready Drink Tea Coffee Market Market Revenue (US$ Mn) (2016-2032)
- Figure 136: Middle East & Africa Ready Drink Tea Coffee Market Market Revenue (US$ Mn) Comparison by Country (2016-2032)
- Figure 137: Middle East & Africa Ready Drink Tea Coffee Market Market Revenue (US$ Mn) Comparison by Product (2016-2032)
- Figure 138: Middle East & Africa Ready Drink Tea Coffee Market Market Revenue (US$ Mn) Comparison by Packaging Type (2016-2032)
- Figure 139: Middle East & Africa Ready Drink Tea Coffee Market Market Revenue (US$ Mn) Comparison by Distribution Channel (2016-2032)
- Figure 140: Middle East & Africa Ready Drink Tea Coffee Market Market Y-o-Y Growth Rate Comparison by Country (2016-2032)
- Figure 141: Middle East & Africa Ready Drink Tea Coffee Market Market Y-o-Y Growth Rate Comparison by Product (2016-2032)
- Figure 142: Middle East & Africa Ready Drink Tea Coffee Market Market Y-o-Y Growth Rate Comparison by Packaging Type (2016-2032)
- Figure 143: Middle East & Africa Ready Drink Tea Coffee Market Market Y-o-Y Growth Rate Comparison by Distribution Channel (2016-2032)
- Figure 144: Middle East & Africa Ready Drink Tea Coffee Market Market Share Comparison by Country (2016-2032)
- Figure 145: Middle East & Africa Ready Drink Tea Coffee Market Market Share Comparison by Product (2016-2032)
- Figure 146: Middle East & Africa Ready Drink Tea Coffee Market Market Share Comparison by Packaging Type (2016-2032)
- Figure 147: Middle East & Africa Ready Drink Tea Coffee Market Market Share Comparison by Distribution Channel (2016-2032)
"
- List of Tables
- "
- Table 1: Global Ready Drink Tea Coffee Market Market Comparison by Product (2016-2032)
- Table 2: Global Ready Drink Tea Coffee Market Market Comparison by Packaging Type (2016-2032)
- Table 3: Global Ready Drink Tea Coffee Market Market Comparison by Distribution Channel (2016-2032)
- Table 4: Global Ready Drink Tea Coffee Market Revenue (US$ Mn) Comparison by Region (2016-2032)
- Table 5: Global Ready Drink Tea Coffee Market Market Revenue (US$ Mn) (2016-2032)
- Table 6: Global Ready Drink Tea Coffee Market Market Revenue (US$ Mn) Comparison by Region (2016-2032)
- Table 7: Global Ready Drink Tea Coffee Market Market Revenue (US$ Mn) Comparison by Product (2016-2032)
- Table 8: Global Ready Drink Tea Coffee Market Market Revenue (US$ Mn) Comparison by Packaging Type (2016-2032)
- Table 9: Global Ready Drink Tea Coffee Market Market Revenue (US$ Mn) Comparison by Distribution Channel (2016-2032)
- Table 10: Global Ready Drink Tea Coffee Market Market Y-o-Y Growth Rate Comparison by Region (2016-2032)
- Table 11: Global Ready Drink Tea Coffee Market Market Y-o-Y Growth Rate Comparison by Product (2016-2032)
- Table 12: Global Ready Drink Tea Coffee Market Market Y-o-Y Growth Rate Comparison by Packaging Type (2016-2032)
- Table 13: Global Ready Drink Tea Coffee Market Market Y-o-Y Growth Rate Comparison by Distribution Channel (2016-2032)
- Table 14: Global Ready Drink Tea Coffee Market Market Share Comparison by Region (2016-2032)
- Table 15: Global Ready Drink Tea Coffee Market Market Share Comparison by Product (2016-2032)
- Table 16: Global Ready Drink Tea Coffee Market Market Share Comparison by Packaging Type (2016-2032)
- Table 17: Global Ready Drink Tea Coffee Market Market Share Comparison by Distribution Channel (2016-2032)
- Table 18: North America Ready Drink Tea Coffee Market Market Comparison by Packaging Type (2016-2032)
- Table 19: North America Ready Drink Tea Coffee Market Market Comparison by Distribution Channel (2016-2032)
- Table 20: North America Ready Drink Tea Coffee Market Revenue (US$ Mn) Comparison by Country (2016-2032)
- Table 21: North America Ready Drink Tea Coffee Market Market Revenue (US$ Mn) (2016-2032)
- Table 22: North America Ready Drink Tea Coffee Market Market Revenue (US$ Mn) Comparison by Country (2016-2032)
- Table 23: North America Ready Drink Tea Coffee Market Market Revenue (US$ Mn) Comparison by Product (2016-2032)
- Table 24: North America Ready Drink Tea Coffee Market Market Revenue (US$ Mn) Comparison by Packaging Type (2016-2032)
- Table 25: North America Ready Drink Tea Coffee Market Market Revenue (US$ Mn) Comparison by Distribution Channel (2016-2032)
- Table 26: North America Ready Drink Tea Coffee Market Market Y-o-Y Growth Rate Comparison by Country (2016-2032)
- Table 27: North America Ready Drink Tea Coffee Market Market Y-o-Y Growth Rate Comparison by Product (2016-2032)
- Table 28: North America Ready Drink Tea Coffee Market Market Y-o-Y Growth Rate Comparison by Packaging Type (2016-2032)
- Table 29: North America Ready Drink Tea Coffee Market Market Y-o-Y Growth Rate Comparison by Distribution Channel (2016-2032)
- Table 30: North America Ready Drink Tea Coffee Market Market Share Comparison by Country (2016-2032)
- Table 31: North America Ready Drink Tea Coffee Market Market Share Comparison by Product (2016-2032)
- Table 32: North America Ready Drink Tea Coffee Market Market Share Comparison by Packaging Type (2016-2032)
- Table 33: North America Ready Drink Tea Coffee Market Market Share Comparison by Distribution Channel (2016-2032)
- Table 34: Western Europe Ready Drink Tea Coffee Market Market Comparison by Product (2016-2032)
- Table 35: Western Europe Ready Drink Tea Coffee Market Market Comparison by Packaging Type (2016-2032)
- Table 36: Western Europe Ready Drink Tea Coffee Market Market Comparison by Distribution Channel (2016-2032)
- Table 37: Western Europe Ready Drink Tea Coffee Market Revenue (US$ Mn) Comparison by Country (2016-2032)
- Table 38: Western Europe Ready Drink Tea Coffee Market Market Revenue (US$ Mn) (2016-2032)
- Table 39: Western Europe Ready Drink Tea Coffee Market Market Revenue (US$ Mn) Comparison by Country (2016-2032)
- Table 40: Western Europe Ready Drink Tea Coffee Market Market Revenue (US$ Mn) Comparison by Product (2016-2032)
- Table 41: Western Europe Ready Drink Tea Coffee Market Market Revenue (US$ Mn) Comparison by Packaging Type (2016-2032)
- Table 42: Western Europe Ready Drink Tea Coffee Market Market Revenue (US$ Mn) Comparison by Distribution Channel (2016-2032)
- Table 43: Western Europe Ready Drink Tea Coffee Market Market Y-o-Y Growth Rate Comparison by Country (2016-2032)
- Table 44: Western Europe Ready Drink Tea Coffee Market Market Y-o-Y Growth Rate Comparison by Product (2016-2032)
- Table 45: Western Europe Ready Drink Tea Coffee Market Market Y-o-Y Growth Rate Comparison by Packaging Type (2016-2032)
- Table 46: Western Europe Ready Drink Tea Coffee Market Market Y-o-Y Growth Rate Comparison by Distribution Channel (2016-2032)
- Table 47: Western Europe Ready Drink Tea Coffee Market Market Share Comparison by Country (2016-2032)
- Table 48: Western Europe Ready Drink Tea Coffee Market Market Share Comparison by Product (2016-2032)
- Table 49: Western Europe Ready Drink Tea Coffee Market Market Share Comparison by Packaging Type (2016-2032)
- Table 50: Western Europe Ready Drink Tea Coffee Market Market Share Comparison by Distribution Channel (2016-2032)
- Table 51: Eastern Europe Ready Drink Tea Coffee Market Market Comparison by Product (2016-2032)
- Table 52: Eastern Europe Ready Drink Tea Coffee Market Market Comparison by Packaging Type (2016-2032)
- Table 53: Eastern Europe Ready Drink Tea Coffee Market Market Comparison by Distribution Channel (2016-2032)
- Table 54: Eastern Europe Ready Drink Tea Coffee Market Revenue (US$ Mn) Comparison by Country (2016-2032)
- Table 55: Eastern Europe Ready Drink Tea Coffee Market Market Revenue (US$ Mn) (2016-2032)
- Table 56: Eastern Europe Ready Drink Tea Coffee Market Market Revenue (US$ Mn) Comparison by Country (2016-2032)
- Table 57: Eastern Europe Ready Drink Tea Coffee Market Market Revenue (US$ Mn) Comparison by Product (2016-2032)
- Table 58: Eastern Europe Ready Drink Tea Coffee Market Market Revenue (US$ Mn) Comparison by Packaging Type (2016-2032)
- Table 59: Eastern Europe Ready Drink Tea Coffee Market Market Revenue (US$ Mn) Comparison by Distribution Channel (2016-2032)
- Table 60: Eastern Europe Ready Drink Tea Coffee Market Market Y-o-Y Growth Rate Comparison by Country (2016-2032)
- Table 61: Eastern Europe Ready Drink Tea Coffee Market Market Y-o-Y Growth Rate Comparison by Product (2016-2032)
- Table 62: Eastern Europe Ready Drink Tea Coffee Market Market Y-o-Y Growth Rate Comparison by Packaging Type (2016-2032)
- Table 63: Eastern Europe Ready Drink Tea Coffee Market Market Y-o-Y Growth Rate Comparison by Distribution Channel (2016-2032)
- Table 64: Eastern Europe Ready Drink Tea Coffee Market Market Share Comparison by Country (2016-2032)
- Table 65: Eastern Europe Ready Drink Tea Coffee Market Market Share Comparison by Product (2016-2032)
- Table 66: Eastern Europe Ready Drink Tea Coffee Market Market Share Comparison by Packaging Type (2016-2032)
- Table 67: Eastern Europe Ready Drink Tea Coffee Market Market Share Comparison by Distribution Channel (2016-2032)
- Table 68: APAC Ready Drink Tea Coffee Market Market Comparison by Product (2016-2032)
- Table 69: APAC Ready Drink Tea Coffee Market Market Comparison by Packaging Type (2016-2032)
- Table 70: APAC Ready Drink Tea Coffee Market Market Comparison by Distribution Channel (2016-2032)
- Table 71: APAC Ready Drink Tea Coffee Market Revenue (US$ Mn) Comparison by Country (2016-2032)
- Table 72: APAC Ready Drink Tea Coffee Market Market Revenue (US$ Mn) (2016-2032)
- Table 73: APAC Ready Drink Tea Coffee Market Market Revenue (US$ Mn) Comparison by Country (2016-2032)
- Table 74: APAC Ready Drink Tea Coffee Market Market Revenue (US$ Mn) Comparison by Product (2016-2032)
- Table 75: APAC Ready Drink Tea Coffee Market Market Revenue (US$ Mn) Comparison by Packaging Type (2016-2032)
- Table 76: APAC Ready Drink Tea Coffee Market Market Revenue (US$ Mn) Comparison by Distribution Channel (2016-2032)
- Table 77: APAC Ready Drink Tea Coffee Market Market Y-o-Y Growth Rate Comparison by Country (2016-2032)
- Table 78: APAC Ready Drink Tea Coffee Market Market Y-o-Y Growth Rate Comparison by Product (2016-2032)
- Table 79: APAC Ready Drink Tea Coffee Market Market Y-o-Y Growth Rate Comparison by Packaging Type (2016-2032)
- Table 80: APAC Ready Drink Tea Coffee Market Market Y-o-Y Growth Rate Comparison by Distribution Channel (2016-2032)
- Table 81: APAC Ready Drink Tea Coffee Market Market Share Comparison by Country (2016-2032)
- Table 82: APAC Ready Drink Tea Coffee Market Market Share Comparison by Product (2016-2032)
- Table 83: APAC Ready Drink Tea Coffee Market Market Share Comparison by Packaging Type (2016-2032)
- Table 84: APAC Ready Drink Tea Coffee Market Market Share Comparison by Distribution Channel (2016-2032)
- Table 85: Latin America Ready Drink Tea Coffee Market Market Comparison by Product (2016-2032)
- Table 86: Latin America Ready Drink Tea Coffee Market Market Comparison by Packaging Type (2016-2032)
- Table 87: Latin America Ready Drink Tea Coffee Market Market Comparison by Distribution Channel (2016-2032)
- Table 88: Latin America Ready Drink Tea Coffee Market Revenue (US$ Mn) Comparison by Country (2016-2032)
- Table 89: Latin America Ready Drink Tea Coffee Market Market Revenue (US$ Mn) (2016-2032)
- Table 90: Latin America Ready Drink Tea Coffee Market Market Revenue (US$ Mn) Comparison by Country (2016-2032)
- Table 91: Latin America Ready Drink Tea Coffee Market Market Revenue (US$ Mn) Comparison by Product (2016-2032)
- Table 92: Latin America Ready Drink Tea Coffee Market Market Revenue (US$ Mn) Comparison by Packaging Type (2016-2032)
- Table 93: Latin America Ready Drink Tea Coffee Market Market Revenue (US$ Mn) Comparison by Distribution Channel (2016-2032)
- Table 94: Latin America Ready Drink Tea Coffee Market Market Y-o-Y Growth Rate Comparison by Country (2016-2032)
- Table 95: Latin America Ready Drink Tea Coffee Market Market Y-o-Y Growth Rate Comparison by Product (2016-2032)
- Table 96: Latin America Ready Drink Tea Coffee Market Market Y-o-Y Growth Rate Comparison by Packaging Type (2016-2032)
- Table 97: Latin America Ready Drink Tea Coffee Market Market Y-o-Y Growth Rate Comparison by Distribution Channel (2016-2032)
- Table 98: Latin America Ready Drink Tea Coffee Market Market Share Comparison by Country (2016-2032)
- Table 99: Latin America Ready Drink Tea Coffee Market Market Share Comparison by Product (2016-2032)
- Table 100: Latin America Ready Drink Tea Coffee Market Market Share Comparison by Packaging Type (2016-2032)
- Table 101: Latin America Ready Drink Tea Coffee Market Market Share Comparison by Distribution Channel (2016-2032)
- Table 102: Middle East & Africa Ready Drink Tea Coffee Market Market Comparison by Product (2016-2032)
- Table 103: Middle East & Africa Ready Drink Tea Coffee Market Market Comparison by Packaging Type (2016-2032)
- Table 104: Middle East & Africa Ready Drink Tea Coffee Market Market Comparison by Distribution Channel (2016-2032)
- Table 105: Middle East & Africa Ready Drink Tea Coffee Market Revenue (US$ Mn) Comparison by Country (2016-2032)
- Table 106: Middle East & Africa Ready Drink Tea Coffee Market Market Revenue (US$ Mn) (2016-2032)
- Table 107: Middle East & Africa Ready Drink Tea Coffee Market Market Revenue (US$ Mn) Comparison by Country (2016-2032)
- Table 108: Middle East & Africa Ready Drink Tea Coffee Market Market Revenue (US$ Mn) Comparison by Product (2016-2032)
- Table 109: Middle East & Africa Ready Drink Tea Coffee Market Market Revenue (US$ Mn) Comparison by Packaging Type (2016-2032)
- Table 110: Middle East & Africa Ready Drink Tea Coffee Market Market Revenue (US$ Mn) Comparison by Distribution Channel (2016-2032)
- Table 111: Middle East & Africa Ready Drink Tea Coffee Market Market Y-o-Y Growth Rate Comparison by Country (2016-2032)
- Table 112: Middle East & Africa Ready Drink Tea Coffee Market Market Y-o-Y Growth Rate Comparison by Product (2016-2032)
- Table 113: Middle East & Africa Ready Drink Tea Coffee Market Market Y-o-Y Growth Rate Comparison by Packaging Type (2016-2032)
- Table 114: Middle East & Africa Ready Drink Tea Coffee Market Market Y-o-Y Growth Rate Comparison by Distribution Channel (2016-2032)
- Table 115: Middle East & Africa Ready Drink Tea Coffee Market Market Share Comparison by Country (2016-2032)
- Table 116: Middle East & Africa Ready Drink Tea Coffee Market Market Share Comparison by Product (2016-2032)
- Table 117: Middle East & Africa Ready Drink Tea Coffee Market Market Share Comparison by Packaging Type (2016-2032)
- Table 118: Middle East & Africa Ready Drink Tea Coffee Market Market Share Comparison by Distribution Channel (2016-2032)
- 1. Executive Summary
-
- PepsiCo
- Coca-Cola
- Nestle
- Ting Hsin International Group
- Uni-President Enterprises
- Suntory Beverage & Food
- Monster Beverage Corporation
- Starbucks Corporation
- Asahi Group Holdings
- Dr Pepper Snapple Group
- Danone
- San Benedetto
- Hangzhou Wahaha Group
- Lotte Chilsung Beverage
- Amul
- Monster Energy Company
- Arizona Beverage Company
- JAB Holding Company
- Keurig Dr Pepper
- Illycaffè
- The Coca-Cola Company
- F&N Foods
Our Clients


View Our Licence Options
