Prostaglandin Market Report By Type (Human Prostaglandins, Veterinary Prostaglandins), By Application (Obstetrics and Gynecology, Cardiovascular Diseases, Erectile Dysfunction, Glaucoma Treatment, Gastrointestinal Diseases, Respiratory Diseases, Renal Diseases), By Route of Administration (Oral, Intravenous, Topical, Intramuscular, Subcutaneous, Intraocular), By End Users, By Region and Companies - Industry Segment Outlook, Market Assessment, Competition Scenario, Trends and Forecast 2024-2033
-
45122
-
April 2024
-
285
-


-
This report was compiled by Trishita Deb Trishita Deb is an experienced market research and consulting professional with over 7 years of expertise across healthcare, consumer goods, and materials, contributing to over 400 healthcare-related reports. Correspondence Team Lead- Healthcare Linkedin | Detailed Market research Methodology Our methodology involves a mix of primary research, including interviews with leading mental health experts, and secondary research from reputable medical journals and databases. View Detailed Methodology Page
-
Quick Navigation
Report Overview
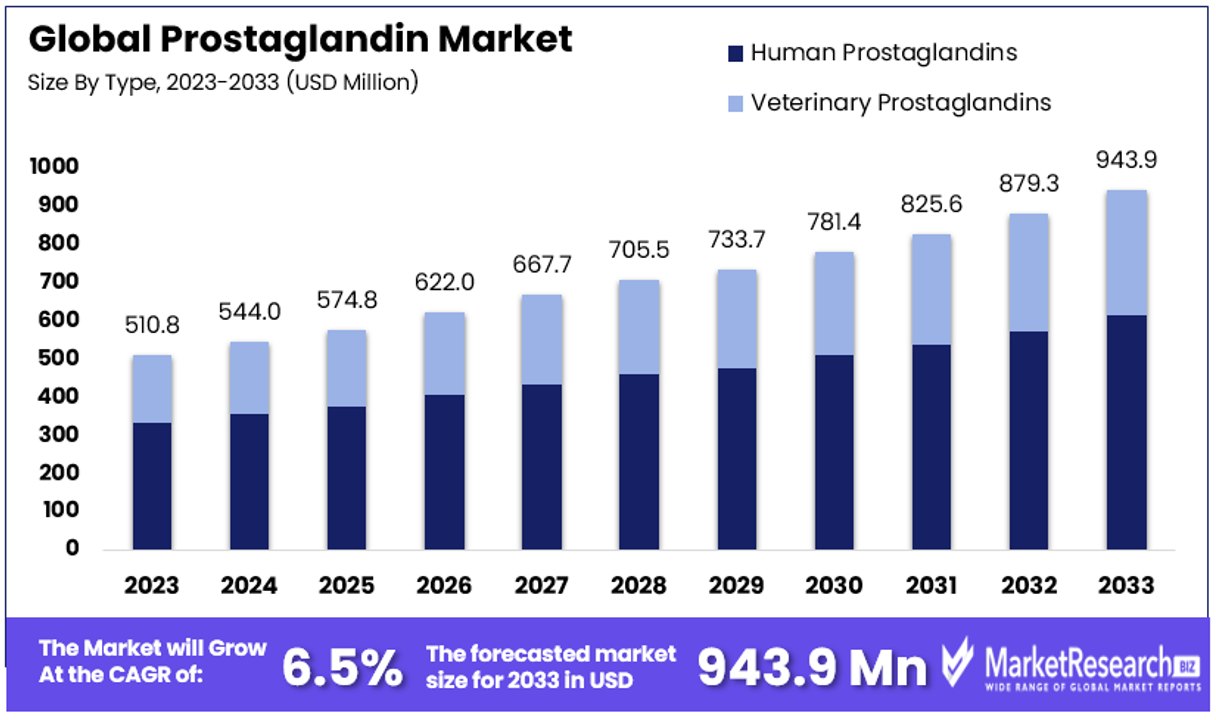
The Global Prostaglandin Market size is expected to be worth around USD 943.9 Million by 2033, from USD 510.8 Million in 2023, growing at a CAGR of 6.50% during the forecast period from 2024 to 2033.
The prostaglandin market refers to the industry focused on the production and distribution of prostaglandins, which are lipid compounds that perform hormone-like functions in various medical and therapeutic applications. This market serves critical roles in pharmaceuticals, particularly in treatments for glaucoma, induction of labor, and managing ulcers.
Key players in the market are involved in research and development, manufacturing, and commercialization of synthetic and natural prostaglandins. Growth in this market can be attributed to increasing demands in reproductive health and eye care, along with advancements in medical research that expand applications of prostaglandins. This sector is vital for companies looking to innovate in biologically active compounds.
The prostaglandin market is poised for significant growth, driven primarily by increasing incidences of glaucoma and cardiovascular diseases (CVD). In 2023, the escalation in global glaucoma cases, particularly among individuals aged 40 to 80, is noteworthy. The prevalence is projected to expand from 76 million in 2020 to 111.8 million by 2040.
This increase underscores the urgent need for effective treatment options, wherein prostaglandins play a crucial role due to their efficacy in managing this condition. Importantly, the awareness of glaucoma remains alarmingly low, with at least half of those affected unaware of their diagnosis, which can reach up to 90% in certain developing regions. This gap represents a substantial opportunity for market expansion through education and access initiatives.
Moreover, in the United States, CVD continues to be the predominant cause of mortality, with 928,741 deaths recorded in 2020 alone. Prostaglandins contribute valuable therapeutic benefits in managing CVD, further augmenting their demand in the pharmaceutical sector.
Manufacturers and stakeholders in the prostaglandin market are therefore encouraged to invest in research and development to innovate and improve prostaglandin formulations and delivery methods. Furthermore, expanding market outreach in underdiagnosed regions could significantly enhance global health outcomes while driving market growth.
Key Takeaways
- Market Value Projection: The Global Prostaglandin Market is forecasted to reach USD 943.9 Million by 2033, with a Compound Annual Growth Rate (CAGR) of 6.50% during the period from 2024 to 2033.
- Type Analysis: Human Prostaglandins lead the market due to their extensive use across various medical treatments, especially in addressing conditions like glaucoma and cardiovascular diseases.
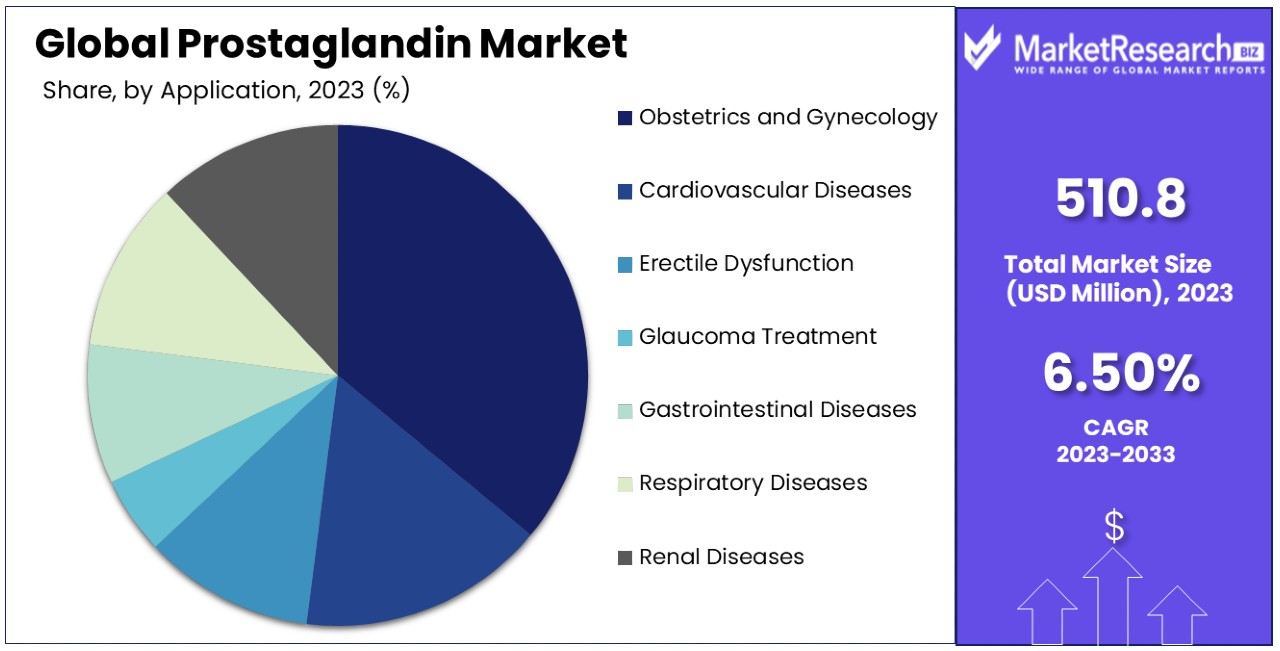
- Application Analysis: Obstetrics and Gynecology is the dominant application segment, fueled by the critical role of prostaglandins in labor induction and related gynecological treatments.
- Route of Administration Analysis: Topical application is the primary route due to its convenience and effectiveness, particularly in ophthalmic and dermatological uses.
- End Users Analysis: Hospitals are the primary end users, given their capacity for professional oversight and comprehensive medical facilities required for administering prostaglandin treatments.
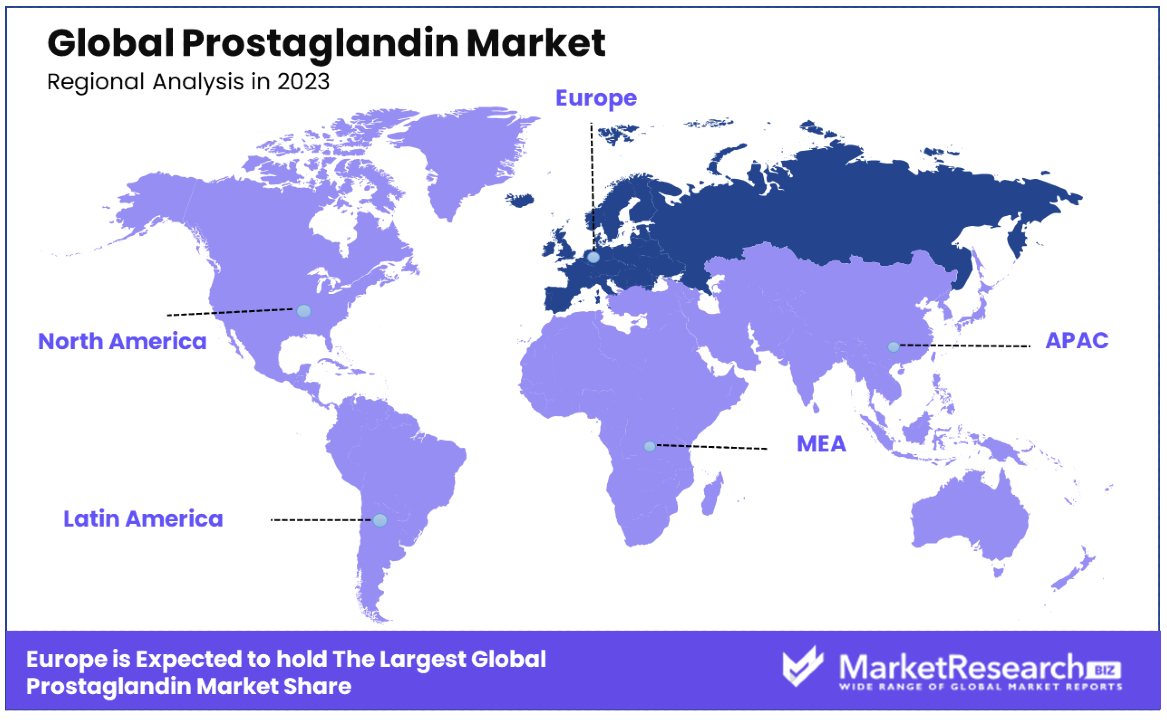
- Europe Dominance: Europe leads the market with a 36% share, attributed to advanced medical technologies and a strong focus on healthcare research.
- North American Influence: North America, especially the United States, holds a significant market share (approximately 30%) due to its advanced medical technologies and robust healthcare research focus.
- Key players in the Prostaglandin Market include pharmaceutical companies involved in the production and distribution of prostaglandin medications.
- Growth Opportunities: Continued research into novel applications and formulations of prostaglandins presents opportunities for market growth and innovation. Targeting emerging markets and increasing accessibility to prostaglandin treatments in developing regions can drive market expansion.
Driving Factors
Increasing Prevalence of Cardiovascular Diseases Drives Market Growth
The role of prostaglandins in managing cardiovascular diseases is a significant driver of their market growth. Prostacyclin analogs such as epoprostenol and treprostinil, essential in treating pulmonary arterial hypertension (PAH) and primary pulmonary hypertension (PPH), have seen increased demand as the incidence of these conditions rises.
As cardiovascular diseases remain a leading cause of death globally, with 928,741 deaths in the United States alone in 2020, the need for effective treatments propels the prostaglandin market forward. The synergistic effect of healthcare's focus on innovative, effective cardiovascular drugs therapies and the expanding patient population needing long-term disease management solutions underlines the continued growth in this segment.
Growth in the Ophthalmology Segment Drives Market Growth
Prostaglandin analogs are pivotal in the treatment of glaucoma, leveraging their capacity to reduce intraocular pressure effectively. With the global aging population, the prevalence of glaucoma is projected to increase from 76 million in 2020 to 111.8 million by 2040.
This demographic shift drives the demand for prostaglandin-based ophthalmic solutions, including widely used drugs like latanoprost, bimatoprost, and travoprost. The intersection of an aging population, the rising incidence of glaucoma, and the critical need for effective treatment options positions prostaglandins as essential components in managing eye health, thereby fueling market expansion.
Expanding Applications in Reproductive Health Drives Market Growth
In the domain of reproductive health, prostaglandins are integral to inducing labor and managing postpartum hemorrhage, pivotal areas as focus on maternal and child health intensifies globally. The adoption of prostaglandin-based medications like misoprostol and dinoprostone is on the rise, attributed to their efficacy and cost-efficiency compared to more invasive treatments.
This trend reflects broader healthcare strategies prioritizing accessible and effective solutions in maternal health, pushing the prostaglandin market's growth as these applications broaden and healthcare systems invest in safe, scalable options for women's health services.
Rising Demand for Pain Management Solutions Drives Market Growth
Prostaglandins such as diclofenac and ibuprofen, known for their anti-inflammatory and analgesic properties, are increasingly utilized in pain management. With chronic pain conditions becoming more prevalent and the ongoing search for effective pain relief solutions, the demand for prostaglandin-based medications is expected to escalate.
This growth is further supported by the broader pharmaceutical industry's focus on developing more efficient and patient-friendly pain management drugs, reflecting a market response to a growing need among the global population for long-term, sustainable pain management strategies.
Restraining Factors
Cost and Accessibility Challenges Restrain Market Growth
The economic and logistical barriers associated with prostaglandin-based medications significantly restrain their market growth. While some prostaglandin formulations are cost-effective, others, particularly advanced delivery systems, are prohibitively expensive for patients in low-income regions.
This discrepancy leads to uneven access across different socioeconomic groups and countries, especially those with underdeveloped healthcare infrastructures. High costs deter widespread adoption and limit market penetration, as not all potential users can afford these treatments. This factor is a critical consideration for pharmaceutical companies aiming to expand their global footprint in the prostaglandin market but face substantial hurdles in making their products accessible and affordable for all.
Competition from Alternative Therapies Restrains Market Growth
Prostaglandin-based medications, while effective, often contend with significant competition from alternative therapies, particularly in areas like glaucoma treatment. Other medication classes, such as beta-blockers and alpha-agonists, offer competitive efficacy and sometimes more favorable side effect profiles or pricing structures.
This competition can fragment the market and limit the growth potential of prostaglandin analogs. As newer drug classes emerge and existing alternatives continue to be optimized for better results and patient compliance, prostaglandins may see their market share squeezed, particularly in well-resourced healthcare settings where multiple therapeutic options are available and commonly prescribed.
Type Analysis
Human Prostaglandins dominate with a significant market share due to their extensive use in various medical treatments.
Human Prostaglandins represent the dominant sub-segment within the Prostaglandin Market. Their widespread application in treating a range of conditions from glaucoma and cardiovascular diseases to labor induction in obstetrics significantly contributes to their leading position. The efficacy and essential role of human prostaglandins in therapeutic protocols ensure their continued dominance. This segment's growth is driven by increasing clinical research that aims to expand the potential uses of prostaglandins, enhancing their effectiveness and safety profile.
In contrast, Veterinary Prostaglandins, while smaller in market share, serve an important role in animal health, particularly in the management of reproductive health and certain diseases in livestock and pets. This segment benefits from research in veterinary medicine that seeks to improve reproductive efficiency and animal welfare, thus supporting market growth. However, the human prostaglandins segment continues to overshadow veterinary applications due to the broader scope of health conditions addressed and the larger market demand in human healthcare settings.
Application Analysis
Obstetrics and Gynecology dominates with a major percentage due to the critical role of prostaglandins in labor induction and related gynecological treatments.
The application of prostaglandins in Obstetrics and Gynecology is pivotal, especially in labor induction and the management of postpartum hemorrhage, making it the dominant sub-segment. The demand in this segment is driven by the need for safe and effective labor-inducing agents across global healthcare systems. As birth rates and the focus on safe childbirth practices increase, particularly in developing regions, the usage of prostaglandins in obstetrics is expected to grow significantly.
Other applications such as Cardiovascular Diseases, Erectile Dysfunction, Glaucoma Treatment, Gastrointestinal Diseases, Respiratory Diseases, and Renal Diseases also contribute to the market but to a lesser extent. Each of these areas utilizes prostaglandins for their unique therapeutic properties, such as vasodilation and inflammation control.
For instance, in Glaucoma Treatment, prostaglandins help reduce intraocular pressure, an essential treatment parameter. Similarly, their anti-inflammatory properties are crucial in managing Cardiovascular and Gastrointestinal Diseases. These segments are expected to see gradual growth as advancements in medical research discover new uses and delivery methods for prostaglandins.
Route of Administration Analysis
Topical application dominates due to its convenience and effectiveness in delivering prostaglandins for ophthalmic and dermatological uses.
The dominance of Topical prostaglandins is primarily due to their ease of application and effectiveness, particularly in treating conditions like glaucoma, where prostaglandin analogs reduce intraocular pressure by increasing aqueous humor outflow. The convenience of topical administration, coupled with lower systemic absorption leading to fewer side effects, makes it highly favorable in both clinical settings and home care.
Other routes of administration such as Oral, Intravenous, Intramuscular, Subcutaneous, and Intraocular play significant roles but are less predominant than topical applications. Each route has specific advantages depending on the condition being treated. For example, intravenous and intramuscular routes are crucial in acute hospital settings for immediate effect, especially in Obstetrics and Gynecology for inducing labor or managing severe postpartum hemorrhage. The choice of administration route often depends on the required speed of action, the targeted tissue, and patient compliance factors.
End Users Analysis
Hospitals dominate as they are the primary healthcare settings for administering prostaglandins due to the need for professional oversight.
Hospitals are the leading end-user segment in the Prostaglandin Market, given their comprehensive medical facilities and the need for specialized healthcare personnel to administer and monitor treatments involving prostaglandins. The complexity of conditions treated with prostaglandins, such as in obstetric care and acute cardiovascular management, necessitates an environment where patient response can be closely monitored.
Specialty Clinics, Ambulatory Surgical Centers, and Pharmacies also constitute important end-user segments but have a smaller share compared to hospitals. Specialty clinics offer targeted treatments, particularly for chronic conditions like glaucoma, where ongoing outpatient care is essential. Ambulatory Surgical Centers provide a setting for procedures that can be completed on an outpatient basis, often involving less complex cases of prostaglandin use. Pharmacies support the distribution and access to prostaglandin medications, particularly for conditions that can be managed with self-administered treatments such as topical prostaglandins for eye conditions.
Key Market Segments
By Type
- Human Prostaglandins
- Veterinary Prostaglandins
By Application
- Obstetrics and Gynecology
- Cardiovascular Diseases
- Erectile Dysfunction
- Glaucoma Treatment
- Gastrointestinal Diseases
- Respiratory Diseases
- Renal Diseases
By Route of Administration
- Oral
- Intravenous
- Topical
- Intramuscular
- Subcutaneous
- Intraocular
By End Users
- Hospitals
- Specialty Clinics
- Ambulatory Surgical Centers
- Pharmacies
Growth Opportunities
Development of Novel Drug Delivery Systems Offers Growth Opportunity
The innovation in drug delivery systems represents a substantial growth opportunity within the Prostaglandin Market. By integrating advanced technologies such as nanoparticles, transdermal patches, and implantable devices, pharmaceutical companies can significantly enhance the efficacy and user experience of prostaglandin-based medications.
For instance, nanoparticle-based formulations are being explored for their ability to provide sustained release of drugs, which is particularly advantageous in the treatment of chronic conditions like glaucoma. This approach could minimize the frequency of dosing, thereby improving patient adherence and overall treatment outcomes. Improved bioavailability and reduced side effects further support patient compliance and can expand the usage of prostaglandins across different medical fields, potentially opening up new sub-markets within the broader pharmaceutical landscape.
Expansion into Emerging Markets Offers Growth Opportunity
Emerging markets present a significant growth avenue for the Prostaglandin Market due to the expansion of healthcare infrastructure and increasing accessibility to medical services. These regions host large populations that have historically been underserved in terms of healthcare, particularly for cost-effective treatments. The prostaglandin segment can capitalize on this by forming alliances with local distributors, setting up production within these markets to reduce costs, and implementing competitive pricing strategies.
Such strategic moves not only enable market penetration but also help in building brand loyalty and awareness in new geographic regions. The increasing demand for healthcare solutions in these areas, coupled with improvements in local healthcare systems, creates a ripe environment for growth, allowing prostaglandin products to fill crucial treatment gaps and drive substantial revenue increases.
Trending Factors
Focus on Personalized Medicine and Precision Dosing Are Trending Factors
The shift towards personalized medicine and precision dosing in the prostaglandin market is a key trending factor. This trend emerges from the understanding that treatment outcomes can vary widely among individuals due to differences in genetic profiles, environmental factors, and lifestyles. In response, the prostaglandin market is moving towards developing dosing strategies and formulations that are tailored to individual needs.
This approach aims to optimize therapeutic effects while minimizing adverse reactions, thereby enhancing the overall effectiveness and safety of prostaglandin medications. Such innovations not only meet the increasing demand for customized healthcare solutions but also strengthen the market's competitive edge by improving patient satisfaction and treatment outcomes.
Integration of Digital Technologies and Telemedicine Are Trending Factors
The incorporation of digital technologies and telemedicine into the prostaglandin market represents a significant trend. These technologies enable more dynamic patient management, allowing for continuous monitoring and timely adjustments to treatment plans.
For instance, the development of mobile apps and wearable devices to monitor patients' responses to prostaglandin therapies provides healthcare providers with real-time data, facilitating more precise and effective management of conditions. This trend enhances medication adherence and patient engagement by making health management more accessible and interactive. Additionally, it helps pharmaceutical companies to gather large amounts of data on drug performance, which can be used to refine drug formulations and dosing regimens, further driving innovation and market growth.
Regional Analysis
Europe Dominates with 36% Market Share
Europe's substantial 36% market share in the Prostaglandin Market can be attributed to its advanced healthcare infrastructure, robust regulatory frameworks, and significant investment in pharmaceutical R&D. The region's focus on innovative healthcare solutions and widespread acceptance of new therapeutic methods contribute to the high usage of prostaglandins, especially in areas like obstetrics and ophthalmology.
The presence of leading pharmaceutical companies and research institutions in Europe enhances its market dynamics. These entities drive innovation and development within the prostaglandin sector, supported by favorable government policies and healthcare spending. The market benefits from the region's high healthcare standards and patient access to new treatment options.
Europe is expected to maintain a strong position in the Prostaglandin Market. Continued emphasis on healthcare innovation and patient care quality, along with demographic trends such as an aging population, will likely sustain demand for prostaglandin products, ensuring Europe remains a key player in the global market.
Regional Market Shares and Dynamics
- North America: Holding a significant market share, North America, especially the United States, is a major player due to its advanced medical technologies and strong focus on healthcare research. Market share: approximately 30%.
- Asia Pacific: This region is experiencing the highest growth in the Prostaglandin Market, with a CAGR of 6.2%. Factors such as improving healthcare infrastructure, increasing healthcare spending, and rising awareness of treatments contribute to this growth.
- Middle East & Africa: While still developing in terms of market share, the Middle East and Africa show potential for growth due to increasing investments in healthcare and an expanding pharmaceutical sector. Market share: smaller but growing.
- Latin America: Latin America's market share is gradually increasing as the region develops its healthcare infrastructure and local governments push for better healthcare standards and access. Market share: modest but improving.
Key Regions and Countries
- North America
- The US
- Canada
- Mexico
- Western Europe
- Germany
- France
- The UK
- Spain
- Italy
- Portugal
- Ireland
- Austria
- Switzerland
- Benelux
- Nordic
- Rest of Western Europe
- Eastern Europe
- Russia
- Poland
- The Czech Republic
- Greece
- Rest of Eastern Europe
- APAC
- China
- Japan
- South Korea
- India
- Australia & New Zealand
- Indonesia
- Malaysia
- Philippines
- Singapore
- Thailand
- Vietnam
- Rest of APAC
- Latin America
- Brazil
- Colombia
- Chile
- Argentina
- Costa Rica
- Rest of Latin America
- Middle East & Africa
- Algeria
- Egypt
- Israel
- Kuwait
- Nigeria
- Saudi Arabia
- South Africa
- Turkey
- United Arab Emirates
- Rest of MEA
Key Players Analysis
In the Prostaglandin Market, the key players including Cayman Chemical, Johnson Matthey, Yonsung Fine Chemicals, Chirogate, Everlight Chemical, Kyowa Hakko Pharma, and ANVI Pharma, significantly impact the competitive landscape through their strategic initiatives. These companies continuously enhance their market estimation and share by focusing on strategic product launches tailored to address critical health issues such as ocular hypertension in patients with glaucoma, facilitating the inflammatory response, and aiding the healing process.
The robust product portfolios of these firms encompass a wide range of applications, underpinned by rigorous clinical studies that validate the efficacy and safety of their products. This scientific backing is crucial for gaining a competitive edge. Furthermore, these players employ key strategies during the forecast period that include scaling up production capabilities and entering into partnerships and collaborations, which are vital for expanding their market presence.
Their efforts in the market are documented through in-depth analysis and detailed company profiles that highlight their achievements and advancements in technology. As the market evolves, these firms are expected to adapt by innovating and improving their offerings, thereby reinforcing their standing in the market and continuing to influence its growth trajectory.
Market Key Players
- Cayman Chemical
- Johnson Matthey
- Yonsung Fine Chemicals
- Chirogate
- Everlight Chemical
- Kyowa Hakko Pharma
- ANVI Pharma
Recent Developments
- On July 2023, EUROAPI announced a €50 million investment for the installation of a new state-of-the-art production plant at its Budapest site. The project is focused on the debottlenecking of the current capacity and the construction of new multi-purpose manufacturing equipment that will more than double the overall prostaglandin capacity of the Budapest site by 2027 in two phases: 2023-2025 and 2026-2027.
Report Scope
Report Features Description Market Value (2023) USD 510.8 Million Forecast Revenue (2033) USD 943.9 Million CAGR (2024-2033) 6.50% Base Year for Estimation 2023 Historic Period 2018-2023 Forecast Period 2024-2033 Report Coverage Revenue Forecast, Market Dynamics, Competitive Landscape, Recent Developments Segments Covered By Type (Human Prostaglandins, Veterinary Prostaglandins), By Application (Obstetrics and Gynecology, Cardiovascular Diseases, Erectile Dysfunction, Glaucoma Treatment, Gastrointestinal Diseases, Respiratory Diseases, Renal Diseases), By Route of Administration (Oral, Intravenous, Topical, Intramuscular, Subcutaneous, Intraocular), By End Users (Hospitals, Specialty Clinics, Ambulatory Surgical Centers, Pharmacies) Regional Analysis North America - The US, Canada, & Mexico; Western Europe - Germany, France, The UK, Spain, Italy, Portugal, Ireland, Austria, Switzerland, Benelux, Nordic, & Rest of Western Europe; Eastern Europe - Russia, Poland, The Czech Republic, Greece, & Rest of Eastern Europe; APAC - China, Japan, South Korea, India, Australia & New Zealand, Indonesia, Malaysia, Philippines, Singapore, Thailand, Vietnam, & Rest of APAC; Latin America - Brazil, Colombia, Chile, Argentina, Costa Rica, & Rest of Latin America; Middle East & Africa - Algeria, Egypt, Israel, Kuwait, Nigeria, Saudi Arabia, South Africa, Turkey, United Arab Emirates, & Rest of MEA Competitive Landscape Cayman Chemical, Johnson Matthey, Yonsung Fine Chemicals, Chirogate, Everlight Chemical, Kyowa Hakko Pharma, ANVI Pharma Customization Scope Customization for segments, region/country-level will be provided. Moreover, additional customization can be done based on the requirements. Purchase Options We have three licenses to opt for: Single User License, Multi-User License (Up to 5 Users), Corporate Use License (Unlimited User and Printable PDF) -
- 1. Executive Summary
- 1.1. Definition
- 1.2. Taxonomy
- 1.3. Research Scope
- 1.4. Key Analysis
- 1.5. Key Findings by Major Segments
- 1.6. Top strategies by Major Players
- 2. Global Prostaglandin Market Overview
- 2.1. Prostaglandin Market Dynamics
- 2.1.1. Drivers
- 2.1.2. Opportunities
- 2.1.3. Restraints
- 2.1.4. Challenges
- 2.2. Macro-economic Factors
- 2.3. Regulatory Framework
- 2.4. Market Investment Feasibility Index
- 2.5. PEST Analysis
- 2.6. PORTER’S Five Force Analysis
- 2.7. Drivers & Restraints Impact Analysis
- 2.8. Industry Chain Analysis
- 2.9. Cost Structure Analysis
- 2.10. Marketing Strategy
- 2.11. Russia-Ukraine War Impact Analysis
- 2.12. Opportunity Map Analysis
- 2.13. Market Competition Scenario Analysis
- 2.14. Product Life Cycle Analysis
- 2.15. Opportunity Orbits
- 2.16. Manufacturer Intensity Map
- 2.17. Major Companies sales by Value & Volume
- 2.1. Prostaglandin Market Dynamics
- 3. Global Prostaglandin Market Analysis, Opportunity and Forecast, 2016-2032
- 3.1. Global Prostaglandin Market Analysis, 2016-2021
- 3.2. Global Prostaglandin Market Opportunity and Forecast, 2023-2032
- 3.3. Global Prostaglandin Market Analysis, Opportunity and Forecast, By Type, 2016-2032
- 3.3.1. Global Prostaglandin Market Analysis by Type: Introduction
- 3.3.2. Market Size Absolute $ Opportunity Analysis and Forecast, By Type, 2016-2032
- 3.3.3. Human Prostaglandins
- 3.3.4. Veterinary Prostaglandins
- 3.4. Global Prostaglandin Market Analysis, Opportunity and Forecast, By Application, 2016-2032
- 3.4.1. Global Prostaglandin Market Analysis by Application: Introduction
- 3.4.2. Market Size Absolute $ Opportunity Analysis and Forecast, By Application, 2016-2032
- 3.4.3. Obstetrics and Gynecology
- 3.4.4. Cardiovascular Diseases
- 3.4.5. Erectile Dysfunction
- 3.4.6. Glaucoma Treatment
- 3.4.7. Gastrointestinal Diseases
- 3.4.8. Respiratory Diseases
- 3.4.9. Renal Diseases
- 3.5. Global Prostaglandin Market Analysis, Opportunity and Forecast, By Route of Administration, 2016-2032
- 3.5.1. Global Prostaglandin Market Analysis by Route of Administration: Introduction
- 3.5.2. Market Size Absolute $ Opportunity Analysis and Forecast, By Route of Administration, 2016-2032
- 3.5.3. Oral
- 3.5.4. Intravenous
- 3.5.5. Topical
- 3.5.6. Intramuscular
- 3.5.7. Subcutaneous
- 3.5.8. Intraocular
- 3.6. Global Prostaglandin Market Analysis, Opportunity and Forecast, By End Users, 2016-2032
- 3.6.1. Global Prostaglandin Market Analysis by End Users: Introduction
- 3.6.2. Market Size Absolute $ Opportunity Analysis and Forecast, By End Users, 2016-2032
- 3.6.3. Hospitals
- 3.6.4. Specialty Clinics
- 3.6.5. Ambulatory Surgical Centers
- 3.6.6. Pharmacies
- 4. North America Prostaglandin Market Analysis, Opportunity and Forecast, 2016-2032
- 4.1. North America Prostaglandin Market Analysis, 2016-2021
- 4.2. North America Prostaglandin Market Opportunity and Forecast, 2023-2032
- 4.3. North America Prostaglandin Market Analysis, Opportunity and Forecast, By Type, 2016-2032
- 4.3.1. North America Prostaglandin Market Analysis by Type: Introduction
- 4.3.2. Market Size Absolute $ Opportunity Analysis and Forecast, By Type, 2016-2032
- 4.3.3. Human Prostaglandins
- 4.3.4. Veterinary Prostaglandins
- 4.4. North America Prostaglandin Market Analysis, Opportunity and Forecast, By Application, 2016-2032
- 4.4.1. North America Prostaglandin Market Analysis by Application: Introduction
- 4.4.2. Market Size Absolute $ Opportunity Analysis and Forecast, By Application, 2016-2032
- 4.4.3. Obstetrics and Gynecology
- 4.4.4. Cardiovascular Diseases
- 4.4.5. Erectile Dysfunction
- 4.4.6. Glaucoma Treatment
- 4.4.7. Gastrointestinal Diseases
- 4.4.8. Respiratory Diseases
- 4.4.9. Renal Diseases
- 4.5. North America Prostaglandin Market Analysis, Opportunity and Forecast, By Route of Administration, 2016-2032
- 4.5.1. North America Prostaglandin Market Analysis by Route of Administration: Introduction
- 4.5.2. Market Size Absolute $ Opportunity Analysis and Forecast, By Route of Administration, 2016-2032
- 4.5.3. Oral
- 4.5.4. Intravenous
- 4.5.5. Topical
- 4.5.6. Intramuscular
- 4.5.7. Subcutaneous
- 4.5.8. Intraocular
- 4.6. North America Prostaglandin Market Analysis, Opportunity and Forecast, By End Users, 2016-2032
- 4.6.1. North America Prostaglandin Market Analysis by End Users: Introduction
- 4.6.2. Market Size Absolute $ Opportunity Analysis and Forecast, By End Users, 2016-2032
- 4.6.3. Hospitals
- 4.6.4. Specialty Clinics
- 4.6.5. Ambulatory Surgical Centers
- 4.6.6. Pharmacies
- 4.7. North America Prostaglandin Market Analysis, Opportunity and Forecast, By Country , 2016-2032
- 4.7.1. North America Prostaglandin Market Analysis by Country : Introduction
- 4.7.2. Market Size Absolute $ Opportunity Analysis and Forecast, Country , 2016-2032
- 4.7.2.1. The US
- 4.7.2.2. Canada
- 4.7.2.3. Mexico
- 5. Western Europe Prostaglandin Market Analysis, Opportunity and Forecast, 2016-2032
- 5.1. Western Europe Prostaglandin Market Analysis, 2016-2021
- 5.2. Western Europe Prostaglandin Market Opportunity and Forecast, 2023-2032
- 5.3. Western Europe Prostaglandin Market Analysis, Opportunity and Forecast, By Type, 2016-2032
- 5.3.1. Western Europe Prostaglandin Market Analysis by Type: Introduction
- 5.3.2. Market Size Absolute $ Opportunity Analysis and Forecast, By Type, 2016-2032
- 5.3.3. Human Prostaglandins
- 5.3.4. Veterinary Prostaglandins
- 5.4. Western Europe Prostaglandin Market Analysis, Opportunity and Forecast, By Application, 2016-2032
- 5.4.1. Western Europe Prostaglandin Market Analysis by Application: Introduction
- 5.4.2. Market Size Absolute $ Opportunity Analysis and Forecast, By Application, 2016-2032
- 5.4.3. Obstetrics and Gynecology
- 5.4.4. Cardiovascular Diseases
- 5.4.5. Erectile Dysfunction
- 5.4.6. Glaucoma Treatment
- 5.4.7. Gastrointestinal Diseases
- 5.4.8. Respiratory Diseases
- 5.4.9. Renal Diseases
- 5.5. Western Europe Prostaglandin Market Analysis, Opportunity and Forecast, By Route of Administration, 2016-2032
- 5.5.1. Western Europe Prostaglandin Market Analysis by Route of Administration: Introduction
- 5.5.2. Market Size Absolute $ Opportunity Analysis and Forecast, By Route of Administration, 2016-2032
- 5.5.3. Oral
- 5.5.4. Intravenous
- 5.5.5. Topical
- 5.5.6. Intramuscular
- 5.5.7. Subcutaneous
- 5.5.8. Intraocular
- 5.6. Western Europe Prostaglandin Market Analysis, Opportunity and Forecast, By End Users, 2016-2032
- 5.6.1. Western Europe Prostaglandin Market Analysis by End Users: Introduction
- 5.6.2. Market Size Absolute $ Opportunity Analysis and Forecast, By End Users, 2016-2032
- 5.6.3. Hospitals
- 5.6.4. Specialty Clinics
- 5.6.5. Ambulatory Surgical Centers
- 5.6.6. Pharmacies
- 5.7. Western Europe Prostaglandin Market Analysis, Opportunity and Forecast, By Country , 2016-2032
- 5.7.1. Western Europe Prostaglandin Market Analysis by Country : Introduction
- 5.7.2. Market Size Absolute $ Opportunity Analysis and Forecast, Country , 2016-2032
- 5.7.2.1. Germany
- 5.7.2.2. France
- 5.7.2.3. The UK
- 5.7.2.4. Spain
- 5.7.2.5. Italy
- 5.7.2.6. Portugal
- 5.7.2.7. Ireland
- 5.7.2.8. Austria
- 5.7.2.9. Switzerland
- 5.7.2.10. Benelux
- 5.7.2.11. Nordic
- 5.7.2.12. Rest of Western Europe
- 6. Eastern Europe Prostaglandin Market Analysis, Opportunity and Forecast, 2016-2032
- 6.1. Eastern Europe Prostaglandin Market Analysis, 2016-2021
- 6.2. Eastern Europe Prostaglandin Market Opportunity and Forecast, 2023-2032
- 6.3. Eastern Europe Prostaglandin Market Analysis, Opportunity and Forecast, By Type, 2016-2032
- 6.3.1. Eastern Europe Prostaglandin Market Analysis by Type: Introduction
- 6.3.2. Market Size Absolute $ Opportunity Analysis and Forecast, By Type, 2016-2032
- 6.3.3. Human Prostaglandins
- 6.3.4. Veterinary Prostaglandins
- 6.4. Eastern Europe Prostaglandin Market Analysis, Opportunity and Forecast, By Application, 2016-2032
- 6.4.1. Eastern Europe Prostaglandin Market Analysis by Application: Introduction
- 6.4.2. Market Size Absolute $ Opportunity Analysis and Forecast, By Application, 2016-2032
- 6.4.3. Obstetrics and Gynecology
- 6.4.4. Cardiovascular Diseases
- 6.4.5. Erectile Dysfunction
- 6.4.6. Glaucoma Treatment
- 6.4.7. Gastrointestinal Diseases
- 6.4.8. Respiratory Diseases
- 6.4.9. Renal Diseases
- 6.5. Eastern Europe Prostaglandin Market Analysis, Opportunity and Forecast, By Route of Administration, 2016-2032
- 6.5.1. Eastern Europe Prostaglandin Market Analysis by Route of Administration: Introduction
- 6.5.2. Market Size Absolute $ Opportunity Analysis and Forecast, By Route of Administration, 2016-2032
- 6.5.3. Oral
- 6.5.4. Intravenous
- 6.5.5. Topical
- 6.5.6. Intramuscular
- 6.5.7. Subcutaneous
- 6.5.8. Intraocular
- 6.6. Eastern Europe Prostaglandin Market Analysis, Opportunity and Forecast, By End Users, 2016-2032
- 6.6.1. Eastern Europe Prostaglandin Market Analysis by End Users: Introduction
- 6.6.2. Market Size Absolute $ Opportunity Analysis and Forecast, By End Users, 2016-2032
- 6.6.3. Hospitals
- 6.6.4. Specialty Clinics
- 6.6.5. Ambulatory Surgical Centers
- 6.6.6. Pharmacies
- 6.7. Eastern Europe Prostaglandin Market Analysis, Opportunity and Forecast, By Country , 2016-2032
- 6.7.1. Eastern Europe Prostaglandin Market Analysis by Country : Introduction
- 6.7.2. Market Size Absolute $ Opportunity Analysis and Forecast, Country , 2016-2032
- 6.7.2.1. Russia
- 6.7.2.2. Poland
- 6.7.2.3. The Czech Republic
- 6.7.2.4. Greece
- 6.7.2.5. Rest of Eastern Europe
- 7. APAC Prostaglandin Market Analysis, Opportunity and Forecast, 2016-2032
- 7.1. APAC Prostaglandin Market Analysis, 2016-2021
- 7.2. APAC Prostaglandin Market Opportunity and Forecast, 2023-2032
- 7.3. APAC Prostaglandin Market Analysis, Opportunity and Forecast, By Type, 2016-2032
- 7.3.1. APAC Prostaglandin Market Analysis by Type: Introduction
- 7.3.2. Market Size Absolute $ Opportunity Analysis and Forecast, By Type, 2016-2032
- 7.3.3. Human Prostaglandins
- 7.3.4. Veterinary Prostaglandins
- 7.4. APAC Prostaglandin Market Analysis, Opportunity and Forecast, By Application, 2016-2032
- 7.4.1. APAC Prostaglandin Market Analysis by Application: Introduction
- 7.4.2. Market Size Absolute $ Opportunity Analysis and Forecast, By Application, 2016-2032
- 7.4.3. Obstetrics and Gynecology
- 7.4.4. Cardiovascular Diseases
- 7.4.5. Erectile Dysfunction
- 7.4.6. Glaucoma Treatment
- 7.4.7. Gastrointestinal Diseases
- 7.4.8. Respiratory Diseases
- 7.4.9. Renal Diseases
- 7.5. APAC Prostaglandin Market Analysis, Opportunity and Forecast, By Route of Administration, 2016-2032
- 7.5.1. APAC Prostaglandin Market Analysis by Route of Administration: Introduction
- 7.5.2. Market Size Absolute $ Opportunity Analysis and Forecast, By Route of Administration, 2016-2032
- 7.5.3. Oral
- 7.5.4. Intravenous
- 7.5.5. Topical
- 7.5.6. Intramuscular
- 7.5.7. Subcutaneous
- 7.5.8. Intraocular
- 7.6. APAC Prostaglandin Market Analysis, Opportunity and Forecast, By End Users, 2016-2032
- 7.6.1. APAC Prostaglandin Market Analysis by End Users: Introduction
- 7.6.2. Market Size Absolute $ Opportunity Analysis and Forecast, By End Users, 2016-2032
- 7.6.3. Hospitals
- 7.6.4. Specialty Clinics
- 7.6.5. Ambulatory Surgical Centers
- 7.6.6. Pharmacies
- 7.7. APAC Prostaglandin Market Analysis, Opportunity and Forecast, By Country , 2016-2032
- 7.7.1. APAC Prostaglandin Market Analysis by Country : Introduction
- 7.7.2. Market Size Absolute $ Opportunity Analysis and Forecast, Country , 2016-2032
- 7.7.2.1. China
- 7.7.2.2. Japan
- 7.7.2.3. South Korea
- 7.7.2.4. India
- 7.7.2.5. Australia & New Zeland
- 7.7.2.6. Indonesia
- 7.7.2.7. Malaysia
- 7.7.2.8. Philippines
- 7.7.2.9. Singapore
- 7.7.2.10. Thailand
- 7.7.2.11. Vietnam
- 7.7.2.12. Rest of APAC
- 8. Latin America Prostaglandin Market Analysis, Opportunity and Forecast, 2016-2032
- 8.1. Latin America Prostaglandin Market Analysis, 2016-2021
- 8.2. Latin America Prostaglandin Market Opportunity and Forecast, 2023-2032
- 8.3. Latin America Prostaglandin Market Analysis, Opportunity and Forecast, By Type, 2016-2032
- 8.3.1. Latin America Prostaglandin Market Analysis by Type: Introduction
- 8.3.2. Market Size Absolute $ Opportunity Analysis and Forecast, By Type, 2016-2032
- 8.3.3. Human Prostaglandins
- 8.3.4. Veterinary Prostaglandins
- 8.4. Latin America Prostaglandin Market Analysis, Opportunity and Forecast, By Application, 2016-2032
- 8.4.1. Latin America Prostaglandin Market Analysis by Application: Introduction
- 8.4.2. Market Size Absolute $ Opportunity Analysis and Forecast, By Application, 2016-2032
- 8.4.3. Obstetrics and Gynecology
- 8.4.4. Cardiovascular Diseases
- 8.4.5. Erectile Dysfunction
- 8.4.6. Glaucoma Treatment
- 8.4.7. Gastrointestinal Diseases
- 8.4.8. Respiratory Diseases
- 8.4.9. Renal Diseases
- 8.5. Latin America Prostaglandin Market Analysis, Opportunity and Forecast, By Route of Administration, 2016-2032
- 8.5.1. Latin America Prostaglandin Market Analysis by Route of Administration: Introduction
- 8.5.2. Market Size Absolute $ Opportunity Analysis and Forecast, By Route of Administration, 2016-2032
- 8.5.3. Oral
- 8.5.4. Intravenous
- 8.5.5. Topical
- 8.5.6. Intramuscular
- 8.5.7. Subcutaneous
- 8.5.8. Intraocular
- 8.6. Latin America Prostaglandin Market Analysis, Opportunity and Forecast, By End Users, 2016-2032
- 8.6.1. Latin America Prostaglandin Market Analysis by End Users: Introduction
- 8.6.2. Market Size Absolute $ Opportunity Analysis and Forecast, By End Users, 2016-2032
- 8.6.3. Hospitals
- 8.6.4. Specialty Clinics
- 8.6.5. Ambulatory Surgical Centers
- 8.6.6. Pharmacies
- 8.7. Latin America Prostaglandin Market Analysis, Opportunity and Forecast, By Country , 2016-2032
- 8.7.1. Latin America Prostaglandin Market Analysis by Country : Introduction
- 8.7.2. Market Size Absolute $ Opportunity Analysis and Forecast, Country , 2016-2032
- 8.7.2.1. Brazil
- 8.7.2.2. Colombia
- 8.7.2.3. Chile
- 8.7.2.4. Argentina
- 8.7.2.5. Costa Rica
- 8.7.2.6. Rest of Latin America
- 9. Middle East & Africa Prostaglandin Market Analysis, Opportunity and Forecast, 2016-2032
- 9.1. Middle East & Africa Prostaglandin Market Analysis, 2016-2021
- 9.2. Middle East & Africa Prostaglandin Market Opportunity and Forecast, 2023-2032
- 9.3. Middle East & Africa Prostaglandin Market Analysis, Opportunity and Forecast, By Type, 2016-2032
- 9.3.1. Middle East & Africa Prostaglandin Market Analysis by Type: Introduction
- 9.3.2. Market Size Absolute $ Opportunity Analysis and Forecast, By Type, 2016-2032
- 9.3.3. Human Prostaglandins
- 9.3.4. Veterinary Prostaglandins
- 9.4. Middle East & Africa Prostaglandin Market Analysis, Opportunity and Forecast, By Application, 2016-2032
- 9.4.1. Middle East & Africa Prostaglandin Market Analysis by Application: Introduction
- 9.4.2. Market Size Absolute $ Opportunity Analysis and Forecast, By Application, 2016-2032
- 9.4.3. Obstetrics and Gynecology
- 9.4.4. Cardiovascular Diseases
- 9.4.5. Erectile Dysfunction
- 9.4.6. Glaucoma Treatment
- 9.4.7. Gastrointestinal Diseases
- 9.4.8. Respiratory Diseases
- 9.4.9. Renal Diseases
- 9.5. Middle East & Africa Prostaglandin Market Analysis, Opportunity and Forecast, By Route of Administration, 2016-2032
- 9.5.1. Middle East & Africa Prostaglandin Market Analysis by Route of Administration: Introduction
- 9.5.2. Market Size Absolute $ Opportunity Analysis and Forecast, By Route of Administration, 2016-2032
- 9.5.3. Oral
- 9.5.4. Intravenous
- 9.5.5. Topical
- 9.5.6. Intramuscular
- 9.5.7. Subcutaneous
- 9.5.8. Intraocular
- 9.6. Middle East & Africa Prostaglandin Market Analysis, Opportunity and Forecast, By End Users, 2016-2032
- 9.6.1. Middle East & Africa Prostaglandin Market Analysis by End Users: Introduction
- 9.6.2. Market Size Absolute $ Opportunity Analysis and Forecast, By End Users, 2016-2032
- 9.6.3. Hospitals
- 9.6.4. Specialty Clinics
- 9.6.5. Ambulatory Surgical Centers
- 9.6.6. Pharmacies
- 9.7. Middle East & Africa Prostaglandin Market Analysis, Opportunity and Forecast, By Country , 2016-2032
- 9.7.1. Middle East & Africa Prostaglandin Market Analysis by Country : Introduction
- 9.7.2. Market Size Absolute $ Opportunity Analysis and Forecast, Country , 2016-2032
- 9.7.2.1. Algeria
- 9.7.2.2. Egypt
- 9.7.2.3. Israel
- 9.7.2.4. Kuwait
- 9.7.2.5. Nigeria
- 9.7.2.6. Saudi Arabia
- 9.7.2.7. South Africa
- 9.7.2.8. Turkey
- 9.7.2.9. The UAE
- 9.7.2.10. Rest of MEA
- 10. Global Prostaglandin Market Analysis, Opportunity and Forecast, By Region , 2016-2032
- 10.1. Global Prostaglandin Market Analysis by Region : Introduction
- 10.2. Market Size Absolute $ Opportunity Analysis and Forecast, By Region , 2016-2032
- 10.2.1. North America
- 10.2.2. Western Europe
- 10.2.3. Eastern Europe
- 10.2.4. APAC
- 10.2.5. Latin America
- 10.2.6. Middle East & Africa
- 11. Global Prostaglandin Market Competitive Landscape, Market Share Analysis, and Company Profiles
- 11.1. Market Share Analysis
- 11.2. Company Profiles
- 11.3. Cayman Chemical
- 11.3.1. Company Overview
- 11.3.2. Financial Highlights
- 11.3.3. Product Portfolio
- 11.3.4. SWOT Analysis
- 11.3.5. Key Strategies and Developments
- 11.4. Johnson Matthey
- 11.4.1. Company Overview
- 11.4.2. Financial Highlights
- 11.4.3. Product Portfolio
- 11.4.4. SWOT Analysis
- 11.4.5. Key Strategies and Developments
- 11.5. Yonsung Fine Chemicals
- 11.5.1. Company Overview
- 11.5.2. Financial Highlights
- 11.5.3. Product Portfolio
- 11.5.4. SWOT Analysis
- 11.5.5. Key Strategies and Developments
- 11.6. Chirogate
- 11.6.1. Company Overview
- 11.6.2. Financial Highlights
- 11.6.3. Product Portfolio
- 11.6.4. SWOT Analysis
- 11.6.5. Key Strategies and Developments
- 11.7. Everlight Chemical
- 11.7.1. Company Overview
- 11.7.2. Financial Highlights
- 11.7.3. Product Portfolio
- 11.7.4. SWOT Analysis
- 11.7.5. Key Strategies and Developments
- 11.8. Kyowa Hakko Pharma
- 11.8.1. Company Overview
- 11.8.2. Financial Highlights
- 11.8.3. Product Portfolio
- 11.8.4. SWOT Analysis
- 11.8.5. Key Strategies and Developments
- 11.9. ANVI Pharma
- 11.9.1. Company Overview
- 11.9.2. Financial Highlights
- 11.9.3. Product Portfolio
- 11.9.4. SWOT Analysis
- 11.9.5. Key Strategies and Developments
- 11.13.1. Company Overview
- 11.13.2. Financial Highlights
- 11.13.3. Product Portfolio
- 11.13.4. SWOT Analysis
- 11.13.5. Key Strategies and Developments
- 12. Assumptions and Acronyms
- 13. Research Methodology
- 14. Contact
- List of Figures
- Figure 1: Global Prostaglandin Market Revenue (US$ Mn) Market Share by Type in 2022
- Figure 2: Global Prostaglandin Market Attractiveness Analysis by Type, 2016-2032
- Figure 3: Global Prostaglandin Market Revenue (US$ Mn) Market Share by Applicationin 2022
- Figure 4: Global Prostaglandin Market Attractiveness Analysis by Application, 2016-2032
- Figure 5: Global Prostaglandin Market Revenue (US$ Mn) Market Share by Route of Administrationin 2022
- Figure 6: Global Prostaglandin Market Attractiveness Analysis by Route of Administration, 2016-2032
- Figure 7: Global Prostaglandin Market Revenue (US$ Mn) Market Share by End Usersin 2022
- Figure 8: Global Prostaglandin Market Attractiveness Analysis by End Users, 2016-2032
- Figure 9: Global Prostaglandin Market Revenue (US$ Mn) Market Share by Region in 2022
- Figure 10: Global Prostaglandin Market Attractiveness Analysis by Region, 2016-2032
- Figure 11: Global Prostaglandin Market Revenue (US$ Mn) (2016-2032)
- Figure 12: Global Prostaglandin Market Revenue (US$ Mn) Comparison by Region (2016-2032)
- Figure 13: Global Prostaglandin Market Revenue (US$ Mn) Comparison by Type (2016-2032)
- Figure 14: Global Prostaglandin Market Revenue (US$ Mn) Comparison by Application (2016-2032)
- Figure 15: Global Prostaglandin Market Revenue (US$ Mn) Comparison by Route of Administration (2016-2032)
- Figure 16: Global Prostaglandin Market Revenue (US$ Mn) Comparison by End Users (2016-2032)
- Figure 17: Global Prostaglandin Market Y-o-Y Growth Rate Comparison by Region (2016-2032)
- Figure 18: Global Prostaglandin Market Y-o-Y Growth Rate Comparison by Type (2016-2032)
- Figure 19: Global Prostaglandin Market Y-o-Y Growth Rate Comparison by Application (2016-2032)
- Figure 20: Global Prostaglandin Market Y-o-Y Growth Rate Comparison by Route of Administration (2016-2032)
- Figure 21: Global Prostaglandin Market Y-o-Y Growth Rate Comparison by End Users (2016-2032)
- Figure 22: Global Prostaglandin Market Share Comparison by Region (2016-2032)
- Figure 23: Global Prostaglandin Market Share Comparison by Type (2016-2032)
- Figure 24: Global Prostaglandin Market Share Comparison by Application (2016-2032)
- Figure 25: Global Prostaglandin Market Share Comparison by Route of Administration (2016-2032)
- Figure 26: Global Prostaglandin Market Share Comparison by End Users (2016-2032)
- Figure 27: North America Prostaglandin Market Revenue (US$ Mn) Market Share by Typein 2022
- Figure 28: North America Prostaglandin Market Attractiveness Analysis by Type, 2016-2032
- Figure 29: North America Prostaglandin Market Revenue (US$ Mn) Market Share by Applicationin 2022
- Figure 30: North America Prostaglandin Market Attractiveness Analysis by Application, 2016-2032
- Figure 31: North America Prostaglandin Market Revenue (US$ Mn) Market Share by Route of Administrationin 2022
- Figure 32: North America Prostaglandin Market Attractiveness Analysis by Route of Administration, 2016-2032
- Figure 33: North America Prostaglandin Market Revenue (US$ Mn) Market Share by End Usersin 2022
- Figure 34: North America Prostaglandin Market Attractiveness Analysis by End Users, 2016-2032
- Figure 35: North America Prostaglandin Market Revenue (US$ Mn) Market Share by Country in 2022
- Figure 36: North America Prostaglandin Market Attractiveness Analysis by Country, 2016-2032
- Figure 37: North America Prostaglandin Market Revenue (US$ Mn) (2016-2032)
- Figure 38: North America Prostaglandin Market Revenue (US$ Mn) Comparison by Country (2016-2032)
- Figure 39: North America Prostaglandin Market Revenue (US$ Mn) Comparison by Type (2016-2032)
- Figure 40: North America Prostaglandin Market Revenue (US$ Mn) Comparison by Application (2016-2032)
- Figure 41: North America Prostaglandin Market Revenue (US$ Mn) Comparison by Route of Administration (2016-2032)
- Figure 42: North America Prostaglandin Market Revenue (US$ Mn) Comparison by End Users (2016-2032)
- Figure 43: North America Prostaglandin Market Y-o-Y Growth Rate Comparison by Country (2016-2032)
- Figure 44: North America Prostaglandin Market Y-o-Y Growth Rate Comparison by Type (2016-2032)
- Figure 45: North America Prostaglandin Market Y-o-Y Growth Rate Comparison by Application (2016-2032)
- Figure 46: North America Prostaglandin Market Y-o-Y Growth Rate Comparison by Route of Administration (2016-2032)
- Figure 47: North America Prostaglandin Market Y-o-Y Growth Rate Comparison by End Users (2016-2032)
- Figure 48: North America Prostaglandin Market Share Comparison by Country (2016-2032)
- Figure 49: North America Prostaglandin Market Share Comparison by Type (2016-2032)
- Figure 50: North America Prostaglandin Market Share Comparison by Application (2016-2032)
- Figure 51: North America Prostaglandin Market Share Comparison by Route of Administration (2016-2032)
- Figure 52: North America Prostaglandin Market Share Comparison by End Users (2016-2032)
- Figure 53: Western Europe Prostaglandin Market Revenue (US$ Mn) Market Share by Typein 2022
- Figure 54: Western Europe Prostaglandin Market Attractiveness Analysis by Type, 2016-2032
- Figure 55: Western Europe Prostaglandin Market Revenue (US$ Mn) Market Share by Applicationin 2022
- Figure 56: Western Europe Prostaglandin Market Attractiveness Analysis by Application, 2016-2032
- Figure 57: Western Europe Prostaglandin Market Revenue (US$ Mn) Market Share by Route of Administrationin 2022
- Figure 58: Western Europe Prostaglandin Market Attractiveness Analysis by Route of Administration, 2016-2032
- Figure 59: Western Europe Prostaglandin Market Revenue (US$ Mn) Market Share by End Usersin 2022
- Figure 60: Western Europe Prostaglandin Market Attractiveness Analysis by End Users, 2016-2032
- Figure 61: Western Europe Prostaglandin Market Revenue (US$ Mn) Market Share by Country in 2022
- Figure 62: Western Europe Prostaglandin Market Attractiveness Analysis by Country, 2016-2032
- Figure 63: Western Europe Prostaglandin Market Revenue (US$ Mn) (2016-2032)
- Figure 64: Western Europe Prostaglandin Market Revenue (US$ Mn) Comparison by Country (2016-2032)
- Figure 65: Western Europe Prostaglandin Market Revenue (US$ Mn) Comparison by Type (2016-2032)
- Figure 66: Western Europe Prostaglandin Market Revenue (US$ Mn) Comparison by Application (2016-2032)
- Figure 67: Western Europe Prostaglandin Market Revenue (US$ Mn) Comparison by Route of Administration (2016-2032)
- Figure 68: Western Europe Prostaglandin Market Revenue (US$ Mn) Comparison by End Users (2016-2032)
- Figure 69: Western Europe Prostaglandin Market Y-o-Y Growth Rate Comparison by Country (2016-2032)
- Figure 70: Western Europe Prostaglandin Market Y-o-Y Growth Rate Comparison by Type (2016-2032)
- Figure 71: Western Europe Prostaglandin Market Y-o-Y Growth Rate Comparison by Application (2016-2032)
- Figure 72: Western Europe Prostaglandin Market Y-o-Y Growth Rate Comparison by Route of Administration (2016-2032)
- Figure 73: Western Europe Prostaglandin Market Y-o-Y Growth Rate Comparison by End Users (2016-2032)
- Figure 74: Western Europe Prostaglandin Market Share Comparison by Country (2016-2032)
- Figure 75: Western Europe Prostaglandin Market Share Comparison by Type (2016-2032)
- Figure 76: Western Europe Prostaglandin Market Share Comparison by Application (2016-2032)
- Figure 77: Western Europe Prostaglandin Market Share Comparison by Route of Administration (2016-2032)
- Figure 78: Western Europe Prostaglandin Market Share Comparison by End Users (2016-2032)
- Figure 79: Eastern Europe Prostaglandin Market Revenue (US$ Mn) Market Share by Typein 2022
- Figure 80: Eastern Europe Prostaglandin Market Attractiveness Analysis by Type, 2016-2032
- Figure 81: Eastern Europe Prostaglandin Market Revenue (US$ Mn) Market Share by Applicationin 2022
- Figure 82: Eastern Europe Prostaglandin Market Attractiveness Analysis by Application, 2016-2032
- Figure 83: Eastern Europe Prostaglandin Market Revenue (US$ Mn) Market Share by Route of Administrationin 2022
- Figure 84: Eastern Europe Prostaglandin Market Attractiveness Analysis by Route of Administration, 2016-2032
- Figure 85: Eastern Europe Prostaglandin Market Revenue (US$ Mn) Market Share by End Usersin 2022
- Figure 86: Eastern Europe Prostaglandin Market Attractiveness Analysis by End Users, 2016-2032
- Figure 87: Eastern Europe Prostaglandin Market Revenue (US$ Mn) Market Share by Country in 2022
- Figure 88: Eastern Europe Prostaglandin Market Attractiveness Analysis by Country, 2016-2032
- Figure 89: Eastern Europe Prostaglandin Market Revenue (US$ Mn) (2016-2032)
- Figure 90: Eastern Europe Prostaglandin Market Revenue (US$ Mn) Comparison by Country (2016-2032)
- Figure 91: Eastern Europe Prostaglandin Market Revenue (US$ Mn) Comparison by Type (2016-2032)
- Figure 92: Eastern Europe Prostaglandin Market Revenue (US$ Mn) Comparison by Application (2016-2032)
- Figure 93: Eastern Europe Prostaglandin Market Revenue (US$ Mn) Comparison by Route of Administration (2016-2032)
- Figure 94: Eastern Europe Prostaglandin Market Revenue (US$ Mn) Comparison by End Users (2016-2032)
- Figure 95: Eastern Europe Prostaglandin Market Y-o-Y Growth Rate Comparison by Country (2016-2032)
- Figure 96: Eastern Europe Prostaglandin Market Y-o-Y Growth Rate Comparison by Type (2016-2032)
- Figure 97: Eastern Europe Prostaglandin Market Y-o-Y Growth Rate Comparison by Application (2016-2032)
- Figure 98: Eastern Europe Prostaglandin Market Y-o-Y Growth Rate Comparison by Route of Administration (2016-2032)
- Figure 99: Eastern Europe Prostaglandin Market Y-o-Y Growth Rate Comparison by End Users (2016-2032)
- Figure 100: Eastern Europe Prostaglandin Market Share Comparison by Country (2016-2032)
- Figure 101: Eastern Europe Prostaglandin Market Share Comparison by Type (2016-2032)
- Figure 102: Eastern Europe Prostaglandin Market Share Comparison by Application (2016-2032)
- Figure 103: Eastern Europe Prostaglandin Market Share Comparison by Route of Administration (2016-2032)
- Figure 104: Eastern Europe Prostaglandin Market Share Comparison by End Users (2016-2032)
- Figure 105: APAC Prostaglandin Market Revenue (US$ Mn) Market Share by Typein 2022
- Figure 106: APAC Prostaglandin Market Attractiveness Analysis by Type, 2016-2032
- Figure 107: APAC Prostaglandin Market Revenue (US$ Mn) Market Share by Applicationin 2022
- Figure 108: APAC Prostaglandin Market Attractiveness Analysis by Application, 2016-2032
- Figure 109: APAC Prostaglandin Market Revenue (US$ Mn) Market Share by Route of Administrationin 2022
- Figure 110: APAC Prostaglandin Market Attractiveness Analysis by Route of Administration, 2016-2032
- Figure 111: APAC Prostaglandin Market Revenue (US$ Mn) Market Share by End Usersin 2022
- Figure 112: APAC Prostaglandin Market Attractiveness Analysis by End Users, 2016-2032
- Figure 113: APAC Prostaglandin Market Revenue (US$ Mn) Market Share by Country in 2022
- Figure 114: APAC Prostaglandin Market Attractiveness Analysis by Country, 2016-2032
- Figure 115: APAC Prostaglandin Market Revenue (US$ Mn) (2016-2032)
- Figure 116: APAC Prostaglandin Market Revenue (US$ Mn) Comparison by Country (2016-2032)
- Figure 117: APAC Prostaglandin Market Revenue (US$ Mn) Comparison by Type (2016-2032)
- Figure 118: APAC Prostaglandin Market Revenue (US$ Mn) Comparison by Application (2016-2032)
- Figure 119: APAC Prostaglandin Market Revenue (US$ Mn) Comparison by Route of Administration (2016-2032)
- Figure 120: APAC Prostaglandin Market Revenue (US$ Mn) Comparison by End Users (2016-2032)
- Figure 121: APAC Prostaglandin Market Y-o-Y Growth Rate Comparison by Country (2016-2032)
- Figure 122: APAC Prostaglandin Market Y-o-Y Growth Rate Comparison by Type (2016-2032)
- Figure 123: APAC Prostaglandin Market Y-o-Y Growth Rate Comparison by Application (2016-2032)
- Figure 124: APAC Prostaglandin Market Y-o-Y Growth Rate Comparison by Route of Administration (2016-2032)
- Figure 125: APAC Prostaglandin Market Y-o-Y Growth Rate Comparison by End Users (2016-2032)
- Figure 126: APAC Prostaglandin Market Share Comparison by Country (2016-2032)
- Figure 127: APAC Prostaglandin Market Share Comparison by Type (2016-2032)
- Figure 128: APAC Prostaglandin Market Share Comparison by Application (2016-2032)
- Figure 129: APAC Prostaglandin Market Share Comparison by Route of Administration (2016-2032)
- Figure 130: APAC Prostaglandin Market Share Comparison by End Users (2016-2032)
- Figure 131: Latin America Prostaglandin Market Revenue (US$ Mn) Market Share by Typein 2022
- Figure 132: Latin America Prostaglandin Market Attractiveness Analysis by Type, 2016-2032
- Figure 133: Latin America Prostaglandin Market Revenue (US$ Mn) Market Share by Applicationin 2022
- Figure 134: Latin America Prostaglandin Market Attractiveness Analysis by Application, 2016-2032
- Figure 135: Latin America Prostaglandin Market Revenue (US$ Mn) Market Share by Route of Administrationin 2022
- Figure 136: Latin America Prostaglandin Market Attractiveness Analysis by Route of Administration, 2016-2032
- Figure 137: Latin America Prostaglandin Market Revenue (US$ Mn) Market Share by End Usersin 2022
- Figure 138: Latin America Prostaglandin Market Attractiveness Analysis by End Users, 2016-2032
- Figure 139: Latin America Prostaglandin Market Revenue (US$ Mn) Market Share by Country in 2022
- Figure 140: Latin America Prostaglandin Market Attractiveness Analysis by Country, 2016-2032
- Figure 141: Latin America Prostaglandin Market Revenue (US$ Mn) (2016-2032)
- Figure 142: Latin America Prostaglandin Market Revenue (US$ Mn) Comparison by Country (2016-2032)
- Figure 143: Latin America Prostaglandin Market Revenue (US$ Mn) Comparison by Type (2016-2032)
- Figure 144: Latin America Prostaglandin Market Revenue (US$ Mn) Comparison by Application (2016-2032)
- Figure 145: Latin America Prostaglandin Market Revenue (US$ Mn) Comparison by Route of Administration (2016-2032)
- Figure 146: Latin America Prostaglandin Market Revenue (US$ Mn) Comparison by End Users (2016-2032)
- Figure 147: Latin America Prostaglandin Market Y-o-Y Growth Rate Comparison by Country (2016-2032)
- Figure 148: Latin America Prostaglandin Market Y-o-Y Growth Rate Comparison by Type (2016-2032)
- Figure 149: Latin America Prostaglandin Market Y-o-Y Growth Rate Comparison by Application (2016-2032)
- Figure 150: Latin America Prostaglandin Market Y-o-Y Growth Rate Comparison by Route of Administration (2016-2032)
- Figure 151: Latin America Prostaglandin Market Y-o-Y Growth Rate Comparison by End Users (2016-2032)
- Figure 152: Latin America Prostaglandin Market Share Comparison by Country (2016-2032)
- Figure 153: Latin America Prostaglandin Market Share Comparison by Type (2016-2032)
- Figure 154: Latin America Prostaglandin Market Share Comparison by Application (2016-2032)
- Figure 155: Latin America Prostaglandin Market Share Comparison by Route of Administration (2016-2032)
- Figure 156: Latin America Prostaglandin Market Share Comparison by End Users (2016-2032)
- Figure 157: Middle East & Africa Prostaglandin Market Revenue (US$ Mn) Market Share by Typein 2022
- Figure 158: Middle East & Africa Prostaglandin Market Attractiveness Analysis by Type, 2016-2032
- Figure 159: Middle East & Africa Prostaglandin Market Revenue (US$ Mn) Market Share by Applicationin 2022
- Figure 160: Middle East & Africa Prostaglandin Market Attractiveness Analysis by Application, 2016-2032
- Figure 161: Middle East & Africa Prostaglandin Market Revenue (US$ Mn) Market Share by Route of Administrationin 2022
- Figure 162: Middle East & Africa Prostaglandin Market Attractiveness Analysis by Route of Administration, 2016-2032
- Figure 163: Middle East & Africa Prostaglandin Market Revenue (US$ Mn) Market Share by End Usersin 2022
- Figure 164: Middle East & Africa Prostaglandin Market Attractiveness Analysis by End Users, 2016-2032
- Figure 165: Middle East & Africa Prostaglandin Market Revenue (US$ Mn) Market Share by Country in 2022
- Figure 166: Middle East & Africa Prostaglandin Market Attractiveness Analysis by Country, 2016-2032
- Figure 167: Middle East & Africa Prostaglandin Market Revenue (US$ Mn) (2016-2032)
- Figure 168: Middle East & Africa Prostaglandin Market Revenue (US$ Mn) Comparison by Country (2016-2032)
- Figure 169: Middle East & Africa Prostaglandin Market Revenue (US$ Mn) Comparison by Type (2016-2032)
- Figure 170: Middle East & Africa Prostaglandin Market Revenue (US$ Mn) Comparison by Application (2016-2032)
- Figure 171: Middle East & Africa Prostaglandin Market Revenue (US$ Mn) Comparison by Route of Administration (2016-2032)
- Figure 172: Middle East & Africa Prostaglandin Market Revenue (US$ Mn) Comparison by End Users (2016-2032)
- Figure 173: Middle East & Africa Prostaglandin Market Y-o-Y Growth Rate Comparison by Country (2016-2032)
- Figure 174: Middle East & Africa Prostaglandin Market Y-o-Y Growth Rate Comparison by Type (2016-2032)
- Figure 175: Middle East & Africa Prostaglandin Market Y-o-Y Growth Rate Comparison by Application (2016-2032)
- Figure 176: Middle East & Africa Prostaglandin Market Y-o-Y Growth Rate Comparison by Route of Administration (2016-2032)
- Figure 177: Middle East & Africa Prostaglandin Market Y-o-Y Growth Rate Comparison by End Users (2016-2032)
- Figure 178: Middle East & Africa Prostaglandin Market Share Comparison by Country (2016-2032)
- Figure 179: Middle East & Africa Prostaglandin Market Share Comparison by Type (2016-2032)
- Figure 180: Middle East & Africa Prostaglandin Market Share Comparison by Application (2016-2032)
- Figure 181: Middle East & Africa Prostaglandin Market Share Comparison by Route of Administration (2016-2032)
- Figure 182: Middle East & Africa Prostaglandin Market Share Comparison by End Users (2016-2032)
- List of Tables
- Table 1: Global Prostaglandin Market Comparison by Type (2016-2032)
- Table 2: Global Prostaglandin Market Comparison by Application (2016-2032)
- Table 3: Global Prostaglandin Market Comparison by Route of Administration (2016-2032)
- Table 4: Global Prostaglandin Market Comparison by End Users (2016-2032)
- Table 5: Global Prostaglandin Market Revenue (US$ Mn) Comparison by Region (2016-2032)
- Table 6: Global Prostaglandin Market Revenue (US$ Mn) (2016-2032)
- Table 7: Global Prostaglandin Market Revenue (US$ Mn) Comparison by Region (2016-2032)
- Table 8: Global Prostaglandin Market Revenue (US$ Mn) Comparison by Type (2016-2032)
- Table 9: Global Prostaglandin Market Revenue (US$ Mn) Comparison by Application (2016-2032)
- Table 10: Global Prostaglandin Market Revenue (US$ Mn) Comparison by Route of Administration (2016-2032)
- Table 11: Global Prostaglandin Market Revenue (US$ Mn) Comparison by End Users (2016-2032)
- Table 12: Global Prostaglandin Market Y-o-Y Growth Rate Comparison by Region (2016-2032)
- Table 13: Global Prostaglandin Market Y-o-Y Growth Rate Comparison by Type (2016-2032)
- Table 14: Global Prostaglandin Market Y-o-Y Growth Rate Comparison by Application (2016-2032)
- Table 15: Global Prostaglandin Market Y-o-Y Growth Rate Comparison by Route of Administration (2016-2032)
- Table 16: Global Prostaglandin Market Y-o-Y Growth Rate Comparison by End Users (2016-2032)
- Table 17: Global Prostaglandin Market Share Comparison by Region (2016-2032)
- Table 18: Global Prostaglandin Market Share Comparison by Type (2016-2032)
- Table 19: Global Prostaglandin Market Share Comparison by Application (2016-2032)
- Table 20: Global Prostaglandin Market Share Comparison by Route of Administration (2016-2032)
- Table 21: Global Prostaglandin Market Share Comparison by End Users (2016-2032)
- Table 22: North America Prostaglandin Market Comparison by Application (2016-2032)
- Table 23: North America Prostaglandin Market Comparison by Route of Administration (2016-2032)
- Table 24: North America Prostaglandin Market Comparison by End Users (2016-2032)
- Table 25: North America Prostaglandin Market Revenue (US$ Mn) Comparison by Country (2016-2032)
- Table 26: North America Prostaglandin Market Revenue (US$ Mn) (2016-2032)
- Table 27: North America Prostaglandin Market Revenue (US$ Mn) Comparison by Country (2016-2032)
- Table 28: North America Prostaglandin Market Revenue (US$ Mn) Comparison by Type (2016-2032)
- Table 29: North America Prostaglandin Market Revenue (US$ Mn) Comparison by Application (2016-2032)
- Table 30: North America Prostaglandin Market Revenue (US$ Mn) Comparison by Route of Administration (2016-2032)
- Table 31: North America Prostaglandin Market Revenue (US$ Mn) Comparison by End Users (2016-2032)
- Table 32: North America Prostaglandin Market Y-o-Y Growth Rate Comparison by Country (2016-2032)
- Table 33: North America Prostaglandin Market Y-o-Y Growth Rate Comparison by Type (2016-2032)
- Table 34: North America Prostaglandin Market Y-o-Y Growth Rate Comparison by Application (2016-2032)
- Table 35: North America Prostaglandin Market Y-o-Y Growth Rate Comparison by Route of Administration (2016-2032)
- Table 36: North America Prostaglandin Market Y-o-Y Growth Rate Comparison by End Users (2016-2032)
- Table 37: North America Prostaglandin Market Share Comparison by Country (2016-2032)
- Table 38: North America Prostaglandin Market Share Comparison by Type (2016-2032)
- Table 39: North America Prostaglandin Market Share Comparison by Application (2016-2032)
- Table 40: North America Prostaglandin Market Share Comparison by Route of Administration (2016-2032)
- Table 41: North America Prostaglandin Market Share Comparison by End Users (2016-2032)
- Table 42: Western Europe Prostaglandin Market Comparison by Type (2016-2032)
- Table 43: Western Europe Prostaglandin Market Comparison by Application (2016-2032)
- Table 44: Western Europe Prostaglandin Market Comparison by Route of Administration (2016-2032)
- Table 45: Western Europe Prostaglandin Market Comparison by End Users (2016-2032)
- Table 46: Western Europe Prostaglandin Market Revenue (US$ Mn) Comparison by Country (2016-2032)
- Table 47: Western Europe Prostaglandin Market Revenue (US$ Mn) (2016-2032)
- Table 48: Western Europe Prostaglandin Market Revenue (US$ Mn) Comparison by Country (2016-2032)
- Table 49: Western Europe Prostaglandin Market Revenue (US$ Mn) Comparison by Type (2016-2032)
- Table 50: Western Europe Prostaglandin Market Revenue (US$ Mn) Comparison by Application (2016-2032)
- Table 51: Western Europe Prostaglandin Market Revenue (US$ Mn) Comparison by Route of Administration (2016-2032)
- Table 52: Western Europe Prostaglandin Market Revenue (US$ Mn) Comparison by End Users (2016-2032)
- Table 53: Western Europe Prostaglandin Market Y-o-Y Growth Rate Comparison by Country (2016-2032)
- Table 54: Western Europe Prostaglandin Market Y-o-Y Growth Rate Comparison by Type (2016-2032)
- Table 55: Western Europe Prostaglandin Market Y-o-Y Growth Rate Comparison by Application (2016-2032)
- Table 56: Western Europe Prostaglandin Market Y-o-Y Growth Rate Comparison by Route of Administration (2016-2032)
- Table 57: Western Europe Prostaglandin Market Y-o-Y Growth Rate Comparison by End Users (2016-2032)
- Table 58: Western Europe Prostaglandin Market Share Comparison by Country (2016-2032)
- Table 59: Western Europe Prostaglandin Market Share Comparison by Type (2016-2032)
- Table 60: Western Europe Prostaglandin Market Share Comparison by Application (2016-2032)
- Table 61: Western Europe Prostaglandin Market Share Comparison by Route of Administration (2016-2032)
- Table 62: Western Europe Prostaglandin Market Share Comparison by End Users (2016-2032)
- Table 63: Eastern Europe Prostaglandin Market Comparison by Type (2016-2032)
- Table 64: Eastern Europe Prostaglandin Market Comparison by Application (2016-2032)
- Table 65: Eastern Europe Prostaglandin Market Comparison by Route of Administration (2016-2032)
- Table 66: Eastern Europe Prostaglandin Market Comparison by End Users (2016-2032)
- Table 67: Eastern Europe Prostaglandin Market Revenue (US$ Mn) Comparison by Country (2016-2032)
- Table 68: Eastern Europe Prostaglandin Market Revenue (US$ Mn) (2016-2032)
- Table 69: Eastern Europe Prostaglandin Market Revenue (US$ Mn) Comparison by Country (2016-2032)
- Table 70: Eastern Europe Prostaglandin Market Revenue (US$ Mn) Comparison by Type (2016-2032)
- Table 71: Eastern Europe Prostaglandin Market Revenue (US$ Mn) Comparison by Application (2016-2032)
- Table 72: Eastern Europe Prostaglandin Market Revenue (US$ Mn) Comparison by Route of Administration (2016-2032)
- Table 73: Eastern Europe Prostaglandin Market Revenue (US$ Mn) Comparison by End Users (2016-2032)
- Table 74: Eastern Europe Prostaglandin Market Y-o-Y Growth Rate Comparison by Country (2016-2032)
- Table 75: Eastern Europe Prostaglandin Market Y-o-Y Growth Rate Comparison by Type (2016-2032)
- Table 76: Eastern Europe Prostaglandin Market Y-o-Y Growth Rate Comparison by Application (2016-2032)
- Table 77: Eastern Europe Prostaglandin Market Y-o-Y Growth Rate Comparison by Route of Administration (2016-2032)
- Table 78: Eastern Europe Prostaglandin Market Y-o-Y Growth Rate Comparison by End Users (2016-2032)
- Table 79: Eastern Europe Prostaglandin Market Share Comparison by Country (2016-2032)
- Table 80: Eastern Europe Prostaglandin Market Share Comparison by Type (2016-2032)
- Table 81: Eastern Europe Prostaglandin Market Share Comparison by Application (2016-2032)
- Table 82: Eastern Europe Prostaglandin Market Share Comparison by Route of Administration (2016-2032)
- Table 83: Eastern Europe Prostaglandin Market Share Comparison by End Users (2016-2032)
- Table 84: APAC Prostaglandin Market Comparison by Type (2016-2032)
- Table 85: APAC Prostaglandin Market Comparison by Application (2016-2032)
- Table 86: APAC Prostaglandin Market Comparison by Route of Administration (2016-2032)
- Table 87: APAC Prostaglandin Market Comparison by End Users (2016-2032)
- Table 88: APAC Prostaglandin Market Revenue (US$ Mn) Comparison by Country (2016-2032)
- Table 89: APAC Prostaglandin Market Revenue (US$ Mn) (2016-2032)
- Table 90: APAC Prostaglandin Market Revenue (US$ Mn) Comparison by Country (2016-2032)
- Table 91: APAC Prostaglandin Market Revenue (US$ Mn) Comparison by Type (2016-2032)
- Table 92: APAC Prostaglandin Market Revenue (US$ Mn) Comparison by Application (2016-2032)
- Table 93: APAC Prostaglandin Market Revenue (US$ Mn) Comparison by Route of Administration (2016-2032)
- Table 94: APAC Prostaglandin Market Revenue (US$ Mn) Comparison by End Users (2016-2032)
- Table 95: APAC Prostaglandin Market Y-o-Y Growth Rate Comparison by Country (2016-2032)
- Table 96: APAC Prostaglandin Market Y-o-Y Growth Rate Comparison by Type (2016-2032)
- Table 97: APAC Prostaglandin Market Y-o-Y Growth Rate Comparison by Application (2016-2032)
- Table 98: APAC Prostaglandin Market Y-o-Y Growth Rate Comparison by Route of Administration (2016-2032)
- Table 99: APAC Prostaglandin Market Y-o-Y Growth Rate Comparison by End Users (2016-2032)
- Table 100: APAC Prostaglandin Market Share Comparison by Country (2016-2032)
- Table 101: APAC Prostaglandin Market Share Comparison by Type (2016-2032)
- Table 102: APAC Prostaglandin Market Share Comparison by Application (2016-2032)
- Table 103: APAC Prostaglandin Market Share Comparison by Route of Administration (2016-2032)
- Table 104: APAC Prostaglandin Market Share Comparison by End Users (2016-2032)
- Table 105: Latin America Prostaglandin Market Comparison by Type (2016-2032)
- Table 106: Latin America Prostaglandin Market Comparison by Application (2016-2032)
- Table 107: Latin America Prostaglandin Market Comparison by Route of Administration (2016-2032)
- Table 108: Latin America Prostaglandin Market Comparison by End Users (2016-2032)
- Table 109: Latin America Prostaglandin Market Revenue (US$ Mn) Comparison by Country (2016-2032)
- Table 110: Latin America Prostaglandin Market Revenue (US$ Mn) (2016-2032)
- Table 111: Latin America Prostaglandin Market Revenue (US$ Mn) Comparison by Country (2016-2032)
- Table 112: Latin America Prostaglandin Market Revenue (US$ Mn) Comparison by Type (2016-2032)
- Table 113: Latin America Prostaglandin Market Revenue (US$ Mn) Comparison by Application (2016-2032)
- Table 114: Latin America Prostaglandin Market Revenue (US$ Mn) Comparison by Route of Administration (2016-2032)
- Table 115: Latin America Prostaglandin Market Revenue (US$ Mn) Comparison by End Users (2016-2032)
- Table 116: Latin America Prostaglandin Market Y-o-Y Growth Rate Comparison by Country (2016-2032)
- Table 117: Latin America Prostaglandin Market Y-o-Y Growth Rate Comparison by Type (2016-2032)
- Table 118: Latin America Prostaglandin Market Y-o-Y Growth Rate Comparison by Application (2016-2032)
- Table 119: Latin America Prostaglandin Market Y-o-Y Growth Rate Comparison by Route of Administration (2016-2032)
- Table 120: Latin America Prostaglandin Market Y-o-Y Growth Rate Comparison by End Users (2016-2032)
- Table 121: Latin America Prostaglandin Market Share Comparison by Country (2016-2032)
- Table 122: Latin America Prostaglandin Market Share Comparison by Type (2016-2032)
- Table 123: Latin America Prostaglandin Market Share Comparison by Application (2016-2032)
- Table 124: Latin America Prostaglandin Market Share Comparison by Route of Administration (2016-2032)
- Table 125: Latin America Prostaglandin Market Share Comparison by End Users (2016-2032)
- Table 126: Middle East & Africa Prostaglandin Market Comparison by Type (2016-2032)
- Table 127: Middle East & Africa Prostaglandin Market Comparison by Application (2016-2032)
- Table 128: Middle East & Africa Prostaglandin Market Comparison by Route of Administration (2016-2032)
- Table 129: Middle East & Africa Prostaglandin Market Comparison by End Users (2016-2032)
- Table 130: Middle East & Africa Prostaglandin Market Revenue (US$ Mn) Comparison by Country (2016-2032)
- Table 131: Middle East & Africa Prostaglandin Market Revenue (US$ Mn) (2016-2032)
- Table 132: Middle East & Africa Prostaglandin Market Revenue (US$ Mn) Comparison by Country (2016-2032)
- Table 133: Middle East & Africa Prostaglandin Market Revenue (US$ Mn) Comparison by Type (2016-2032)
- Table 134: Middle East & Africa Prostaglandin Market Revenue (US$ Mn) Comparison by Application (2016-2032)
- Table 135: Middle East & Africa Prostaglandin Market Revenue (US$ Mn) Comparison by Route of Administration (2016-2032)
- Table 136: Middle East & Africa Prostaglandin Market Revenue (US$ Mn) Comparison by End Users (2016-2032)
- Table 137: Middle East & Africa Prostaglandin Market Y-o-Y Growth Rate Comparison by Country (2016-2032)
- Table 138: Middle East & Africa Prostaglandin Market Y-o-Y Growth Rate Comparison by Type (2016-2032)
- Table 139: Middle East & Africa Prostaglandin Market Y-o-Y Growth Rate Comparison by Application (2016-2032)
- Table 140: Middle East & Africa Prostaglandin Market Y-o-Y Growth Rate Comparison by Route of Administration (2016-2032)
- Table 141: Middle East & Africa Prostaglandin Market Y-o-Y Growth Rate Comparison by End Users (2016-2032)
- Table 142: Middle East & Africa Prostaglandin Market Share Comparison by Country (2016-2032)
- Table 143: Middle East & Africa Prostaglandin Market Share Comparison by Type (2016-2032)
- Table 144: Middle East & Africa Prostaglandin Market Share Comparison by Application (2016-2032)
- Table 145: Middle East & Africa Prostaglandin Market Share Comparison by Route of Administration (2016-2032)
- Table 146: Middle East & Africa Prostaglandin Market Share Comparison by End Users (2016-2032)
- 1. Executive Summary
-
- Cayman Chemical
- Johnson Matthey
- Yonsung Fine Chemicals
- Chirogate
- Everlight Chemical
- Kyowa Hakko Pharma
- ANVI Pharma
Our Clients


View Our Licence Options
