
Powdered Soft Drinks Market By Flavor(Mango, Orange, Cola, Lemon, Apple, Mixed Fruit, Others), By Packaging(Pouches, Carton Boxes, Cans, Sachets), By Distribution Channel(Store-Based Retailing, Online Retail), By Region And Companies - Industry Segment Outlook, Market Assessment, Competition Scenario, Trends, And Forecast 2024-2033
-
26294
-
March 2024
-
158
-


-
This report was compiled by Shreyas Rokade Shreyas Rokade is a seasoned Research Analyst with CMFE, bringing extensive expertise in market research and consulting, with a strong background in Chemical Engineering. Correspondence Team Lead-CMFE Linkedin | Detailed Market research Methodology Our methodology involves a mix of primary research, including interviews with leading mental health experts, and secondary research from reputable medical journals and databases. View Detailed Methodology Page
-
Quick Navigation
Report Overview
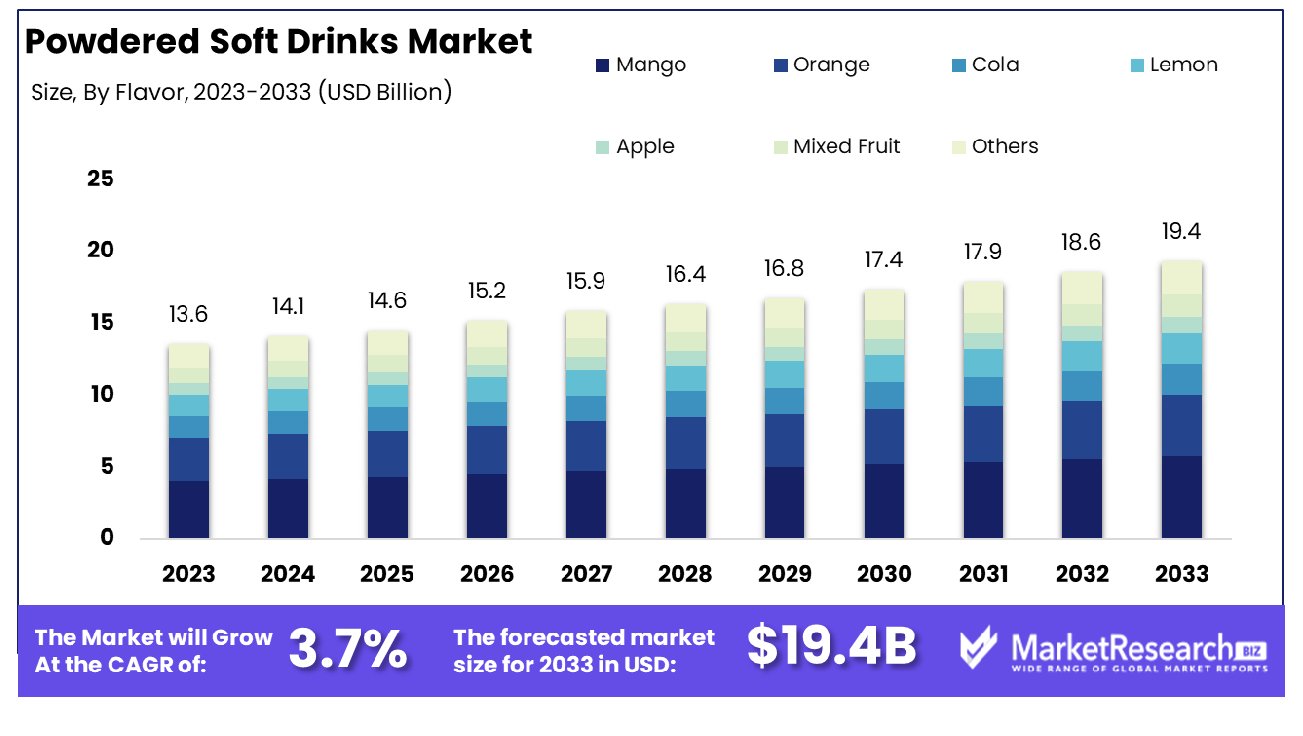
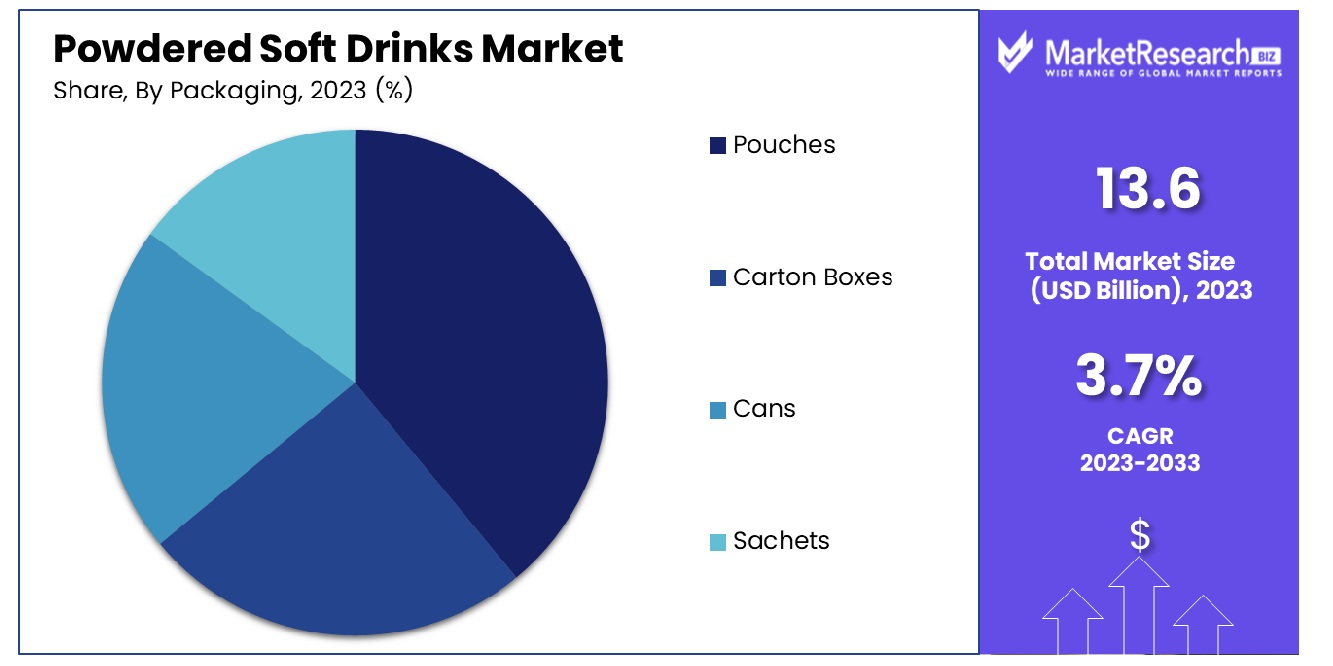
The powdered soft drinks Market valued at USD 13.6 billion in 2023. It is expected to reach USD 19.4 billion by 2033, with a CAGR of 3.7% during the forecast period from 2024 to 2033. The surge in demand for the different types of travel and tourism, and the rise in packaged refreshments are some of the main key driving factors for the powdered soft drink market.
Powdered soft drinks are defined as dry, soluble formulations that are mixed with water, to create a flavored beverage. Generally, package the d in individuals’ sachets or huge containers, such powders often incDevelopment sweeteners, acids, flavorings, and effervescent agents. These soft drinks are well-known among consumers for their convenience and versatility. Powdered soft drinks provide a broad range of flavors, consists fruit, different blends, and cola.
There are several substitutes to pre-bottled beverages that permit for personalization of sweetness and concentration. More often, it is found in instant drink mixes or as part of ready-to-drink preparations, powdered soft drinks have much popularity for their self-stability, easy portability, and decreased environmental impact as compared to single-use bottled beverages. Such a format offers customers a convenient and flexible alternative for enjoying several varieties of refreshing drinks at their desired strength and taste choice.
In August 2023, highlights that the In-house penetration of cold beverages that comprises soft drinks, squashes, packaged juices, and powdered mixes has witnessed 47% in May 2023 as compared to 38% in 2019. The marketing information and analytics firm Kantar reported that this growth rate is substantially better than any 12 months before the pandemic. Moreover, families are shopping more frequently for soft drinks.
Many households are purchasing bottled soft drinks which is 6.5 annually as compared to 5.5 times in 2019 showcases that the habit is now well-engrained. At the time of March-May 2023, the average buying quantity of cold beverages reduced from 3.8 liters to 4.1 liters in the year-ago period. Additionally, in the April-June, the largest contributor to yearly sales of beverages firms contributed to close to 40% of annual sales.
Powdered soft drinks have gained much attention in the modern era for their sustainability and personalization features. It also provides packaging of waste as compared to traditional bottled beverages, they bring into line with biodegradable and eco-friendly practices. Moreover, their versatility permits customers to regulate sweetness levels by providing individuals with taste choices and promoting a more tailor-made beverage experience. The demand for powdered soft drinks will increase due to their requirement in the food and beverages industry which will help in market expansion in the coming years.
Key Takeaways
- Market Growth: Powdered Soft Drinks Market was valued at USD 13.6 billion in 2023. It is expected to reach USD 19.4 billion by 2033, with a CAGR of 3.7% during the forecast period from 2024 to 2033.
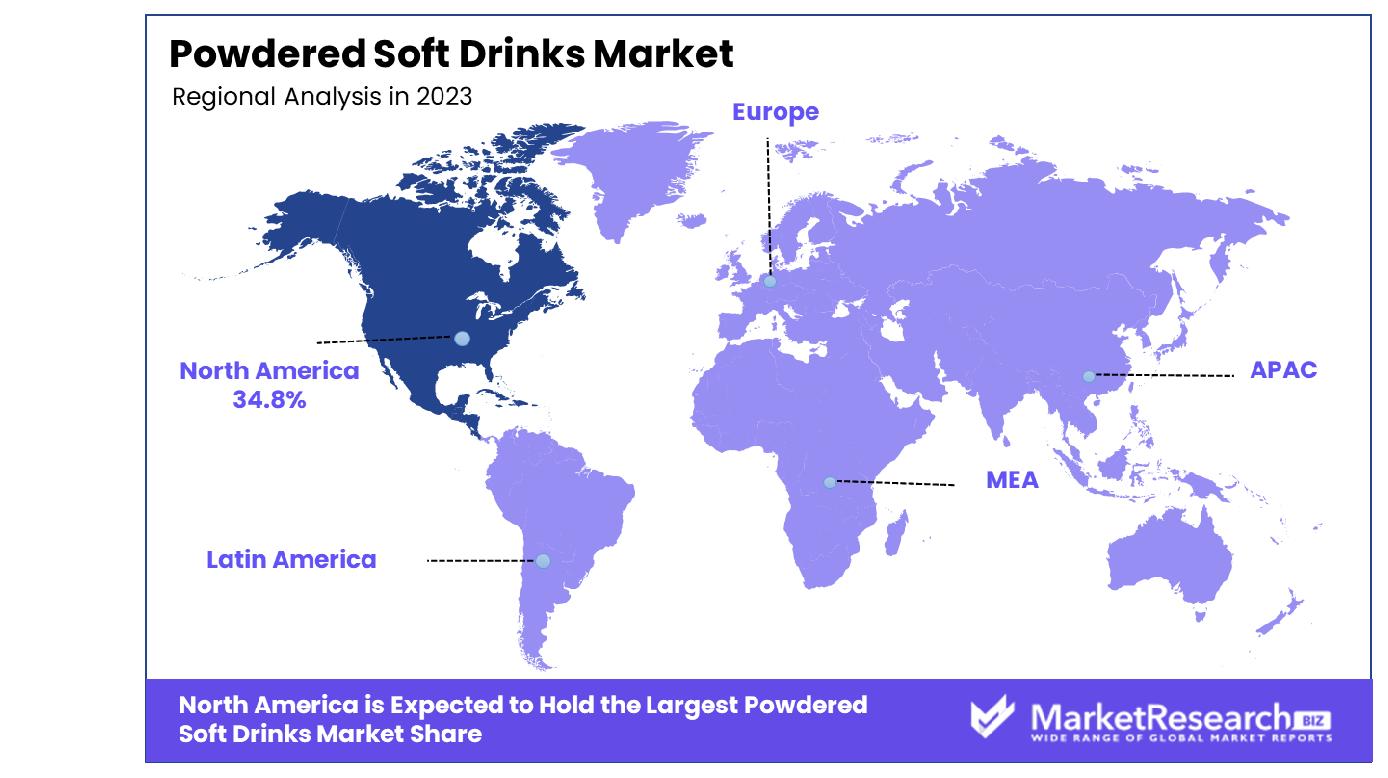
- Regional Dominance: North America dominates the Powdered Soft Drinks Market with a significant 34.8% share.
- By Flavor: In the Powdered Soft Drinks Market, Mango emerged as the most popular flavor among consumers.
- By Packaging: Pouches took the lead as the preferred packaging option, dominating the market landscape.
- By Distribution Channel: Store-based retailing remained the dominant distribution channel, reflecting consumer preference for physical shopping experiences.
- Growth Opportunity: In 2023, the Powdered Soft Drinks Market is set to thrive by catering to health-conscious consumers with innovative, health-oriented products and leveraging e-commerce and digital marketing for enhanced reach and engagement.
Driving factors
Rapid Consumer Shift Towards Convenience: Fueling Demand for Powdered Soft Drinks
The Powdered Soft Drinks Market is witnessing significant growth, primarily propelled by an increasing consumer preference for ready-to-go products. This shift is attributed to the modern lifestyle's demand for convenience and time-saving options, leading to a heightened demand for instant beverage solutions. Powdered soft drinks, with their ease of preparation and storage, cater precisely to this need, offering consumers a quick and convenient way to enjoy a variety of flavors and beverages without the hassle of traditional preparation methods.
Technological Innovations: Shaping the Future of Powdered Soft Drinks
Technological advancements play a crucial role in transforming the Powdered Soft Drinks Market. These innovations are not only improving product quality and shelf life but also enabling the development of a wider range of flavors and formulations that cater to the evolving tastes and dietary supplement preferences of consumers. From enhanced solubility to the incorporation of health-centric ingredients, technology is facilitating the creation of products that are not only convenient but also aligned with the growing trend toward health-conscious and wellness.
Strategic Investments: Driving Market Expansion and Innovation
Investments by key industry players are a significant catalyst for growth and innovation within the Powdered Soft Drinks Market. These investments are not only expanding production capabilities and market reach but also fostering innovation through research and development initiatives. As companies vie to differentiate themselves in a competitive market, such investments are crucial in developing new products, improving existing offerings, and exploring untapped markets. This influx of capital is thus instrumental in driving both market expansion and the introduction of innovative products that meet the dynamic needs of consumers worldwide.
Restraining Factors
High Initial Investment: A Threshold for Market Entry and Innovation
The requirement for high initial investment constitutes a substantial barrier to entry and innovation within the Powdered Soft Drinks Market. Developing new products, ensuring regulatory compliance, and establishing efficient distribution channels demand significant upfront capital. This financial barrier not only deters new entrants but also limits the capacity of existing players to innovate and expand their product lines. The high cost associated with research and development, coupled with the need for advanced manufacturing and packaging technologies, further escalates the financial burden, potentially stifling the market's growth and diversity.
Limited Consumer Awareness: A Challenge to Market Penetration
Concurrently, limited consumer awareness regarding the benefits and availability of powdered soft drinks impedes market growth. Despite the convenience and variety offered by these products, a lack of effective marketing and consumer education restricts their penetration, especially in major regions where traditional beverages dominate. This limited awareness, coupled with misconceptions about the nutritional value and taste of the powdered soft drinks category, further challenges market expansion, reducing the potential consumer base and impacting overall sales.
By Flavor Analysis
Mango flavor leads in the Powdered Soft Drinks Market, appealing to many.
In 2023, Mango emerged as the leading flavor in the Powdered Soft Drinks Market within the By-flavor segment, showcasing its paramount significance among consumers. This preference is not merely a testament to the flavor's popularity but also reflects broader consumer key trends favoring tropical and exotic tastes. Mango, with its distinctive and appealing taste, has managed to outperform other traditional flavors such as Orange market, Cola, Lemon, Apple, and Mixed Fruit, as well as a diverse range of other flavors categorized under "Others."
The preference for Mango can be attributed to several major factors. Firstly, the global inclination towards tropical flavors has seen a significant rise, with Mango being at the forefront due to its unique and refreshing taste. Secondly, innovations in flavor technology and marketing strategies have played crucial roles in enhancing the visibility and appeal of Mango-flavored products. These innovations have allowed for a more authentic and enriched flavor experience, further solidifying Mango's dominance in the market.
Moreover, the Powdered Soft Drinks Market has witnessed a shift in consumer preferences, with a growing demand for natural and health-oriented products. Mango, being perceived as a more natural and healthier option, has benefited from this trend, thereby contributing to its leading market position. This shift underscores the importance of aligning product offerings with evolving consumer preferences to maintain and enhance market share.
By Packaging Analysis
Pouches are the most preferred packaging, dominating the market's landscape significantly.
In 2023, Pouches secured a dominant market position in the By Packaging segment of the Powdered Soft Drinks Market, indicating a significant preference among manufacturers and consumers alike. This packaging option's ascendancy highlights its versatility and consumer-friendly attributes, which have been pivotal in driving its widespread acceptance and usage. Pouches, with their convenience of use, portability, and cost-effectiveness, have effectively outperformed other packaging formats such as Carton Boxes, Cans, and Sachets.
The dominance of pouches can be attributed to several key factors. Firstly, the environmental footprint of pouches, which are often more lightweight and require less material than traditional packaging forms, appeals to the growing consumer demand for sustainable packaging solutions. Secondly, the ease of customization and branding offered by pouches enables key companies to engage consumers more effectively, enhancing brand visibility and product differentiation in a competitive market landscape.
Moreover, the flexibility in size and shape that pouches offer caters to a broad spectrum of consumer needs, ranging from single servings to family-sized portions, thereby enhancing consumer convenience and appeal. This adaptability has been instrumental in addressing the varied consumption patterns and preferences observed across different demographics and geographies.
By Distribution Channel Analysis
Store-based retailing remains the top distribution channel, widely favored by consumers.
In 2023, Store-Based Retailing maintained a dominant position in the By Distribution Channel segment of the Powdered Soft Drinks Market, underscoring the enduring relevance and consumer preference for physical retail outlets in the purchasing journey. This traditional distribution channel encompasses supermarkets, hypermarkets, convenience stores, and specialty stores, offering consumers a tangible shopping experience that online retail has yet to fully replicate.
The preference for store-based retailing can be attributed to several technological factors, including immediate product accessibility, the ability to physically assess product quality and packaging, and the enjoyment of the shopping experience as a social activity.
Despite the exponential steady growth of e-commerce and Online Retail platforms, which offer convenience and a wide range of products accessible from anywhere, Store-Based Retail has retained its appeal. This can be partly attributed to consumer habits and the tangible nature of shopping for food and beverages, where sensory experiences such as sight and taste play a crucial role in the purchasing decision. Moreover, the immediate availability of products in physical stores eliminates the waiting time associated with online orders, catering to the immediate needs and impulse purchases of consumers.
Furthermore, the strategic placement of powdered soft drinks in store aisles, along with in-store promotions and the opportunity for consumers to engage with product demonstrations or tastings, significantly influences purchasing decisions. As a result, Store-Based Retailing continues to be a critical channel for the Powdered Soft Drinks Market.
Key Market Segments
By Flavor
- Mango
- Orange
- Cola
- Lemon
- Apple
- Mixed Fruit
- Others
By Packaging
- Pouches
- Carton Boxes
- Cans
- Sachets
By Distribution Channel
- Store-Based Retailing
- Online Retail
Growth Opportunity
Expanding Health-Conscious Consumer Base: A Gateway to Innovation in the Powdered Soft Drinks Market
In 2023, the global Powdered Soft Drinks Market is positioned to capitalize on the expanding health-conscious consumer base. This demographic shift presents a notable steady growth opportunity for market major players. Consumers increasingly seek beverages that not only offer convenience and taste but also align with their health and wellness goals. This current trend has led to a surge in demand for powdered soft drinks formulated with natural sweeteners, reduced sugar content, and enriched with vitamins, minerals, and probiotics.
The industry can further tap into this opportunity by innovating and diversifying product portfolios to include organic, vegan, and gluten-free options. Such differentiation addresses the growing consumer demand for products that support a healthy lifestyle without compromising on convenience or flavor. Moreover, leveraging advancements in food technology to enhance the nutritional profile and shelf-life of these health-oriented offerings can significantly attract a broader consumer base. Market major players that can effectively communicate these health benefits and cater to the specific preferences of health-conscious consumers are likely to see enhanced brand loyalty and market share.
Leveraging E-commerce and Digital Marketing: Accelerating Market Penetration and Consumer Engagement
Another pivotal growth opportunity for the Powdered Soft Drinks Market in 2023 lies in leveraging e-commerce platforms and digital marketing strategies. The digital landscape offers an unparalleled avenue for market players to expand their reach, particularly among younger demographics who prefer online shopping. Establishing a strong online presence not only facilitates wider market penetration but also provides valuable data on consumer preferences and behavior.
Implementing targeted digital marketing campaigns can significantly enhance brand visibility and consumer engagement. By utilizing social media, influencer partnerships, and online advertising, brands can effectively communicate the convenience, variety, and health benefits of their powdered soft drink offerings. Furthermore, e-commerce platforms provide an opportunity for personalized shopping experiences, offering recommendations based on consumer preferences and previous purchases, thereby enhancing consumer satisfaction and loyalty.
Latest Trends
Increasing Demand for Healthy and Organic Options
The global powdered soft drinks market has witnessed a notable shift towards health-conscious consumption, driven by an increasing consumer preference for organic and natural ingredients. This trend reflects a broader societal awareness of health and wellness, prompting manufacturers to innovate and introduce products that cater to these preferences.
The incorporation of organic, non-GMO ingredients, alongside formulations that offer reduced sugar content or alternative sweeteners, is gaining traction. This adaptation can be attributed to the growing scrutiny over the nutritional content of beverages, coupled with a heightened demand for products that support a healthy lifestyle. The market's response indicates a strategic pivot towards offerings that not only satisfy thirst but also contribute to an overall healthier diet.
Customization and Flavor Innovation
Customization and flavor innovation have emerged as significant current trends, reshaping the global powdered soft drinks market landscape. Consumers are increasingly seeking personalized beverage experiences that cater to their unique tastes and dietary preferences. This desire for customization is driving the development of a wide range of flavors, from traditional fruit varieties to exotic and gourmet options, thus expanding the market's appeal.
Additionally, manufacturers are leveraging technology to offer customizable powder mixes, allowing consumers to control sweetness levels and flavor intensity. This trend is indicative of a shift towards more interactive and personalized consumption experiences, reflecting the market's adaptability in meeting evolving consumer demands. The introduction of diverse flavors and customization options can be seen as a strategic move to enhance consumer engagement and broaden market reach.
Regional Analysis
In North America, the Powdered Soft Drinks Market holds a substantial 34.8% market share.
The Powdered Soft Drinks Market exhibits a diverse and dynamic landscape across various regions, with each presenting unique economic growth opportunities and challenges. In North America, the market is characterized by a robust demand, driven by consumer preferences for convenience and innovative flavors, commanding a dominant share of 34.8%.
This region benefits from a well-established food and beverage industry, with the United States leading in consumption and innovation. Europe follows, where health-conscious consumers are increasingly gravitating towards sugar-free and low-calorie options, fueling market expansion. The presence of stringent regulations regarding food additives acts as both a barrier and a driver for cleaner labels and healthier alternatives.
The Asia Pacific region is identified as a rapidly growing segment, thanks to rising disposable incomes, urbanization, and a burgeoning middle class. Cultural preferences for flavored drinks and the increasing penetration of Western dietary habits contribute to its market growth. In contrast, the Middle East & Africa region, though smaller in comparison, is witnessing a surge in demand, attributed to its young population and growing urban centers. Here, the market is expanding through both domestic consumption and export opportunities.
Latin America, with its rich agricultural heritage, is emerging as a key player in the natural and organic segment, driven by local preferences and the availability of natural resources. Across these regions, North America stands out for its significant market share, while the Asia Pacific region is noted for its rapid growth rate, signaling shifting dynamics in the global powdered soft drinks industry. These insights underscore the importance of region-specific strategies for stakeholders looking to capitalize on the varying consumer preferences and regulatory landscapes.
Key Regions and Countries
North America
- The US
- Canada
- Rest of North America
Europe
- Germany
- France
- The UK
- Spain
- Netherlands
- Russia
- Italy
- Rest of Europe
Asia-Pacific
- China
- Japan
- Singapore
- Thailand
- South Korea
- Vietnam
- India
- New Zealand
- Rest of Asia Pacific
Latin America
- Mexico
- Brazil
- Rest of Latin America
Middle East & Africa
- Saudi Arabia
- South Africa
- UAE
- Rest of Middle East & Africa
Key Players Analysis
In 2023, the global powdered soft drinks market has been characterized by the innovative strategies and diversified product portfolios of key players such as Cargill Incorporated, Insta Foods, Firmenich, Tate & Lyle, Bemis Company, Sugam Products, Coperion, Kraft Foods, Gatorade, and SMC Enterprise. These companies have played pivotal roles in shaping market dynamics through their commitment to innovation, sustainability, and consumer-centric product development.
Cargill Incorporated and Tate & Lyle have been at the forefront of addressing consumer demands for healthier and more sustainable options. Their investment in research and development has led to the introduction of powdered soft drinks with reduced sugar content and the use of alternative, natural sweeteners. This aligns with the growing consumer preference for health-conscious products without compromising taste.
Instant Foods and Sugam Products have distinguished themselves through their focus on flavor innovation and customization, catering to the global palate with a wide range of traditional and exotic flavors. This approach has not only enhanced consumer experience but also expanded market reach.
Firmenich and Gatorade have leveraged advanced technology to offer consumers personalized beverage solutions, allowing for adjustments in flavor intensity and nutritional content, thus appealing to a broader audience seeking tailored beverage options.
Bemis Company and Coperion have contributed to the market through advancements in packaging and processing technology, respectively, ensuring product integrity and extending shelf life, which is crucial for the global distribution of powdered soft drinks.
Kraft Foods and SMC Enterprise have capitalized on strong branding and extensive distribution networks to solidify their market presence, offering consumers convenient and accessible beverage options.
Market Key Players
- Cargill Incorporated
- Insta Foods
- Firmenich
- Tate & Lyle
- Bemis Company
- Sugam Products
- Coperion
- Kraft Foods
- Gatorade
- SMC Enterprise.
Recent Development
- In January 2024, BodyArmor, owned by The Coca-Cola Company, recently launched BodyArmor Zero Sugar, a zero-sugar sports drink with no artificial sweeteners, flavors, or dyes, and a comprehensive blend of electrolytes and vitamins.
- In September 2023, At Expo East 2023, Bain highlighted market trends in consumer product innovation, emphasizing plant-based proteins, sugar replacements, bold flavors, food as medicine, and sustainability, guiding strategic and investment decisions in the sector.
- In September 2023, DSM-Firmenich crowned Peach+ as the Flavour of the Year for 2024, inspired by Pantone's Colour of the Year. It highlights the fruit's versatility across food and beverage innovations.
Report Scope
Report Features Description Market Value (2023) USD 13.6 Billion Forecast Revenue (2033) USD 19.4 Billion CAGR (2024-2032) 3.7% Base Year for Estimation 2023 Historic Period 2016-2023 Forecast Period 2024-2033 Report Coverage Revenue Forecast, Market Dynamics, COVID-19 Impact, Competitive Landscape, Recent Developments Segments Covered By Flavor(Mango, Orange, Cola, Lemon, Apple, Mixed Fruit, Others), By Packaging(Pouches, Carton Boxes, Cans, Sachets), By Distribution Channel(Store-Based Retailing, Online Retail) Regional Analysis North America - The US, Canada, Rest of North America, Europe - Germany, France, The UK, Spain, Italy, Russia, Netherlands, Rest of Europe, Asia-Pacific - China, Japan, South Korea, India, New Zealand, Singapore, Thailand, Vietnam, Rest of Asia Pacific, Latin America - Brazil, Mexico, Rest of Latin America, Middle East & Africa - South Africa, Saudi Arabia, UAE, Rest of Middle East & Africa Competitive Landscape Cargill Incorporated, Insta Foods, Firmenich, Tate & Lyle, Bemis Company, Sugam Products, Coperion, Kraft Foods, Gatorade, SMC Enterprise. Customization Scope Customization for segments, region/country-level will be provided. Moreover, additional customization can be done based on the requirements. Purchase Options We have three licenses to opt for Single User License, Multi-User License (Up to 5 Users), Corporate Use License (Unlimited User and Printable PDF) -
- 1. Executive Summary
- 1.1. Definition
- 1.2. Taxonomy
- 1.3. Research Scope
- 1.4. Key Analysis
- 1.5. Key Findings by Major Segments
- 1.6. Top strategies by Major Players
- 2. Global Powdered Soft Drinks Market Overview
- 2.1. Powdered Soft Drinks Market Dynamics
- 2.1.1. Drivers
- 2.1.2. Opportunities
- 2.1.3. Restraints
- 2.1.4. Challenges
- 2.2. Macro-economic Factors
- 2.3. Regulatory Framework
- 2.4. Market Investment Feasibility Index
- 2.5. PEST Analysis
- 2.6. PORTER’S Five Force Analysis
- 2.7. Drivers & Restraints Impact Analysis
- 2.8. Industry Chain Analysis
- 2.9. Cost Structure Analysis
- 2.10. Marketing Strategy
- 2.11. Russia-Ukraine War Impact Analysis
- 2.12. Opportunity Map Analysis
- 2.13. Market Competition Scenario Analysis
- 2.14. Product Life Cycle Analysis
- 2.15. Opportunity Orbits
- 2.16. Manufacturer Intensity Map
- 2.17. Major Companies sales by Value & Volume
- 2.1. Powdered Soft Drinks Market Dynamics
- 3. Global Powdered Soft Drinks Market Analysis, Opportunity and Forecast, 2016-2032
- 3.1. Global Powdered Soft Drinks Market Analysis, 2016-2021
- 3.2. Global Powdered Soft Drinks Market Opportunity and Forecast, 2023-2032
- 3.3. Global Powdered Soft Drinks Market Analysis, Opportunity and Forecast, By By Flavor , 2016-2032
- 3.3.1. Global Powdered Soft Drinks Market Analysis by By Flavor : Introduction
- 3.3.2. Market Size Absolute $ Opportunity Analysis and Forecast, By By Flavor , 2016-2032
- 3.3.3. Mango
- 3.3.4. Orange
- 3.3.5. Cola
- 3.3.6. Lemon
- 3.3.7. Apple
- 3.3.8. Mixed Fruit
- 3.3.9. Others
- 3.4. Global Powdered Soft Drinks Market Analysis, Opportunity and Forecast, By By Packaging , 2016-2032
- 3.4.1. Global Powdered Soft Drinks Market Analysis by By Packaging : Introduction
- 3.4.2. Market Size Absolute $ Opportunity Analysis and Forecast, By By Packaging , 2016-2032
- 3.4.3. Pouches
- 3.4.4. Carton Boxes
- 3.4.5. Cans
- 3.4.6. Sachets
- 3.5. Global Powdered Soft Drinks Market Analysis, Opportunity and Forecast, By By Distribution Channel , 2016-2032
- 3.5.1. Global Powdered Soft Drinks Market Analysis by By Distribution Channel : Introduction
- 3.5.2. Market Size Absolute $ Opportunity Analysis and Forecast, By By Distribution Channel , 2016-2032
- 3.5.3. Store-Based Retailing
- 3.5.4. Online Retail
- 4. North America Powdered Soft Drinks Market Analysis, Opportunity and Forecast, 2016-2032
- 4.1. North America Powdered Soft Drinks Market Analysis, 2016-2021
- 4.2. North America Powdered Soft Drinks Market Opportunity and Forecast, 2023-2032
- 4.3. North America Powdered Soft Drinks Market Analysis, Opportunity and Forecast, By By Flavor , 2016-2032
- 4.3.1. North America Powdered Soft Drinks Market Analysis by By Flavor : Introduction
- 4.3.2. Market Size Absolute $ Opportunity Analysis and Forecast, By By Flavor , 2016-2032
- 4.3.3. Mango
- 4.3.4. Orange
- 4.3.5. Cola
- 4.3.6. Lemon
- 4.3.7. Apple
- 4.3.8. Mixed Fruit
- 4.3.9. Others
- 4.4. North America Powdered Soft Drinks Market Analysis, Opportunity and Forecast, By By Packaging , 2016-2032
- 4.4.1. North America Powdered Soft Drinks Market Analysis by By Packaging : Introduction
- 4.4.2. Market Size Absolute $ Opportunity Analysis and Forecast, By By Packaging , 2016-2032
- 4.4.3. Pouches
- 4.4.4. Carton Boxes
- 4.4.5. Cans
- 4.4.6. Sachets
- 4.5. North America Powdered Soft Drinks Market Analysis, Opportunity and Forecast, By By Distribution Channel , 2016-2032
- 4.5.1. North America Powdered Soft Drinks Market Analysis by By Distribution Channel : Introduction
- 4.5.2. Market Size Absolute $ Opportunity Analysis and Forecast, By By Distribution Channel , 2016-2032
- 4.5.3. Store-Based Retailing
- 4.5.4. Online Retail
- 4.6. North America Powdered Soft Drinks Market Analysis, Opportunity and Forecast, By Country , 2016-2032
- 4.6.1. North America Powdered Soft Drinks Market Analysis by Country : Introduction
- 4.6.2. Market Size Absolute $ Opportunity Analysis and Forecast, Country , 2016-2032
- 4.6.2.1. The US
- 4.6.2.2. Canada
- 4.6.2.3. Mexico
- 5. Western Europe Powdered Soft Drinks Market Analysis, Opportunity and Forecast, 2016-2032
- 5.1. Western Europe Powdered Soft Drinks Market Analysis, 2016-2021
- 5.2. Western Europe Powdered Soft Drinks Market Opportunity and Forecast, 2023-2032
- 5.3. Western Europe Powdered Soft Drinks Market Analysis, Opportunity and Forecast, By By Flavor , 2016-2032
- 5.3.1. Western Europe Powdered Soft Drinks Market Analysis by By Flavor : Introduction
- 5.3.2. Market Size Absolute $ Opportunity Analysis and Forecast, By By Flavor , 2016-2032
- 5.3.3. Mango
- 5.3.4. Orange
- 5.3.5. Cola
- 5.3.6. Lemon
- 5.3.7. Apple
- 5.3.8. Mixed Fruit
- 5.3.9. Others
- 5.4. Western Europe Powdered Soft Drinks Market Analysis, Opportunity and Forecast, By By Packaging , 2016-2032
- 5.4.1. Western Europe Powdered Soft Drinks Market Analysis by By Packaging : Introduction
- 5.4.2. Market Size Absolute $ Opportunity Analysis and Forecast, By By Packaging , 2016-2032
- 5.4.3. Pouches
- 5.4.4. Carton Boxes
- 5.4.5. Cans
- 5.4.6. Sachets
- 5.5. Western Europe Powdered Soft Drinks Market Analysis, Opportunity and Forecast, By By Distribution Channel , 2016-2032
- 5.5.1. Western Europe Powdered Soft Drinks Market Analysis by By Distribution Channel : Introduction
- 5.5.2. Market Size Absolute $ Opportunity Analysis and Forecast, By By Distribution Channel , 2016-2032
- 5.5.3. Store-Based Retailing
- 5.5.4. Online Retail
- 5.6. Western Europe Powdered Soft Drinks Market Analysis, Opportunity and Forecast, By Country , 2016-2032
- 5.6.1. Western Europe Powdered Soft Drinks Market Analysis by Country : Introduction
- 5.6.2. Market Size Absolute $ Opportunity Analysis and Forecast, Country , 2016-2032
- 5.6.2.1. Germany
- 5.6.2.2. France
- 5.6.2.3. The UK
- 5.6.2.4. Spain
- 5.6.2.5. Italy
- 5.6.2.6. Portugal
- 5.6.2.7. Ireland
- 5.6.2.8. Austria
- 5.6.2.9. Switzerland
- 5.6.2.10. Benelux
- 5.6.2.11. Nordic
- 5.6.2.12. Rest of Western Europe
- 6. Eastern Europe Powdered Soft Drinks Market Analysis, Opportunity and Forecast, 2016-2032
- 6.1. Eastern Europe Powdered Soft Drinks Market Analysis, 2016-2021
- 6.2. Eastern Europe Powdered Soft Drinks Market Opportunity and Forecast, 2023-2032
- 6.3. Eastern Europe Powdered Soft Drinks Market Analysis, Opportunity and Forecast, By By Flavor , 2016-2032
- 6.3.1. Eastern Europe Powdered Soft Drinks Market Analysis by By Flavor : Introduction
- 6.3.2. Market Size Absolute $ Opportunity Analysis and Forecast, By By Flavor , 2016-2032
- 6.3.3. Mango
- 6.3.4. Orange
- 6.3.5. Cola
- 6.3.6. Lemon
- 6.3.7. Apple
- 6.3.8. Mixed Fruit
- 6.3.9. Others
- 6.4. Eastern Europe Powdered Soft Drinks Market Analysis, Opportunity and Forecast, By By Packaging , 2016-2032
- 6.4.1. Eastern Europe Powdered Soft Drinks Market Analysis by By Packaging : Introduction
- 6.4.2. Market Size Absolute $ Opportunity Analysis and Forecast, By By Packaging , 2016-2032
- 6.4.3. Pouches
- 6.4.4. Carton Boxes
- 6.4.5. Cans
- 6.4.6. Sachets
- 6.5. Eastern Europe Powdered Soft Drinks Market Analysis, Opportunity and Forecast, By By Distribution Channel , 2016-2032
- 6.5.1. Eastern Europe Powdered Soft Drinks Market Analysis by By Distribution Channel : Introduction
- 6.5.2. Market Size Absolute $ Opportunity Analysis and Forecast, By By Distribution Channel , 2016-2032
- 6.5.3. Store-Based Retailing
- 6.5.4. Online Retail
- 6.6. Eastern Europe Powdered Soft Drinks Market Analysis, Opportunity and Forecast, By Country , 2016-2032
- 6.6.1. Eastern Europe Powdered Soft Drinks Market Analysis by Country : Introduction
- 6.6.2. Market Size Absolute $ Opportunity Analysis and Forecast, Country , 2016-2032
- 6.6.2.1. Russia
- 6.6.2.2. Poland
- 6.6.2.3. The Czech Republic
- 6.6.2.4. Greece
- 6.6.2.5. Rest of Eastern Europe
- 7. APAC Powdered Soft Drinks Market Analysis, Opportunity and Forecast, 2016-2032
- 7.1. APAC Powdered Soft Drinks Market Analysis, 2016-2021
- 7.2. APAC Powdered Soft Drinks Market Opportunity and Forecast, 2023-2032
- 7.3. APAC Powdered Soft Drinks Market Analysis, Opportunity and Forecast, By By Flavor , 2016-2032
- 7.3.1. APAC Powdered Soft Drinks Market Analysis by By Flavor : Introduction
- 7.3.2. Market Size Absolute $ Opportunity Analysis and Forecast, By By Flavor , 2016-2032
- 7.3.3. Mango
- 7.3.4. Orange
- 7.3.5. Cola
- 7.3.6. Lemon
- 7.3.7. Apple
- 7.3.8. Mixed Fruit
- 7.3.9. Others
- 7.4. APAC Powdered Soft Drinks Market Analysis, Opportunity and Forecast, By By Packaging , 2016-2032
- 7.4.1. APAC Powdered Soft Drinks Market Analysis by By Packaging : Introduction
- 7.4.2. Market Size Absolute $ Opportunity Analysis and Forecast, By By Packaging , 2016-2032
- 7.4.3. Pouches
- 7.4.4. Carton Boxes
- 7.4.5. Cans
- 7.4.6. Sachets
- 7.5. APAC Powdered Soft Drinks Market Analysis, Opportunity and Forecast, By By Distribution Channel , 2016-2032
- 7.5.1. APAC Powdered Soft Drinks Market Analysis by By Distribution Channel : Introduction
- 7.5.2. Market Size Absolute $ Opportunity Analysis and Forecast, By By Distribution Channel , 2016-2032
- 7.5.3. Store-Based Retailing
- 7.5.4. Online Retail
- 7.6. APAC Powdered Soft Drinks Market Analysis, Opportunity and Forecast, By Country , 2016-2032
- 7.6.1. APAC Powdered Soft Drinks Market Analysis by Country : Introduction
- 7.6.2. Market Size Absolute $ Opportunity Analysis and Forecast, Country , 2016-2032
- 7.6.2.1. China
- 7.6.2.2. Japan
- 7.6.2.3. South Korea
- 7.6.2.4. India
- 7.6.2.5. Australia & New Zeland
- 7.6.2.6. Indonesia
- 7.6.2.7. Malaysia
- 7.6.2.8. Philippines
- 7.6.2.9. Singapore
- 7.6.2.10. Thailand
- 7.6.2.11. Vietnam
- 7.6.2.12. Rest of APAC
- 8. Latin America Powdered Soft Drinks Market Analysis, Opportunity and Forecast, 2016-2032
- 8.1. Latin America Powdered Soft Drinks Market Analysis, 2016-2021
- 8.2. Latin America Powdered Soft Drinks Market Opportunity and Forecast, 2023-2032
- 8.3. Latin America Powdered Soft Drinks Market Analysis, Opportunity and Forecast, By By Flavor , 2016-2032
- 8.3.1. Latin America Powdered Soft Drinks Market Analysis by By Flavor : Introduction
- 8.3.2. Market Size Absolute $ Opportunity Analysis and Forecast, By By Flavor , 2016-2032
- 8.3.3. Mango
- 8.3.4. Orange
- 8.3.5. Cola
- 8.3.6. Lemon
- 8.3.7. Apple
- 8.3.8. Mixed Fruit
- 8.3.9. Others
- 8.4. Latin America Powdered Soft Drinks Market Analysis, Opportunity and Forecast, By By Packaging , 2016-2032
- 8.4.1. Latin America Powdered Soft Drinks Market Analysis by By Packaging : Introduction
- 8.4.2. Market Size Absolute $ Opportunity Analysis and Forecast, By By Packaging , 2016-2032
- 8.4.3. Pouches
- 8.4.4. Carton Boxes
- 8.4.5. Cans
- 8.4.6. Sachets
- 8.5. Latin America Powdered Soft Drinks Market Analysis, Opportunity and Forecast, By By Distribution Channel , 2016-2032
- 8.5.1. Latin America Powdered Soft Drinks Market Analysis by By Distribution Channel : Introduction
- 8.5.2. Market Size Absolute $ Opportunity Analysis and Forecast, By By Distribution Channel , 2016-2032
- 8.5.3. Store-Based Retailing
- 8.5.4. Online Retail
- 8.6. Latin America Powdered Soft Drinks Market Analysis, Opportunity and Forecast, By Country , 2016-2032
- 8.6.1. Latin America Powdered Soft Drinks Market Analysis by Country : Introduction
- 8.6.2. Market Size Absolute $ Opportunity Analysis and Forecast, Country , 2016-2032
- 8.6.2.1. Brazil
- 8.6.2.2. Colombia
- 8.6.2.3. Chile
- 8.6.2.4. Argentina
- 8.6.2.5. Costa Rica
- 8.6.2.6. Rest of Latin America
- 9. Middle East & Africa Powdered Soft Drinks Market Analysis, Opportunity and Forecast, 2016-2032
- 9.1. Middle East & Africa Powdered Soft Drinks Market Analysis, 2016-2021
- 9.2. Middle East & Africa Powdered Soft Drinks Market Opportunity and Forecast, 2023-2032
- 9.3. Middle East & Africa Powdered Soft Drinks Market Analysis, Opportunity and Forecast, By By Flavor , 2016-2032
- 9.3.1. Middle East & Africa Powdered Soft Drinks Market Analysis by By Flavor : Introduction
- 9.3.2. Market Size Absolute $ Opportunity Analysis and Forecast, By By Flavor , 2016-2032
- 9.3.3. Mango
- 9.3.4. Orange
- 9.3.5. Cola
- 9.3.6. Lemon
- 9.3.7. Apple
- 9.3.8. Mixed Fruit
- 9.3.9. Others
- 9.4. Middle East & Africa Powdered Soft Drinks Market Analysis, Opportunity and Forecast, By By Packaging , 2016-2032
- 9.4.1. Middle East & Africa Powdered Soft Drinks Market Analysis by By Packaging : Introduction
- 9.4.2. Market Size Absolute $ Opportunity Analysis and Forecast, By By Packaging , 2016-2032
- 9.4.3. Pouches
- 9.4.4. Carton Boxes
- 9.4.5. Cans
- 9.4.6. Sachets
- 9.5. Middle East & Africa Powdered Soft Drinks Market Analysis, Opportunity and Forecast, By By Distribution Channel , 2016-2032
- 9.5.1. Middle East & Africa Powdered Soft Drinks Market Analysis by By Distribution Channel : Introduction
- 9.5.2. Market Size Absolute $ Opportunity Analysis and Forecast, By By Distribution Channel , 2016-2032
- 9.5.3. Store-Based Retailing
- 9.5.4. Online Retail
- 9.6. Middle East & Africa Powdered Soft Drinks Market Analysis, Opportunity and Forecast, By Country , 2016-2032
- 9.6.1. Middle East & Africa Powdered Soft Drinks Market Analysis by Country : Introduction
- 9.6.2. Market Size Absolute $ Opportunity Analysis and Forecast, Country , 2016-2032
- 9.6.2.1. Algeria
- 9.6.2.2. Egypt
- 9.6.2.3. Israel
- 9.6.2.4. Kuwait
- 9.6.2.5. Nigeria
- 9.6.2.6. Saudi Arabia
- 9.6.2.7. South Africa
- 9.6.2.8. Turkey
- 9.6.2.9. The UAE
- 9.6.2.10. Rest of MEA
- 10. Global Powdered Soft Drinks Market Analysis, Opportunity and Forecast, By Region , 2016-2032
- 10.1. Global Powdered Soft Drinks Market Analysis by Region : Introduction
- 10.2. Market Size Absolute $ Opportunity Analysis and Forecast, By Region , 2016-2032
- 10.2.1. North America
- 10.2.2. Western Europe
- 10.2.3. Eastern Europe
- 10.2.4. APAC
- 10.2.5. Latin America
- 10.2.6. Middle East & Africa
- 11. Global Powdered Soft Drinks Market Competitive Landscape, Market Share Analysis, and Company Profiles
- 11.1. Market Share Analysis
- 11.2. Company Profiles
- 11.3. Cargill Incorporated
- 11.3.1. Company Overview
- 11.3.2. Financial Highlights
- 11.3.3. Product Portfolio
- 11.3.4. SWOT Analysis
- 11.3.5. Key Strategies and Developments
- 11.4. Insta Foods
- 11.4.1. Company Overview
- 11.4.2. Financial Highlights
- 11.4.3. Product Portfolio
- 11.4.4. SWOT Analysis
- 11.4.5. Key Strategies and Developments
- 11.5. Firmenich
- 11.5.1. Company Overview
- 11.5.2. Financial Highlights
- 11.5.3. Product Portfolio
- 11.5.4. SWOT Analysis
- 11.5.5. Key Strategies and Developments
- 11.6. Tate & Lyle
- 11.6.1. Company Overview
- 11.6.2. Financial Highlights
- 11.6.3. Product Portfolio
- 11.6.4. SWOT Analysis
- 11.6.5. Key Strategies and Developments
- 11.7. Bemis Company
- 11.7.1. Company Overview
- 11.7.2. Financial Highlights
- 11.7.3. Product Portfolio
- 11.7.4. SWOT Analysis
- 11.7.5. Key Strategies and Developments
- 11.8. Sugam Products
- 11.8.1. Company Overview
- 11.8.2. Financial Highlights
- 11.8.3. Product Portfolio
- 11.8.4. SWOT Analysis
- 11.8.5. Key Strategies and Developments
- 11.9. Coperion
- 11.9.1. Company Overview
- 11.9.2. Financial Highlights
- 11.9.3. Product Portfolio
- 11.9.4. SWOT Analysis
- 11.9.5. Key Strategies and Developments
- 11.10. Kraft Foods
- 11.10.1. Company Overview
- 11.10.2. Financial Highlights
- 11.10.3. Product Portfolio
- 11.10.4. SWOT Analysis
- 11.10.5. Key Strategies and Developments
- 11.11. Gatorade
- 11.11.1. Company Overview
- 11.11.2. Financial Highlights
- 11.11.3. Product Portfolio
- 11.11.4. SWOT Analysis
- 11.11.5. Key Strategies and Developments
- 11.12. SMC Enterprise.
- 11.12.1. Company Overview
- 11.12.2. Financial Highlights
- 11.12.3. Product Portfolio
- 11.12.4. SWOT Analysis
- 11.12.5. Key Strategies and Developments
- 11.13.1. Company Overview
- 11.13.2. Financial Highlights
- 11.13.3. Product Portfolio
- 11.13.4. SWOT Analysis
- 11.13.5. Key Strategies and Developments
- 12. Assumptions and Acronyms
- 13. Research Methodology
- 14. Contact
"
- List of Figures
- "
- Figure 1: Global Powdered Soft Drinks Market Revenue (US$ Mn) Market Share by By Flavor in 2022
- Figure 2: Global Powdered Soft Drinks Market Market Attractiveness Analysis by By Flavor , 2016-2032
- Figure 3: Global Powdered Soft Drinks Market Revenue (US$ Mn) Market Share by By Packaging in 2022
- Figure 4: Global Powdered Soft Drinks Market Market Attractiveness Analysis by By Packaging , 2016-2032
- Figure 5: Global Powdered Soft Drinks Market Revenue (US$ Mn) Market Share by By Distribution Channel in 2022
- Figure 6: Global Powdered Soft Drinks Market Market Attractiveness Analysis by By Distribution Channel , 2016-2032
- Figure 7: Global Powdered Soft Drinks Market Revenue (US$ Mn) Market Share by Region in 2022
- Figure 8: Global Powdered Soft Drinks Market Market Attractiveness Analysis by Region, 2016-2032
- Figure 9: Global Powdered Soft Drinks Market Market Revenue (US$ Mn) (2016-2032)
- Figure 10: Global Powdered Soft Drinks Market Market Revenue (US$ Mn) Comparison by Region (2016-2032)
- Figure 11: Global Powdered Soft Drinks Market Market Revenue (US$ Mn) Comparison by By Flavor (2016-2032)
- Figure 12: Global Powdered Soft Drinks Market Market Revenue (US$ Mn) Comparison by By Packaging (2016-2032)
- Figure 13: Global Powdered Soft Drinks Market Market Revenue (US$ Mn) Comparison by By Distribution Channel (2016-2032)
- Figure 14: Global Powdered Soft Drinks Market Market Y-o-Y Growth Rate Comparison by Region (2016-2032)
- Figure 15: Global Powdered Soft Drinks Market Market Y-o-Y Growth Rate Comparison by By Flavor (2016-2032)
- Figure 16: Global Powdered Soft Drinks Market Market Y-o-Y Growth Rate Comparison by By Packaging (2016-2032)
- Figure 17: Global Powdered Soft Drinks Market Market Y-o-Y Growth Rate Comparison by By Distribution Channel (2016-2032)
- Figure 18: Global Powdered Soft Drinks Market Market Share Comparison by Region (2016-2032)
- Figure 19: Global Powdered Soft Drinks Market Market Share Comparison by By Flavor (2016-2032)
- Figure 20: Global Powdered Soft Drinks Market Market Share Comparison by By Packaging (2016-2032)
- Figure 21: Global Powdered Soft Drinks Market Market Share Comparison by By Distribution Channel (2016-2032)
- Figure 22: North America Powdered Soft Drinks Market Revenue (US$ Mn) Market Share by By Flavor in 2022
- Figure 23: North America Powdered Soft Drinks Market Market Attractiveness Analysis by By Flavor , 2016-2032
- Figure 24: North America Powdered Soft Drinks Market Revenue (US$ Mn) Market Share by By Packaging in 2022
- Figure 25: North America Powdered Soft Drinks Market Market Attractiveness Analysis by By Packaging , 2016-2032
- Figure 26: North America Powdered Soft Drinks Market Revenue (US$ Mn) Market Share by By Distribution Channel in 2022
- Figure 27: North America Powdered Soft Drinks Market Market Attractiveness Analysis by By Distribution Channel , 2016-2032
- Figure 28: North America Powdered Soft Drinks Market Revenue (US$ Mn) Market Share by Country in 2022
- Figure 29: North America Powdered Soft Drinks Market Market Attractiveness Analysis by Country, 2016-2032
- Figure 30: North America Powdered Soft Drinks Market Market Revenue (US$ Mn) (2016-2032)
- Figure 31: North America Powdered Soft Drinks Market Market Revenue (US$ Mn) Comparison by Country (2016-2032)
- Figure 32: North America Powdered Soft Drinks Market Market Revenue (US$ Mn) Comparison by By Flavor (2016-2032)
- Figure 33: North America Powdered Soft Drinks Market Market Revenue (US$ Mn) Comparison by By Packaging (2016-2032)
- Figure 34: North America Powdered Soft Drinks Market Market Revenue (US$ Mn) Comparison by By Distribution Channel (2016-2032)
- Figure 35: North America Powdered Soft Drinks Market Market Y-o-Y Growth Rate Comparison by Country (2016-2032)
- Figure 36: North America Powdered Soft Drinks Market Market Y-o-Y Growth Rate Comparison by By Flavor (2016-2032)
- Figure 37: North America Powdered Soft Drinks Market Market Y-o-Y Growth Rate Comparison by By Packaging (2016-2032)
- Figure 38: North America Powdered Soft Drinks Market Market Y-o-Y Growth Rate Comparison by By Distribution Channel (2016-2032)
- Figure 39: North America Powdered Soft Drinks Market Market Share Comparison by Country (2016-2032)
- Figure 40: North America Powdered Soft Drinks Market Market Share Comparison by By Flavor (2016-2032)
- Figure 41: North America Powdered Soft Drinks Market Market Share Comparison by By Packaging (2016-2032)
- Figure 42: North America Powdered Soft Drinks Market Market Share Comparison by By Distribution Channel (2016-2032)
- Figure 43: Western Europe Powdered Soft Drinks Market Revenue (US$ Mn) Market Share by By Flavor in 2022
- Figure 44: Western Europe Powdered Soft Drinks Market Market Attractiveness Analysis by By Flavor , 2016-2032
- Figure 45: Western Europe Powdered Soft Drinks Market Revenue (US$ Mn) Market Share by By Packaging in 2022
- Figure 46: Western Europe Powdered Soft Drinks Market Market Attractiveness Analysis by By Packaging , 2016-2032
- Figure 47: Western Europe Powdered Soft Drinks Market Revenue (US$ Mn) Market Share by By Distribution Channel in 2022
- Figure 48: Western Europe Powdered Soft Drinks Market Market Attractiveness Analysis by By Distribution Channel , 2016-2032
- Figure 49: Western Europe Powdered Soft Drinks Market Revenue (US$ Mn) Market Share by Country in 2022
- Figure 50: Western Europe Powdered Soft Drinks Market Market Attractiveness Analysis by Country, 2016-2032
- Figure 51: Western Europe Powdered Soft Drinks Market Market Revenue (US$ Mn) (2016-2032)
- Figure 52: Western Europe Powdered Soft Drinks Market Market Revenue (US$ Mn) Comparison by Country (2016-2032)
- Figure 53: Western Europe Powdered Soft Drinks Market Market Revenue (US$ Mn) Comparison by By Flavor (2016-2032)
- Figure 54: Western Europe Powdered Soft Drinks Market Market Revenue (US$ Mn) Comparison by By Packaging (2016-2032)
- Figure 55: Western Europe Powdered Soft Drinks Market Market Revenue (US$ Mn) Comparison by By Distribution Channel (2016-2032)
- Figure 56: Western Europe Powdered Soft Drinks Market Market Y-o-Y Growth Rate Comparison by Country (2016-2032)
- Figure 57: Western Europe Powdered Soft Drinks Market Market Y-o-Y Growth Rate Comparison by By Flavor (2016-2032)
- Figure 58: Western Europe Powdered Soft Drinks Market Market Y-o-Y Growth Rate Comparison by By Packaging (2016-2032)
- Figure 59: Western Europe Powdered Soft Drinks Market Market Y-o-Y Growth Rate Comparison by By Distribution Channel (2016-2032)
- Figure 60: Western Europe Powdered Soft Drinks Market Market Share Comparison by Country (2016-2032)
- Figure 61: Western Europe Powdered Soft Drinks Market Market Share Comparison by By Flavor (2016-2032)
- Figure 62: Western Europe Powdered Soft Drinks Market Market Share Comparison by By Packaging (2016-2032)
- Figure 63: Western Europe Powdered Soft Drinks Market Market Share Comparison by By Distribution Channel (2016-2032)
- Figure 64: Eastern Europe Powdered Soft Drinks Market Revenue (US$ Mn) Market Share by By Flavor in 2022
- Figure 65: Eastern Europe Powdered Soft Drinks Market Market Attractiveness Analysis by By Flavor , 2016-2032
- Figure 66: Eastern Europe Powdered Soft Drinks Market Revenue (US$ Mn) Market Share by By Packaging in 2022
- Figure 67: Eastern Europe Powdered Soft Drinks Market Market Attractiveness Analysis by By Packaging , 2016-2032
- Figure 68: Eastern Europe Powdered Soft Drinks Market Revenue (US$ Mn) Market Share by By Distribution Channel in 2022
- Figure 69: Eastern Europe Powdered Soft Drinks Market Market Attractiveness Analysis by By Distribution Channel , 2016-2032
- Figure 70: Eastern Europe Powdered Soft Drinks Market Revenue (US$ Mn) Market Share by Country in 2022
- Figure 71: Eastern Europe Powdered Soft Drinks Market Market Attractiveness Analysis by Country, 2016-2032
- Figure 72: Eastern Europe Powdered Soft Drinks Market Market Revenue (US$ Mn) (2016-2032)
- Figure 73: Eastern Europe Powdered Soft Drinks Market Market Revenue (US$ Mn) Comparison by Country (2016-2032)
- Figure 74: Eastern Europe Powdered Soft Drinks Market Market Revenue (US$ Mn) Comparison by By Flavor (2016-2032)
- Figure 75: Eastern Europe Powdered Soft Drinks Market Market Revenue (US$ Mn) Comparison by By Packaging (2016-2032)
- Figure 76: Eastern Europe Powdered Soft Drinks Market Market Revenue (US$ Mn) Comparison by By Distribution Channel (2016-2032)
- Figure 77: Eastern Europe Powdered Soft Drinks Market Market Y-o-Y Growth Rate Comparison by Country (2016-2032)
- Figure 78: Eastern Europe Powdered Soft Drinks Market Market Y-o-Y Growth Rate Comparison by By Flavor (2016-2032)
- Figure 79: Eastern Europe Powdered Soft Drinks Market Market Y-o-Y Growth Rate Comparison by By Packaging (2016-2032)
- Figure 80: Eastern Europe Powdered Soft Drinks Market Market Y-o-Y Growth Rate Comparison by By Distribution Channel (2016-2032)
- Figure 81: Eastern Europe Powdered Soft Drinks Market Market Share Comparison by Country (2016-2032)
- Figure 82: Eastern Europe Powdered Soft Drinks Market Market Share Comparison by By Flavor (2016-2032)
- Figure 83: Eastern Europe Powdered Soft Drinks Market Market Share Comparison by By Packaging (2016-2032)
- Figure 84: Eastern Europe Powdered Soft Drinks Market Market Share Comparison by By Distribution Channel (2016-2032)
- Figure 85: APAC Powdered Soft Drinks Market Revenue (US$ Mn) Market Share by By Flavor in 2022
- Figure 86: APAC Powdered Soft Drinks Market Market Attractiveness Analysis by By Flavor , 2016-2032
- Figure 87: APAC Powdered Soft Drinks Market Revenue (US$ Mn) Market Share by By Packaging in 2022
- Figure 88: APAC Powdered Soft Drinks Market Market Attractiveness Analysis by By Packaging , 2016-2032
- Figure 89: APAC Powdered Soft Drinks Market Revenue (US$ Mn) Market Share by By Distribution Channel in 2022
- Figure 90: APAC Powdered Soft Drinks Market Market Attractiveness Analysis by By Distribution Channel , 2016-2032
- Figure 91: APAC Powdered Soft Drinks Market Revenue (US$ Mn) Market Share by Country in 2022
- Figure 92: APAC Powdered Soft Drinks Market Market Attractiveness Analysis by Country, 2016-2032
- Figure 93: APAC Powdered Soft Drinks Market Market Revenue (US$ Mn) (2016-2032)
- Figure 94: APAC Powdered Soft Drinks Market Market Revenue (US$ Mn) Comparison by Country (2016-2032)
- Figure 95: APAC Powdered Soft Drinks Market Market Revenue (US$ Mn) Comparison by By Flavor (2016-2032)
- Figure 96: APAC Powdered Soft Drinks Market Market Revenue (US$ Mn) Comparison by By Packaging (2016-2032)
- Figure 97: APAC Powdered Soft Drinks Market Market Revenue (US$ Mn) Comparison by By Distribution Channel (2016-2032)
- Figure 98: APAC Powdered Soft Drinks Market Market Y-o-Y Growth Rate Comparison by Country (2016-2032)
- Figure 99: APAC Powdered Soft Drinks Market Market Y-o-Y Growth Rate Comparison by By Flavor (2016-2032)
- Figure 100: APAC Powdered Soft Drinks Market Market Y-o-Y Growth Rate Comparison by By Packaging (2016-2032)
- Figure 101: APAC Powdered Soft Drinks Market Market Y-o-Y Growth Rate Comparison by By Distribution Channel (2016-2032)
- Figure 102: APAC Powdered Soft Drinks Market Market Share Comparison by Country (2016-2032)
- Figure 103: APAC Powdered Soft Drinks Market Market Share Comparison by By Flavor (2016-2032)
- Figure 104: APAC Powdered Soft Drinks Market Market Share Comparison by By Packaging (2016-2032)
- Figure 105: APAC Powdered Soft Drinks Market Market Share Comparison by By Distribution Channel (2016-2032)
- Figure 106: Latin America Powdered Soft Drinks Market Revenue (US$ Mn) Market Share by By Flavor in 2022
- Figure 107: Latin America Powdered Soft Drinks Market Market Attractiveness Analysis by By Flavor , 2016-2032
- Figure 108: Latin America Powdered Soft Drinks Market Revenue (US$ Mn) Market Share by By Packaging in 2022
- Figure 109: Latin America Powdered Soft Drinks Market Market Attractiveness Analysis by By Packaging , 2016-2032
- Figure 110: Latin America Powdered Soft Drinks Market Revenue (US$ Mn) Market Share by By Distribution Channel in 2022
- Figure 111: Latin America Powdered Soft Drinks Market Market Attractiveness Analysis by By Distribution Channel , 2016-2032
- Figure 112: Latin America Powdered Soft Drinks Market Revenue (US$ Mn) Market Share by Country in 2022
- Figure 113: Latin America Powdered Soft Drinks Market Market Attractiveness Analysis by Country, 2016-2032
- Figure 114: Latin America Powdered Soft Drinks Market Market Revenue (US$ Mn) (2016-2032)
- Figure 115: Latin America Powdered Soft Drinks Market Market Revenue (US$ Mn) Comparison by Country (2016-2032)
- Figure 116: Latin America Powdered Soft Drinks Market Market Revenue (US$ Mn) Comparison by By Flavor (2016-2032)
- Figure 117: Latin America Powdered Soft Drinks Market Market Revenue (US$ Mn) Comparison by By Packaging (2016-2032)
- Figure 118: Latin America Powdered Soft Drinks Market Market Revenue (US$ Mn) Comparison by By Distribution Channel (2016-2032)
- Figure 119: Latin America Powdered Soft Drinks Market Market Y-o-Y Growth Rate Comparison by Country (2016-2032)
- Figure 120: Latin America Powdered Soft Drinks Market Market Y-o-Y Growth Rate Comparison by By Flavor (2016-2032)
- Figure 121: Latin America Powdered Soft Drinks Market Market Y-o-Y Growth Rate Comparison by By Packaging (2016-2032)
- Figure 122: Latin America Powdered Soft Drinks Market Market Y-o-Y Growth Rate Comparison by By Distribution Channel (2016-2032)
- Figure 123: Latin America Powdered Soft Drinks Market Market Share Comparison by Country (2016-2032)
- Figure 124: Latin America Powdered Soft Drinks Market Market Share Comparison by By Flavor (2016-2032)
- Figure 125: Latin America Powdered Soft Drinks Market Market Share Comparison by By Packaging (2016-2032)
- Figure 126: Latin America Powdered Soft Drinks Market Market Share Comparison by By Distribution Channel (2016-2032)
- Figure 127: Middle East & Africa Powdered Soft Drinks Market Revenue (US$ Mn) Market Share by By Flavor in 2022
- Figure 128: Middle East & Africa Powdered Soft Drinks Market Market Attractiveness Analysis by By Flavor , 2016-2032
- Figure 129: Middle East & Africa Powdered Soft Drinks Market Revenue (US$ Mn) Market Share by By Packaging in 2022
- Figure 130: Middle East & Africa Powdered Soft Drinks Market Market Attractiveness Analysis by By Packaging , 2016-2032
- Figure 131: Middle East & Africa Powdered Soft Drinks Market Revenue (US$ Mn) Market Share by By Distribution Channel in 2022
- Figure 132: Middle East & Africa Powdered Soft Drinks Market Market Attractiveness Analysis by By Distribution Channel , 2016-2032
- Figure 133: Middle East & Africa Powdered Soft Drinks Market Revenue (US$ Mn) Market Share by Country in 2022
- Figure 134: Middle East & Africa Powdered Soft Drinks Market Market Attractiveness Analysis by Country, 2016-2032
- Figure 135: Middle East & Africa Powdered Soft Drinks Market Market Revenue (US$ Mn) (2016-2032)
- Figure 136: Middle East & Africa Powdered Soft Drinks Market Market Revenue (US$ Mn) Comparison by Country (2016-2032)
- Figure 137: Middle East & Africa Powdered Soft Drinks Market Market Revenue (US$ Mn) Comparison by By Flavor (2016-2032)
- Figure 138: Middle East & Africa Powdered Soft Drinks Market Market Revenue (US$ Mn) Comparison by By Packaging (2016-2032)
- Figure 139: Middle East & Africa Powdered Soft Drinks Market Market Revenue (US$ Mn) Comparison by By Distribution Channel (2016-2032)
- Figure 140: Middle East & Africa Powdered Soft Drinks Market Market Y-o-Y Growth Rate Comparison by Country (2016-2032)
- Figure 141: Middle East & Africa Powdered Soft Drinks Market Market Y-o-Y Growth Rate Comparison by By Flavor (2016-2032)
- Figure 142: Middle East & Africa Powdered Soft Drinks Market Market Y-o-Y Growth Rate Comparison by By Packaging (2016-2032)
- Figure 143: Middle East & Africa Powdered Soft Drinks Market Market Y-o-Y Growth Rate Comparison by By Distribution Channel (2016-2032)
- Figure 144: Middle East & Africa Powdered Soft Drinks Market Market Share Comparison by Country (2016-2032)
- Figure 145: Middle East & Africa Powdered Soft Drinks Market Market Share Comparison by By Flavor (2016-2032)
- Figure 146: Middle East & Africa Powdered Soft Drinks Market Market Share Comparison by By Packaging (2016-2032)
- Figure 147: Middle East & Africa Powdered Soft Drinks Market Market Share Comparison by By Distribution Channel (2016-2032)
"
- List of Tables
- "
- Table 1: Global Powdered Soft Drinks Market Market Comparison by By Flavor (2016-2032)
- Table 2: Global Powdered Soft Drinks Market Market Comparison by By Packaging (2016-2032)
- Table 3: Global Powdered Soft Drinks Market Market Comparison by By Distribution Channel (2016-2032)
- Table 4: Global Powdered Soft Drinks Market Revenue (US$ Mn) Comparison by Region (2016-2032)
- Table 5: Global Powdered Soft Drinks Market Market Revenue (US$ Mn) (2016-2032)
- Table 6: Global Powdered Soft Drinks Market Market Revenue (US$ Mn) Comparison by Region (2016-2032)
- Table 7: Global Powdered Soft Drinks Market Market Revenue (US$ Mn) Comparison by By Flavor (2016-2032)
- Table 8: Global Powdered Soft Drinks Market Market Revenue (US$ Mn) Comparison by By Packaging (2016-2032)
- Table 9: Global Powdered Soft Drinks Market Market Revenue (US$ Mn) Comparison by By Distribution Channel (2016-2032)
- Table 10: Global Powdered Soft Drinks Market Market Y-o-Y Growth Rate Comparison by Region (2016-2032)
- Table 11: Global Powdered Soft Drinks Market Market Y-o-Y Growth Rate Comparison by By Flavor (2016-2032)
- Table 12: Global Powdered Soft Drinks Market Market Y-o-Y Growth Rate Comparison by By Packaging (2016-2032)
- Table 13: Global Powdered Soft Drinks Market Market Y-o-Y Growth Rate Comparison by By Distribution Channel (2016-2032)
- Table 14: Global Powdered Soft Drinks Market Market Share Comparison by Region (2016-2032)
- Table 15: Global Powdered Soft Drinks Market Market Share Comparison by By Flavor (2016-2032)
- Table 16: Global Powdered Soft Drinks Market Market Share Comparison by By Packaging (2016-2032)
- Table 17: Global Powdered Soft Drinks Market Market Share Comparison by By Distribution Channel (2016-2032)
- Table 18: North America Powdered Soft Drinks Market Market Comparison by By Packaging (2016-2032)
- Table 19: North America Powdered Soft Drinks Market Market Comparison by By Distribution Channel (2016-2032)
- Table 20: North America Powdered Soft Drinks Market Revenue (US$ Mn) Comparison by Country (2016-2032)
- Table 21: North America Powdered Soft Drinks Market Market Revenue (US$ Mn) (2016-2032)
- Table 22: North America Powdered Soft Drinks Market Market Revenue (US$ Mn) Comparison by Country (2016-2032)
- Table 23: North America Powdered Soft Drinks Market Market Revenue (US$ Mn) Comparison by By Flavor (2016-2032)
- Table 24: North America Powdered Soft Drinks Market Market Revenue (US$ Mn) Comparison by By Packaging (2016-2032)
- Table 25: North America Powdered Soft Drinks Market Market Revenue (US$ Mn) Comparison by By Distribution Channel (2016-2032)
- Table 26: North America Powdered Soft Drinks Market Market Y-o-Y Growth Rate Comparison by Country (2016-2032)
- Table 27: North America Powdered Soft Drinks Market Market Y-o-Y Growth Rate Comparison by By Flavor (2016-2032)
- Table 28: North America Powdered Soft Drinks Market Market Y-o-Y Growth Rate Comparison by By Packaging (2016-2032)
- Table 29: North America Powdered Soft Drinks Market Market Y-o-Y Growth Rate Comparison by By Distribution Channel (2016-2032)
- Table 30: North America Powdered Soft Drinks Market Market Share Comparison by Country (2016-2032)
- Table 31: North America Powdered Soft Drinks Market Market Share Comparison by By Flavor (2016-2032)
- Table 32: North America Powdered Soft Drinks Market Market Share Comparison by By Packaging (2016-2032)
- Table 33: North America Powdered Soft Drinks Market Market Share Comparison by By Distribution Channel (2016-2032)
- Table 34: Western Europe Powdered Soft Drinks Market Market Comparison by By Flavor (2016-2032)
- Table 35: Western Europe Powdered Soft Drinks Market Market Comparison by By Packaging (2016-2032)
- Table 36: Western Europe Powdered Soft Drinks Market Market Comparison by By Distribution Channel (2016-2032)
- Table 37: Western Europe Powdered Soft Drinks Market Revenue (US$ Mn) Comparison by Country (2016-2032)
- Table 38: Western Europe Powdered Soft Drinks Market Market Revenue (US$ Mn) (2016-2032)
- Table 39: Western Europe Powdered Soft Drinks Market Market Revenue (US$ Mn) Comparison by Country (2016-2032)
- Table 40: Western Europe Powdered Soft Drinks Market Market Revenue (US$ Mn) Comparison by By Flavor (2016-2032)
- Table 41: Western Europe Powdered Soft Drinks Market Market Revenue (US$ Mn) Comparison by By Packaging (2016-2032)
- Table 42: Western Europe Powdered Soft Drinks Market Market Revenue (US$ Mn) Comparison by By Distribution Channel (2016-2032)
- Table 43: Western Europe Powdered Soft Drinks Market Market Y-o-Y Growth Rate Comparison by Country (2016-2032)
- Table 44: Western Europe Powdered Soft Drinks Market Market Y-o-Y Growth Rate Comparison by By Flavor (2016-2032)
- Table 45: Western Europe Powdered Soft Drinks Market Market Y-o-Y Growth Rate Comparison by By Packaging (2016-2032)
- Table 46: Western Europe Powdered Soft Drinks Market Market Y-o-Y Growth Rate Comparison by By Distribution Channel (2016-2032)
- Table 47: Western Europe Powdered Soft Drinks Market Market Share Comparison by Country (2016-2032)
- Table 48: Western Europe Powdered Soft Drinks Market Market Share Comparison by By Flavor (2016-2032)
- Table 49: Western Europe Powdered Soft Drinks Market Market Share Comparison by By Packaging (2016-2032)
- Table 50: Western Europe Powdered Soft Drinks Market Market Share Comparison by By Distribution Channel (2016-2032)
- Table 51: Eastern Europe Powdered Soft Drinks Market Market Comparison by By Flavor (2016-2032)
- Table 52: Eastern Europe Powdered Soft Drinks Market Market Comparison by By Packaging (2016-2032)
- Table 53: Eastern Europe Powdered Soft Drinks Market Market Comparison by By Distribution Channel (2016-2032)
- Table 54: Eastern Europe Powdered Soft Drinks Market Revenue (US$ Mn) Comparison by Country (2016-2032)
- Table 55: Eastern Europe Powdered Soft Drinks Market Market Revenue (US$ Mn) (2016-2032)
- Table 56: Eastern Europe Powdered Soft Drinks Market Market Revenue (US$ Mn) Comparison by Country (2016-2032)
- Table 57: Eastern Europe Powdered Soft Drinks Market Market Revenue (US$ Mn) Comparison by By Flavor (2016-2032)
- Table 58: Eastern Europe Powdered Soft Drinks Market Market Revenue (US$ Mn) Comparison by By Packaging (2016-2032)
- Table 59: Eastern Europe Powdered Soft Drinks Market Market Revenue (US$ Mn) Comparison by By Distribution Channel (2016-2032)
- Table 60: Eastern Europe Powdered Soft Drinks Market Market Y-o-Y Growth Rate Comparison by Country (2016-2032)
- Table 61: Eastern Europe Powdered Soft Drinks Market Market Y-o-Y Growth Rate Comparison by By Flavor (2016-2032)
- Table 62: Eastern Europe Powdered Soft Drinks Market Market Y-o-Y Growth Rate Comparison by By Packaging (2016-2032)
- Table 63: Eastern Europe Powdered Soft Drinks Market Market Y-o-Y Growth Rate Comparison by By Distribution Channel (2016-2032)
- Table 64: Eastern Europe Powdered Soft Drinks Market Market Share Comparison by Country (2016-2032)
- Table 65: Eastern Europe Powdered Soft Drinks Market Market Share Comparison by By Flavor (2016-2032)
- Table 66: Eastern Europe Powdered Soft Drinks Market Market Share Comparison by By Packaging (2016-2032)
- Table 67: Eastern Europe Powdered Soft Drinks Market Market Share Comparison by By Distribution Channel (2016-2032)
- Table 68: APAC Powdered Soft Drinks Market Market Comparison by By Flavor (2016-2032)
- Table 69: APAC Powdered Soft Drinks Market Market Comparison by By Packaging (2016-2032)
- Table 70: APAC Powdered Soft Drinks Market Market Comparison by By Distribution Channel (2016-2032)
- Table 71: APAC Powdered Soft Drinks Market Revenue (US$ Mn) Comparison by Country (2016-2032)
- Table 72: APAC Powdered Soft Drinks Market Market Revenue (US$ Mn) (2016-2032)
- Table 73: APAC Powdered Soft Drinks Market Market Revenue (US$ Mn) Comparison by Country (2016-2032)
- Table 74: APAC Powdered Soft Drinks Market Market Revenue (US$ Mn) Comparison by By Flavor (2016-2032)
- Table 75: APAC Powdered Soft Drinks Market Market Revenue (US$ Mn) Comparison by By Packaging (2016-2032)
- Table 76: APAC Powdered Soft Drinks Market Market Revenue (US$ Mn) Comparison by By Distribution Channel (2016-2032)
- Table 77: APAC Powdered Soft Drinks Market Market Y-o-Y Growth Rate Comparison by Country (2016-2032)
- Table 78: APAC Powdered Soft Drinks Market Market Y-o-Y Growth Rate Comparison by By Flavor (2016-2032)
- Table 79: APAC Powdered Soft Drinks Market Market Y-o-Y Growth Rate Comparison by By Packaging (2016-2032)
- Table 80: APAC Powdered Soft Drinks Market Market Y-o-Y Growth Rate Comparison by By Distribution Channel (2016-2032)
- Table 81: APAC Powdered Soft Drinks Market Market Share Comparison by Country (2016-2032)
- Table 82: APAC Powdered Soft Drinks Market Market Share Comparison by By Flavor (2016-2032)
- Table 83: APAC Powdered Soft Drinks Market Market Share Comparison by By Packaging (2016-2032)
- Table 84: APAC Powdered Soft Drinks Market Market Share Comparison by By Distribution Channel (2016-2032)
- Table 85: Latin America Powdered Soft Drinks Market Market Comparison by By Flavor (2016-2032)
- Table 86: Latin America Powdered Soft Drinks Market Market Comparison by By Packaging (2016-2032)
- Table 87: Latin America Powdered Soft Drinks Market Market Comparison by By Distribution Channel (2016-2032)
- Table 88: Latin America Powdered Soft Drinks Market Revenue (US$ Mn) Comparison by Country (2016-2032)
- Table 89: Latin America Powdered Soft Drinks Market Market Revenue (US$ Mn) (2016-2032)
- Table 90: Latin America Powdered Soft Drinks Market Market Revenue (US$ Mn) Comparison by Country (2016-2032)
- Table 91: Latin America Powdered Soft Drinks Market Market Revenue (US$ Mn) Comparison by By Flavor (2016-2032)
- Table 92: Latin America Powdered Soft Drinks Market Market Revenue (US$ Mn) Comparison by By Packaging (2016-2032)
- Table 93: Latin America Powdered Soft Drinks Market Market Revenue (US$ Mn) Comparison by By Distribution Channel (2016-2032)
- Table 94: Latin America Powdered Soft Drinks Market Market Y-o-Y Growth Rate Comparison by Country (2016-2032)
- Table 95: Latin America Powdered Soft Drinks Market Market Y-o-Y Growth Rate Comparison by By Flavor (2016-2032)
- Table 96: Latin America Powdered Soft Drinks Market Market Y-o-Y Growth Rate Comparison by By Packaging (2016-2032)
- Table 97: Latin America Powdered Soft Drinks Market Market Y-o-Y Growth Rate Comparison by By Distribution Channel (2016-2032)
- Table 98: Latin America Powdered Soft Drinks Market Market Share Comparison by Country (2016-2032)
- Table 99: Latin America Powdered Soft Drinks Market Market Share Comparison by By Flavor (2016-2032)
- Table 100: Latin America Powdered Soft Drinks Market Market Share Comparison by By Packaging (2016-2032)
- Table 101: Latin America Powdered Soft Drinks Market Market Share Comparison by By Distribution Channel (2016-2032)
- Table 102: Middle East & Africa Powdered Soft Drinks Market Market Comparison by By Flavor (2016-2032)
- Table 103: Middle East & Africa Powdered Soft Drinks Market Market Comparison by By Packaging (2016-2032)
- Table 104: Middle East & Africa Powdered Soft Drinks Market Market Comparison by By Distribution Channel (2016-2032)
- Table 105: Middle East & Africa Powdered Soft Drinks Market Revenue (US$ Mn) Comparison by Country (2016-2032)
- Table 106: Middle East & Africa Powdered Soft Drinks Market Market Revenue (US$ Mn) (2016-2032)
- Table 107: Middle East & Africa Powdered Soft Drinks Market Market Revenue (US$ Mn) Comparison by Country (2016-2032)
- Table 108: Middle East & Africa Powdered Soft Drinks Market Market Revenue (US$ Mn) Comparison by By Flavor (2016-2032)
- Table 109: Middle East & Africa Powdered Soft Drinks Market Market Revenue (US$ Mn) Comparison by By Packaging (2016-2032)
- Table 110: Middle East & Africa Powdered Soft Drinks Market Market Revenue (US$ Mn) Comparison by By Distribution Channel (2016-2032)
- Table 111: Middle East & Africa Powdered Soft Drinks Market Market Y-o-Y Growth Rate Comparison by Country (2016-2032)
- Table 112: Middle East & Africa Powdered Soft Drinks Market Market Y-o-Y Growth Rate Comparison by By Flavor (2016-2032)
- Table 113: Middle East & Africa Powdered Soft Drinks Market Market Y-o-Y Growth Rate Comparison by By Packaging (2016-2032)
- Table 114: Middle East & Africa Powdered Soft Drinks Market Market Y-o-Y Growth Rate Comparison by By Distribution Channel (2016-2032)
- Table 115: Middle East & Africa Powdered Soft Drinks Market Market Share Comparison by Country (2016-2032)
- Table 116: Middle East & Africa Powdered Soft Drinks Market Market Share Comparison by By Flavor (2016-2032)
- Table 117: Middle East & Africa Powdered Soft Drinks Market Market Share Comparison by By Packaging (2016-2032)
- Table 118: Middle East & Africa Powdered Soft Drinks Market Market Share Comparison by By Distribution Channel (2016-2032)
- 1. Executive Summary
-
- Cargill Incorporated
- Insta Foods
- Firmenich
- Tate & Lyle
- Bemis Company
- Sugam Products
- Coperion
- Kraft Foods
- Gatorade
- SMC Enterprise.
Our Clients


View Our Licence Options
