
Polyoxin Market Report By Type of Polyoxin (Polyoxin A, Polyoxin B), By Formulation (Liquid Concentrates, Soluble Powders, Granules, Wettable Powders, Others), By Application Method (Foliar Spray, Seed Treatment, Soil Drench, Root Application, Others), By End Users (Agriculture, Horticulture, Forestry, Turf & Ornamentals), By Region and Companies - Industry Segment Outlook, Market Assessment, Competition Scenario, Trends and Forecast 2024-2033
-
45198
-
April 2024
-
291
-


-
This report was compiled by Shreyas Rokade Shreyas Rokade is a seasoned Research Analyst with CMFE, bringing extensive expertise in market research and consulting, with a strong background in Chemical Engineering. Correspondence Team Lead-CMFE Linkedin | Detailed Market research Methodology Our methodology involves a mix of primary research, including interviews with leading mental health experts, and secondary research from reputable medical journals and databases. View Detailed Methodology Page
-
Quick Navigation
Report Overview
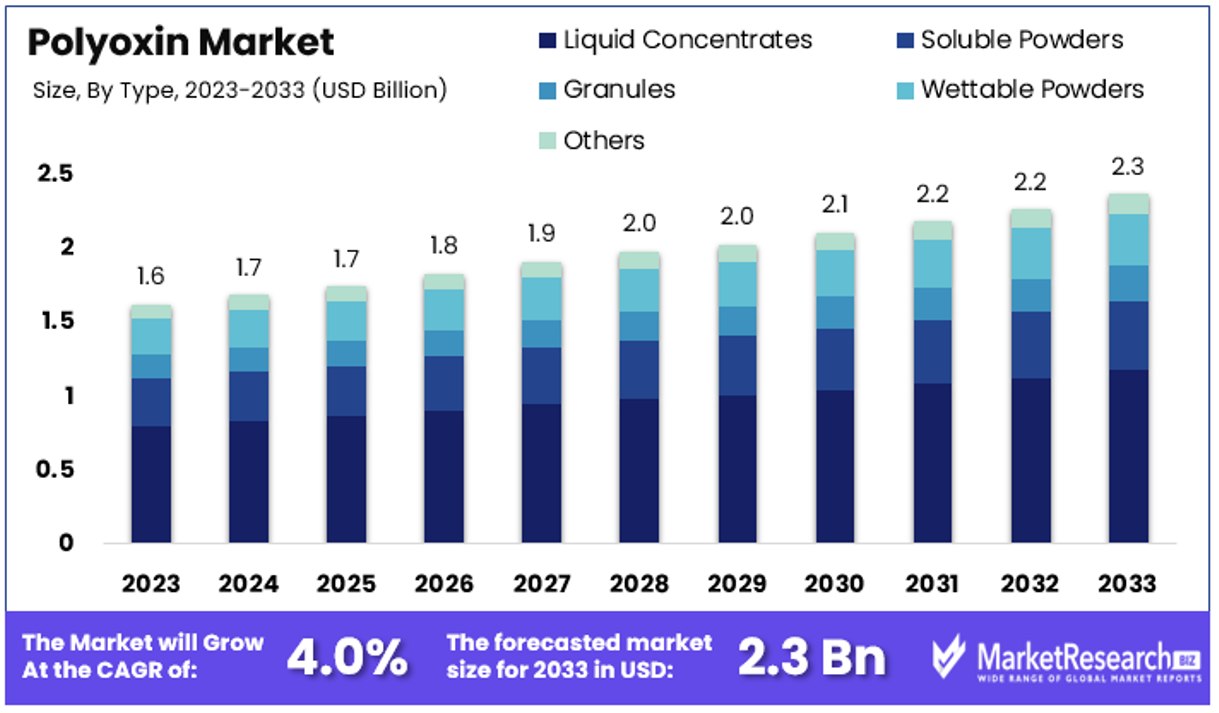
The Global Polyoxin Market size is expected to be worth around USD 2.3 Billion by 2033, from USD 1.6 Billion in 2023, growing at a CAGR of 4.0% during the forecast period from 2024 to 2033.
The Polyoxin Market refers to the global industry centered around the production and distribution of Polyoxin, a group of nucleoside antibiotics used primarily in agriculture. These compounds are crucial for controlling fungal diseases in crops, thus enhancing yield and quality. The market's growth is driven by increasing demand for sustainable agricultural practices and the need for effective plant disease management solutions.
Key stakeholders include agrochemical companies, farmers, and regulatory bodies. As the market evolves, innovation in product formulation and application methods continues to play a significant role. This sector offers significant opportunities for development and expansion in both established and emerging markets.
The Polyoxin market is poised for substantial growth, driven by a surge in global organic farming practices and an increased focus on sustainable agricultural inputs. Recent data from the 25th edition of "The World of Organic Agriculture," published by the Research Institute of Organic Agriculture FiBL and IFOAM - Organics International, highlights a significant expansion in organic farming areas, which grew by over 20 million hectares in 2022, reaching a total of 96 million hectares.
Additionally, the number of organic producers has escalated, now exceeding 4.5 million. This uptrend in organic agriculture underscores a growing demand for biopesticides like Polyoxin, renowned for their efficacy in managing plant diseases without harming the environment.
As organic farming scales up, the reliance on environmentally friendly agrochemicals and fungicides such as Polyoxin is expected to increase, reinforcing its market position. The trend is not merely a response to regulatory pressures but also aligns with consumer preferences for sustainably produced food. Furthermore, innovations in the formulation and application of Polyoxin are likely to enhance its effectiveness and user-friendliness, thereby expanding its usability across diverse agricultural settings.
Investment in research and development within the Polyoxin sector is also seeing a rise, prompted by the promising market prospects and the need to adapt to varied agronomic conditions. This is particularly pertinent in regions experiencing rapid organic sector growth, where effective disease management solutions are critical.
In conclusion, the Polyoxin market is set to benefit significantly from the global shift towards organic and sustainable farming practices. With its established efficacy and evolving product innovations, Polyoxin is well-positioned to meet the increasing demands of this dynamic sector, presenting lucrative opportunities for growth and investment.
Key Takeaways
- Market Value: The Global Polyoxin Market is projected to reach USD 2.3 billion by 2033, showing growth from USD 1.6 billion in 2023, with a CAGR of 4.00% during the forecast period from 2024 to 2033.
- Type of Polyoxin Analysis: Polyoxin B holds 65% of the market share due to its enhanced efficacy and broader application in agriculture and horticulture.
- Formulation Analysis: Liquid concentrates dominate with 50% share due to their ease of use and effective distribution properties.
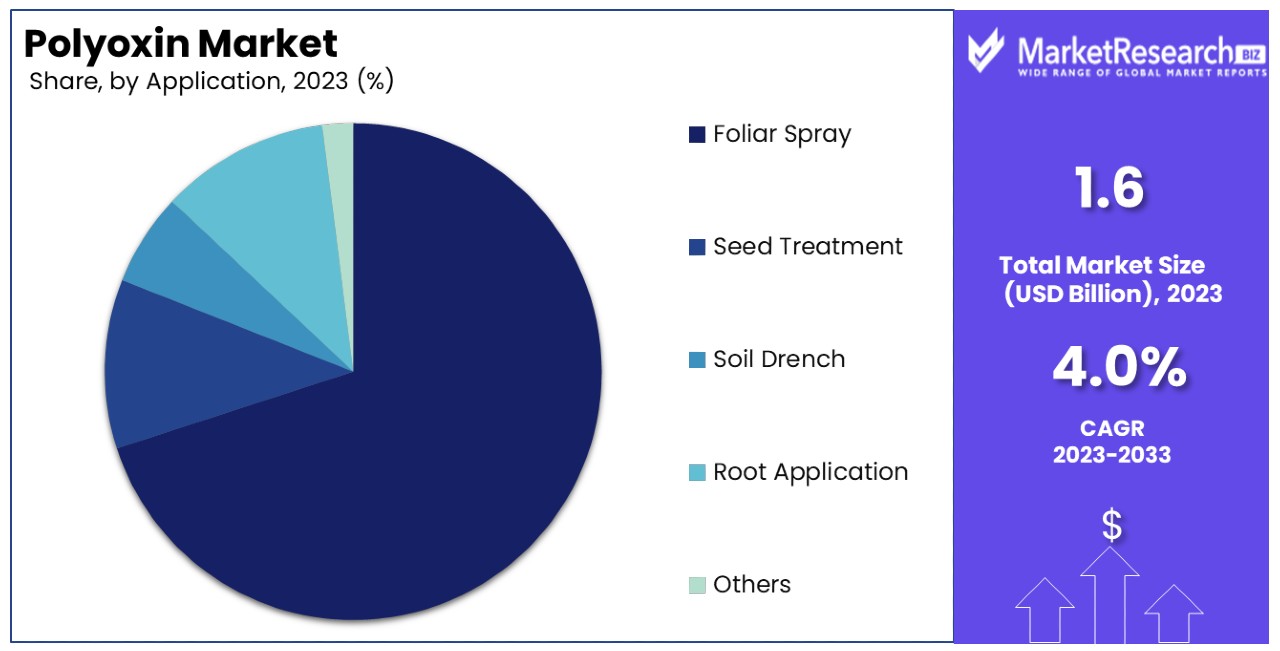
- Application Method Analysis: Foliar spray dominates with 70% share, providing immediate protection by directly acting on leaves and stems.
- End Users Analysis: Agriculture dominates with 80% share, driven by the critical need for disease control in food production.
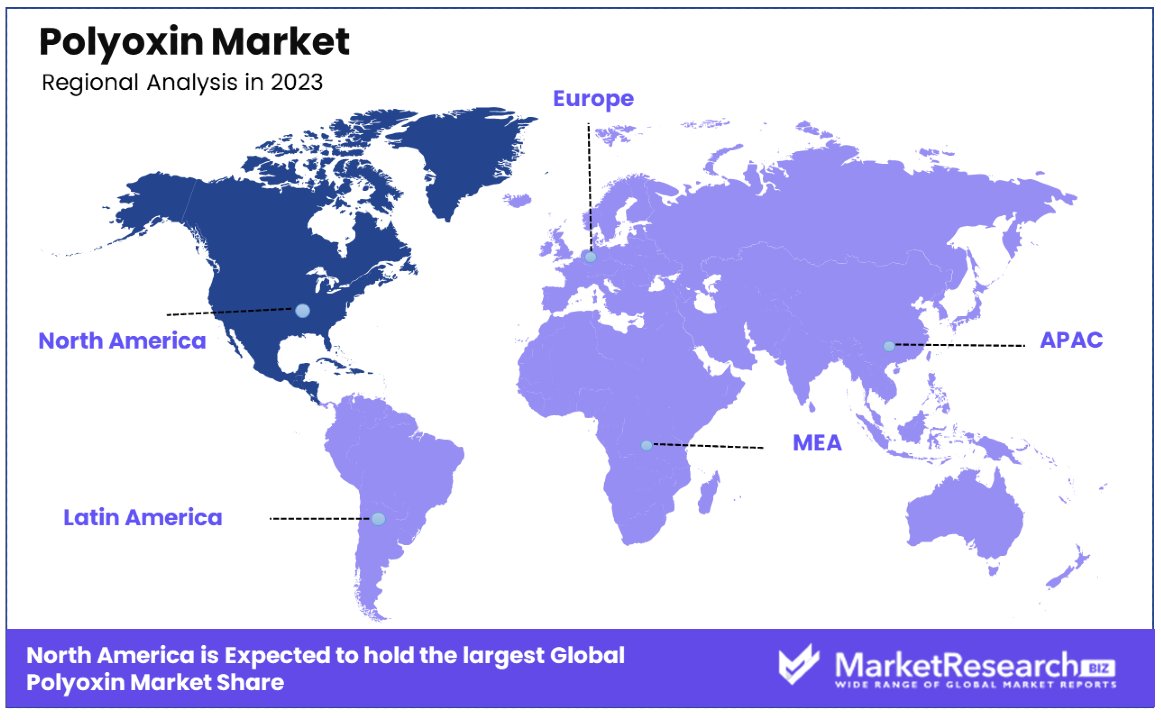
- North America: Leads with a 40% market share, reflecting strong demand for agricultural chemicals and sustainable crop protection solutions.
- Europe: Holds approximately 30% of the market share, driven by stringent regulatory frameworks promoting reduced chemical pesticide use and high demand for organic products.
- Analyst Viewpoint: The market's growth is fueled by increasing demand for sustainable crop protection solutions and the efficacy of Polyoxin in managing fungal diseases across various sectors. Polyoxin B's dominance underscores its effectiveness and versatility in addressing a wide range of fungal pathogens, especially in critical agricultural and horticultural applications.
Driving Factors
Increasing Demand for Eco-Friendly Fungicides Drives Market Growth
The surge in eco-conscious agricultural practices has notably increased the demand for eco-friendly fungicides, directly benefiting the Polyoxin market. As a biofungicide derived from natural microorganisms, Polyoxin is recognized as a safer alternative to conventional chemical pesticides. It aligns perfectly with the global push towards sustainable agriculture, bolstered by its approval for organic use by the USDA and other international bodies.
This growing endorsement underscores its appeal to organic farmers who are rapidly expanding their cultivation areas—as evidenced by the over 20 million hectare increase in organic farming areas reported in 2022. Additionally, Polyoxin’s low environmental impact makes it integral to integrated pest management (IPM) strategies, further broadening its market base and reinforcing its essential role in modern sustainable farming practices.
Expanding Applications in Horticulture and Ornamental Plants Drives Market Growth
Polyoxin is extending its influence beyond traditional agriculture into the realms of horticulture and ornamental plants. The compound's effectiveness against fungal infections like powdery mildew and botrytis caters well to the rising demand for high-quality ornamental plants used in landscaping and residential gardens.
Companies such as Certis USA and OHP Inc. are responding by developing Polyoxin-based products tailored for these specific applications. This expansion is driven by an increased consumer interest in home gardening and aesthetically pleasing landscapes, further propelled by the growing urban gardening trends. The broadening of its use cases not only diversifies Polyoxin's market opportunities but also solidifies its position as a versatile and essential fungicide in the plant protection industry.
Resistance Management Strategies Drive Market Growth
The challenge of fungicide resistance is a major concern in crop protection, positioning Polyoxin as a critical component in resistance management strategies. With its unique mode of action, Polyoxin provides an effective solution for managing resistance development in pathogens. This is particularly important as the Fungicide Resistance Action Committee (FRAC) highlights the importance of including Polyoxin in resistance management programs.
Its ability to be rotated or combined with other fungicides helps preserve the longevity and efficacy of fungicide treatments across various crops. This strategic application not only enhances Polyoxin’s market value but also supports sustainable farming by ensuring long-term disease control solutions.
Increasing Adoption in High-Value Crops Drives Market Growth
Polyoxin is proving essential in the cultivation of high-value crops such as grapes, berries, and vegetables, where the economic stakes are high, and the impact of diseases like botrytis bunch rot and powdery mildew can be devastating. The effectiveness of Polyoxin in protecting these crops from such diseases translates directly into better yields and higher quality produce, key factors that drive its adoption rate among growers.
This trend is underscored by the increasing global demand for premium agricultural products and the necessity for sustainable crop protection solutions that meet both consumer safety standards and environmental guidelines. As a result, Polyoxin is not only enhancing agricultural productivity but also contributing to the economic viability of farming high-value crops in a competitive market landscape.
Restraining Factors
Limited Spectrum of Activity Restrains Market Growth
Polyoxin's narrower spectrum of activity, compared to broad-spectrum synthetic fungicides, poses a significant challenge to its market expansion. While effective against a variety of fungal diseases, Polyoxin does not combat certain pathogens such as downy mildew. This limitation may deter growers dealing with multiple fungal threats who require fungicides with broader protective capabilities.
In such cases, growers might opt for more inclusive fungicidal solutions, integrating other products into their pest management programs. This need for additional fungicides can complicate treatment regimes and increase overall costs, making Polyoxin less appealing in scenarios demanding comprehensive disease control.
Higher Cost Compared to Conventional Fungicides Restrains Market Growth
The complex production process of Polyoxin, involving fermentation and extraction from microorganisms, results in higher costs compared to conventional synthetic fungicides. This price disparity can significantly hinder Polyoxin's market penetration, especially among cost-sensitive growers and in the production of low-value commodity crops.
In contexts where budget constraints are paramount, the adoption of Polyoxin-based products may be limited, as growers opt for cheaper, synthetic alternatives that offer broader disease control at a lower cost. This economic barrier is particularly pronounced in large-scale agricultural operations where profit margins are slim, and cost-efficiency is crucial.
Type of Polyoxin Analysis
Polyoxin B dominates with 65% due to its enhanced efficacy and broader application in agriculture and horticulture.
Polyoxin is primarily categorized into two types: Polyoxin A and Polyoxin B. Polyoxin B emerges as the dominant sub-segment, holding approximately 65% of the market share. This predominance is attributed to its proven efficacy against a wider array of fungal pathogens compared to Polyoxin A, making it more desirable for critical agricultural and horticultural applications. Polyoxin B is particularly valued for its robust action against diseases like botrytis and powdery mildew, which are common in high-value crops such as grapes, berries, and ornamental plants. The preference for Polyoxin B is further reinforced by its compatibility with integrated pest management (IPM) programs, aligning well with global trends towards sustainable farming practices.
In contrast, Polyoxin A, while effective, is typically utilized in more niche markets where specific fungal pathogens are prevalent. Although it covers less market share, its importance cannot be overlooked as it complements the use of Polyoxin B by providing options for targeted disease management in crops that may not be as effectively treated by Polyoxin B. The role of Polyoxin A continues to be significant in diversified farming practices, where tailored solutions are critical for disease control.
Formulation Analysis
Liquid concentrates dominate with 50% due to their ease of use and effective distribution properties.
In the formulations segment of the Polyoxin market, liquid concentrates hold the majority, approximately 50% of the market share. This dominance is primarily due to their ease of application and the ability to effectively distribute the active ingredient across various crop surfaces. Liquid concentrates are favored in both small-scale and large-scale farming operations due to their compatibility with existing spraying equipment, which facilitates uniform application. They are particularly effective in humid climates where their formulation helps in sticking to leaves and stems, thus providing prolonged protection against fungal diseases.
Other formulations like soluble powders, granules, wettable powders, and other forms also play crucial roles in the market. Soluble powders are appreciated for their storage stability and lower transport costs, making them suitable for regions with logistical challenges. Granules are preferred for their controlled release properties, ideal for soil drench applications, and root treatments. Wettable powders, although less popular than liquid concentrates, offer benefits in terms of safety and ease of handling, particularly in windy conditions where spray drift can be a concern.
Application Method Analysis
Foliar spray dominates with 70% due to its direct action on leaves and stems, providing immediate protection.
The application method of foliar spray stands out as the most predominant, capturing about 70% of the market share within the Polyoxin market. This method's popularity stems from its direct application to the leaves and stems of plants, providing immediate protection against external fungal infections. Foliar sprays are particularly effective in reaching the upper and lower surfaces of leaves, ensuring comprehensive coverage and rapid action against pathogens. The method is universally applicable across all farming scales, from small gardens to extensive agricultural fields, and is easy to integrate into regular farming routines.
Other application methods like seed treatment, soil drench, and root application, though less dominant, are integral to comprehensive plant protection strategies. Seed treatments are vital for protecting seeds from soil-borne diseases and ensuring a healthy start for crops. Soil drenches contribute by protecting the root systems and providing systemic action against subterranean pests. Root applications are specialized treatments for tree crops and perennials where root health directly influences the overall vitality of the plants.
End Users Analysis
Agriculture dominates with 80% due to the critical need for disease control in food production.
In the end-user segment, agriculture remains the primary market for Polyoxin, accounting for about 80% of its total usage. The segment's dominance is driven by the critical need for effective fungal disease control in food crops, which is essential for ensuring food security and crop productivity. Polyoxin's role in agriculture is amplified by the growing demand for sustainable crop protection chemicals that align with global standards for food safety and environmental health.
While agriculture is the mainstay, other segments like horticulture, forestry, turf, and ornamentals are also significant. Horticulture values Polyoxin for its efficacy in managing ornamental plant diseases, which are crucial for maintaining the aesthetic and commercial value of these plants. Forestry uses Polyoxin to manage tree diseases, which can have long-term ecological and economic impacts. Turf and ornamentals benefit from Polyoxin's ability to control fungal pathogens in recreational, sports, and landscape areas, ensuring the health and visual appeal of these environments. Each of these segments contributes uniquely to the overall growth of the Polyoxin market, supporting its expansion in diverse directions.
Key Market Segments
By Type of Polyoxin
- Polyoxin A
- Polyoxin B
By Formulation
- Liquid Concentrates
- Soluble Powders
- Granules
- Wettable Powders
- Others
By Application Method
- Foliar Spray
- Seed Treatment
- Soil Drench
- Root Application
- Others
By End Users
- Agriculture
- Horticulture
- Forestry
- Turf & Ornamentals
Growth Opportunities
Development of Polyoxin-Based Biopesticide Formulations Offers Growth Opportunity
The creation of innovative polyoxin-based biopesticide formulations represents a substantial growth opportunity in the Polyoxin Market. By combining polyoxin with other natural or biological active ingredients, these new formulations can achieve enhanced efficacy and a broader spectrum of activity, while maintaining environmental compatibility.
This approach not only broadens the effectiveness of polyoxin against a wider range of pathogens but also aligns with global trends towards more sustainable agricultural practices. Research initiatives, such as those conducted by the University of Florida, which explore the integration of plant extracts and beneficial microorganisms with polyoxin, are paving the way for these advanced biopesticides. Such developments are likely to meet the increasing demand for integrated and holistic solutions in plant health management, thereby driving market expansion.
Integration into Integrated Pest Management (IPM) Programs Offers Growth Opportunity
Polyoxin's integration into Integrated Pest Management (IPM) programs underscores its potential as a pivotal tool in sustainable agriculture. Its unique mode of action and minimal environmental impact make it an ideal choice for IPM strategies, which prioritize reducing reliance on synthetic pesticides. By incorporating polyoxin into these programs, manufacturers can tap into the growing demand for eco-friendly pest control solutions.
Notably, programs like the University of California's IPM initiative recommend polyoxin-based fungicides for key crops, including grapes and strawberries. This integration helps solidify polyoxin's role in modern agricultural practices, enhancing its market presence and supporting its adoption across a broad spectrum of farming operations committed to sustainability and environmental stewardship.
Trending Factors
Advancements in Fermentation and Extraction Technologies Are Trending Factors
Technological progress in fermentation and extraction processes represents a key trend in the Polyoxin market. As the production of Polyoxin relies on sophisticated fermentation techniques using the microorganism Streptomyces cacaoi, enhancements in these technologies can significantly improve production efficiency, yield, and cost-effectiveness.
For instance, research initiatives at the University of Minnesota focus on advancing these methods to maximize Polyoxin extraction. These improvements could lead to a decrease in production costs, making Polyoxin-based products more accessible and affordable for a broader range of users. This trend is likely to drive increased market penetration and growth, as more efficient production methods enable wider distribution and use in various agricultural applications.
Focus on Sustainable Agriculture and Climate-Smart Practices Are Trending Factors
The shift towards sustainable agriculture and climate-smart practices forms a major trend influencing the Polyoxin market. Polyoxin's attributes as a naturally derived and environmentally friendly fungicide make it an ideal fit for these emerging agricultural paradigms. With increasing awareness and regulatory support for sustainable farming methods to combat environmental challenges, the demand for eco-friendly solutions like Polyoxin is set to rise.
Notably, initiatives such as the European Union's Farm to Fork Strategy highlight a commitment to sustainable food systems and a reduction in hazardous pesticide use, presenting significant opportunities for the adoption of biopesticides like Polyoxin. This trend underscores the growing market demand aligned with global sustainability and climate-resilient farming goals, positioning Polyoxin as a preferred choice among environmentally conscious growers and organizations.
Regional Analysis
North America Dominates with 40% Market Share
North America's substantial 40% share of the Polyoxin market can be attributed to several key drivers. Firstly, there's a strong emphasis on sustainable agricultural practices and organic farming in the region, especially in the United States and Canada, which boosts the demand for eco-friendly products like Polyoxin. Secondly, the region hosts a robust agricultural biotechnology sector that actively invests in and promotes the development of biopesticides, further supporting market growth.
The agricultural dynamics in North America are characterized by advanced farming technologies and a regulatory environment that favors the adoption of environmentally sustainable practices. This regional characteristic enhances the penetration and acceptance of biopesticides. Additionally, the presence of leading agricultural research institutions and biotech companies facilitates continuous improvements in biopesticide efficacy and safety, reinforcing the market's expansion.
North America is expected to maintain or even increase its dominance in the Polyoxin market. Continued regulatory support for sustainable products, along with increasing consumer preference for organically produced foods, will likely drive further growth. The ongoing development of more efficient and effective biopesticide formulations will also play a crucial role in sustaining this trend.
Other Regions' Market Shares and Growth:
- Europe: Europe holds approximately 30% of the Polyoxin market share. The region's strong regulatory framework supporting the reduction of chemical pesticide use and the high demand for organic products are significant growth drivers.
- Asia Pacific: This region accounts for about 20% of the market share. Rapid agricultural expansion and increasing awareness of sustainable farming practices in countries like China and India fuel the demand for Polyoxin.
- Middle East & Africa: With a smaller market share of around 5%, the growth in this region is driven by gradually increasing adoption of modern agricultural techniques and a growing emphasis on food security.
- Latin America: Holding 5% of the market, Latin America's growth is spurred by advancements in agricultural technology and increasing local initiatives to adopt sustainable crop protection solutions.
Key Regions and Countries
- North America
- The US
- Canada
- Mexico
- Western Europe
- Germany
- France
- The UK
- Spain
- Italy
- Portugal
- Ireland
- Austria
- Switzerland
- Benelux
- Nordic
- Rest of Western Europe
- Eastern Europe
- Russia
- Poland
- The Czech Republic
- Greece
- Rest of Eastern Europe
- APAC
- China
- Japan
- South Korea
- India
- Australia & New Zealand
- Indonesia
- Malaysia
- Philippines
- Singapore
- Thailand
- Vietnam
- Rest of APAC
- Latin America
- Brazil
- Colombia
- Chile
- Argentina
- Costa Rica
- Rest of Latin America
- Middle East & Africa
- Algeria
- Egypt
- Israel
- Kuwait
- Nigeria
- Saudi Arabia
- South Africa
- Turkey
- United Arab Emirates
- Rest of MEA
Key Players Analysis
In the Polyoxin market, key companies play distinct roles that shape the industry's landscape. Kaken Pharmaceutical Co., Ltd. stands out for its pioneering research and development, positioning itself as a leader in the production of Polyoxin-based products. This firm sets industry standards and has a substantial impact on market trends.
Jiangsu Fengyuan Bioengineering Co., Ltd. and Beijing Green Agrosino Co., Ltd. contribute significantly to the market by focusing on large-scale production and distribution in Asia, enhancing regional accessibility and supply chain efficiency.
Bayer AG brings global reach and extensive resources, influencing market dynamics through its integrated approach to marketing and distribution, which ensures widespread availability of Polyoxin products across various international markets.
Cleary Chemical Corp. and ANGUS Chemical Company, though smaller in scale, specialize in niche markets within the United States, offering tailored solutions that meet specific agricultural needs, thus maintaining strong customer loyalty.
Amadis Chemical Company Limited supports the market through its role in supplying raw materials and intermediate products, crucial for maintaining steady production lines for Polyoxin formulations.
Overall, these companies collectively drive the Polyoxin market through innovation, strategic market placement, and robust production capabilities, ensuring they meet global agricultural demands effectively.
Market Key Players
- Cleary Chemical Corp.
- Kaken Pharmaceutical Co., Ltd.
- Jiangsu Fengyuan Bioengineering Co., Ltd.
- Beijing Green Agrosino Co., Ltd.
- Bayer AG
- Amadis Chemical Company Limited
- ANGUS Chemical Company
Recent Developments
- On March 2023, the governments of Ecuador, India, Kenya, Laos, Philippines, Uruguay, and Vietnam launched a $379 million initiative to combat pollution from the use of pesticides and plastics in agriculture. This program, called the Financing Agrochemical Reduction and Management Programme (FARM), aims to change the business case for banks and policy-makers to reorient policy and financial resources towards farmers, helping them adopt low- and non-chemical alternatives to toxic agrochemicals and facilitate a transition towards better practices.
- On September 2023, the University of Manitoba announced a $6 million crop production research project aimed at helping farmers reduce their reliance on chemical fertilizers. This project, co-led by Drs. Ivan Oresnik and George DiCenzo, aims to identify beneficial microbes and leverage their effects on crop health and production. The goal is to develop microbial inoculants that could replace synthetic fertilizers or significantly decrease their use, thereby reducing agricultural greenhouse gas (GHG) emissions in Canada.
- On August 2023, St Lucian Eugene Gabriel, owner of E&E Agrochemicals, revealed ambitious plans to provide farmers with effective tools to reduce reliance on non-organic chemicals, promoting sustainable agricultural practices that protect both crops and the environment.
Report Scope
Report Features Description Market Value (2023) USD 1.6 Billion Forecast Revenue (2033) USD 2.3 Billion CAGR (2024-2033) 4.00% Base Year for Estimation 2023 Historic Period 2018-2023 Forecast Period 2024-2033 Report Coverage Revenue Forecast, Market Dynamics, Competitive Landscape, Recent Developments Segments Covered By Type of Polyoxin (Polyoxin A, Polyoxin B), By Formulation (Liquid Concentrates, Soluble Powders, Granules, Wettable Powders, Others), By Application Method (Foliar Spray, Seed Treatment, Soil Drench, Root Application, Others), By End Users (Agriculture, Horticulture, Forestry, Turf & Ornamentals) Regional Analysis North America - The US, Canada, & Mexico; Western Europe - Germany, France, The UK, Spain, Italy, Portugal, Ireland, Austria, Switzerland, Benelux, Nordic, & Rest of Western Europe; Eastern Europe - Russia, Poland, The Czech Republic, Greece, & Rest of Eastern Europe; APAC - China, Japan, South Korea, India, Australia & New Zealand, Indonesia, Malaysia, Philippines, Singapore, Thailand, Vietnam, & Rest of APAC; Latin America - Brazil, Colombia, Chile, Argentina, Costa Rica, & Rest of Latin America; Middle East & Africa - Algeria, Egypt, Israel, Kuwait, Nigeria, Saudi Arabia, South Africa, Turkey, United Arab Emirates, & Rest of MEA Competitive Landscape Cleary Chemical Corp., Kaken Pharmaceutical Co., Ltd., Jiangsu Fengyuan Bioengineering Co., Ltd., Beijing Green Agrosino Co., Ltd., Bayer AG, Amadis Chemical Company Limited, ANGUS Chemical Company Customization Scope Customization for segments, region/country-level will be provided. Moreover, additional customization can be done based on the requirements. Purchase Options We have three licenses to opt for: Single User License, Multi-User License (Up to 5 Users), Corporate Use License (Unlimited User and Printable PDF) -
- 1. Executive Summary
- 1.1. Definition
- 1.2. Taxonomy
- 1.3. Research Scope
- 1.4. Key Analysis
- 1.5. Key Findings by Major Segments
- 1.6. Top strategies by Major Players
- 2. Global Polyoxin Market Overview
- 2.1. Polyoxin Market Dynamics
- 2.1.1. Drivers
- 2.1.2. Opportunities
- 2.1.3. Restraints
- 2.1.4. Challenges
- 2.2. Macro-economic Factors
- 2.3. Regulatory Framework
- 2.4. Market Investment Feasibility Index
- 2.5. PEST Analysis
- 2.6. PORTER’S Five Force Analysis
- 2.7. Drivers & Restraints Impact Analysis
- 2.8. Industry Chain Analysis
- 2.9. Cost Structure Analysis
- 2.10. Marketing Strategy
- 2.11. Russia-Ukraine War Impact Analysis
- 2.12. Opportunity Map Analysis
- 2.13. Market Competition Scenario Analysis
- 2.14. Product Life Cycle Analysis
- 2.15. Opportunity Orbits
- 2.16. Manufacturer Intensity Map
- 2.17. Major Companies sales by Value & Volume
- 2.1. Polyoxin Market Dynamics
- 3. Global Polyoxin Market Analysis, Opportunity and Forecast, 2016-2032
- 3.1. Global Polyoxin Market Analysis, 2016-2021
- 3.2. Global Polyoxin Market Opportunity and Forecast, 2023-2032
- 3.3. Global Polyoxin Market Analysis, Opportunity and Forecast, By Type of Polyoxin, 2016-2032
- 3.3.1. Global Polyoxin Market Analysis by Type of Polyoxin: Introduction
- 3.3.2. Market Size Absolute $ Opportunity Analysis and Forecast, By Type of Polyoxin, 2016-2032
- 3.3.3. Polyoxin A
- 3.3.4. Polyoxin B
- 3.4. Global Polyoxin Market Analysis, Opportunity and Forecast, By Formulation, 2016-2032
- 3.4.1. Global Polyoxin Market Analysis by Formulation: Introduction
- 3.4.2. Market Size Absolute $ Opportunity Analysis and Forecast, By Formulation, 2016-2032
- 3.4.3. Liquid Concentrates
- 3.4.4. Soluble Powders
- 3.4.5. Granules
- 3.4.6. Wettable Powders
- 3.4.7. Others
- 3.5. Global Polyoxin Market Analysis, Opportunity and Forecast, By Application Method, 2016-2032
- 3.5.1. Global Polyoxin Market Analysis by Application Method: Introduction
- 3.5.2. Market Size Absolute $ Opportunity Analysis and Forecast, By Application Method, 2016-2032
- 3.5.3. Foliar Spray
- 3.5.4. Seed Treatment
- 3.5.5. Soil Drench
- 3.5.6. Root Application
- 3.5.7. Others
- 3.6. Global Polyoxin Market Analysis, Opportunity and Forecast, By End Users, 2016-2032
- 3.6.1. Global Polyoxin Market Analysis by End Users: Introduction
- 3.6.2. Market Size Absolute $ Opportunity Analysis and Forecast, By End Users, 2016-2032
- 3.6.3. Agriculture
- 3.6.4. Horticulture
- 3.6.5. Forestry
- 3.6.6. Turf & Ornamentals
- 4. North America Polyoxin Market Analysis, Opportunity and Forecast, 2016-2032
- 4.1. North America Polyoxin Market Analysis, 2016-2021
- 4.2. North America Polyoxin Market Opportunity and Forecast, 2023-2032
- 4.3. North America Polyoxin Market Analysis, Opportunity and Forecast, By Type of Polyoxin, 2016-2032
- 4.3.1. North America Polyoxin Market Analysis by Type of Polyoxin: Introduction
- 4.3.2. Market Size Absolute $ Opportunity Analysis and Forecast, By Type of Polyoxin, 2016-2032
- 4.3.3. Polyoxin A
- 4.3.4. Polyoxin B
- 4.4. North America Polyoxin Market Analysis, Opportunity and Forecast, By Formulation, 2016-2032
- 4.4.1. North America Polyoxin Market Analysis by Formulation: Introduction
- 4.4.2. Market Size Absolute $ Opportunity Analysis and Forecast, By Formulation, 2016-2032
- 4.4.3. Liquid Concentrates
- 4.4.4. Soluble Powders
- 4.4.5. Granules
- 4.4.6. Wettable Powders
- 4.4.7. Others
- 4.5. North America Polyoxin Market Analysis, Opportunity and Forecast, By Application Method, 2016-2032
- 4.5.1. North America Polyoxin Market Analysis by Application Method: Introduction
- 4.5.2. Market Size Absolute $ Opportunity Analysis and Forecast, By Application Method, 2016-2032
- 4.5.3. Foliar Spray
- 4.5.4. Seed Treatment
- 4.5.5. Soil Drench
- 4.5.6. Root Application
- 4.5.7. Others
- 4.6. North America Polyoxin Market Analysis, Opportunity and Forecast, By End Users, 2016-2032
- 4.6.1. North America Polyoxin Market Analysis by End Users: Introduction
- 4.6.2. Market Size Absolute $ Opportunity Analysis and Forecast, By End Users, 2016-2032
- 4.6.3. Agriculture
- 4.6.4. Horticulture
- 4.6.5. Forestry
- 4.6.6. Turf & Ornamentals
- 4.7. North America Polyoxin Market Analysis, Opportunity and Forecast, By Country , 2016-2032
- 4.7.1. North America Polyoxin Market Analysis by Country : Introduction
- 4.7.2. Market Size Absolute $ Opportunity Analysis and Forecast, Country , 2016-2032
- 4.7.2.1. The US
- 4.7.2.2. Canada
- 4.7.2.3. Mexico
- 5. Western Europe Polyoxin Market Analysis, Opportunity and Forecast, 2016-2032
- 5.1. Western Europe Polyoxin Market Analysis, 2016-2021
- 5.2. Western Europe Polyoxin Market Opportunity and Forecast, 2023-2032
- 5.3. Western Europe Polyoxin Market Analysis, Opportunity and Forecast, By Type of Polyoxin, 2016-2032
- 5.3.1. Western Europe Polyoxin Market Analysis by Type of Polyoxin: Introduction
- 5.3.2. Market Size Absolute $ Opportunity Analysis and Forecast, By Type of Polyoxin, 2016-2032
- 5.3.3. Polyoxin A
- 5.3.4. Polyoxin B
- 5.4. Western Europe Polyoxin Market Analysis, Opportunity and Forecast, By Formulation, 2016-2032
- 5.4.1. Western Europe Polyoxin Market Analysis by Formulation: Introduction
- 5.4.2. Market Size Absolute $ Opportunity Analysis and Forecast, By Formulation, 2016-2032
- 5.4.3. Liquid Concentrates
- 5.4.4. Soluble Powders
- 5.4.5. Granules
- 5.4.6. Wettable Powders
- 5.4.7. Others
- 5.5. Western Europe Polyoxin Market Analysis, Opportunity and Forecast, By Application Method, 2016-2032
- 5.5.1. Western Europe Polyoxin Market Analysis by Application Method: Introduction
- 5.5.2. Market Size Absolute $ Opportunity Analysis and Forecast, By Application Method, 2016-2032
- 5.5.3. Foliar Spray
- 5.5.4. Seed Treatment
- 5.5.5. Soil Drench
- 5.5.6. Root Application
- 5.5.7. Others
- 5.6. Western Europe Polyoxin Market Analysis, Opportunity and Forecast, By End Users, 2016-2032
- 5.6.1. Western Europe Polyoxin Market Analysis by End Users: Introduction
- 5.6.2. Market Size Absolute $ Opportunity Analysis and Forecast, By End Users, 2016-2032
- 5.6.3. Agriculture
- 5.6.4. Horticulture
- 5.6.5. Forestry
- 5.6.6. Turf & Ornamentals
- 5.7. Western Europe Polyoxin Market Analysis, Opportunity and Forecast, By Country , 2016-2032
- 5.7.1. Western Europe Polyoxin Market Analysis by Country : Introduction
- 5.7.2. Market Size Absolute $ Opportunity Analysis and Forecast, Country , 2016-2032
- 5.7.2.1. Germany
- 5.7.2.2. France
- 5.7.2.3. The UK
- 5.7.2.4. Spain
- 5.7.2.5. Italy
- 5.7.2.6. Portugal
- 5.7.2.7. Ireland
- 5.7.2.8. Austria
- 5.7.2.9. Switzerland
- 5.7.2.10. Benelux
- 5.7.2.11. Nordic
- 5.7.2.12. Rest of Western Europe
- 6. Eastern Europe Polyoxin Market Analysis, Opportunity and Forecast, 2016-2032
- 6.1. Eastern Europe Polyoxin Market Analysis, 2016-2021
- 6.2. Eastern Europe Polyoxin Market Opportunity and Forecast, 2023-2032
- 6.3. Eastern Europe Polyoxin Market Analysis, Opportunity and Forecast, By Type of Polyoxin, 2016-2032
- 6.3.1. Eastern Europe Polyoxin Market Analysis by Type of Polyoxin: Introduction
- 6.3.2. Market Size Absolute $ Opportunity Analysis and Forecast, By Type of Polyoxin, 2016-2032
- 6.3.3. Polyoxin A
- 6.3.4. Polyoxin B
- 6.4. Eastern Europe Polyoxin Market Analysis, Opportunity and Forecast, By Formulation, 2016-2032
- 6.4.1. Eastern Europe Polyoxin Market Analysis by Formulation: Introduction
- 6.4.2. Market Size Absolute $ Opportunity Analysis and Forecast, By Formulation, 2016-2032
- 6.4.3. Liquid Concentrates
- 6.4.4. Soluble Powders
- 6.4.5. Granules
- 6.4.6. Wettable Powders
- 6.4.7. Others
- 6.5. Eastern Europe Polyoxin Market Analysis, Opportunity and Forecast, By Application Method, 2016-2032
- 6.5.1. Eastern Europe Polyoxin Market Analysis by Application Method: Introduction
- 6.5.2. Market Size Absolute $ Opportunity Analysis and Forecast, By Application Method, 2016-2032
- 6.5.3. Foliar Spray
- 6.5.4. Seed Treatment
- 6.5.5. Soil Drench
- 6.5.6. Root Application
- 6.5.7. Others
- 6.6. Eastern Europe Polyoxin Market Analysis, Opportunity and Forecast, By End Users, 2016-2032
- 6.6.1. Eastern Europe Polyoxin Market Analysis by End Users: Introduction
- 6.6.2. Market Size Absolute $ Opportunity Analysis and Forecast, By End Users, 2016-2032
- 6.6.3. Agriculture
- 6.6.4. Horticulture
- 6.6.5. Forestry
- 6.6.6. Turf & Ornamentals
- 6.7. Eastern Europe Polyoxin Market Analysis, Opportunity and Forecast, By Country , 2016-2032
- 6.7.1. Eastern Europe Polyoxin Market Analysis by Country : Introduction
- 6.7.2. Market Size Absolute $ Opportunity Analysis and Forecast, Country , 2016-2032
- 6.7.2.1. Russia
- 6.7.2.2. Poland
- 6.7.2.3. The Czech Republic
- 6.7.2.4. Greece
- 6.7.2.5. Rest of Eastern Europe
- 7. APAC Polyoxin Market Analysis, Opportunity and Forecast, 2016-2032
- 7.1. APAC Polyoxin Market Analysis, 2016-2021
- 7.2. APAC Polyoxin Market Opportunity and Forecast, 2023-2032
- 7.3. APAC Polyoxin Market Analysis, Opportunity and Forecast, By Type of Polyoxin, 2016-2032
- 7.3.1. APAC Polyoxin Market Analysis by Type of Polyoxin: Introduction
- 7.3.2. Market Size Absolute $ Opportunity Analysis and Forecast, By Type of Polyoxin, 2016-2032
- 7.3.3. Polyoxin A
- 7.3.4. Polyoxin B
- 7.4. APAC Polyoxin Market Analysis, Opportunity and Forecast, By Formulation, 2016-2032
- 7.4.1. APAC Polyoxin Market Analysis by Formulation: Introduction
- 7.4.2. Market Size Absolute $ Opportunity Analysis and Forecast, By Formulation, 2016-2032
- 7.4.3. Liquid Concentrates
- 7.4.4. Soluble Powders
- 7.4.5. Granules
- 7.4.6. Wettable Powders
- 7.4.7. Others
- 7.5. APAC Polyoxin Market Analysis, Opportunity and Forecast, By Application Method, 2016-2032
- 7.5.1. APAC Polyoxin Market Analysis by Application Method: Introduction
- 7.5.2. Market Size Absolute $ Opportunity Analysis and Forecast, By Application Method, 2016-2032
- 7.5.3. Foliar Spray
- 7.5.4. Seed Treatment
- 7.5.5. Soil Drench
- 7.5.6. Root Application
- 7.5.7. Others
- 7.6. APAC Polyoxin Market Analysis, Opportunity and Forecast, By End Users, 2016-2032
- 7.6.1. APAC Polyoxin Market Analysis by End Users: Introduction
- 7.6.2. Market Size Absolute $ Opportunity Analysis and Forecast, By End Users, 2016-2032
- 7.6.3. Agriculture
- 7.6.4. Horticulture
- 7.6.5. Forestry
- 7.6.6. Turf & Ornamentals
- 7.7. APAC Polyoxin Market Analysis, Opportunity and Forecast, By Country , 2016-2032
- 7.7.1. APAC Polyoxin Market Analysis by Country : Introduction
- 7.7.2. Market Size Absolute $ Opportunity Analysis and Forecast, Country , 2016-2032
- 7.7.2.1. China
- 7.7.2.2. Japan
- 7.7.2.3. South Korea
- 7.7.2.4. India
- 7.7.2.5. Australia & New Zeland
- 7.7.2.6. Indonesia
- 7.7.2.7. Malaysia
- 7.7.2.8. Philippines
- 7.7.2.9. Singapore
- 7.7.2.10. Thailand
- 7.7.2.11. Vietnam
- 7.7.2.12. Rest of APAC
- 8. Latin America Polyoxin Market Analysis, Opportunity and Forecast, 2016-2032
- 8.1. Latin America Polyoxin Market Analysis, 2016-2021
- 8.2. Latin America Polyoxin Market Opportunity and Forecast, 2023-2032
- 8.3. Latin America Polyoxin Market Analysis, Opportunity and Forecast, By Type of Polyoxin, 2016-2032
- 8.3.1. Latin America Polyoxin Market Analysis by Type of Polyoxin: Introduction
- 8.3.2. Market Size Absolute $ Opportunity Analysis and Forecast, By Type of Polyoxin, 2016-2032
- 8.3.3. Polyoxin A
- 8.3.4. Polyoxin B
- 8.4. Latin America Polyoxin Market Analysis, Opportunity and Forecast, By Formulation, 2016-2032
- 8.4.1. Latin America Polyoxin Market Analysis by Formulation: Introduction
- 8.4.2. Market Size Absolute $ Opportunity Analysis and Forecast, By Formulation, 2016-2032
- 8.4.3. Liquid Concentrates
- 8.4.4. Soluble Powders
- 8.4.5. Granules
- 8.4.6. Wettable Powders
- 8.4.7. Others
- 8.5. Latin America Polyoxin Market Analysis, Opportunity and Forecast, By Application Method, 2016-2032
- 8.5.1. Latin America Polyoxin Market Analysis by Application Method: Introduction
- 8.5.2. Market Size Absolute $ Opportunity Analysis and Forecast, By Application Method, 2016-2032
- 8.5.3. Foliar Spray
- 8.5.4. Seed Treatment
- 8.5.5. Soil Drench
- 8.5.6. Root Application
- 8.5.7. Others
- 8.6. Latin America Polyoxin Market Analysis, Opportunity and Forecast, By End Users, 2016-2032
- 8.6.1. Latin America Polyoxin Market Analysis by End Users: Introduction
- 8.6.2. Market Size Absolute $ Opportunity Analysis and Forecast, By End Users, 2016-2032
- 8.6.3. Agriculture
- 8.6.4. Horticulture
- 8.6.5. Forestry
- 8.6.6. Turf & Ornamentals
- 8.7. Latin America Polyoxin Market Analysis, Opportunity and Forecast, By Country , 2016-2032
- 8.7.1. Latin America Polyoxin Market Analysis by Country : Introduction
- 8.7.2. Market Size Absolute $ Opportunity Analysis and Forecast, Country , 2016-2032
- 8.7.2.1. Brazil
- 8.7.2.2. Colombia
- 8.7.2.3. Chile
- 8.7.2.4. Argentina
- 8.7.2.5. Costa Rica
- 8.7.2.6. Rest of Latin America
- 9. Middle East & Africa Polyoxin Market Analysis, Opportunity and Forecast, 2016-2032
- 9.1. Middle East & Africa Polyoxin Market Analysis, 2016-2021
- 9.2. Middle East & Africa Polyoxin Market Opportunity and Forecast, 2023-2032
- 9.3. Middle East & Africa Polyoxin Market Analysis, Opportunity and Forecast, By Type of Polyoxin, 2016-2032
- 9.3.1. Middle East & Africa Polyoxin Market Analysis by Type of Polyoxin: Introduction
- 9.3.2. Market Size Absolute $ Opportunity Analysis and Forecast, By Type of Polyoxin, 2016-2032
- 9.3.3. Polyoxin A
- 9.3.4. Polyoxin B
- 9.4. Middle East & Africa Polyoxin Market Analysis, Opportunity and Forecast, By Formulation, 2016-2032
- 9.4.1. Middle East & Africa Polyoxin Market Analysis by Formulation: Introduction
- 9.4.2. Market Size Absolute $ Opportunity Analysis and Forecast, By Formulation, 2016-2032
- 9.4.3. Liquid Concentrates
- 9.4.4. Soluble Powders
- 9.4.5. Granules
- 9.4.6. Wettable Powders
- 9.4.7. Others
- 9.5. Middle East & Africa Polyoxin Market Analysis, Opportunity and Forecast, By Application Method, 2016-2032
- 9.5.1. Middle East & Africa Polyoxin Market Analysis by Application Method: Introduction
- 9.5.2. Market Size Absolute $ Opportunity Analysis and Forecast, By Application Method, 2016-2032
- 9.5.3. Foliar Spray
- 9.5.4. Seed Treatment
- 9.5.5. Soil Drench
- 9.5.6. Root Application
- 9.5.7. Others
- 9.6. Middle East & Africa Polyoxin Market Analysis, Opportunity and Forecast, By End Users, 2016-2032
- 9.6.1. Middle East & Africa Polyoxin Market Analysis by End Users: Introduction
- 9.6.2. Market Size Absolute $ Opportunity Analysis and Forecast, By End Users, 2016-2032
- 9.6.3. Agriculture
- 9.6.4. Horticulture
- 9.6.5. Forestry
- 9.6.6. Turf & Ornamentals
- 9.7. Middle East & Africa Polyoxin Market Analysis, Opportunity and Forecast, By Country , 2016-2032
- 9.7.1. Middle East & Africa Polyoxin Market Analysis by Country : Introduction
- 9.7.2. Market Size Absolute $ Opportunity Analysis and Forecast, Country , 2016-2032
- 9.7.2.1. Algeria
- 9.7.2.2. Egypt
- 9.7.2.3. Israel
- 9.7.2.4. Kuwait
- 9.7.2.5. Nigeria
- 9.7.2.6. Saudi Arabia
- 9.7.2.7. South Africa
- 9.7.2.8. Turkey
- 9.7.2.9. The UAE
- 9.7.2.10. Rest of MEA
- 10. Global Polyoxin Market Analysis, Opportunity and Forecast, By Region , 2016-2032
- 10.1. Global Polyoxin Market Analysis by Region : Introduction
- 10.2. Market Size Absolute $ Opportunity Analysis and Forecast, By Region , 2016-2032
- 10.2.1. North America
- 10.2.2. Western Europe
- 10.2.3. Eastern Europe
- 10.2.4. APAC
- 10.2.5. Latin America
- 10.2.6. Middle East & Africa
- 11. Global Polyoxin Market Competitive Landscape, Market Share Analysis, and Company Profiles
- 11.1. Market Share Analysis
- 11.2. Company Profiles
- 11.3. Cleary Chemical Corp.
- 11.3.1. Company Overview
- 11.3.2. Financial Highlights
- 11.3.3. Product Portfolio
- 11.3.4. SWOT Analysis
- 11.3.5. Key Strategies and Developments
- 11.4. Kaken Pharmaceutical Co., Ltd.
- 11.4.1. Company Overview
- 11.4.2. Financial Highlights
- 11.4.3. Product Portfolio
- 11.4.4. SWOT Analysis
- 11.4.5. Key Strategies and Developments
- 11.5. Jiangsu Fengyuan Bioengineering Co., Ltd.
- 11.5.1. Company Overview
- 11.5.2. Financial Highlights
- 11.5.3. Product Portfolio
- 11.5.4. SWOT Analysis
- 11.5.5. Key Strategies and Developments
- 11.6. Beijing Green Agrosino Co., Ltd.
- 11.6.1. Company Overview
- 11.6.2. Financial Highlights
- 11.6.3. Product Portfolio
- 11.6.4. SWOT Analysis
- 11.6.5. Key Strategies and Developments
- 11.7. Bayer AG
- 11.7.1. Company Overview
- 11.7.2. Financial Highlights
- 11.7.3. Product Portfolio
- 11.7.4. SWOT Analysis
- 11.7.5. Key Strategies and Developments
- 11.8. Amadis Chemical Company Limited
- 11.8.1. Company Overview
- 11.8.2. Financial Highlights
- 11.8.3. Product Portfolio
- 11.8.4. SWOT Analysis
- 11.8.5. Key Strategies and Developments
- 11.9. ANGUS Chemical Company
- 11.9.1. Company Overview
- 11.9.2. Financial Highlights
- 11.9.3. Product Portfolio
- 11.9.4. SWOT Analysis
- 11.9.5. Key Strategies and Developments
- 11.13.1. Company Overview
- 11.13.2. Financial Highlights
- 11.13.3. Product Portfolio
- 11.13.4. SWOT Analysis
- 11.13.5. Key Strategies and Developments
- 12. Assumptions and Acronyms
- 13. Research Methodology
- 14. Contact
- List of Figures
- Figure 1: Global Polyoxin Market Revenue (US$ Mn) Market Share by Type of Polyoxin in 2022
- Figure 2: Global Polyoxin Market Attractiveness Analysis by Type of Polyoxin, 2016-2032
- Figure 3: Global Polyoxin Market Revenue (US$ Mn) Market Share by Formulationin 2022
- Figure 4: Global Polyoxin Market Attractiveness Analysis by Formulation, 2016-2032
- Figure 5: Global Polyoxin Market Revenue (US$ Mn) Market Share by Application Methodin 2022
- Figure 6: Global Polyoxin Market Attractiveness Analysis by Application Method, 2016-2032
- Figure 7: Global Polyoxin Market Revenue (US$ Mn) Market Share by End Usersin 2022
- Figure 8: Global Polyoxin Market Attractiveness Analysis by End Users, 2016-2032
- Figure 9: Global Polyoxin Market Revenue (US$ Mn) Market Share by Region in 2022
- Figure 10: Global Polyoxin Market Attractiveness Analysis by Region, 2016-2032
- Figure 11: Global Polyoxin Market Revenue (US$ Mn) (2016-2032)
- Figure 12: Global Polyoxin Market Revenue (US$ Mn) Comparison by Region (2016-2032)
- Figure 13: Global Polyoxin Market Revenue (US$ Mn) Comparison by Type of Polyoxin (2016-2032)
- Figure 14: Global Polyoxin Market Revenue (US$ Mn) Comparison by Formulation (2016-2032)
- Figure 15: Global Polyoxin Market Revenue (US$ Mn) Comparison by Application Method (2016-2032)
- Figure 16: Global Polyoxin Market Revenue (US$ Mn) Comparison by End Users (2016-2032)
- Figure 17: Global Polyoxin Market Y-o-Y Growth Rate Comparison by Region (2016-2032)
- Figure 18: Global Polyoxin Market Y-o-Y Growth Rate Comparison by Type of Polyoxin (2016-2032)
- Figure 19: Global Polyoxin Market Y-o-Y Growth Rate Comparison by Formulation (2016-2032)
- Figure 20: Global Polyoxin Market Y-o-Y Growth Rate Comparison by Application Method (2016-2032)
- Figure 21: Global Polyoxin Market Y-o-Y Growth Rate Comparison by End Users (2016-2032)
- Figure 22: Global Polyoxin Market Share Comparison by Region (2016-2032)
- Figure 23: Global Polyoxin Market Share Comparison by Type of Polyoxin (2016-2032)
- Figure 24: Global Polyoxin Market Share Comparison by Formulation (2016-2032)
- Figure 25: Global Polyoxin Market Share Comparison by Application Method (2016-2032)
- Figure 26: Global Polyoxin Market Share Comparison by End Users (2016-2032)
- Figure 27: North America Polyoxin Market Revenue (US$ Mn) Market Share by Type of Polyoxinin 2022
- Figure 28: North America Polyoxin Market Attractiveness Analysis by Type of Polyoxin, 2016-2032
- Figure 29: North America Polyoxin Market Revenue (US$ Mn) Market Share by Formulationin 2022
- Figure 30: North America Polyoxin Market Attractiveness Analysis by Formulation, 2016-2032
- Figure 31: North America Polyoxin Market Revenue (US$ Mn) Market Share by Application Methodin 2022
- Figure 32: North America Polyoxin Market Attractiveness Analysis by Application Method, 2016-2032
- Figure 33: North America Polyoxin Market Revenue (US$ Mn) Market Share by End Usersin 2022
- Figure 34: North America Polyoxin Market Attractiveness Analysis by End Users, 2016-2032
- Figure 35: North America Polyoxin Market Revenue (US$ Mn) Market Share by Country in 2022
- Figure 36: North America Polyoxin Market Attractiveness Analysis by Country, 2016-2032
- Figure 37: North America Polyoxin Market Revenue (US$ Mn) (2016-2032)
- Figure 38: North America Polyoxin Market Revenue (US$ Mn) Comparison by Country (2016-2032)
- Figure 39: North America Polyoxin Market Revenue (US$ Mn) Comparison by Type of Polyoxin (2016-2032)
- Figure 40: North America Polyoxin Market Revenue (US$ Mn) Comparison by Formulation (2016-2032)
- Figure 41: North America Polyoxin Market Revenue (US$ Mn) Comparison by Application Method (2016-2032)
- Figure 42: North America Polyoxin Market Revenue (US$ Mn) Comparison by End Users (2016-2032)
- Figure 43: North America Polyoxin Market Y-o-Y Growth Rate Comparison by Country (2016-2032)
- Figure 44: North America Polyoxin Market Y-o-Y Growth Rate Comparison by Type of Polyoxin (2016-2032)
- Figure 45: North America Polyoxin Market Y-o-Y Growth Rate Comparison by Formulation (2016-2032)
- Figure 46: North America Polyoxin Market Y-o-Y Growth Rate Comparison by Application Method (2016-2032)
- Figure 47: North America Polyoxin Market Y-o-Y Growth Rate Comparison by End Users (2016-2032)
- Figure 48: North America Polyoxin Market Share Comparison by Country (2016-2032)
- Figure 49: North America Polyoxin Market Share Comparison by Type of Polyoxin (2016-2032)
- Figure 50: North America Polyoxin Market Share Comparison by Formulation (2016-2032)
- Figure 51: North America Polyoxin Market Share Comparison by Application Method (2016-2032)
- Figure 52: North America Polyoxin Market Share Comparison by End Users (2016-2032)
- Figure 53: Western Europe Polyoxin Market Revenue (US$ Mn) Market Share by Type of Polyoxinin 2022
- Figure 54: Western Europe Polyoxin Market Attractiveness Analysis by Type of Polyoxin, 2016-2032
- Figure 55: Western Europe Polyoxin Market Revenue (US$ Mn) Market Share by Formulationin 2022
- Figure 56: Western Europe Polyoxin Market Attractiveness Analysis by Formulation, 2016-2032
- Figure 57: Western Europe Polyoxin Market Revenue (US$ Mn) Market Share by Application Methodin 2022
- Figure 58: Western Europe Polyoxin Market Attractiveness Analysis by Application Method, 2016-2032
- Figure 59: Western Europe Polyoxin Market Revenue (US$ Mn) Market Share by End Usersin 2022
- Figure 60: Western Europe Polyoxin Market Attractiveness Analysis by End Users, 2016-2032
- Figure 61: Western Europe Polyoxin Market Revenue (US$ Mn) Market Share by Country in 2022
- Figure 62: Western Europe Polyoxin Market Attractiveness Analysis by Country, 2016-2032
- Figure 63: Western Europe Polyoxin Market Revenue (US$ Mn) (2016-2032)
- Figure 64: Western Europe Polyoxin Market Revenue (US$ Mn) Comparison by Country (2016-2032)
- Figure 65: Western Europe Polyoxin Market Revenue (US$ Mn) Comparison by Type of Polyoxin (2016-2032)
- Figure 66: Western Europe Polyoxin Market Revenue (US$ Mn) Comparison by Formulation (2016-2032)
- Figure 67: Western Europe Polyoxin Market Revenue (US$ Mn) Comparison by Application Method (2016-2032)
- Figure 68: Western Europe Polyoxin Market Revenue (US$ Mn) Comparison by End Users (2016-2032)
- Figure 69: Western Europe Polyoxin Market Y-o-Y Growth Rate Comparison by Country (2016-2032)
- Figure 70: Western Europe Polyoxin Market Y-o-Y Growth Rate Comparison by Type of Polyoxin (2016-2032)
- Figure 71: Western Europe Polyoxin Market Y-o-Y Growth Rate Comparison by Formulation (2016-2032)
- Figure 72: Western Europe Polyoxin Market Y-o-Y Growth Rate Comparison by Application Method (2016-2032)
- Figure 73: Western Europe Polyoxin Market Y-o-Y Growth Rate Comparison by End Users (2016-2032)
- Figure 74: Western Europe Polyoxin Market Share Comparison by Country (2016-2032)
- Figure 75: Western Europe Polyoxin Market Share Comparison by Type of Polyoxin (2016-2032)
- Figure 76: Western Europe Polyoxin Market Share Comparison by Formulation (2016-2032)
- Figure 77: Western Europe Polyoxin Market Share Comparison by Application Method (2016-2032)
- Figure 78: Western Europe Polyoxin Market Share Comparison by End Users (2016-2032)
- Figure 79: Eastern Europe Polyoxin Market Revenue (US$ Mn) Market Share by Type of Polyoxinin 2022
- Figure 80: Eastern Europe Polyoxin Market Attractiveness Analysis by Type of Polyoxin, 2016-2032
- Figure 81: Eastern Europe Polyoxin Market Revenue (US$ Mn) Market Share by Formulationin 2022
- Figure 82: Eastern Europe Polyoxin Market Attractiveness Analysis by Formulation, 2016-2032
- Figure 83: Eastern Europe Polyoxin Market Revenue (US$ Mn) Market Share by Application Methodin 2022
- Figure 84: Eastern Europe Polyoxin Market Attractiveness Analysis by Application Method, 2016-2032
- Figure 85: Eastern Europe Polyoxin Market Revenue (US$ Mn) Market Share by End Usersin 2022
- Figure 86: Eastern Europe Polyoxin Market Attractiveness Analysis by End Users, 2016-2032
- Figure 87: Eastern Europe Polyoxin Market Revenue (US$ Mn) Market Share by Country in 2022
- Figure 88: Eastern Europe Polyoxin Market Attractiveness Analysis by Country, 2016-2032
- Figure 89: Eastern Europe Polyoxin Market Revenue (US$ Mn) (2016-2032)
- Figure 90: Eastern Europe Polyoxin Market Revenue (US$ Mn) Comparison by Country (2016-2032)
- Figure 91: Eastern Europe Polyoxin Market Revenue (US$ Mn) Comparison by Type of Polyoxin (2016-2032)
- Figure 92: Eastern Europe Polyoxin Market Revenue (US$ Mn) Comparison by Formulation (2016-2032)
- Figure 93: Eastern Europe Polyoxin Market Revenue (US$ Mn) Comparison by Application Method (2016-2032)
- Figure 94: Eastern Europe Polyoxin Market Revenue (US$ Mn) Comparison by End Users (2016-2032)
- Figure 95: Eastern Europe Polyoxin Market Y-o-Y Growth Rate Comparison by Country (2016-2032)
- Figure 96: Eastern Europe Polyoxin Market Y-o-Y Growth Rate Comparison by Type of Polyoxin (2016-2032)
- Figure 97: Eastern Europe Polyoxin Market Y-o-Y Growth Rate Comparison by Formulation (2016-2032)
- Figure 98: Eastern Europe Polyoxin Market Y-o-Y Growth Rate Comparison by Application Method (2016-2032)
- Figure 99: Eastern Europe Polyoxin Market Y-o-Y Growth Rate Comparison by End Users (2016-2032)
- Figure 100: Eastern Europe Polyoxin Market Share Comparison by Country (2016-2032)
- Figure 101: Eastern Europe Polyoxin Market Share Comparison by Type of Polyoxin (2016-2032)
- Figure 102: Eastern Europe Polyoxin Market Share Comparison by Formulation (2016-2032)
- Figure 103: Eastern Europe Polyoxin Market Share Comparison by Application Method (2016-2032)
- Figure 104: Eastern Europe Polyoxin Market Share Comparison by End Users (2016-2032)
- Figure 105: APAC Polyoxin Market Revenue (US$ Mn) Market Share by Type of Polyoxinin 2022
- Figure 106: APAC Polyoxin Market Attractiveness Analysis by Type of Polyoxin, 2016-2032
- Figure 107: APAC Polyoxin Market Revenue (US$ Mn) Market Share by Formulationin 2022
- Figure 108: APAC Polyoxin Market Attractiveness Analysis by Formulation, 2016-2032
- Figure 109: APAC Polyoxin Market Revenue (US$ Mn) Market Share by Application Methodin 2022
- Figure 110: APAC Polyoxin Market Attractiveness Analysis by Application Method, 2016-2032
- Figure 111: APAC Polyoxin Market Revenue (US$ Mn) Market Share by End Usersin 2022
- Figure 112: APAC Polyoxin Market Attractiveness Analysis by End Users, 2016-2032
- Figure 113: APAC Polyoxin Market Revenue (US$ Mn) Market Share by Country in 2022
- Figure 114: APAC Polyoxin Market Attractiveness Analysis by Country, 2016-2032
- Figure 115: APAC Polyoxin Market Revenue (US$ Mn) (2016-2032)
- Figure 116: APAC Polyoxin Market Revenue (US$ Mn) Comparison by Country (2016-2032)
- Figure 117: APAC Polyoxin Market Revenue (US$ Mn) Comparison by Type of Polyoxin (2016-2032)
- Figure 118: APAC Polyoxin Market Revenue (US$ Mn) Comparison by Formulation (2016-2032)
- Figure 119: APAC Polyoxin Market Revenue (US$ Mn) Comparison by Application Method (2016-2032)
- Figure 120: APAC Polyoxin Market Revenue (US$ Mn) Comparison by End Users (2016-2032)
- Figure 121: APAC Polyoxin Market Y-o-Y Growth Rate Comparison by Country (2016-2032)
- Figure 122: APAC Polyoxin Market Y-o-Y Growth Rate Comparison by Type of Polyoxin (2016-2032)
- Figure 123: APAC Polyoxin Market Y-o-Y Growth Rate Comparison by Formulation (2016-2032)
- Figure 124: APAC Polyoxin Market Y-o-Y Growth Rate Comparison by Application Method (2016-2032)
- Figure 125: APAC Polyoxin Market Y-o-Y Growth Rate Comparison by End Users (2016-2032)
- Figure 126: APAC Polyoxin Market Share Comparison by Country (2016-2032)
- Figure 127: APAC Polyoxin Market Share Comparison by Type of Polyoxin (2016-2032)
- Figure 128: APAC Polyoxin Market Share Comparison by Formulation (2016-2032)
- Figure 129: APAC Polyoxin Market Share Comparison by Application Method (2016-2032)
- Figure 130: APAC Polyoxin Market Share Comparison by End Users (2016-2032)
- Figure 131: Latin America Polyoxin Market Revenue (US$ Mn) Market Share by Type of Polyoxinin 2022
- Figure 132: Latin America Polyoxin Market Attractiveness Analysis by Type of Polyoxin, 2016-2032
- Figure 133: Latin America Polyoxin Market Revenue (US$ Mn) Market Share by Formulationin 2022
- Figure 134: Latin America Polyoxin Market Attractiveness Analysis by Formulation, 2016-2032
- Figure 135: Latin America Polyoxin Market Revenue (US$ Mn) Market Share by Application Methodin 2022
- Figure 136: Latin America Polyoxin Market Attractiveness Analysis by Application Method, 2016-2032
- Figure 137: Latin America Polyoxin Market Revenue (US$ Mn) Market Share by End Usersin 2022
- Figure 138: Latin America Polyoxin Market Attractiveness Analysis by End Users, 2016-2032
- Figure 139: Latin America Polyoxin Market Revenue (US$ Mn) Market Share by Country in 2022
- Figure 140: Latin America Polyoxin Market Attractiveness Analysis by Country, 2016-2032
- Figure 141: Latin America Polyoxin Market Revenue (US$ Mn) (2016-2032)
- Figure 142: Latin America Polyoxin Market Revenue (US$ Mn) Comparison by Country (2016-2032)
- Figure 143: Latin America Polyoxin Market Revenue (US$ Mn) Comparison by Type of Polyoxin (2016-2032)
- Figure 144: Latin America Polyoxin Market Revenue (US$ Mn) Comparison by Formulation (2016-2032)
- Figure 145: Latin America Polyoxin Market Revenue (US$ Mn) Comparison by Application Method (2016-2032)
- Figure 146: Latin America Polyoxin Market Revenue (US$ Mn) Comparison by End Users (2016-2032)
- Figure 147: Latin America Polyoxin Market Y-o-Y Growth Rate Comparison by Country (2016-2032)
- Figure 148: Latin America Polyoxin Market Y-o-Y Growth Rate Comparison by Type of Polyoxin (2016-2032)
- Figure 149: Latin America Polyoxin Market Y-o-Y Growth Rate Comparison by Formulation (2016-2032)
- Figure 150: Latin America Polyoxin Market Y-o-Y Growth Rate Comparison by Application Method (2016-2032)
- Figure 151: Latin America Polyoxin Market Y-o-Y Growth Rate Comparison by End Users (2016-2032)
- Figure 152: Latin America Polyoxin Market Share Comparison by Country (2016-2032)
- Figure 153: Latin America Polyoxin Market Share Comparison by Type of Polyoxin (2016-2032)
- Figure 154: Latin America Polyoxin Market Share Comparison by Formulation (2016-2032)
- Figure 155: Latin America Polyoxin Market Share Comparison by Application Method (2016-2032)
- Figure 156: Latin America Polyoxin Market Share Comparison by End Users (2016-2032)
- Figure 157: Middle East & Africa Polyoxin Market Revenue (US$ Mn) Market Share by Type of Polyoxinin 2022
- Figure 158: Middle East & Africa Polyoxin Market Attractiveness Analysis by Type of Polyoxin, 2016-2032
- Figure 159: Middle East & Africa Polyoxin Market Revenue (US$ Mn) Market Share by Formulationin 2022
- Figure 160: Middle East & Africa Polyoxin Market Attractiveness Analysis by Formulation, 2016-2032
- Figure 161: Middle East & Africa Polyoxin Market Revenue (US$ Mn) Market Share by Application Methodin 2022
- Figure 162: Middle East & Africa Polyoxin Market Attractiveness Analysis by Application Method, 2016-2032
- Figure 163: Middle East & Africa Polyoxin Market Revenue (US$ Mn) Market Share by End Usersin 2022
- Figure 164: Middle East & Africa Polyoxin Market Attractiveness Analysis by End Users, 2016-2032
- Figure 165: Middle East & Africa Polyoxin Market Revenue (US$ Mn) Market Share by Country in 2022
- Figure 166: Middle East & Africa Polyoxin Market Attractiveness Analysis by Country, 2016-2032
- Figure 167: Middle East & Africa Polyoxin Market Revenue (US$ Mn) (2016-2032)
- Figure 168: Middle East & Africa Polyoxin Market Revenue (US$ Mn) Comparison by Country (2016-2032)
- Figure 169: Middle East & Africa Polyoxin Market Revenue (US$ Mn) Comparison by Type of Polyoxin (2016-2032)
- Figure 170: Middle East & Africa Polyoxin Market Revenue (US$ Mn) Comparison by Formulation (2016-2032)
- Figure 171: Middle East & Africa Polyoxin Market Revenue (US$ Mn) Comparison by Application Method (2016-2032)
- Figure 172: Middle East & Africa Polyoxin Market Revenue (US$ Mn) Comparison by End Users (2016-2032)
- Figure 173: Middle East & Africa Polyoxin Market Y-o-Y Growth Rate Comparison by Country (2016-2032)
- Figure 174: Middle East & Africa Polyoxin Market Y-o-Y Growth Rate Comparison by Type of Polyoxin (2016-2032)
- Figure 175: Middle East & Africa Polyoxin Market Y-o-Y Growth Rate Comparison by Formulation (2016-2032)
- Figure 176: Middle East & Africa Polyoxin Market Y-o-Y Growth Rate Comparison by Application Method (2016-2032)
- Figure 177: Middle East & Africa Polyoxin Market Y-o-Y Growth Rate Comparison by End Users (2016-2032)
- Figure 178: Middle East & Africa Polyoxin Market Share Comparison by Country (2016-2032)
- Figure 179: Middle East & Africa Polyoxin Market Share Comparison by Type of Polyoxin (2016-2032)
- Figure 180: Middle East & Africa Polyoxin Market Share Comparison by Formulation (2016-2032)
- Figure 181: Middle East & Africa Polyoxin Market Share Comparison by Application Method (2016-2032)
- Figure 182: Middle East & Africa Polyoxin Market Share Comparison by End Users (2016-2032)
- List of Tables
- Table 1: Global Polyoxin Market Comparison by Type of Polyoxin (2016-2032)
- Table 2: Global Polyoxin Market Comparison by Formulation (2016-2032)
- Table 3: Global Polyoxin Market Comparison by Application Method (2016-2032)
- Table 4: Global Polyoxin Market Comparison by End Users (2016-2032)
- Table 5: Global Polyoxin Market Revenue (US$ Mn) Comparison by Region (2016-2032)
- Table 6: Global Polyoxin Market Revenue (US$ Mn) (2016-2032)
- Table 7: Global Polyoxin Market Revenue (US$ Mn) Comparison by Region (2016-2032)
- Table 8: Global Polyoxin Market Revenue (US$ Mn) Comparison by Type of Polyoxin (2016-2032)
- Table 9: Global Polyoxin Market Revenue (US$ Mn) Comparison by Formulation (2016-2032)
- Table 10: Global Polyoxin Market Revenue (US$ Mn) Comparison by Application Method (2016-2032)
- Table 11: Global Polyoxin Market Revenue (US$ Mn) Comparison by End Users (2016-2032)
- Table 12: Global Polyoxin Market Y-o-Y Growth Rate Comparison by Region (2016-2032)
- Table 13: Global Polyoxin Market Y-o-Y Growth Rate Comparison by Type of Polyoxin (2016-2032)
- Table 14: Global Polyoxin Market Y-o-Y Growth Rate Comparison by Formulation (2016-2032)
- Table 15: Global Polyoxin Market Y-o-Y Growth Rate Comparison by Application Method (2016-2032)
- Table 16: Global Polyoxin Market Y-o-Y Growth Rate Comparison by End Users (2016-2032)
- Table 17: Global Polyoxin Market Share Comparison by Region (2016-2032)
- Table 18: Global Polyoxin Market Share Comparison by Type of Polyoxin (2016-2032)
- Table 19: Global Polyoxin Market Share Comparison by Formulation (2016-2032)
- Table 20: Global Polyoxin Market Share Comparison by Application Method (2016-2032)
- Table 21: Global Polyoxin Market Share Comparison by End Users (2016-2032)
- Table 22: North America Polyoxin Market Comparison by Formulation (2016-2032)
- Table 23: North America Polyoxin Market Comparison by Application Method (2016-2032)
- Table 24: North America Polyoxin Market Comparison by End Users (2016-2032)
- Table 25: North America Polyoxin Market Revenue (US$ Mn) Comparison by Country (2016-2032)
- Table 26: North America Polyoxin Market Revenue (US$ Mn) (2016-2032)
- Table 27: North America Polyoxin Market Revenue (US$ Mn) Comparison by Country (2016-2032)
- Table 28: North America Polyoxin Market Revenue (US$ Mn) Comparison by Type of Polyoxin (2016-2032)
- Table 29: North America Polyoxin Market Revenue (US$ Mn) Comparison by Formulation (2016-2032)
- Table 30: North America Polyoxin Market Revenue (US$ Mn) Comparison by Application Method (2016-2032)
- Table 31: North America Polyoxin Market Revenue (US$ Mn) Comparison by End Users (2016-2032)
- Table 32: North America Polyoxin Market Y-o-Y Growth Rate Comparison by Country (2016-2032)
- Table 33: North America Polyoxin Market Y-o-Y Growth Rate Comparison by Type of Polyoxin (2016-2032)
- Table 34: North America Polyoxin Market Y-o-Y Growth Rate Comparison by Formulation (2016-2032)
- Table 35: North America Polyoxin Market Y-o-Y Growth Rate Comparison by Application Method (2016-2032)
- Table 36: North America Polyoxin Market Y-o-Y Growth Rate Comparison by End Users (2016-2032)
- Table 37: North America Polyoxin Market Share Comparison by Country (2016-2032)
- Table 38: North America Polyoxin Market Share Comparison by Type of Polyoxin (2016-2032)
- Table 39: North America Polyoxin Market Share Comparison by Formulation (2016-2032)
- Table 40: North America Polyoxin Market Share Comparison by Application Method (2016-2032)
- Table 41: North America Polyoxin Market Share Comparison by End Users (2016-2032)
- Table 42: Western Europe Polyoxin Market Comparison by Type of Polyoxin (2016-2032)
- Table 43: Western Europe Polyoxin Market Comparison by Formulation (2016-2032)
- Table 44: Western Europe Polyoxin Market Comparison by Application Method (2016-2032)
- Table 45: Western Europe Polyoxin Market Comparison by End Users (2016-2032)
- Table 46: Western Europe Polyoxin Market Revenue (US$ Mn) Comparison by Country (2016-2032)
- Table 47: Western Europe Polyoxin Market Revenue (US$ Mn) (2016-2032)
- Table 48: Western Europe Polyoxin Market Revenue (US$ Mn) Comparison by Country (2016-2032)
- Table 49: Western Europe Polyoxin Market Revenue (US$ Mn) Comparison by Type of Polyoxin (2016-2032)
- Table 50: Western Europe Polyoxin Market Revenue (US$ Mn) Comparison by Formulation (2016-2032)
- Table 51: Western Europe Polyoxin Market Revenue (US$ Mn) Comparison by Application Method (2016-2032)
- Table 52: Western Europe Polyoxin Market Revenue (US$ Mn) Comparison by End Users (2016-2032)
- Table 53: Western Europe Polyoxin Market Y-o-Y Growth Rate Comparison by Country (2016-2032)
- Table 54: Western Europe Polyoxin Market Y-o-Y Growth Rate Comparison by Type of Polyoxin (2016-2032)
- Table 55: Western Europe Polyoxin Market Y-o-Y Growth Rate Comparison by Formulation (2016-2032)
- Table 56: Western Europe Polyoxin Market Y-o-Y Growth Rate Comparison by Application Method (2016-2032)
- Table 57: Western Europe Polyoxin Market Y-o-Y Growth Rate Comparison by End Users (2016-2032)
- Table 58: Western Europe Polyoxin Market Share Comparison by Country (2016-2032)
- Table 59: Western Europe Polyoxin Market Share Comparison by Type of Polyoxin (2016-2032)
- Table 60: Western Europe Polyoxin Market Share Comparison by Formulation (2016-2032)
- Table 61: Western Europe Polyoxin Market Share Comparison by Application Method (2016-2032)
- Table 62: Western Europe Polyoxin Market Share Comparison by End Users (2016-2032)
- Table 63: Eastern Europe Polyoxin Market Comparison by Type of Polyoxin (2016-2032)
- Table 64: Eastern Europe Polyoxin Market Comparison by Formulation (2016-2032)
- Table 65: Eastern Europe Polyoxin Market Comparison by Application Method (2016-2032)
- Table 66: Eastern Europe Polyoxin Market Comparison by End Users (2016-2032)
- Table 67: Eastern Europe Polyoxin Market Revenue (US$ Mn) Comparison by Country (2016-2032)
- Table 68: Eastern Europe Polyoxin Market Revenue (US$ Mn) (2016-2032)
- Table 69: Eastern Europe Polyoxin Market Revenue (US$ Mn) Comparison by Country (2016-2032)
- Table 70: Eastern Europe Polyoxin Market Revenue (US$ Mn) Comparison by Type of Polyoxin (2016-2032)
- Table 71: Eastern Europe Polyoxin Market Revenue (US$ Mn) Comparison by Formulation (2016-2032)
- Table 72: Eastern Europe Polyoxin Market Revenue (US$ Mn) Comparison by Application Method (2016-2032)
- Table 73: Eastern Europe Polyoxin Market Revenue (US$ Mn) Comparison by End Users (2016-2032)
- Table 74: Eastern Europe Polyoxin Market Y-o-Y Growth Rate Comparison by Country (2016-2032)
- Table 75: Eastern Europe Polyoxin Market Y-o-Y Growth Rate Comparison by Type of Polyoxin (2016-2032)
- Table 76: Eastern Europe Polyoxin Market Y-o-Y Growth Rate Comparison by Formulation (2016-2032)
- Table 77: Eastern Europe Polyoxin Market Y-o-Y Growth Rate Comparison by Application Method (2016-2032)
- Table 78: Eastern Europe Polyoxin Market Y-o-Y Growth Rate Comparison by End Users (2016-2032)
- Table 79: Eastern Europe Polyoxin Market Share Comparison by Country (2016-2032)
- Table 80: Eastern Europe Polyoxin Market Share Comparison by Type of Polyoxin (2016-2032)
- Table 81: Eastern Europe Polyoxin Market Share Comparison by Formulation (2016-2032)
- Table 82: Eastern Europe Polyoxin Market Share Comparison by Application Method (2016-2032)
- Table 83: Eastern Europe Polyoxin Market Share Comparison by End Users (2016-2032)
- Table 84: APAC Polyoxin Market Comparison by Type of Polyoxin (2016-2032)
- Table 85: APAC Polyoxin Market Comparison by Formulation (2016-2032)
- Table 86: APAC Polyoxin Market Comparison by Application Method (2016-2032)
- Table 87: APAC Polyoxin Market Comparison by End Users (2016-2032)
- Table 88: APAC Polyoxin Market Revenue (US$ Mn) Comparison by Country (2016-2032)
- Table 89: APAC Polyoxin Market Revenue (US$ Mn) (2016-2032)
- Table 90: APAC Polyoxin Market Revenue (US$ Mn) Comparison by Country (2016-2032)
- Table 91: APAC Polyoxin Market Revenue (US$ Mn) Comparison by Type of Polyoxin (2016-2032)
- Table 92: APAC Polyoxin Market Revenue (US$ Mn) Comparison by Formulation (2016-2032)
- Table 93: APAC Polyoxin Market Revenue (US$ Mn) Comparison by Application Method (2016-2032)
- Table 94: APAC Polyoxin Market Revenue (US$ Mn) Comparison by End Users (2016-2032)
- Table 95: APAC Polyoxin Market Y-o-Y Growth Rate Comparison by Country (2016-2032)
- Table 96: APAC Polyoxin Market Y-o-Y Growth Rate Comparison by Type of Polyoxin (2016-2032)
- Table 97: APAC Polyoxin Market Y-o-Y Growth Rate Comparison by Formulation (2016-2032)
- Table 98: APAC Polyoxin Market Y-o-Y Growth Rate Comparison by Application Method (2016-2032)
- Table 99: APAC Polyoxin Market Y-o-Y Growth Rate Comparison by End Users (2016-2032)
- Table 100: APAC Polyoxin Market Share Comparison by Country (2016-2032)
- Table 101: APAC Polyoxin Market Share Comparison by Type of Polyoxin (2016-2032)
- Table 102: APAC Polyoxin Market Share Comparison by Formulation (2016-2032)
- Table 103: APAC Polyoxin Market Share Comparison by Application Method (2016-2032)
- Table 104: APAC Polyoxin Market Share Comparison by End Users (2016-2032)
- Table 105: Latin America Polyoxin Market Comparison by Type of Polyoxin (2016-2032)
- Table 106: Latin America Polyoxin Market Comparison by Formulation (2016-2032)
- Table 107: Latin America Polyoxin Market Comparison by Application Method (2016-2032)
- Table 108: Latin America Polyoxin Market Comparison by End Users (2016-2032)
- Table 109: Latin America Polyoxin Market Revenue (US$ Mn) Comparison by Country (2016-2032)
- Table 110: Latin America Polyoxin Market Revenue (US$ Mn) (2016-2032)
- Table 111: Latin America Polyoxin Market Revenue (US$ Mn) Comparison by Country (2016-2032)
- Table 112: Latin America Polyoxin Market Revenue (US$ Mn) Comparison by Type of Polyoxin (2016-2032)
- Table 113: Latin America Polyoxin Market Revenue (US$ Mn) Comparison by Formulation (2016-2032)
- Table 114: Latin America Polyoxin Market Revenue (US$ Mn) Comparison by Application Method (2016-2032)
- Table 115: Latin America Polyoxin Market Revenue (US$ Mn) Comparison by End Users (2016-2032)
- Table 116: Latin America Polyoxin Market Y-o-Y Growth Rate Comparison by Country (2016-2032)
- Table 117: Latin America Polyoxin Market Y-o-Y Growth Rate Comparison by Type of Polyoxin (2016-2032)
- Table 118: Latin America Polyoxin Market Y-o-Y Growth Rate Comparison by Formulation (2016-2032)
- Table 119: Latin America Polyoxin Market Y-o-Y Growth Rate Comparison by Application Method (2016-2032)
- Table 120: Latin America Polyoxin Market Y-o-Y Growth Rate Comparison by End Users (2016-2032)
- Table 121: Latin America Polyoxin Market Share Comparison by Country (2016-2032)
- Table 122: Latin America Polyoxin Market Share Comparison by Type of Polyoxin (2016-2032)
- Table 123: Latin America Polyoxin Market Share Comparison by Formulation (2016-2032)
- Table 124: Latin America Polyoxin Market Share Comparison by Application Method (2016-2032)
- Table 125: Latin America Polyoxin Market Share Comparison by End Users (2016-2032)
- Table 126: Middle East & Africa Polyoxin Market Comparison by Type of Polyoxin (2016-2032)
- Table 127: Middle East & Africa Polyoxin Market Comparison by Formulation (2016-2032)
- Table 128: Middle East & Africa Polyoxin Market Comparison by Application Method (2016-2032)
- Table 129: Middle East & Africa Polyoxin Market Comparison by End Users (2016-2032)
- Table 130: Middle East & Africa Polyoxin Market Revenue (US$ Mn) Comparison by Country (2016-2032)
- Table 131: Middle East & Africa Polyoxin Market Revenue (US$ Mn) (2016-2032)
- Table 132: Middle East & Africa Polyoxin Market Revenue (US$ Mn) Comparison by Country (2016-2032)
- Table 133: Middle East & Africa Polyoxin Market Revenue (US$ Mn) Comparison by Type of Polyoxin (2016-2032)
- Table 134: Middle East & Africa Polyoxin Market Revenue (US$ Mn) Comparison by Formulation (2016-2032)
- Table 135: Middle East & Africa Polyoxin Market Revenue (US$ Mn) Comparison by Application Method (2016-2032)
- Table 136: Middle East & Africa Polyoxin Market Revenue (US$ Mn) Comparison by End Users (2016-2032)
- Table 137: Middle East & Africa Polyoxin Market Y-o-Y Growth Rate Comparison by Country (2016-2032)
- Table 138: Middle East & Africa Polyoxin Market Y-o-Y Growth Rate Comparison by Type of Polyoxin (2016-2032)
- Table 139: Middle East & Africa Polyoxin Market Y-o-Y Growth Rate Comparison by Formulation (2016-2032)
- Table 140: Middle East & Africa Polyoxin Market Y-o-Y Growth Rate Comparison by Application Method (2016-2032)
- Table 141: Middle East & Africa Polyoxin Market Y-o-Y Growth Rate Comparison by End Users (2016-2032)
- Table 142: Middle East & Africa Polyoxin Market Share Comparison by Country (2016-2032)
- Table 143: Middle East & Africa Polyoxin Market Share Comparison by Type of Polyoxin (2016-2032)
- Table 144: Middle East & Africa Polyoxin Market Share Comparison by Formulation (2016-2032)
- Table 145: Middle East & Africa Polyoxin Market Share Comparison by Application Method (2016-2032)
- Table 146: Middle East & Africa Polyoxin Market Share Comparison by End Users (2016-2032)
- 1. Executive Summary
-
- Cleary Chemical Corp.
- Kaken Pharmaceutical Co., Ltd.
- Jiangsu Fengyuan Bioengineering Co., Ltd.
- Beijing Green Agrosino Co., Ltd.
- Bayer AG
- Amadis Chemical Company Limited
- ANGUS Chemical Company
Our Clients


View Our Licence Options
