Mulberry Market By Product Type (Black, Red, White), By Nature (Organic, Conventional), By Form ( Fruit, Raw/Fresh, Processed, Others), By End-Use (Households, Food Service, Food Industry, Other) By Region And Companies - Industry Segment Outlook, Market Assessment, Competition Scenario, Trends, And Forecast 2023-2032
4962
Jul 2023
183
Report Overview
Mulberry Market size is expected to be worth around USD 56.4 Bn by 2032 from USD 36.7 Bn in 2022, growing at a CAGR of 4.5% during the forecast period from 2023 to 2032.
The mulberry market, a fascinating realm revolving around the intricate cultivation, production, and distribution of these delectable berries, has a captivating history of diverse applications. Mulberry has long been revered in traditional medicine for their extraordinary antioxidant and anti-inflammatory properties. In 2022, the food service sector remained a significant contributor to Mulberry's global revenue and continued to serve as the principal market for the company.
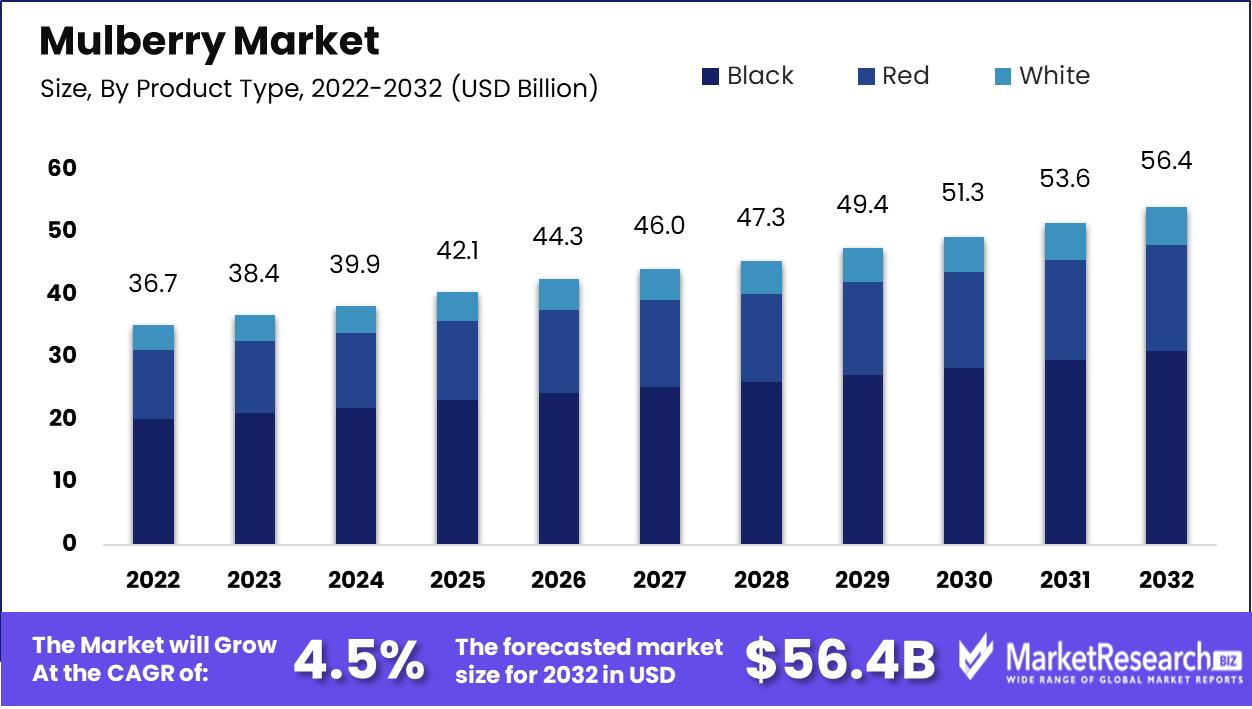
The allure of mulberries has extended far beyond the realm of medicine, making a significant impact on the ever-evolving food and beverage industry. Their vibrant essence has been ingeniously captured in various forms, including juices, teas, jams, and more. This dynamic environment anticipates a substantial increase in market size in the coming years, driven by the convergence of rising demand and innovative technological developments.
Mulberries boast a nutritional profile that underscores their popularity. They are rich in essential vitamins such as A, C, and E, and contain an array of vital minerals including iron, potassium, and calcium. Furthermore, the presence of anthocyanins, captivating plant pigments imbued with the tenacity of antioxidants, endows these berries with the inherent capacity to protect our precious cells from harm.
An exciting development emerged in the world of mulberries in 2023. Habitera Farms, located in Brentwood, California, introduced Himalayan purple mulberries to the American public. These unique mulberries are now being cultivated and made available to the public as an attractive alternative to cherries at U-pick farms in the Bay Area.
Moreover, the mulberry industry has witnessed innovation in supply chain management. In Thailand, a new supply chain model for fresh mulberries has been established. This model incorporates active packaging technology, which extends the shelf life of mulberries and preserves their freshness. This breakthrough ensures that consumers can enjoy the goodness of mulberries for longer periods while reducing food waste.
Driving factors
Emphasis on Nutrient-Dense Foods
As nutrition research demonstrates the disease-fighting power of foods dense in vitamins, minerals and antioxidants, mulberries have gained popularity. Overflowing with iron, calcium, vitamin C, fiber and resveratrol, mulberries deliver a mega-dose of nutrients in each serving. Their ability to provide natural nourishment aligns with consumer desires for functional superfoods.
Expansion of Plant-Based Diets
In the quest for wholesome plant-based nourishment, more people are discovering mulberries. With a trove of key nutrients and a sweet, succulent taste, mulberries offer the perfect solution for vegetarians, vegans, and flexitarians seeking to boost nutritional intake from fruit and vegetable sources. Their versatility also allows easy incorporation into plant-forward recipes.
Focus on Gut Health
The growing interest in gut health and microbiome nutrition emphasizes mulberries' potential even more. Their high fiber and antioxidant content promotes good digestion and gut flora. Mulberries also contain anthocyanins, which may help reduce inflammation in the gut lining. Mulberries are an appealing and delicious option for consumers looking for microbiome-nourishing foods.
Restraining Factors
Perishability Hampers Mulberry Distribution
Mulberries are highly perishable fruits and have a short shelf life. They are susceptible to bruising, mold, and spoilage, which makes it challenging to store and transport them over long distances. This limits the distribution and market reach of fresh mulberries.
Limited Geographic Distribution
Mulberry trees flourish in specific geographic regions that offer the ideal climate conditions for their growth. This constrained geographical distribution can lead to disparities in market share and hinder the accessibility of fresh mulberries in regions where the fruit is not cultivated.
Fluctuations in Raw Material prices affecting production costs
The production process entails numerous steps, and cost is a significant constraint that mulberry producers and businesses must overcome. Pruning season is essential for producing high-quality foliage utilized to feed silkworms. The climate throughout the year, especially during the monsoon season, can have a significant impact on the growth cycle of mulberry plants, diminishing it or causing plant diseases, which can increase production costs. In addition, the volatile nature of unprocessed silk and the unpredictability of the foreign exchange rate can make it challenging for mulberry businesses to control production costs.
Product Type Analysis
Black mulberries include mulberries with dark, almost black, coloration. They are known for their intense sweetness and unique flavor profile. Target consumers for black mulberries may include those who appreciate rich, sweet fruits and are looking for antioxidant-rich options.
Red mulberries are characterized by their vibrant red or purple color. They are known for their sweet and slightly tart taste. This segment may attract consumers who prefer a balance between sweetness and tanginess in their fruits.
White mulberries have a pale color and a mild, sweet flavor. They are often used in various culinary applications. This segment may appeal to consumers who seek a subtler taste or use mulberries for cooking and baking.
By Nature Analysis
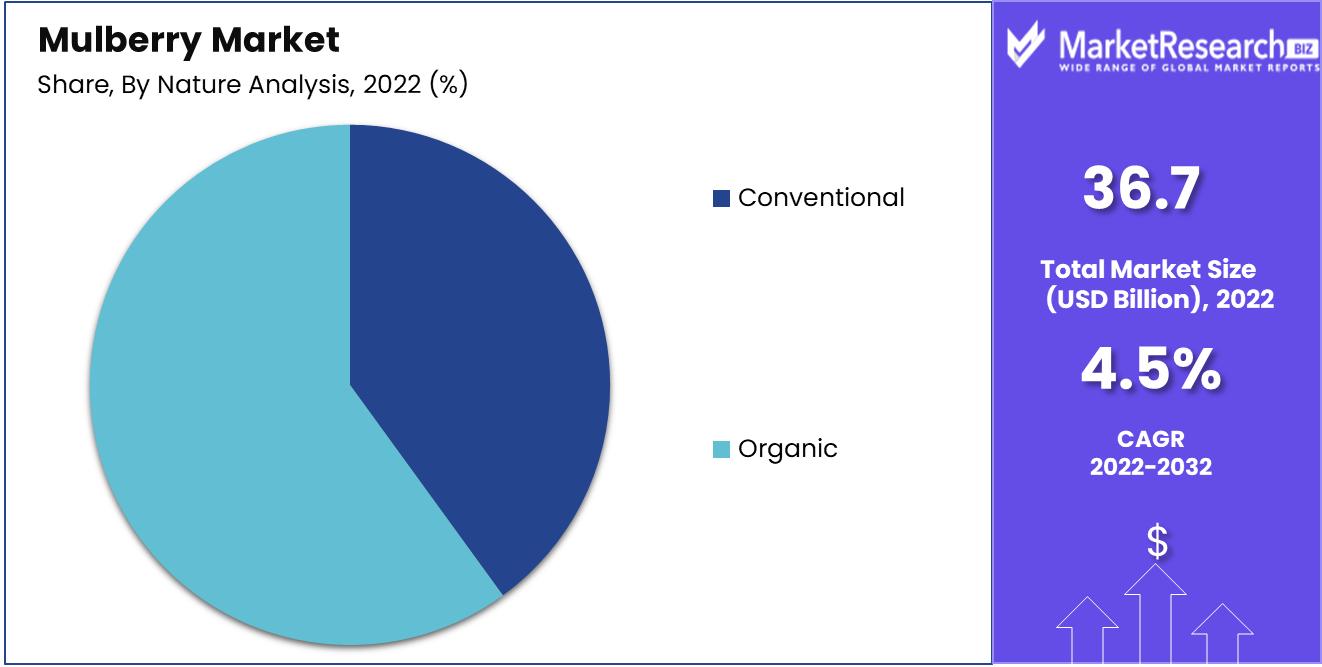
Organic mulberries are grown without synthetic pesticides or fertilizers, making them a choice for consumers who prioritize environmental sustainability and chemical-free food. This segment may appeal to health-conscious individuals and eco-conscious consumers.
Conventional mulberries are grown using traditional farming methods that may involve the use of synthetic chemicals. This segment may cater to a broader consumer base looking for affordability and accessibility.
Key Market Segments
By Product Type
- Black
- Red
- White
By Nature
- Organic
- Conventional
By Form
- Fruit
- Raw/Fresh
- Processed
- Frozen/Chilled
- Canned
- Dehydrated
- Pulp
- Leaves
- Leaf Extract
By End-Use
- Households
- Food Service
- Food Industry
- Bakery & Confectionary
- Convenience food
- Jams, jellies, and pickles
- Dressings, dips, and condiments
- Others (Frozen desserts, Snacks & Cereals)
- Infant formula
- Sports Nutrition
- Beverage Industry
- Dietary supplements
- Animal feed
- Pharmaceutical Industry
- Personal Care & Cosmetics
Growth Opportunity
Growing Interest in Sustainable and Organic Farming
Consumers are becoming increasingly conscious of the environmental impact of their food choices. As a result, there is a rising demand for organic and sustainably grown products. Mulberries are well-suited to organic cultivation methods, and producers who can meet this demand are likely to find significant growth opportunities.
Diversification of Mulberry Product Offerings
Innovation in mulberry-based products is on the rise. Beyond fresh and dried mulberries, there is potential for the development of mulberry jams, juices, teas, and even mulberry-based desserts. Diversifying product offerings can attract new customer segments and boost market growth.
Latest Trends
Expanding Product Range:
Manufacturers are capitalizing on the versatility of mulberries by incorporating them into a wide range of food products. For example, mulberries are used in energy bars and snacks to enhance flavor and nutrition. Additionally, they are blended into smoothies, added to yogurt and cereals, and even used as a base for jams and spreads, contributing to a diverse product landscape.
Globalization of the Market:
The globalization of the mulberry market has expanded its reach and accessibility. Mulberries are now sourced and sold internationally, leading to cross-cultural culinary exchanges and innovations. This globalization is also prompting investments in transportation and logistics to ensure fresh mulberries are available in diverse markets.
Rise in Mulberry-Based Supplements:
Mulberry leaf extracts and supplements are being marketed for their potential health benefits, particularly in managing blood sugar levels. The compounds in mulberry leaves, like DNJ (1-deoxynojirimycin), have been studied for their ability to inhibit carbohydrate absorption and support weight management, attracting consumers looking for natural ways to improve their health.
Regional Analysis
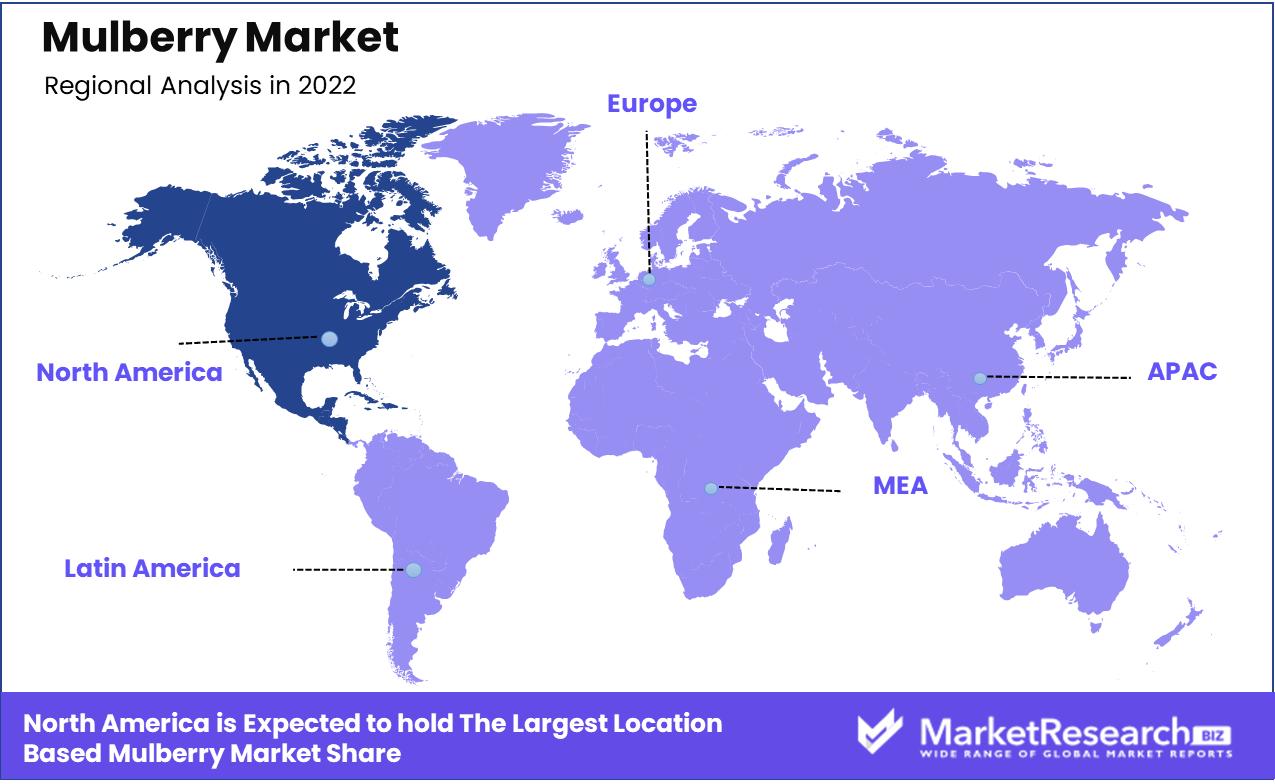
North America will represent more than 78% of the global market for mulberries. The United States is the region's primary market driver, followed by Canada. Increasing demand for mulberry leaves as a dietary supplement is a significant factor driving the North American market. Mulberry leaves are an excellent source of antioxidants, vitamins, and minerals, and they have been shown to have a number of health benefits, such as lowering blood sugar levels, improving cholesterol levels, and boosting the immune system.
Another factor driving the market in North America is the growing popularity of superfruits. Mulberries are considered a superfruit, and their use in a variety of culinary and beverage products is on the rise. A major factor driving the market in the region is the growing awareness of the medicinal properties of mulberries. Mulberries have been shown to have a number of health benefits, such as lowering the risk of cancer, enhancing heart health, and boosting the immune system.
In the coming years, the North American mulberry market is anticipated to expand due to the rising demand for mulberry leaves as a dietary supplement, the rising prevalence of super fruits, and the growing awareness of mulberries' medicinal properties.
Key Regions and Countries
North America
- US
- Canada
- Mexico
Western Europe
- Germany
- France
- The UK
- Spain
- Italy
- Portugal
- Ireland
- Austria
- Switzerland
- Benelux
- Nordic
- Rest of Western Europe
Eastern Europe
- Russia
- Poland
- The Czech Republic
- Greece
- Rest of Eastern Europe
APAC
- China
- Japan
- South Korea
- India
- Australia & New Zealand
- Indonesia
- Malaysia
- Philippines
- Singapore
- Thailand
- Vietnam
- Rest of APAC
Latin America
- Brazil
- Colombia
- Chile
- Argentina
- Costa Rica
- Rest of Latin America
Middle East & Africa
- Algeria
- Egypt
- Israel
- Kuwait
- Nigeria
- Saudi Arabia
- South Africa
- Turkey
- United Arab Emirates
- Rest of MEA
Key Players Analysis
Bolt Threads is a biotechnology company that focuses on engineering proteins inspired by nature to create novel materials. They have developed the "Mylo" technology, which generates a sustainable leather substitute from mycelium, the root structure of mushrooms, which can be sourced from mulberry tree waste.
Novartis is a multinational pharmaceutical company that engages in research, development, and manufacturing of a diverse array of healthcare products. They have invested in mulberry-based medications and therapies, particularly in the field of diabetes management, capitalizing on the ability of mulberry leaves to regulate blood sugar.
Silk Road Holdings is an industry leader in the production of silk. They prioritize the cultivation of mulberry trees for sericulture and silk production. By controlling the entire supply chain, from mulberry cultivation to silk manufacturing, they guarantee the quality of silk products for international markets.
The Body Shop is a well-known cosmetics and skincare company that prioritizes ethically sourced, natural ingredients. They incorporate mulberry extracts into their products due to the fruit's high antioxidant content, which nourishes and protects the skin from degeneration.
Top Key Players in Mulberry Market
- Bolt Threads
- Novartis
- Silk Road Holdings
- Body Shop
- Sunrise Agriland Development & Research Pvt. Ltd.
- BATA FOOD
- Top Line Foods
- Peony Food Products
- Yaban Food
- NAVITAS ORGANICS
- Sevenhills Wholefoods
- Xian Yuensun Biological Technology Co. Ltd.
- Dragon Superfoods
- Earth Circle Organics
- Other
Recent Development
- In June 2023, Zimbabwe's horticulture sector, particularly the mulberry market, has seen significant growth and positive developments. Mulberry exports have increased dramatically, according to data from Zimbabwe's National Statistics Agency (ZimStats).
- In 2023, A new supply chain model for fresh mulberries has been developed in Thailand, which uses active packaging technology to extend the shelf life and preserve the freshness of the fruit. This model is expected to enhance new market channels and provide growers with more benefits.
- In 2023, Habitera Farms in Brentwood, California, introduced Himalayan purple mulberries to the American public. These mulberries are being grown and offered to the public as an alternative to cherries at U-pick farms in the Bay Area.
Report Scope
Report Features Description Market Value (2022) USD 36.4 Bn Forecast Revenue (2032) USD 56.4 Bn CAGR (2023-2032) 4.5% Base Year for Estimation 2022 Historic Period 2016-2022 Forecast Period 2023-2032 Report Coverage Revenue Forecast, Market Dynamics, COVID-19 Impact, Competitive Landscape, Recent Developments Segments Covered By Product Type (Black, Red, White), By Nature (Organic, Conventional), By Form ( Fruit, Raw/Fresh, Processed, Frozen/Chilled, Canned, Dehydrated, Pulp, Leaves, Leaf Extract), By End-Use (Households, Food Service, Food Industry, Infant formula, Sports Nutrition, Beverage Industry, Dietary supplements, Animal feed, Pharmaceutical Industry, Personal Care & Cosmetics) Regional Analysis North America – The US, Canada, & Mexico; Western Europe – Germany, France, The UK, Spain, Italy, Portugal, Ireland, Austria, Switzerland, Benelux, Nordic, & Rest of Western Europe; Eastern Europe – Russia, Poland, The Czech Republic, Greece, & Rest of Eastern Europe; APAC – China, Japan, South Korea, India, Australia & New Zealand, Indonesia, Malaysia, Philippines, Singapore, Thailand, Vietnam, & Rest of APAC; Latin America – Brazil, Colombia, Chile, Argentina, Costa Rica, & Rest of Latin America; Middle East & Africa – Algeria, Egypt, Israel, Kuwait, Nigeria, Saudi Arabia, South Africa, Turkey, United Arab Emirates, & Rest of MEA Competitive Landscape Bolt Threads, Novartis, Silk Road Holdings, Body Shop, Sunrise Agriland Development & Research Pvt. Ltd., BATA FOOD, Top Line Foods, Peony Food Products, Yaban Food, NAVITAS ORGANICS, Sevenhills Wholefoods, Xian Yuensun Biological Technology Co. Ltd., Dragon Superfoods, Earth Circle Organics, Other Customization Scope Customization for segments, region/country-level will be provided. Moreover, additional customization can be done based on the requirements. Purchase Options We have three licenses to opt for: Single User License, Multi-User License (Up to 5 Users), Corporate Use License (Unlimited User and Printable PDF) - Bolt Threads
- Novartis
- Silk Road Holdings
- Body Shop
- Sunrise Agriland Development & Research Pvt. Ltd.
- BATA FOOD
- Top Line Foods
- Peony Food Products
- Yaban Food
- NAVITAS ORGANICS
- Sevenhills Wholefoods
- Xian Yuensun Biological Technology Co. Ltd.
- Dragon Superfoods
- Earth Circle Organics
- Other
- 1. Executive Summary
- 1.1. Definition
- 1.2. Taxonomy
- 1.3. Research Scope
- 1.4. Key Analysis
- 1.5. Key Findings by Major Segments
- 1.6. Top strategies by Major Players
- 2. Global Mulberry Market Overview
- 2.1. Mulberry Market Dynamics
- 2.1.1. Drivers
- 2.1.2. Opportunities
- 2.1.3. Restraints
- 2.1.4. Challenges
- 2.2. Macro-economic Factors
- 2.3. Regulatory Framework
- 2.4. Market Investment Feasibility Index
- 2.5. PEST Analysis
- 2.6. PORTER’S Five Force Analysis
- 2.7. Drivers & Restraints Impact Analysis
- 2.8. Industry Chain Analysis
- 2.9. Cost Structure Analysis
- 2.10. Marketing Strategy
- 2.11. Russia-Ukraine War Impact Analysis
- 2.12. Opportunity Map Analysis
- 2.13. Market Competition Scenario Analysis
- 2.14. Product Life Cycle Analysis
- 2.15. Opportunity Orbits
- 2.16. Manufacturer Intensity Map
- 2.17. Major Companies sales by Value & Volume
- 2.1. Mulberry Market Dynamics
- 3. Global Mulberry Market Analysis, Opportunity and Forecast, 2016-2032
- 3.1. Global Mulberry Market Analysis, 2016-2021
- 3.2. Global Mulberry Market Opportunity and Forecast, 2023-2032
- 3.3. Global Mulberry Market Analysis, Opportunity and Forecast, By By Product Type, 2016-2032
- 3.3.1. Global Mulberry Market Analysis by By Product Type: Introduction
- 3.3.2. Market Size Absolute $ Opportunity Analysis and Forecast, By By Product Type, 2016-2032
- 3.3.3. Handbags
- 3.3.4. Small Leather Goods
- 3.3.5. Ready-to-Wear
- 3.3.6. Shoes
- 3.4. Global Mulberry Market Analysis, Opportunity and Forecast, By By Distribution Channel, 2016-2032
- 3.4.1. Global Mulberry Market Analysis by By Distribution Channel: Introduction
- 3.4.2. Market Size Absolute $ Opportunity Analysis and Forecast, By By Distribution Channel, 2016-2032
- 3.4.3. Retail Stores
- 3.4.4. E-commerce Platforms
- 3.4.5. Travel Retail
- 3.4.6. Online Marketplaces
- 3.5. Global Mulberry Market Analysis, Opportunity and Forecast, By By Form, 2016-2032
- 3.5.1. Global Mulberry Market Analysis by By Form: Introduction
- 3.5.2. Market Size Absolute $ Opportunity Analysis and Forecast, By By Form, 2016-2032
- 3.5.3. Fruit
- 3.5.4. Raw/Fresh
- 3.5.5. Processed
- 3.5.6. Frozen/Chilled
- 3.5.7. Canned
- 3.5.8. Dehydrated
- 4. North America Mulberry Market Analysis, Opportunity and Forecast, 2016-2032
- 4.1. North America Mulberry Market Analysis, 2016-2021
- 4.2. North America Mulberry Market Opportunity and Forecast, 2023-2032
- 4.3. North America Mulberry Market Analysis, Opportunity and Forecast, By By Product Type, 2016-2032
- 4.3.1. North America Mulberry Market Analysis by By Product Type: Introduction
- 4.3.2. Market Size Absolute $ Opportunity Analysis and Forecast, By By Product Type, 2016-2032
- 4.3.3. Handbags
- 4.3.4. Small Leather Goods
- 4.3.5. Ready-to-Wear
- 4.3.6. Shoes
- 4.4. North America Mulberry Market Analysis, Opportunity and Forecast, By By Distribution Channel, 2016-2032
- 4.4.1. North America Mulberry Market Analysis by By Distribution Channel: Introduction
- 4.4.2. Market Size Absolute $ Opportunity Analysis and Forecast, By By Distribution Channel, 2016-2032
- 4.4.3. Retail Stores
- 4.4.4. E-commerce Platforms
- 4.4.5. Travel Retail
- 4.4.6. Online Marketplaces
- 4.5. North America Mulberry Market Analysis, Opportunity and Forecast, By By Form, 2016-2032
- 4.5.1. North America Mulberry Market Analysis by By Form: Introduction
- 4.5.2. Market Size Absolute $ Opportunity Analysis and Forecast, By By Form, 2016-2032
- 4.5.3. Fruit
- 4.5.4. Raw/Fresh
- 4.5.5. Processed
- 4.5.6. Frozen/Chilled
- 4.5.7. Canned
- 4.5.8. Dehydrated
- 4.6. North America Mulberry Market Analysis, Opportunity and Forecast, By Country , 2016-2032
- 4.6.1. North America Mulberry Market Analysis by Country : Introduction
- 4.6.2. Market Size Absolute $ Opportunity Analysis and Forecast, Country , 2016-2032
- 4.6.2.1. The US
- 4.6.2.2. Canada
- 4.6.2.3. Mexico
- 5. Western Europe Mulberry Market Analysis, Opportunity and Forecast, 2016-2032
- 5.1. Western Europe Mulberry Market Analysis, 2016-2021
- 5.2. Western Europe Mulberry Market Opportunity and Forecast, 2023-2032
- 5.3. Western Europe Mulberry Market Analysis, Opportunity and Forecast, By By Product Type, 2016-2032
- 5.3.1. Western Europe Mulberry Market Analysis by By Product Type: Introduction
- 5.3.2. Market Size Absolute $ Opportunity Analysis and Forecast, By By Product Type, 2016-2032
- 5.3.3. Handbags
- 5.3.4. Small Leather Goods
- 5.3.5. Ready-to-Wear
- 5.3.6. Shoes
- 5.4. Western Europe Mulberry Market Analysis, Opportunity and Forecast, By By Distribution Channel, 2016-2032
- 5.4.1. Western Europe Mulberry Market Analysis by By Distribution Channel: Introduction
- 5.4.2. Market Size Absolute $ Opportunity Analysis and Forecast, By By Distribution Channel, 2016-2032
- 5.4.3. Retail Stores
- 5.4.4. E-commerce Platforms
- 5.4.5. Travel Retail
- 5.4.6. Online Marketplaces
- 5.5. Western Europe Mulberry Market Analysis, Opportunity and Forecast, By By Form, 2016-2032
- 5.5.1. Western Europe Mulberry Market Analysis by By Form: Introduction
- 5.5.2. Market Size Absolute $ Opportunity Analysis and Forecast, By By Form, 2016-2032
- 5.5.3. Fruit
- 5.5.4. Raw/Fresh
- 5.5.5. Processed
- 5.5.6. Frozen/Chilled
- 5.5.7. Canned
- 5.5.8. Dehydrated
- 5.6. Western Europe Mulberry Market Analysis, Opportunity and Forecast, By Country , 2016-2032
- 5.6.1. Western Europe Mulberry Market Analysis by Country : Introduction
- 5.6.2. Market Size Absolute $ Opportunity Analysis and Forecast, Country , 2016-2032
- 5.6.2.1. Germany
- 5.6.2.2. France
- 5.6.2.3. The UK
- 5.6.2.4. Spain
- 5.6.2.5. Italy
- 5.6.2.6. Portugal
- 5.6.2.7. Ireland
- 5.6.2.8. Austria
- 5.6.2.9. Switzerland
- 5.6.2.10. Benelux
- 5.6.2.11. Nordic
- 5.6.2.12. Rest of Western Europe
- 6. Eastern Europe Mulberry Market Analysis, Opportunity and Forecast, 2016-2032
- 6.1. Eastern Europe Mulberry Market Analysis, 2016-2021
- 6.2. Eastern Europe Mulberry Market Opportunity and Forecast, 2023-2032
- 6.3. Eastern Europe Mulberry Market Analysis, Opportunity and Forecast, By By Product Type, 2016-2032
- 6.3.1. Eastern Europe Mulberry Market Analysis by By Product Type: Introduction
- 6.3.2. Market Size Absolute $ Opportunity Analysis and Forecast, By By Product Type, 2016-2032
- 6.3.3. Handbags
- 6.3.4. Small Leather Goods
- 6.3.5. Ready-to-Wear
- 6.3.6. Shoes
- 6.4. Eastern Europe Mulberry Market Analysis, Opportunity and Forecast, By By Distribution Channel, 2016-2032
- 6.4.1. Eastern Europe Mulberry Market Analysis by By Distribution Channel: Introduction
- 6.4.2. Market Size Absolute $ Opportunity Analysis and Forecast, By By Distribution Channel, 2016-2032
- 6.4.3. Retail Stores
- 6.4.4. E-commerce Platforms
- 6.4.5. Travel Retail
- 6.4.6. Online Marketplaces
- 6.5. Eastern Europe Mulberry Market Analysis, Opportunity and Forecast, By By Form, 2016-2032
- 6.5.1. Eastern Europe Mulberry Market Analysis by By Form: Introduction
- 6.5.2. Market Size Absolute $ Opportunity Analysis and Forecast, By By Form, 2016-2032
- 6.5.3. Fruit
- 6.5.4. Raw/Fresh
- 6.5.5. Processed
- 6.5.6. Frozen/Chilled
- 6.5.7. Canned
- 6.5.8. Dehydrated
- 6.6. Eastern Europe Mulberry Market Analysis, Opportunity and Forecast, By Country , 2016-2032
- 6.6.1. Eastern Europe Mulberry Market Analysis by Country : Introduction
- 6.6.2. Market Size Absolute $ Opportunity Analysis and Forecast, Country , 2016-2032
- 6.6.2.1. Russia
- 6.6.2.2. Poland
- 6.6.2.3. The Czech Republic
- 6.6.2.4. Greece
- 6.6.2.5. Rest of Eastern Europe
- 7. APAC Mulberry Market Analysis, Opportunity and Forecast, 2016-2032
- 7.1. APAC Mulberry Market Analysis, 2016-2021
- 7.2. APAC Mulberry Market Opportunity and Forecast, 2023-2032
- 7.3. APAC Mulberry Market Analysis, Opportunity and Forecast, By By Product Type, 2016-2032
- 7.3.1. APAC Mulberry Market Analysis by By Product Type: Introduction
- 7.3.2. Market Size Absolute $ Opportunity Analysis and Forecast, By By Product Type, 2016-2032
- 7.3.3. Handbags
- 7.3.4. Small Leather Goods
- 7.3.5. Ready-to-Wear
- 7.3.6. Shoes
- 7.4. APAC Mulberry Market Analysis, Opportunity and Forecast, By By Distribution Channel, 2016-2032
- 7.4.1. APAC Mulberry Market Analysis by By Distribution Channel: Introduction
- 7.4.2. Market Size Absolute $ Opportunity Analysis and Forecast, By By Distribution Channel, 2016-2032
- 7.4.3. Retail Stores
- 7.4.4. E-commerce Platforms
- 7.4.5. Travel Retail
- 7.4.6. Online Marketplaces
- 7.5. APAC Mulberry Market Analysis, Opportunity and Forecast, By By Form, 2016-2032
- 7.5.1. APAC Mulberry Market Analysis by By Form: Introduction
- 7.5.2. Market Size Absolute $ Opportunity Analysis and Forecast, By By Form, 2016-2032
- 7.5.3. Fruit
- 7.5.4. Raw/Fresh
- 7.5.5. Processed
- 7.5.6. Frozen/Chilled
- 7.5.7. Canned
- 7.5.8. Dehydrated
- 7.6. APAC Mulberry Market Analysis, Opportunity and Forecast, By Country , 2016-2032
- 7.6.1. APAC Mulberry Market Analysis by Country : Introduction
- 7.6.2. Market Size Absolute $ Opportunity Analysis and Forecast, Country , 2016-2032
- 7.6.2.1. China
- 7.6.2.2. Japan
- 7.6.2.3. South Korea
- 7.6.2.4. India
- 7.6.2.5. Australia & New Zeland
- 7.6.2.6. Indonesia
- 7.6.2.7. Malaysia
- 7.6.2.8. Philippines
- 7.6.2.9. Singapore
- 7.6.2.10. Thailand
- 7.6.2.11. Vietnam
- 7.6.2.12. Rest of APAC
- 8. Latin America Mulberry Market Analysis, Opportunity and Forecast, 2016-2032
- 8.1. Latin America Mulberry Market Analysis, 2016-2021
- 8.2. Latin America Mulberry Market Opportunity and Forecast, 2023-2032
- 8.3. Latin America Mulberry Market Analysis, Opportunity and Forecast, By By Product Type, 2016-2032
- 8.3.1. Latin America Mulberry Market Analysis by By Product Type: Introduction
- 8.3.2. Market Size Absolute $ Opportunity Analysis and Forecast, By By Product Type, 2016-2032
- 8.3.3. Handbags
- 8.3.4. Small Leather Goods
- 8.3.5. Ready-to-Wear
- 8.3.6. Shoes
- 8.4. Latin America Mulberry Market Analysis, Opportunity and Forecast, By By Distribution Channel, 2016-2032
- 8.4.1. Latin America Mulberry Market Analysis by By Distribution Channel: Introduction
- 8.4.2. Market Size Absolute $ Opportunity Analysis and Forecast, By By Distribution Channel, 2016-2032
- 8.4.3. Retail Stores
- 8.4.4. E-commerce Platforms
- 8.4.5. Travel Retail
- 8.4.6. Online Marketplaces
- 8.5. Latin America Mulberry Market Analysis, Opportunity and Forecast, By By Form, 2016-2032
- 8.5.1. Latin America Mulberry Market Analysis by By Form: Introduction
- 8.5.2. Market Size Absolute $ Opportunity Analysis and Forecast, By By Form, 2016-2032
- 8.5.3. Fruit
- 8.5.4. Raw/Fresh
- 8.5.5. Processed
- 8.5.6. Frozen/Chilled
- 8.5.7. Canned
- 8.5.8. Dehydrated
- 8.6. Latin America Mulberry Market Analysis, Opportunity and Forecast, By Country , 2016-2032
- 8.6.1. Latin America Mulberry Market Analysis by Country : Introduction
- 8.6.2. Market Size Absolute $ Opportunity Analysis and Forecast, Country , 2016-2032
- 8.6.2.1. Brazil
- 8.6.2.2. Colombia
- 8.6.2.3. Chile
- 8.6.2.4. Argentina
- 8.6.2.5. Costa Rica
- 8.6.2.6. Rest of Latin America
- 9. Middle East & Africa Mulberry Market Analysis, Opportunity and Forecast, 2016-2032
- 9.1. Middle East & Africa Mulberry Market Analysis, 2016-2021
- 9.2. Middle East & Africa Mulberry Market Opportunity and Forecast, 2023-2032
- 9.3. Middle East & Africa Mulberry Market Analysis, Opportunity and Forecast, By By Product Type, 2016-2032
- 9.3.1. Middle East & Africa Mulberry Market Analysis by By Product Type: Introduction
- 9.3.2. Market Size Absolute $ Opportunity Analysis and Forecast, By By Product Type, 2016-2032
- 9.3.3. Handbags
- 9.3.4. Small Leather Goods
- 9.3.5. Ready-to-Wear
- 9.3.6. Shoes
- 9.4. Middle East & Africa Mulberry Market Analysis, Opportunity and Forecast, By By Distribution Channel, 2016-2032
- 9.4.1. Middle East & Africa Mulberry Market Analysis by By Distribution Channel: Introduction
- 9.4.2. Market Size Absolute $ Opportunity Analysis and Forecast, By By Distribution Channel, 2016-2032
- 9.4.3. Retail Stores
- 9.4.4. E-commerce Platforms
- 9.4.5. Travel Retail
- 9.4.6. Online Marketplaces
- 9.5. Middle East & Africa Mulberry Market Analysis, Opportunity and Forecast, By By Form, 2016-2032
- 9.5.1. Middle East & Africa Mulberry Market Analysis by By Form: Introduction
- 9.5.2. Market Size Absolute $ Opportunity Analysis and Forecast, By By Form, 2016-2032
- 9.5.3. Fruit
- 9.5.4. Raw/Fresh
- 9.5.5. Processed
- 9.5.6. Frozen/Chilled
- 9.5.7. Canned
- 9.5.8. Dehydrated
- 9.6. Middle East & Africa Mulberry Market Analysis, Opportunity and Forecast, By Country , 2016-2032
- 9.6.1. Middle East & Africa Mulberry Market Analysis by Country : Introduction
- 9.6.2. Market Size Absolute $ Opportunity Analysis and Forecast, Country , 2016-2032
- 9.6.2.1. Algeria
- 9.6.2.2. Egypt
- 9.6.2.3. Israel
- 9.6.2.4. Kuwait
- 9.6.2.5. Nigeria
- 9.6.2.6. Saudi Arabia
- 9.6.2.7. South Africa
- 9.6.2.8. Turkey
- 9.6.2.9. The UAE
- 9.6.2.10. Rest of MEA
- 10. Global Mulberry Market Analysis, Opportunity and Forecast, By Region , 2016-2032
- 10.1. Global Mulberry Market Analysis by Region : Introduction
- 10.2. Market Size Absolute $ Opportunity Analysis and Forecast, By Region , 2016-2032
- 10.2.1. North America
- 10.2.2. Western Europe
- 10.2.3. Eastern Europe
- 10.2.4. APAC
- 10.2.5. Latin America
- 10.2.6. Middle East & Africa
- 11. Global Mulberry Market Competitive Landscape, Market Share Analysis, and Company Profiles
- 11.1. Market Share Analysis
- 11.2. Company Profiles
- 11.3. ASML
- 11.3.1. Company Overview
- 11.3.2. Financial Highlights
- 11.3.3. Product Portfolio
- 11.3.4. SWOT Analysis
- 11.3.5. Key Strategies and Developments
- 11.4. Bolt Threads
- 11.4.1. Company Overview
- 11.4.2. Financial Highlights
- 11.4.3. Product Portfolio
- 11.4.4. SWOT Analysis
- 11.4.5. Key Strategies and Developments
- 11.5. Novartis
- 11.5.1. Company Overview
- 11.5.2. Financial Highlights
- 11.5.3. Product Portfolio
- 11.5.4. SWOT Analysis
- 11.5.5. Key Strategies and Developments
- 11.6. Silk Road Holdings
- 11.6.1. Company Overview
- 11.6.2. Financial Highlights
- 11.6.3. Product Portfolio
- 11.6.4. SWOT Analysis
- 11.6.5. Key Strategies and Developments
- 11.7. Body Shop
- 11.7.1. Company Overview
- 11.7.2. Financial Highlights
- 11.7.3. Product Portfolio
- 11.7.4. SWOT Analysis
- 11.7.5. Key Strategies and Developments
- 11.8. Sunrise Agriland Development & Research Pvt. Ltd.
- 11.8.1. Company Overview
- 11.8.2. Financial Highlights
- 11.8.3. Product Portfolio
- 11.8.4. SWOT Analysis
- 11.8.5. Key Strategies and Developments
- 11.9. BATA FOOD
- 11.9.1. Company Overview
- 11.9.2. Financial Highlights
- 11.9.3. Product Portfolio
- 11.9.4. SWOT Analysis
- 11.9.5. Key Strategies and Developments
- 11.10. DÖHLER
- 11.10.1. Company Overview
- 11.10.2. Financial Highlights
- 11.10.3. Product Portfolio
- 11.10.4. SWOT Analysis
- 11.10.5. Key Strategies and Developments
- 11.11. Top Line Foods
- 11.11.1. Company Overview
- 11.11.2. Financial Highlights
- 11.11.3. Product Portfolio
- 11.11.4. SWOT Analysis
- 11.11.5. Key Strategies and Developments
- 11.12. Peony Food Products
- 11.12.1. Company Overview
- 11.12.2. Financial Highlights
- 11.12.3. Product Portfolio
- 11.12.4. SWOT Analysis
- 11.12.5. Key Strategies and Developments
- 11.13. Yaban Food
- 11.13.1. Company Overview
- 11.13.2. Financial Highlights
- 11.13.3. Product Portfolio
- 11.13.4. SWOT Analysis
- 11.13.5. Key Strategies and Developments
- 11.14. Ken Muir Ltd
- 11.14.1. Company Overview
- 11.14.2. Financial Highlights
- 11.14.3. Product Portfolio
- 11.14.4. SWOT Analysis
- 11.14.5. Key Strategies and Developments
- 11.15. NAVITAS ORGANICS
- 11.15.1. Company Overview
- 11.15.2. Financial Highlights
- 11.15.3. Product Portfolio
- 11.15.4. SWOT Analysis
- 11.15.5. Key Strategies and Developments
- 11.16. Sevenhills Wholefoods
- 11.16.1. Company Overview
- 11.16.2. Financial Highlights
- 11.16.3. Product Portfolio
- 11.16.4. SWOT Analysis
- 11.16.5. Key Strategies and Developments
- 11.17. Nans Products
- 11.17.1. Company Overview
- 11.17.2. Financial Highlights
- 11.17.3. Product Portfolio
- 11.17.4. SWOT Analysis
- 11.17.5. Key Strategies and Developments
- 11.18. Xian Yuensun Biological Technology Co. Ltd.
- 11.18.1. Company Overview
- 11.18.2. Financial Highlights
- 11.18.3. Product Portfolio
- 11.18.4. SWOT Analysis
- 11.18.5. Key Strategies and Developments
- 11.19. ETChem
- 11.19.1. Company Overview
- 11.19.2. Financial Highlights
- 11.19.3. Product Portfolio
- 11.19.4. SWOT Analysis
- 11.19.5. Key Strategies and Developments
- 11.20. Other
- 11.20.1. Company Overview
- 11.20.2. Financial Highlights
- 11.20.3. Product Portfolio
- 11.20.4. SWOT Analysis
- 11.20.5. Key Strategies and Developments
- 12. Assumptions and Acronyms
- 13. Research Methodology
- 14. Contact
- Figure 1: Global Mulberry Market Revenue (US$ Mn) Market Share by By Product Type in 2022
- Figure 2: Global Mulberry Market Attractiveness Analysis by By Product Type, 2016-2032
- Figure 3: Global Mulberry Market Revenue (US$ Mn) Market Share by By Distribution Channelin 2022
- Figure 4: Global Mulberry Market Attractiveness Analysis by By Distribution Channel, 2016-2032
- Figure 5: Global Mulberry Market Revenue (US$ Mn) Market Share by By Formin 2022
- Figure 6: Global Mulberry Market Attractiveness Analysis by By Form, 2016-2032
- Figure 7: Global Mulberry Market Revenue (US$ Mn) Market Share by Region in 2022
- Figure 8: Global Mulberry Market Attractiveness Analysis by Region, 2016-2032
- Figure 9: Global Mulberry Market Revenue (US$ Mn) (2016-2032)
- Figure 10: Global Mulberry Market Revenue (US$ Mn) Comparison by Region (2016-2032)
- Figure 11: Global Mulberry Market Revenue (US$ Mn) Comparison by By Product Type (2016-2032)
- Figure 12: Global Mulberry Market Revenue (US$ Mn) Comparison by By Distribution Channel (2016-2032)
- Figure 13: Global Mulberry Market Revenue (US$ Mn) Comparison by By Form (2016-2032)
- Figure 14: Global Mulberry Market Y-o-Y Growth Rate Comparison by Region (2016-2032)
- Figure 15: Global Mulberry Market Y-o-Y Growth Rate Comparison by By Product Type (2016-2032)
- Figure 16: Global Mulberry Market Y-o-Y Growth Rate Comparison by By Distribution Channel (2016-2032)
- Figure 17: Global Mulberry Market Y-o-Y Growth Rate Comparison by By Form (2016-2032)
- Figure 18: Global Mulberry Market Share Comparison by Region (2016-2032)
- Figure 19: Global Mulberry Market Share Comparison by By Product Type (2016-2032)
- Figure 20: Global Mulberry Market Share Comparison by By Distribution Channel (2016-2032)
- Figure 21: Global Mulberry Market Share Comparison by By Form (2016-2032)
- Figure 22: North America Mulberry Market Revenue (US$ Mn) Market Share by By Product Typein 2022
- Figure 23: North America Mulberry Market Attractiveness Analysis by By Product Type, 2016-2032
- Figure 24: North America Mulberry Market Revenue (US$ Mn) Market Share by By Distribution Channelin 2022
- Figure 25: North America Mulberry Market Attractiveness Analysis by By Distribution Channel, 2016-2032
- Figure 26: North America Mulberry Market Revenue (US$ Mn) Market Share by By Formin 2022
- Figure 27: North America Mulberry Market Attractiveness Analysis by By Form, 2016-2032
- Figure 28: North America Mulberry Market Revenue (US$ Mn) Market Share by Country in 2022
- Figure 29: North America Mulberry Market Attractiveness Analysis by Country, 2016-2032
- Figure 30: North America Mulberry Market Revenue (US$ Mn) (2016-2032)
- Figure 31: North America Mulberry Market Revenue (US$ Mn) Comparison by Country (2016-2032)
- Figure 32: North America Mulberry Market Revenue (US$ Mn) Comparison by By Product Type (2016-2032)
- Figure 33: North America Mulberry Market Revenue (US$ Mn) Comparison by By Distribution Channel (2016-2032)
- Figure 34: North America Mulberry Market Revenue (US$ Mn) Comparison by By Form (2016-2032)
- Figure 35: North America Mulberry Market Y-o-Y Growth Rate Comparison by Country (2016-2032)
- Figure 36: North America Mulberry Market Y-o-Y Growth Rate Comparison by By Product Type (2016-2032)
- Figure 37: North America Mulberry Market Y-o-Y Growth Rate Comparison by By Distribution Channel (2016-2032)
- Figure 38: North America Mulberry Market Y-o-Y Growth Rate Comparison by By Form (2016-2032)
- Figure 39: North America Mulberry Market Share Comparison by Country (2016-2032)
- Figure 40: North America Mulberry Market Share Comparison by By Product Type (2016-2032)
- Figure 41: North America Mulberry Market Share Comparison by By Distribution Channel (2016-2032)
- Figure 42: North America Mulberry Market Share Comparison by By Form (2016-2032)
- Figure 43: Western Europe Mulberry Market Revenue (US$ Mn) Market Share by By Product Typein 2022
- Figure 44: Western Europe Mulberry Market Attractiveness Analysis by By Product Type, 2016-2032
- Figure 45: Western Europe Mulberry Market Revenue (US$ Mn) Market Share by By Distribution Channelin 2022
- Figure 46: Western Europe Mulberry Market Attractiveness Analysis by By Distribution Channel, 2016-2032
- Figure 47: Western Europe Mulberry Market Revenue (US$ Mn) Market Share by By Formin 2022
- Figure 48: Western Europe Mulberry Market Attractiveness Analysis by By Form, 2016-2032
- Figure 49: Western Europe Mulberry Market Revenue (US$ Mn) Market Share by Country in 2022
- Figure 50: Western Europe Mulberry Market Attractiveness Analysis by Country, 2016-2032
- Figure 51: Western Europe Mulberry Market Revenue (US$ Mn) (2016-2032)
- Figure 52: Western Europe Mulberry Market Revenue (US$ Mn) Comparison by Country (2016-2032)
- Figure 53: Western Europe Mulberry Market Revenue (US$ Mn) Comparison by By Product Type (2016-2032)
- Figure 54: Western Europe Mulberry Market Revenue (US$ Mn) Comparison by By Distribution Channel (2016-2032)
- Figure 55: Western Europe Mulberry Market Revenue (US$ Mn) Comparison by By Form (2016-2032)
- Figure 56: Western Europe Mulberry Market Y-o-Y Growth Rate Comparison by Country (2016-2032)
- Figure 57: Western Europe Mulberry Market Y-o-Y Growth Rate Comparison by By Product Type (2016-2032)
- Figure 58: Western Europe Mulberry Market Y-o-Y Growth Rate Comparison by By Distribution Channel (2016-2032)
- Figure 59: Western Europe Mulberry Market Y-o-Y Growth Rate Comparison by By Form (2016-2032)
- Figure 60: Western Europe Mulberry Market Share Comparison by Country (2016-2032)
- Figure 61: Western Europe Mulberry Market Share Comparison by By Product Type (2016-2032)
- Figure 62: Western Europe Mulberry Market Share Comparison by By Distribution Channel (2016-2032)
- Figure 63: Western Europe Mulberry Market Share Comparison by By Form (2016-2032)
- Figure 64: Eastern Europe Mulberry Market Revenue (US$ Mn) Market Share by By Product Typein 2022
- Figure 65: Eastern Europe Mulberry Market Attractiveness Analysis by By Product Type, 2016-2032
- Figure 66: Eastern Europe Mulberry Market Revenue (US$ Mn) Market Share by By Distribution Channelin 2022
- Figure 67: Eastern Europe Mulberry Market Attractiveness Analysis by By Distribution Channel, 2016-2032
- Figure 68: Eastern Europe Mulberry Market Revenue (US$ Mn) Market Share by By Formin 2022
- Figure 69: Eastern Europe Mulberry Market Attractiveness Analysis by By Form, 2016-2032
- Figure 70: Eastern Europe Mulberry Market Revenue (US$ Mn) Market Share by Country in 2022
- Figure 71: Eastern Europe Mulberry Market Attractiveness Analysis by Country, 2016-2032
- Figure 72: Eastern Europe Mulberry Market Revenue (US$ Mn) (2016-2032)
- Figure 73: Eastern Europe Mulberry Market Revenue (US$ Mn) Comparison by Country (2016-2032)
- Figure 74: Eastern Europe Mulberry Market Revenue (US$ Mn) Comparison by By Product Type (2016-2032)
- Figure 75: Eastern Europe Mulberry Market Revenue (US$ Mn) Comparison by By Distribution Channel (2016-2032)
- Figure 76: Eastern Europe Mulberry Market Revenue (US$ Mn) Comparison by By Form (2016-2032)
- Figure 77: Eastern Europe Mulberry Market Y-o-Y Growth Rate Comparison by Country (2016-2032)
- Figure 78: Eastern Europe Mulberry Market Y-o-Y Growth Rate Comparison by By Product Type (2016-2032)
- Figure 79: Eastern Europe Mulberry Market Y-o-Y Growth Rate Comparison by By Distribution Channel (2016-2032)
- Figure 80: Eastern Europe Mulberry Market Y-o-Y Growth Rate Comparison by By Form (2016-2032)
- Figure 81: Eastern Europe Mulberry Market Share Comparison by Country (2016-2032)
- Figure 82: Eastern Europe Mulberry Market Share Comparison by By Product Type (2016-2032)
- Figure 83: Eastern Europe Mulberry Market Share Comparison by By Distribution Channel (2016-2032)
- Figure 84: Eastern Europe Mulberry Market Share Comparison by By Form (2016-2032)
- Figure 85: APAC Mulberry Market Revenue (US$ Mn) Market Share by By Product Typein 2022
- Figure 86: APAC Mulberry Market Attractiveness Analysis by By Product Type, 2016-2032
- Figure 87: APAC Mulberry Market Revenue (US$ Mn) Market Share by By Distribution Channelin 2022
- Figure 88: APAC Mulberry Market Attractiveness Analysis by By Distribution Channel, 2016-2032
- Figure 89: APAC Mulberry Market Revenue (US$ Mn) Market Share by By Formin 2022
- Figure 90: APAC Mulberry Market Attractiveness Analysis by By Form, 2016-2032
- Figure 91: APAC Mulberry Market Revenue (US$ Mn) Market Share by Country in 2022
- Figure 92: APAC Mulberry Market Attractiveness Analysis by Country, 2016-2032
- Figure 93: APAC Mulberry Market Revenue (US$ Mn) (2016-2032)
- Figure 94: APAC Mulberry Market Revenue (US$ Mn) Comparison by Country (2016-2032)
- Figure 95: APAC Mulberry Market Revenue (US$ Mn) Comparison by By Product Type (2016-2032)
- Figure 96: APAC Mulberry Market Revenue (US$ Mn) Comparison by By Distribution Channel (2016-2032)
- Figure 97: APAC Mulberry Market Revenue (US$ Mn) Comparison by By Form (2016-2032)
- Figure 98: APAC Mulberry Market Y-o-Y Growth Rate Comparison by Country (2016-2032)
- Figure 99: APAC Mulberry Market Y-o-Y Growth Rate Comparison by By Product Type (2016-2032)
- Figure 100: APAC Mulberry Market Y-o-Y Growth Rate Comparison by By Distribution Channel (2016-2032)
- Figure 101: APAC Mulberry Market Y-o-Y Growth Rate Comparison by By Form (2016-2032)
- Figure 102: APAC Mulberry Market Share Comparison by Country (2016-2032)
- Figure 103: APAC Mulberry Market Share Comparison by By Product Type (2016-2032)
- Figure 104: APAC Mulberry Market Share Comparison by By Distribution Channel (2016-2032)
- Figure 105: APAC Mulberry Market Share Comparison by By Form (2016-2032)
- Figure 106: Latin America Mulberry Market Revenue (US$ Mn) Market Share by By Product Typein 2022
- Figure 107: Latin America Mulberry Market Attractiveness Analysis by By Product Type, 2016-2032
- Figure 108: Latin America Mulberry Market Revenue (US$ Mn) Market Share by By Distribution Channelin 2022
- Figure 109: Latin America Mulberry Market Attractiveness Analysis by By Distribution Channel, 2016-2032
- Figure 110: Latin America Mulberry Market Revenue (US$ Mn) Market Share by By Formin 2022
- Figure 111: Latin America Mulberry Market Attractiveness Analysis by By Form, 2016-2032
- Figure 112: Latin America Mulberry Market Revenue (US$ Mn) Market Share by Country in 2022
- Figure 113: Latin America Mulberry Market Attractiveness Analysis by Country, 2016-2032
- Figure 114: Latin America Mulberry Market Revenue (US$ Mn) (2016-2032)
- Figure 115: Latin America Mulberry Market Revenue (US$ Mn) Comparison by Country (2016-2032)
- Figure 116: Latin America Mulberry Market Revenue (US$ Mn) Comparison by By Product Type (2016-2032)
- Figure 117: Latin America Mulberry Market Revenue (US$ Mn) Comparison by By Distribution Channel (2016-2032)
- Figure 118: Latin America Mulberry Market Revenue (US$ Mn) Comparison by By Form (2016-2032)
- Figure 119: Latin America Mulberry Market Y-o-Y Growth Rate Comparison by Country (2016-2032)
- Figure 120: Latin America Mulberry Market Y-o-Y Growth Rate Comparison by By Product Type (2016-2032)
- Figure 121: Latin America Mulberry Market Y-o-Y Growth Rate Comparison by By Distribution Channel (2016-2032)
- Figure 122: Latin America Mulberry Market Y-o-Y Growth Rate Comparison by By Form (2016-2032)
- Figure 123: Latin America Mulberry Market Share Comparison by Country (2016-2032)
- Figure 124: Latin America Mulberry Market Share Comparison by By Product Type (2016-2032)
- Figure 125: Latin America Mulberry Market Share Comparison by By Distribution Channel (2016-2032)
- Figure 126: Latin America Mulberry Market Share Comparison by By Form (2016-2032)
- Figure 127: Middle East & Africa Mulberry Market Revenue (US$ Mn) Market Share by By Product Typein 2022
- Figure 128: Middle East & Africa Mulberry Market Attractiveness Analysis by By Product Type, 2016-2032
- Figure 129: Middle East & Africa Mulberry Market Revenue (US$ Mn) Market Share by By Distribution Channelin 2022
- Figure 130: Middle East & Africa Mulberry Market Attractiveness Analysis by By Distribution Channel, 2016-2032
- Figure 131: Middle East & Africa Mulberry Market Revenue (US$ Mn) Market Share by By Formin 2022
- Figure 132: Middle East & Africa Mulberry Market Attractiveness Analysis by By Form, 2016-2032
- Figure 133: Middle East & Africa Mulberry Market Revenue (US$ Mn) Market Share by Country in 2022
- Figure 134: Middle East & Africa Mulberry Market Attractiveness Analysis by Country, 2016-2032
- Figure 135: Middle East & Africa Mulberry Market Revenue (US$ Mn) (2016-2032)
- Figure 136: Middle East & Africa Mulberry Market Revenue (US$ Mn) Comparison by Country (2016-2032)
- Figure 137: Middle East & Africa Mulberry Market Revenue (US$ Mn) Comparison by By Product Type (2016-2032)
- Figure 138: Middle East & Africa Mulberry Market Revenue (US$ Mn) Comparison by By Distribution Channel (2016-2032)
- Figure 139: Middle East & Africa Mulberry Market Revenue (US$ Mn) Comparison by By Form (2016-2032)
- Figure 140: Middle East & Africa Mulberry Market Y-o-Y Growth Rate Comparison by Country (2016-2032)
- Figure 141: Middle East & Africa Mulberry Market Y-o-Y Growth Rate Comparison by By Product Type (2016-2032)
- Figure 142: Middle East & Africa Mulberry Market Y-o-Y Growth Rate Comparison by By Distribution Channel (2016-2032)
- Figure 143: Middle East & Africa Mulberry Market Y-o-Y Growth Rate Comparison by By Form (2016-2032)
- Figure 144: Middle East & Africa Mulberry Market Share Comparison by Country (2016-2032)
- Figure 145: Middle East & Africa Mulberry Market Share Comparison by By Product Type (2016-2032)
- Figure 146: Middle East & Africa Mulberry Market Share Comparison by By Distribution Channel (2016-2032)
- Figure 147: Middle East & Africa Mulberry Market Share Comparison by By Form (2016-2032)
- Table 1: Global Mulberry Market Comparison by By Product Type (2016-2032)
- Table 2: Global Mulberry Market Comparison by By Distribution Channel (2016-2032)
- Table 3: Global Mulberry Market Comparison by By Form (2016-2032)
- Table 4: Global Mulberry Market Revenue (US$ Mn) Comparison by Region (2016-2032)
- Table 5: Global Mulberry Market Revenue (US$ Mn) (2016-2032)
- Table 6: Global Mulberry Market Revenue (US$ Mn) Comparison by Region (2016-2032)
- Table 7: Global Mulberry Market Revenue (US$ Mn) Comparison by By Product Type (2016-2032)
- Table 8: Global Mulberry Market Revenue (US$ Mn) Comparison by By Distribution Channel (2016-2032)
- Table 9: Global Mulberry Market Revenue (US$ Mn) Comparison by By Form (2016-2032)
- Table 10: Global Mulberry Market Y-o-Y Growth Rate Comparison by Region (2016-2032)
- Table 11: Global Mulberry Market Y-o-Y Growth Rate Comparison by By Product Type (2016-2032)
- Table 12: Global Mulberry Market Y-o-Y Growth Rate Comparison by By Distribution Channel (2016-2032)
- Table 13: Global Mulberry Market Y-o-Y Growth Rate Comparison by By Form (2016-2032)
- Table 14: Global Mulberry Market Share Comparison by Region (2016-2032)
- Table 15: Global Mulberry Market Share Comparison by By Product Type (2016-2032)
- Table 16: Global Mulberry Market Share Comparison by By Distribution Channel (2016-2032)
- Table 17: Global Mulberry Market Share Comparison by By Form (2016-2032)
- Table 18: North America Mulberry Market Comparison by By Distribution Channel (2016-2032)
- Table 19: North America Mulberry Market Comparison by By Form (2016-2032)
- Table 20: North America Mulberry Market Revenue (US$ Mn) Comparison by Country (2016-2032)
- Table 21: North America Mulberry Market Revenue (US$ Mn) (2016-2032)
- Table 22: North America Mulberry Market Revenue (US$ Mn) Comparison by Country (2016-2032)
- Table 23: North America Mulberry Market Revenue (US$ Mn) Comparison by By Product Type (2016-2032)
- Table 24: North America Mulberry Market Revenue (US$ Mn) Comparison by By Distribution Channel (2016-2032)
- Table 25: North America Mulberry Market Revenue (US$ Mn) Comparison by By Form (2016-2032)
- Table 26: North America Mulberry Market Y-o-Y Growth Rate Comparison by Country (2016-2032)
- Table 27: North America Mulberry Market Y-o-Y Growth Rate Comparison by By Product Type (2016-2032)
- Table 28: North America Mulberry Market Y-o-Y Growth Rate Comparison by By Distribution Channel (2016-2032)
- Table 29: North America Mulberry Market Y-o-Y Growth Rate Comparison by By Form (2016-2032)
- Table 30: North America Mulberry Market Share Comparison by Country (2016-2032)
- Table 31: North America Mulberry Market Share Comparison by By Product Type (2016-2032)
- Table 32: North America Mulberry Market Share Comparison by By Distribution Channel (2016-2032)
- Table 33: North America Mulberry Market Share Comparison by By Form (2016-2032)
- Table 34: Western Europe Mulberry Market Comparison by By Product Type (2016-2032)
- Table 35: Western Europe Mulberry Market Comparison by By Distribution Channel (2016-2032)
- Table 36: Western Europe Mulberry Market Comparison by By Form (2016-2032)
- Table 37: Western Europe Mulberry Market Revenue (US$ Mn) Comparison by Country (2016-2032)
- Table 38: Western Europe Mulberry Market Revenue (US$ Mn) (2016-2032)
- Table 39: Western Europe Mulberry Market Revenue (US$ Mn) Comparison by Country (2016-2032)
- Table 40: Western Europe Mulberry Market Revenue (US$ Mn) Comparison by By Product Type (2016-2032)
- Table 41: Western Europe Mulberry Market Revenue (US$ Mn) Comparison by By Distribution Channel (2016-2032)
- Table 42: Western Europe Mulberry Market Revenue (US$ Mn) Comparison by By Form (2016-2032)
- Table 43: Western Europe Mulberry Market Y-o-Y Growth Rate Comparison by Country (2016-2032)
- Table 44: Western Europe Mulberry Market Y-o-Y Growth Rate Comparison by By Product Type (2016-2032)
- Table 45: Western Europe Mulberry Market Y-o-Y Growth Rate Comparison by By Distribution Channel (2016-2032)
- Table 46: Western Europe Mulberry Market Y-o-Y Growth Rate Comparison by By Form (2016-2032)
- Table 47: Western Europe Mulberry Market Share Comparison by Country (2016-2032)
- Table 48: Western Europe Mulberry Market Share Comparison by By Product Type (2016-2032)
- Table 49: Western Europe Mulberry Market Share Comparison by By Distribution Channel (2016-2032)
- Table 50: Western Europe Mulberry Market Share Comparison by By Form (2016-2032)
- Table 51: Eastern Europe Mulberry Market Comparison by By Product Type (2016-2032)
- Table 52: Eastern Europe Mulberry Market Comparison by By Distribution Channel (2016-2032)
- Table 53: Eastern Europe Mulberry Market Comparison by By Form (2016-2032)
- Table 54: Eastern Europe Mulberry Market Revenue (US$ Mn) Comparison by Country (2016-2032)
- Table 55: Eastern Europe Mulberry Market Revenue (US$ Mn) (2016-2032)
- Table 56: Eastern Europe Mulberry Market Revenue (US$ Mn) Comparison by Country (2016-2032)
- Table 57: Eastern Europe Mulberry Market Revenue (US$ Mn) Comparison by By Product Type (2016-2032)
- Table 58: Eastern Europe Mulberry Market Revenue (US$ Mn) Comparison by By Distribution Channel (2016-2032)
- Table 59: Eastern Europe Mulberry Market Revenue (US$ Mn) Comparison by By Form (2016-2032)
- Table 60: Eastern Europe Mulberry Market Y-o-Y Growth Rate Comparison by Country (2016-2032)
- Table 61: Eastern Europe Mulberry Market Y-o-Y Growth Rate Comparison by By Product Type (2016-2032)
- Table 62: Eastern Europe Mulberry Market Y-o-Y Growth Rate Comparison by By Distribution Channel (2016-2032)
- Table 63: Eastern Europe Mulberry Market Y-o-Y Growth Rate Comparison by By Form (2016-2032)
- Table 64: Eastern Europe Mulberry Market Share Comparison by Country (2016-2032)
- Table 65: Eastern Europe Mulberry Market Share Comparison by By Product Type (2016-2032)
- Table 66: Eastern Europe Mulberry Market Share Comparison by By Distribution Channel (2016-2032)
- Table 67: Eastern Europe Mulberry Market Share Comparison by By Form (2016-2032)
- Table 68: APAC Mulberry Market Comparison by By Product Type (2016-2032)
- Table 69: APAC Mulberry Market Comparison by By Distribution Channel (2016-2032)
- Table 70: APAC Mulberry Market Comparison by By Form (2016-2032)
- Table 71: APAC Mulberry Market Revenue (US$ Mn) Comparison by Country (2016-2032)
- Table 72: APAC Mulberry Market Revenue (US$ Mn) (2016-2032)
- Table 73: APAC Mulberry Market Revenue (US$ Mn) Comparison by Country (2016-2032)
- Table 74: APAC Mulberry Market Revenue (US$ Mn) Comparison by By Product Type (2016-2032)
- Table 75: APAC Mulberry Market Revenue (US$ Mn) Comparison by By Distribution Channel (2016-2032)
- Table 76: APAC Mulberry Market Revenue (US$ Mn) Comparison by By Form (2016-2032)
- Table 77: APAC Mulberry Market Y-o-Y Growth Rate Comparison by Country (2016-2032)
- Table 78: APAC Mulberry Market Y-o-Y Growth Rate Comparison by By Product Type (2016-2032)
- Table 79: APAC Mulberry Market Y-o-Y Growth Rate Comparison by By Distribution Channel (2016-2032)
- Table 80: APAC Mulberry Market Y-o-Y Growth Rate Comparison by By Form (2016-2032)
- Table 81: APAC Mulberry Market Share Comparison by Country (2016-2032)
- Table 82: APAC Mulberry Market Share Comparison by By Product Type (2016-2032)
- Table 83: APAC Mulberry Market Share Comparison by By Distribution Channel (2016-2032)
- Table 84: APAC Mulberry Market Share Comparison by By Form (2016-2032)
- Table 85: Latin America Mulberry Market Comparison by By Product Type (2016-2032)
- Table 86: Latin America Mulberry Market Comparison by By Distribution Channel (2016-2032)
- Table 87: Latin America Mulberry Market Comparison by By Form (2016-2032)
- Table 88: Latin America Mulberry Market Revenue (US$ Mn) Comparison by Country (2016-2032)
- Table 89: Latin America Mulberry Market Revenue (US$ Mn) (2016-2032)
- Table 90: Latin America Mulberry Market Revenue (US$ Mn) Comparison by Country (2016-2032)
- Table 91: Latin America Mulberry Market Revenue (US$ Mn) Comparison by By Product Type (2016-2032)
- Table 92: Latin America Mulberry Market Revenue (US$ Mn) Comparison by By Distribution Channel (2016-2032)
- Table 93: Latin America Mulberry Market Revenue (US$ Mn) Comparison by By Form (2016-2032)
- Table 94: Latin America Mulberry Market Y-o-Y Growth Rate Comparison by Country (2016-2032)
- Table 95: Latin America Mulberry Market Y-o-Y Growth Rate Comparison by By Product Type (2016-2032)
- Table 96: Latin America Mulberry Market Y-o-Y Growth Rate Comparison by By Distribution Channel (2016-2032)
- Table 97: Latin America Mulberry Market Y-o-Y Growth Rate Comparison by By Form (2016-2032)
- Table 98: Latin America Mulberry Market Share Comparison by Country (2016-2032)
- Table 99: Latin America Mulberry Market Share Comparison by By Product Type (2016-2032)
- Table 100: Latin America Mulberry Market Share Comparison by By Distribution Channel (2016-2032)
- Table 101: Latin America Mulberry Market Share Comparison by By Form (2016-2032)
- Table 102: Middle East & Africa Mulberry Market Comparison by By Product Type (2016-2032)
- Table 103: Middle East & Africa Mulberry Market Comparison by By Distribution Channel (2016-2032)
- Table 104: Middle East & Africa Mulberry Market Comparison by By Form (2016-2032)
- Table 105: Middle East & Africa Mulberry Market Revenue (US$ Mn) Comparison by Country (2016-2032)
- Table 106: Middle East & Africa Mulberry Market Revenue (US$ Mn) (2016-2032)
- Table 107: Middle East & Africa Mulberry Market Revenue (US$ Mn) Comparison by Country (2016-2032)
- Table 108: Middle East & Africa Mulberry Market Revenue (US$ Mn) Comparison by By Product Type (2016-2032)
- Table 109: Middle East & Africa Mulberry Market Revenue (US$ Mn) Comparison by By Distribution Channel (2016-2032)
- Table 110: Middle East & Africa Mulberry Market Revenue (US$ Mn) Comparison by By Form (2016-2032)
- Table 111: Middle East & Africa Mulberry Market Y-o-Y Growth Rate Comparison by Country (2016-2032)
- Table 112: Middle East & Africa Mulberry Market Y-o-Y Growth Rate Comparison by By Product Type (2016-2032)
- Table 113: Middle East & Africa Mulberry Market Y-o-Y Growth Rate Comparison by By Distribution Channel (2016-2032)
- Table 114: Middle East & Africa Mulberry Market Y-o-Y Growth Rate Comparison by By Form (2016-2032)
- Table 115: Middle East & Africa Mulberry Market Share Comparison by Country (2016-2032)
- Table 116: Middle East & Africa Mulberry Market Share Comparison by By Product Type (2016-2032)
- Table 117: Middle East & Africa Mulberry Market Share Comparison by By Distribution Channel (2016-2032)
- Table 118: Middle East & Africa Mulberry Market Share Comparison by By Form (2016-2032)
- 1. Executive Summary
Inquiry Form
Why Choose Us
- 360 Degree Approach
- Growth Consulting
- 24/7 Research Support
- Comprehensive-Level of Customization
- Competitive Intelligence
- Single-Country/ Region Intelligence
- Post-Sale Service Assistance
- Access to Lead Analysts
- Available in PDF, Excel, Word/ PPT
Request for Customization
OUR CLIENTS
Don't just take our word. We are trusted by these great companies!