Photovoltaic Market By Type (Organic PV, Inorganic PV), By Component (Cells, Modules, and Optics), By Application (Residential Applications, Non-Residential Applications), By Region And Companies - Industry Segment Outlook, Market Assessment, Competition Scenario, Trends, And Forecast 2023-2032
-
41656
-
Oct 2023
-
160
-


-
This report was compiled by Shreyas Rokade Shreyas Rokade is a seasoned Research Analyst with CMFE, bringing extensive expertise in market research and consulting, with a strong background in Chemical Engineering. Correspondence Team Lead-CMFE Linkedin | Detailed Market research Methodology Our methodology involves a mix of primary research, including interviews with leading mental health experts, and secondary research from reputable medical journals and databases. View Detailed Methodology Page
-
Quick Navigation
Report Overview
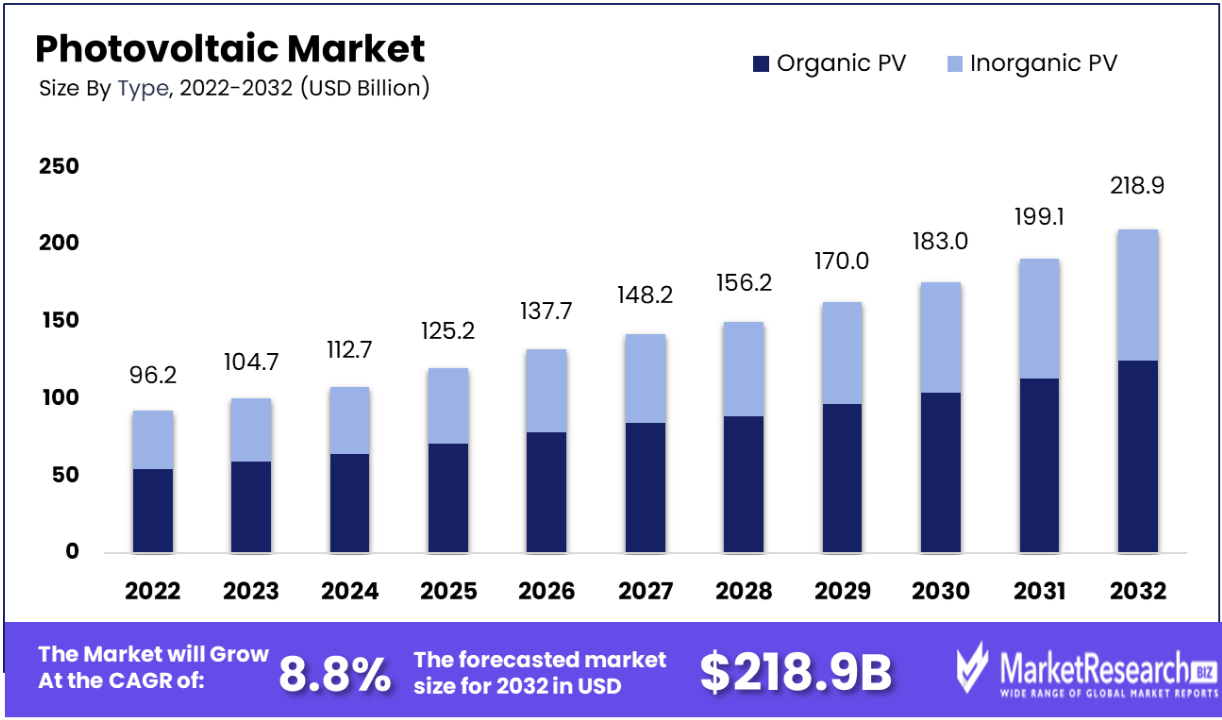
The Photovoltaic Market is projected to grow from USD 96.2 Billion in 2022 to USD 218.9 Billion by 2032, exhibiting a CAGR of 8.8% during the forecast period.
Photovoltaic (PV) systems are essential for utilizing solar energy to produce electricity in a sustainable and environmentally friendly manner. They clearly support initiatives to cut carbon emissions and move toward renewable energy sources on a global scale.
When compared to traditional systems, its operational efficiency is characterized by much lower costs. Solar panels are in greater demand than ever due to the growing need for electricity on a daily basis, the necessity for alternative energy sources, and the growing worry over climate change. The market is well-positioned for significant development and innovation given this dynamic environment. The need for energy has increased as a result of the growing world population.
Governments everywhere are putting policies into place that prioritize the switch away from fossil fuels, trying to reduce environmental pollution, in order to meet this demand responsibly. The use of sources of renewable energy, especially solar energy, is heavily encouraged by the current regulatory environment, which is fueling the market for photovoltaic systems. Additionally, the need to cut emissions of carbon and the affordability of energy production increase solar cable systems' allure. These elements work together to support the solar industry's predicted strong growth. This dynamic creates both possibilities and demands for the sector's ongoing innovation and growth.
According to a joint study conducted by the US Department of Energy (DOE), the Solar Energy Technologies Office, and the National Renewable Energy Laboratory (NREL), solar energy might potentially supply 40% or more of the country's electrical needs in the future. The decarbonisation efforts in a number of industries, such as buildings, transportation, and industry, could be considerably accelerated by this invention.
Numerous Life Cycle Assessments (LCAs) have been completed and made available over the past 30 years, with a focus on different household and utility-scale solar photovoltaic (PV) systems. NREL is making great progress toward its lofty goals, which include a net-zero economy by 2050, a reduction in emissions of 50% by 2030, and a switch to 100% renewable electricity by 2035.
Driving Factors
Sustainability and Environmental Awareness Objectives
A global trend towards greener energy sources has been sparked by increased awareness of environmental challenges, particularly climate change. Solar energy stands out as a renewable energy source with no emissions of greenhouse gases when in use. Reduced carbon footprints and a desire to add to a more sustainable future are driving forces for both individuals and organizations. Solar energy is essential to reaching the lofty sustainability targets established by governments and international organizations.
Reduced Costs of Solar Panels
The cost of producing photovoltaic panels has significantly decreased as a result of the development of the solar sector. Unit costs have dramatically decreased as a result of economies of scale, which are fuelled by higher production volumes. The efficiency and waste reduction brought about by improvements in manufacturing technology and procedures have also increased cost-effectiveness. Solar energy is becoming more widely available to individuals and businesses of all sizes because to the decline in solar panel purchase costs.
Technological Progress
Significant advancements in photovoltaic technology have resulted from ongoing research and development. Solar panels are more effective, converting more sunshine into power thanks to new materials and cell designs. Additionally, production has been streamlined by improved manufacturing techniques, which has decreased costs and raised affordability.
Governmental Policies and Incentives
Governments all across the world are aware of the crucial role that solar energy plays in establishing low-carbon, sustainable economies. They put in place a number of policies to encourage adoption. Investors in solar energy might gain financially through tax incentives, feed-in tariffs, and rebates. Policies such as Renewable Portfolio Standards (RPS) require that a specific proportion of energy come from sources that are renewable, while net metering permits the sale of excess solar power back to the grid, further promoting investment. Net Zero Solutions revolutionizes the Photovoltaic Market with sustainable, energy-efficient technologies for a greener future.
Restraining Factors
Initial Expenditure and Repayment Period
Although establishing photovoltaic systems can require a substantial initial expenditure, the long-term advantages of solar energy are appealing. Some consumers may be put off by this up-front expenditure, although the fact that it results in significant savings over the long run. Location, system size, and regional incentives are a few examples of the variables that might affect the payback period, or the length of time it requires for the energy savings to cover the initial investment.
Challenges with Grid Integration and Storage
The production of solar energy is dependent on sunshine availability, which changes during the day and throughout the year. The smooth integration of solar energy into the grid may be difficult due to this intermittent nature. Effective energy storage technologies are also continuously being developed. Currently, this makes it challenging to entirely rely on solar power during times of low sunlight or at night-time when there is still a need for electricity.
Space and Land Restraints
Huge land resources are needed for substantial solar farms, which are essential for satisfying huge energy demands. This can clash with other land uses like agricultural or conservation initiatives. It can be challenging to strike a balance between the generation of solar energy and other land-use concerns. Given the limited accessible area and competing needs for land use, finding a good location for solar panels can be difficult in densely populated urban areas. For effective solar integration, this spatial restriction may call for creative solutions.
Growth Opportunities
Raising Investments in Research and Development
Increased R&D spending promotes advancements in photovoltaic technology. This includes advancements in the durability, longevity, and production methods of solar cells. It is anticipated that panel design will advance and that there will be developments in materials research, such as perovskite cells. Additionally, R&D promotes the creation of more effective inverters, grid integration technologies, and next-generation storage options.
Transportation Electrification
The shift to electric vehicles (EVs) results in synergies with solar energy, as explained. Photovoltaic systems are being used to power photovoltaic carports and charging stations. Through this integration, the clean energy produced by solar panels is maximized while reducing the carbon impact of transportation. The need for solar-powered infrastructure for charging grows along with the EV market.
New Methods of Financing
The democratization of solar energy access is achieved by innovative finance structures like power purchase agreements (PPAs), solar renting, and community solar initiatives. They reduce the up-front expenses for both customers and companies. Additionally, solar subscription models and energy-as-a-service are taking off, opening up new revenue opportunities for suppliers. In order to create and scale these models, partnerships between solar companies, financial institutions, and technological companies are essential.
Cost Competitiveness and Grid Parity
Achieving grid parity—where the cost of solar energy is equal to or lower than that of conventional energy sources—presents a substantial growth opportunity. This is made possible by ongoing cost reductions in solar panel manufacture, installation, and maintenance. More households and companies will find solar energy profitable as the levelized price of electricity (LCOE) declines, fueling industry expansion.
Type Analysis
The Organic Photovoltaic (OPV) industry had the most revenue in the photovoltaic market. OPVs are a cutting-edge photovoltaic technology that uses organic materials to transform solar energy into electrical energy. The market is expected to expand as a result of anticipated improvements in OPV technology, which will also increase their effectiveness and capabilities. A favourable commercial environment for OPVs has also been created by the growing demand for flexible and lightweight photovoltaic systems, where they surpass their inorganic equivalents in these areas.
Component Analysis
The Photovoltaic (PV) Market was led by the cells category. These solar cells, which are also photovoltaic cells, are the basic components of a photovoltaic system. Their purpose is to convert solar energy into electrical power, which they then use to power various commercial, industrial, and domestic uses. Due to its crucial contribution to the overall effectiveness of photovoltaic systems, this cell category commands significance in the PV market. The development of higher-efficiency solar cells and other ongoing advances in photovoltaic cell technology have accelerated the growth of this market and raised the economic value of photovoltaic technology.
Application Analysis
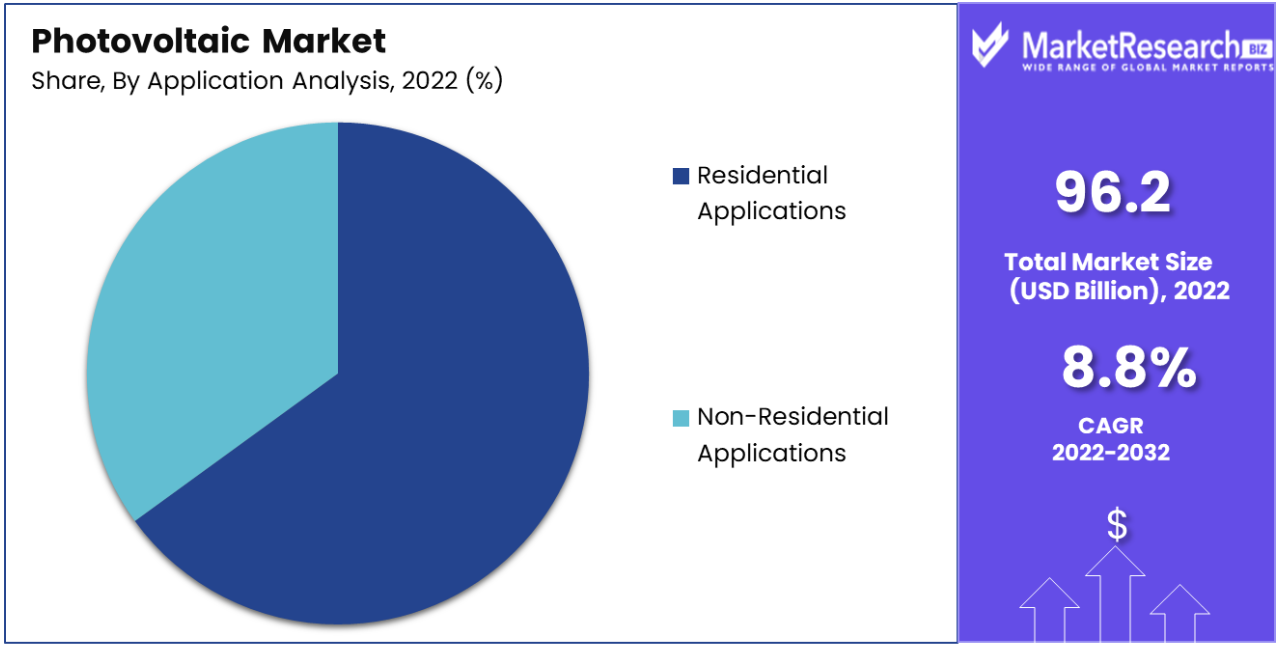
The market is now dominated by the residential application segment. This increase is related to homeowners and owners of residential property embracing solar technology more frequently. Residential photovoltaic systems have a number of benefits, including lower electricity costs, a smaller environmental effect, and greater energy independence. Residential solar systems are now more readily available and affordable for homes thanks to government subsidies and incentives as well as falling costs in photovoltaic technology. The upward trajectory of expansion of the photovoltaic (PV) sector is a result of these dynamics taken as a whole.
Key Market Segments
By Type
- Organic PV
- Inorganic PV
By Component
- Cells
- Modules
- Optics
By Application
- Residential Applications
- Non-Residential Applications
Latest Trends
Adoption of Bifacial Photovoltaic Panels
Photovoltaic panels that are bifacial have shown significant market growth. Bifacial solar panels can produce power from both sides of the sun, unlike conventional solar panels, which only collect sunlight from one. This invention gives greater installation flexibility and improves the efficiency of energy generation. It is especially useful in environments with reflecting surfaces or shifting sun angles. As a result, bifacial panels are increasingly being used in both home and business photovoltaic systems.
Integration of Solar-Tracking Systems
The market for photovoltaics is increasingly integrating solar-tracking systems. These systems dynamically change the direction and angle of the solar panels so that they always face the sun. By doing this, energy capture is maximized and overall system efficiency is considerably increased. Solar-tracking systems are increasingly being used in smaller installations, despite previously being more popular in large-scale utility projects. This development is the result of a deliberate effort to increase energy efficiency and utilize solar technology to its fullest extent.
Synergy of Energy Storage Solutions
A prominent development is the combination of energy storage technologies and solar systems. This integration addresses the unpredictable nature of solar power by allowing the storing of extra energy produced during the hours of maximum sunlight. This trend is being supported by enhanced battery technologies and intelligent energy management systems. The photovoltaic market is observing a shift toward comprehensive solar-plus-storage systems as energy storage becomes more effective and economical. This development fits well with the overarching objective of increasing grid resilience and energy independence.
Regional Analysis
Asia-Pacific region dominates the market for photovoltaic (PV) technology. Numerous suppliers and important players support this significance, driving expansion and enhancing market presence. The rapidly industrializing area and its expanding population are driving up energy demand to unprecedented levels.
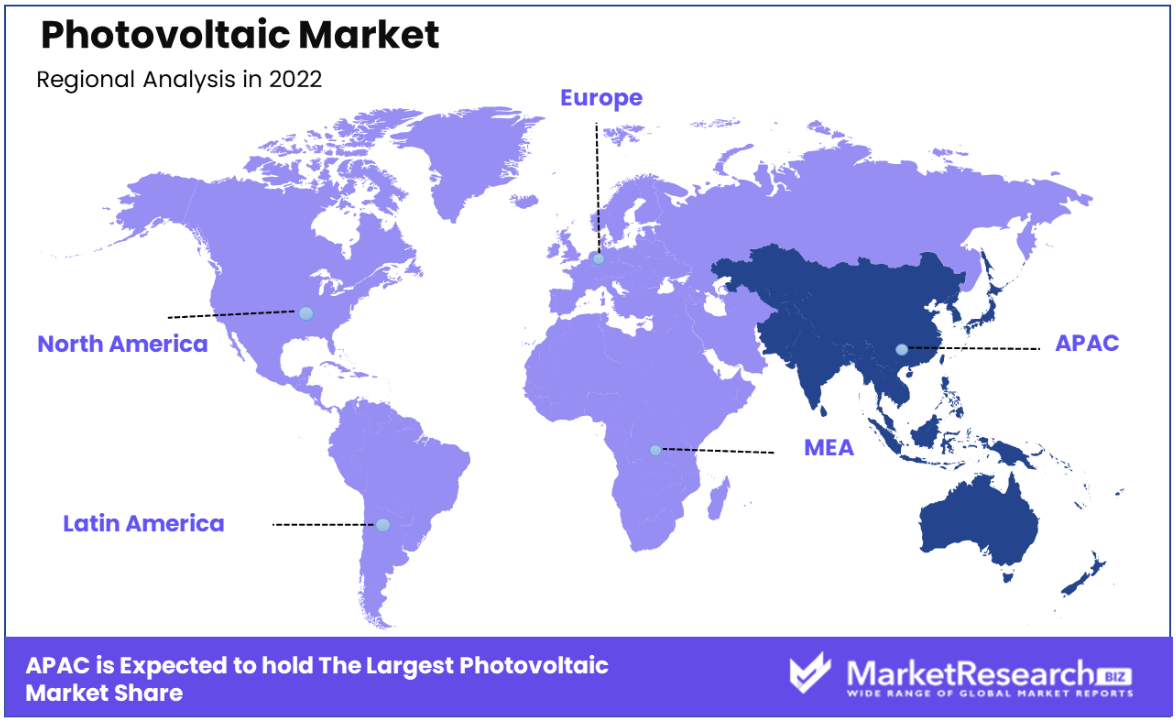
The progress of renewable energies, particularly in solar technology, has been aggressively supported by policies and incentives put in place by governments around the region. Additionally, Asia-Pacific is a centre for innovative photovoltaic technology companies, which has seen significant advancements in technological advances that raise the efficacy and affordability of PV systems.
Key Regions and Countries
North America
- US
- Canada
Europe
- Germany
- France
- The UK
- Spain
- Italy
- Russia
- Netherland
- Rest of Europe
Asia Pacific
- China
- Japan
- South Korea
- India
- New Zealand
- Singapore
- Thailand
- Vietnam
- Rest of APAC
Latin America
- Brazil
- Mexico
- Rest of Latin America
Middle East & Africa
- South Africa
- Saudi Arabia
- UAE
- Rest of MEA
Key Players Analysis
A well-known Chinese company called Risen Energy Co. Ltd. focuses on producing and distributing photovoltaic (PV) solutions. They provide a wide variety of PV goods, including modules, systems, and related parts. These modules demonstrate their adaptability by serving applications at the utility-scale, commercial, and residential levels.
Shunfeng International Clean Energy Limited, a significant player in the clean energy industry, is focused heavily on the production of photovoltaic power. Their product range is identical to Risen Energy's, and it includes systems, modules, and related components that are designed for different purposes. Both businesses are dedicated to providing high-quality, dependable, and economical PV solutions. They place a high priority on research and development, continuing their pursuit of technological development and product improvement.
Top Key Players in Photovoltaics Market
- Risen Energy Co. Ltd
- Shunfeng International Clean Energy Limited
- Mitsubishi Electric Corporation
- GCL System Integration
- JA Solar Holdings
- Kaneka Corporation
- Sharp Corporation
- Suntech Power Co.
- Trina Solar Limited
- Canadian Solar Inc.
- Jinko Solar Holding Co., Ltd
Recent Developments
- Canadian Solar said in December 2022 that in the first quarter of 2023, its majority-owned subsidiary CSI Solar Co., Ltd. would start mass producing high efficiency N-type TOPCon (Tunnel Oxide Passivated Contact) solar modules.
- In December 2022, ACCIONA Energia and Hanwha Corporation, a South Korean industrial conglomerate, entered into a purchase deal for Cunningham, the largest battery energy storage system (BESS) project of its sort in Texas.
- Leading Chinese solar business Trina Solar started building a sizable industrial park in the Qinghai region of central China on June 22, 2022. Nearly the whole PV production process will be covered by this facility, from the production of high-purity polysilicon and silicon to the creation of monosilicon, wafer fabrication, cell manufacturing, and module assembly. Additionally, the location will feature support manufacturing lines.
- Additionally, JA Solar, a well-known Chinese solar panel producer, supplied its DeepBlue 3.0 module for the rooftops PV system at Beijing Fengtai Railway Station on June 20, 2022. As JA Solar's cutting-edge technology adorns the busiest railway hub in Asia, this installation represents an important turning point.
- Canadian Solar announced in March 2022 that it had begun mass producing new 54-cell format modules with 182 mm cells for rooftop solar systems for residential, commercial, and industrial use.
Report Features Description Market Value (2022) US$ 96.2 Bn Forecast Revenue (2032) US$ 218.9 Bn CAGR (2023-2032) 8.8% Base Year for Estimation 2022 Historic Period 2016-2022 Forecast Period 2023-2032 Report Coverage Revenue Forecast, Market Dynamics, COVID-19 Impact, Competitive Landscape, Recent Developments Segments Covered By Type (Organic PV, Inorganic PV), By Component (Cells, Modules, and Optics), By Application (Residential Applications, Non-Residential Applications) Regional Analysis North America – The US, Canada, Mexico, Latin America – Brazil, Colombia, Chile, Argentina, Costa Rica, & Rest of Latin America, Eastern Europe – Russia, Poland, The Czech Republic, Greece, Rest of Eastern Europe, Western Europe – Germany, France, The UK, Spain, Italy, Portugal, Ireland, Austria, Switzerland, Benelux, Nordic, Rest of Western Europe, APAC – China, Japan, South Korea, India, Australia & New Zealand, Indonesia, Malaysia, Philippines, Singapore, Thailand, Vietnam, Rest of APAC, Middle East & Africa – Algeria, Egypt, Israel, Kuwait, Nigeria, Saudi Arabia, South Africa, Turkey, United Arab Emirates, Rest of MEA Competitive Landscape Risen Energy Co. Ltd, Shunfeng International Clean Energy Limited, Mitsubishi Electric Corporation, GCL System Integration, JA Solar Holdings, Kaneka Corporation, Sharp Corporation, Suntech Power Co., Trina Solar Limited, Canadian Solar Inc., and Jinko Solar Holding Co., Ltd. Customization Scope Customization for segments, region/country-level will be provided. Moreover, additional customization can be done based on the requirements. Purchase Options We have three licenses to opt for: Single User License, Multi-User License (Up to 5 Users), Corporate Use License (Unlimited User and Printable PDF) -
- 1. Executive Summary
- 1.1. Definition
- 1.2. Taxonomy
- 1.3. Research Scope
- 1.4. Key Analysis
- 1.5. Key Findings by Major Segments
- 1.6. Top strategies by Major Players
- 2. Global Photovoltaic Market Overview
- 2.1. Photovoltaic Market Dynamics
- 2.1.1. Drivers
- 2.1.2. Opportunities
- 2.1.3. Restraints
- 2.1.4. Challenges
- 2.2. Macro-economic Factors
- 2.3. Regulatory Framework
- 2.4. Market Investment Feasibility Index
- 2.5. PEST Analysis
- 2.6. PORTER’S Five Force Analysis
- 2.7. Drivers & Restraints Impact Analysis
- 2.8. Industry Chain Analysis
- 2.9. Cost Structure Analysis
- 2.10. Marketing Strategy
- 2.11. Russia-Ukraine War Impact Analysis
- 2.12. Opportunity Map Analysis
- 2.13. Market Competition Scenario Analysis
- 2.14. Product Life Cycle Analysis
- 2.15. Opportunity Orbits
- 2.16. Manufacturer Intensity Map
- 2.17. Major Companies sales by Value & Volume
- 2.1. Photovoltaic Market Dynamics
- 3. Global Photovoltaic Market Analysis, Opportunity and Forecast, 2016-2032
- 3.1. Global Photovoltaic Market Analysis, 2016-2021
- 3.2. Global Photovoltaic Market Opportunity and Forecast, 2023-2032
- 3.3. Global Photovoltaic Market Analysis, Opportunity and Forecast, By Product Type, 2016-2032
- 3.3.1. Global Photovoltaic Market Analysis by Product Type: Introduction
- 3.3.2. Market Size Absolute $ Opportunity Analysis and Forecast, By Product Type, 2016-2032
- 3.3.3. Organic PV
- 3.3.4. Inorganic PV
- 3.4. Global Photovoltaic Market Analysis, Opportunity and Forecast, By Component, 2016-2032
- 3.4.1. Global Photovoltaic Market Analysis by Component: Introduction
- 3.4.2. Market Size Absolute $ Opportunity Analysis and Forecast, By Component, 2016-2032
- 3.4.3. Cells
- 3.4.4. Modules
- 3.4.5. Optics
- 3.5. Global Photovoltaic Market Analysis, Opportunity and Forecast, By Application, 2016-2032
- 3.5.1. Global Photovoltaic Market Analysis by Application: Introduction
- 3.5.2. Market Size Absolute $ Opportunity Analysis and Forecast, By Application, 2016-2032
- 3.5.3. Residential Applications
- 3.5.4. Non-Residential Applications
- 4. North America Photovoltaic Market Analysis, Opportunity and Forecast, 2016-2032
- 4.1. North America Photovoltaic Market Analysis, 2016-2021
- 4.2. North America Photovoltaic Market Opportunity and Forecast, 2023-2032
- 4.3. North America Photovoltaic Market Analysis, Opportunity and Forecast, By Product Type, 2016-2032
- 4.3.1. North America Photovoltaic Market Analysis by Product Type: Introduction
- 4.3.2. Market Size Absolute $ Opportunity Analysis and Forecast, By Product Type, 2016-2032
- 4.3.3. Organic PV
- 4.3.4. Inorganic PV
- 4.4. North America Photovoltaic Market Analysis, Opportunity and Forecast, By Component, 2016-2032
- 4.4.1. North America Photovoltaic Market Analysis by Component: Introduction
- 4.4.2. Market Size Absolute $ Opportunity Analysis and Forecast, By Component, 2016-2032
- 4.4.3. Cells
- 4.4.4. Modules
- 4.4.5. Optics
- 4.5. North America Photovoltaic Market Analysis, Opportunity and Forecast, By Application, 2016-2032
- 4.5.1. North America Photovoltaic Market Analysis by Application: Introduction
- 4.5.2. Market Size Absolute $ Opportunity Analysis and Forecast, By Application, 2016-2032
- 4.5.3. Residential Applications
- 4.5.4. Non-Residential Applications
- 4.6. North America Photovoltaic Market Analysis, Opportunity and Forecast, By Country , 2016-2032
- 4.6.1. North America Photovoltaic Market Analysis by Country : Introduction
- 4.6.2. Market Size Absolute $ Opportunity Analysis and Forecast, Country , 2016-2032
- 4.6.2.1. The US
- 4.6.2.2. Canada
- 4.6.2.3. Mexico
- 5. Western Europe Photovoltaic Market Analysis, Opportunity and Forecast, 2016-2032
- 5.1. Western Europe Photovoltaic Market Analysis, 2016-2021
- 5.2. Western Europe Photovoltaic Market Opportunity and Forecast, 2023-2032
- 5.3. Western Europe Photovoltaic Market Analysis, Opportunity and Forecast, By Product Type, 2016-2032
- 5.3.1. Western Europe Photovoltaic Market Analysis by Product Type: Introduction
- 5.3.2. Market Size Absolute $ Opportunity Analysis and Forecast, By Product Type, 2016-2032
- 5.3.3. Organic PV
- 5.3.4. Inorganic PV
- 5.4. Western Europe Photovoltaic Market Analysis, Opportunity and Forecast, By Component, 2016-2032
- 5.4.1. Western Europe Photovoltaic Market Analysis by Component: Introduction
- 5.4.2. Market Size Absolute $ Opportunity Analysis and Forecast, By Component, 2016-2032
- 5.4.3. Cells
- 5.4.4. Modules
- 5.4.5. Optics
- 5.5. Western Europe Photovoltaic Market Analysis, Opportunity and Forecast, By Application, 2016-2032
- 5.5.1. Western Europe Photovoltaic Market Analysis by Application: Introduction
- 5.5.2. Market Size Absolute $ Opportunity Analysis and Forecast, By Application, 2016-2032
- 5.5.3. Residential Applications
- 5.5.4. Non-Residential Applications
- 5.6. Western Europe Photovoltaic Market Analysis, Opportunity and Forecast, By Country , 2016-2032
- 5.6.1. Western Europe Photovoltaic Market Analysis by Country : Introduction
- 5.6.2. Market Size Absolute $ Opportunity Analysis and Forecast, Country , 2016-2032
- 5.6.2.1. Germany
- 5.6.2.2. France
- 5.6.2.3. The UK
- 5.6.2.4. Spain
- 5.6.2.5. Italy
- 5.6.2.6. Portugal
- 5.6.2.7. Ireland
- 5.6.2.8. Austria
- 5.6.2.9. Switzerland
- 5.6.2.10. Benelux
- 5.6.2.11. Nordic
- 5.6.2.12. Rest of Western Europe
- 6. Eastern Europe Photovoltaic Market Analysis, Opportunity and Forecast, 2016-2032
- 6.1. Eastern Europe Photovoltaic Market Analysis, 2016-2021
- 6.2. Eastern Europe Photovoltaic Market Opportunity and Forecast, 2023-2032
- 6.3. Eastern Europe Photovoltaic Market Analysis, Opportunity and Forecast, By Product Type, 2016-2032
- 6.3.1. Eastern Europe Photovoltaic Market Analysis by Product Type: Introduction
- 6.3.2. Market Size Absolute $ Opportunity Analysis and Forecast, By Product Type, 2016-2032
- 6.3.3. Organic PV
- 6.3.4. Inorganic PV
- 6.4. Eastern Europe Photovoltaic Market Analysis, Opportunity and Forecast, By Component, 2016-2032
- 6.4.1. Eastern Europe Photovoltaic Market Analysis by Component: Introduction
- 6.4.2. Market Size Absolute $ Opportunity Analysis and Forecast, By Component, 2016-2032
- 6.4.3. Cells
- 6.4.4. Modules
- 6.4.5. Optics
- 6.5. Eastern Europe Photovoltaic Market Analysis, Opportunity and Forecast, By Application, 2016-2032
- 6.5.1. Eastern Europe Photovoltaic Market Analysis by Application: Introduction
- 6.5.2. Market Size Absolute $ Opportunity Analysis and Forecast, By Application, 2016-2032
- 6.5.3. Residential Applications
- 6.5.4. Non-Residential Applications
- 6.6. Eastern Europe Photovoltaic Market Analysis, Opportunity and Forecast, By Country , 2016-2032
- 6.6.1. Eastern Europe Photovoltaic Market Analysis by Country : Introduction
- 6.6.2. Market Size Absolute $ Opportunity Analysis and Forecast, Country , 2016-2032
- 6.6.2.1. Russia
- 6.6.2.2. Poland
- 6.6.2.3. The Czech Republic
- 6.6.2.4. Greece
- 6.6.2.5. Rest of Eastern Europe
- 7. APAC Photovoltaic Market Analysis, Opportunity and Forecast, 2016-2032
- 7.1. APAC Photovoltaic Market Analysis, 2016-2021
- 7.2. APAC Photovoltaic Market Opportunity and Forecast, 2023-2032
- 7.3. APAC Photovoltaic Market Analysis, Opportunity and Forecast, By Product Type, 2016-2032
- 7.3.1. APAC Photovoltaic Market Analysis by Product Type: Introduction
- 7.3.2. Market Size Absolute $ Opportunity Analysis and Forecast, By Product Type, 2016-2032
- 7.3.3. Organic PV
- 7.3.4. Inorganic PV
- 7.4. APAC Photovoltaic Market Analysis, Opportunity and Forecast, By Component, 2016-2032
- 7.4.1. APAC Photovoltaic Market Analysis by Component: Introduction
- 7.4.2. Market Size Absolute $ Opportunity Analysis and Forecast, By Component, 2016-2032
- 7.4.3. Cells
- 7.4.4. Modules
- 7.4.5. Optics
- 7.5. APAC Photovoltaic Market Analysis, Opportunity and Forecast, By Application, 2016-2032
- 7.5.1. APAC Photovoltaic Market Analysis by Application: Introduction
- 7.5.2. Market Size Absolute $ Opportunity Analysis and Forecast, By Application, 2016-2032
- 7.5.3. Residential Applications
- 7.5.4. Non-Residential Applications
- 7.6. APAC Photovoltaic Market Analysis, Opportunity and Forecast, By Country , 2016-2032
- 7.6.1. APAC Photovoltaic Market Analysis by Country : Introduction
- 7.6.2. Market Size Absolute $ Opportunity Analysis and Forecast, Country , 2016-2032
- 7.6.2.1. China
- 7.6.2.2. Japan
- 7.6.2.3. South Korea
- 7.6.2.4. India
- 7.6.2.5. Australia & New Zeland
- 7.6.2.6. Indonesia
- 7.6.2.7. Malaysia
- 7.6.2.8. Philippines
- 7.6.2.9. Singapore
- 7.6.2.10. Thailand
- 7.6.2.11. Vietnam
- 7.6.2.12. Rest of APAC
- 8. Latin America Photovoltaic Market Analysis, Opportunity and Forecast, 2016-2032
- 8.1. Latin America Photovoltaic Market Analysis, 2016-2021
- 8.2. Latin America Photovoltaic Market Opportunity and Forecast, 2023-2032
- 8.3. Latin America Photovoltaic Market Analysis, Opportunity and Forecast, By Product Type, 2016-2032
- 8.3.1. Latin America Photovoltaic Market Analysis by Product Type: Introduction
- 8.3.2. Market Size Absolute $ Opportunity Analysis and Forecast, By Product Type, 2016-2032
- 8.3.3. Organic PV
- 8.3.4. Inorganic PV
- 8.4. Latin America Photovoltaic Market Analysis, Opportunity and Forecast, By Component, 2016-2032
- 8.4.1. Latin America Photovoltaic Market Analysis by Component: Introduction
- 8.4.2. Market Size Absolute $ Opportunity Analysis and Forecast, By Component, 2016-2032
- 8.4.3. Cells
- 8.4.4. Modules
- 8.4.5. Optics
- 8.5. Latin America Photovoltaic Market Analysis, Opportunity and Forecast, By Application, 2016-2032
- 8.5.1. Latin America Photovoltaic Market Analysis by Application: Introduction
- 8.5.2. Market Size Absolute $ Opportunity Analysis and Forecast, By Application, 2016-2032
- 8.5.3. Residential Applications
- 8.5.4. Non-Residential Applications
- 8.6. Latin America Photovoltaic Market Analysis, Opportunity and Forecast, By Country , 2016-2032
- 8.6.1. Latin America Photovoltaic Market Analysis by Country : Introduction
- 8.6.2. Market Size Absolute $ Opportunity Analysis and Forecast, Country , 2016-2032
- 8.6.2.1. Brazil
- 8.6.2.2. Colombia
- 8.6.2.3. Chile
- 8.6.2.4. Argentina
- 8.6.2.5. Costa Rica
- 8.6.2.6. Rest of Latin America
- 9. Middle East & Africa Photovoltaic Market Analysis, Opportunity and Forecast, 2016-2032
- 9.1. Middle East & Africa Photovoltaic Market Analysis, 2016-2021
- 9.2. Middle East & Africa Photovoltaic Market Opportunity and Forecast, 2023-2032
- 9.3. Middle East & Africa Photovoltaic Market Analysis, Opportunity and Forecast, By Product Type, 2016-2032
- 9.3.1. Middle East & Africa Photovoltaic Market Analysis by Product Type: Introduction
- 9.3.2. Market Size Absolute $ Opportunity Analysis and Forecast, By Product Type, 2016-2032
- 9.3.3. Organic PV
- 9.3.4. Inorganic PV
- 9.4. Middle East & Africa Photovoltaic Market Analysis, Opportunity and Forecast, By Component, 2016-2032
- 9.4.1. Middle East & Africa Photovoltaic Market Analysis by Component: Introduction
- 9.4.2. Market Size Absolute $ Opportunity Analysis and Forecast, By Component, 2016-2032
- 9.4.3. Cells
- 9.4.4. Modules
- 9.4.5. Optics
- 9.5. Middle East & Africa Photovoltaic Market Analysis, Opportunity and Forecast, By Application, 2016-2032
- 9.5.1. Middle East & Africa Photovoltaic Market Analysis by Application: Introduction
- 9.5.2. Market Size Absolute $ Opportunity Analysis and Forecast, By Application, 2016-2032
- 9.5.3. Residential Applications
- 9.5.4. Non-Residential Applications
- 9.6. Middle East & Africa Photovoltaic Market Analysis, Opportunity and Forecast, By Country , 2016-2032
- 9.6.1. Middle East & Africa Photovoltaic Market Analysis by Country : Introduction
- 9.6.2. Market Size Absolute $ Opportunity Analysis and Forecast, Country , 2016-2032
- 9.6.2.1. Algeria
- 9.6.2.2. Egypt
- 9.6.2.3. Israel
- 9.6.2.4. Kuwait
- 9.6.2.5. Nigeria
- 9.6.2.6. Saudi Arabia
- 9.6.2.7. South Africa
- 9.6.2.8. Turkey
- 9.6.2.9. The UAE
- 9.6.2.10. Rest of MEA
- 10. Global Photovoltaic Market Analysis, Opportunity and Forecast, By Region , 2016-2032
- 10.1. Global Photovoltaic Market Analysis by Region : Introduction
- 10.2. Market Size Absolute $ Opportunity Analysis and Forecast, By Region , 2016-2032
- 10.2.1. North America
- 10.2.2. Western Europe
- 10.2.3. Eastern Europe
- 10.2.4. APAC
- 10.2.5. Latin America
- 10.2.6. Middle East & Africa
- 11. Global Photovoltaic Market Competitive Landscape, Market Share Analysis, and Company Profiles
- 11.1. Market Share Analysis
- 11.2. Company Profiles
- 11.3. Risen Energy Co. Ltd
- 11.3.1. Company Overview
- 11.3.2. Financial Highlights
- 11.3.3. Product Portfolio
- 11.3.4. SWOT Analysis
- 11.3.5. Key Strategies and Developments
- 11.4. Shunfeng International Clean Energy Limited
- 11.4.1. Company Overview
- 11.4.2. Financial Highlights
- 11.4.3. Product Portfolio
- 11.4.4. SWOT Analysis
- 11.4.5. Key Strategies and Developments
- 11.5. Mitsubishi Electric Corporation
- 11.5.1. Company Overview
- 11.5.2. Financial Highlights
- 11.5.3. Product Portfolio
- 11.5.4. SWOT Analysis
- 11.5.5. Key Strategies and Developments
- 11.6. GCL System Integration
- 11.6.1. Company Overview
- 11.6.2. Financial Highlights
- 11.6.3. Product Portfolio
- 11.6.4. SWOT Analysis
- 11.6.5. Key Strategies and Developments
- 11.7. JA Solar Holdings
- 11.7.1. Company Overview
- 11.7.2. Financial Highlights
- 11.7.3. Product Portfolio
- 11.7.4. SWOT Analysis
- 11.7.5. Key Strategies and Developments
- 11.8. Kaneka Corporation
- 11.8.1. Company Overview
- 11.8.2. Financial Highlights
- 11.8.3. Product Portfolio
- 11.8.4. SWOT Analysis
- 11.8.5. Key Strategies and Developments
- 11.9. Sharp Corporation
- 11.9.1. Company Overview
- 11.9.2. Financial Highlights
- 11.9.3. Product Portfolio
- 11.9.4. SWOT Analysis
- 11.9.5. Key Strategies and Developments
- 11.10. Suntech Power Co.
- 11.10.1. Company Overview
- 11.10.2. Financial Highlights
- 11.10.3. Product Portfolio
- 11.10.4. SWOT Analysis
- 11.10.5. Key Strategies and Developments
- 11.11. Trina Solar Limited
- 11.11.1. Company Overview
- 11.11.2. Financial Highlights
- 11.11.3. Product Portfolio
- 11.11.4. SWOT Analysis
- 11.11.5. Key Strategies and Developments
- 11.12. Canadian Solar Inc.
- 11.12.1. Company Overview
- 11.12.2. Financial Highlights
- 11.12.3. Product Portfolio
- 11.12.4. SWOT Analysis
- 11.12.5. Key Strategies and Developments
- 11.13.1. Company Overview
- 11.13.2. Financial Highlights
- 11.13.3. Product Portfolio
- 11.13.4. SWOT Analysis
- 11.13.5. Key Strategies and Developments
- 11.14. Other Key Players
- 11.14.1. Company Overview
- 11.14.2. Financial Highlights
- 11.14.3. Product Portfolio
- 11.14.4. SWOT Analysis
- 11.14.5. Key Strategies and Developments
- 11.16.1. Company Overview
- 11.16.2. Financial Highlights
- 11.16.3. Product Portfolio
- 11.16.4. SWOT Analysis
- 11.16.5. Key Strategies and Developments
- 12. Assumptions and Acronyms
- 13. Research Methodology
- 14. Contact
- List of Figures
- Figure 1: Global Photovoltaic Market Revenue (US$ Mn) Market Share by Product Type in 2022
- Figure 2: Global Photovoltaic Market Attractiveness Analysis by Product Type, 2016-2032
- Figure 3: Global Photovoltaic Market Revenue (US$ Mn) Market Share by Componentin 2022
- Figure 4: Global Photovoltaic Market Attractiveness Analysis by Component, 2016-2032
- Figure 5: Global Photovoltaic Market Revenue (US$ Mn) Market Share by Applicationin 2022
- Figure 6: Global Photovoltaic Market Attractiveness Analysis by Application, 2016-2032
- Figure 7: Global Photovoltaic Market Revenue (US$ Mn) Market Share by Region in 2022
- Figure 8: Global Photovoltaic Market Attractiveness Analysis by Region, 2016-2032
- Figure 9: Global Photovoltaic Market Revenue (US$ Mn) (2016-2032)
- Figure 10: Global Photovoltaic Market Revenue (US$ Mn) Comparison by Region (2016-2032)
- Figure 11: Global Photovoltaic Market Revenue (US$ Mn) Comparison by Product Type (2016-2032)
- Figure 12: Global Photovoltaic Market Revenue (US$ Mn) Comparison by Component (2016-2032)
- Figure 13: Global Photovoltaic Market Revenue (US$ Mn) Comparison by Application (2016-2032)
- Figure 14: Global Photovoltaic Market Y-o-Y Growth Rate Comparison by Region (2016-2032)
- Figure 15: Global Photovoltaic Market Y-o-Y Growth Rate Comparison by Product Type (2016-2032)
- Figure 16: Global Photovoltaic Market Y-o-Y Growth Rate Comparison by Component (2016-2032)
- Figure 17: Global Photovoltaic Market Y-o-Y Growth Rate Comparison by Application (2016-2032)
- Figure 18: Global Photovoltaic Market Share Comparison by Region (2016-2032)
- Figure 19: Global Photovoltaic Market Share Comparison by Product Type (2016-2032)
- Figure 20: Global Photovoltaic Market Share Comparison by Component (2016-2032)
- Figure 21: Global Photovoltaic Market Share Comparison by Application (2016-2032)
- Figure 22: North America Photovoltaic Market Revenue (US$ Mn) Market Share by Product Typein 2022
- Figure 23: North America Photovoltaic Market Attractiveness Analysis by Product Type, 2016-2032
- Figure 24: North America Photovoltaic Market Revenue (US$ Mn) Market Share by Componentin 2022
- Figure 25: North America Photovoltaic Market Attractiveness Analysis by Component, 2016-2032
- Figure 26: North America Photovoltaic Market Revenue (US$ Mn) Market Share by Applicationin 2022
- Figure 27: North America Photovoltaic Market Attractiveness Analysis by Application, 2016-2032
- Figure 28: North America Photovoltaic Market Revenue (US$ Mn) Market Share by Country in 2022
- Figure 29: North America Photovoltaic Market Attractiveness Analysis by Country, 2016-2032
- Figure 30: North America Photovoltaic Market Revenue (US$ Mn) (2016-2032)
- Figure 31: North America Photovoltaic Market Revenue (US$ Mn) Comparison by Country (2016-2032)
- Figure 32: North America Photovoltaic Market Revenue (US$ Mn) Comparison by Product Type (2016-2032)
- Figure 33: North America Photovoltaic Market Revenue (US$ Mn) Comparison by Component (2016-2032)
- Figure 34: North America Photovoltaic Market Revenue (US$ Mn) Comparison by Application (2016-2032)
- Figure 35: North America Photovoltaic Market Y-o-Y Growth Rate Comparison by Country (2016-2032)
- Figure 36: North America Photovoltaic Market Y-o-Y Growth Rate Comparison by Product Type (2016-2032)
- Figure 37: North America Photovoltaic Market Y-o-Y Growth Rate Comparison by Component (2016-2032)
- Figure 38: North America Photovoltaic Market Y-o-Y Growth Rate Comparison by Application (2016-2032)
- Figure 39: North America Photovoltaic Market Share Comparison by Country (2016-2032)
- Figure 40: North America Photovoltaic Market Share Comparison by Product Type (2016-2032)
- Figure 41: North America Photovoltaic Market Share Comparison by Component (2016-2032)
- Figure 42: North America Photovoltaic Market Share Comparison by Application (2016-2032)
- Figure 43: Western Europe Photovoltaic Market Revenue (US$ Mn) Market Share by Product Typein 2022
- Figure 44: Western Europe Photovoltaic Market Attractiveness Analysis by Product Type, 2016-2032
- Figure 45: Western Europe Photovoltaic Market Revenue (US$ Mn) Market Share by Componentin 2022
- Figure 46: Western Europe Photovoltaic Market Attractiveness Analysis by Component, 2016-2032
- Figure 47: Western Europe Photovoltaic Market Revenue (US$ Mn) Market Share by Applicationin 2022
- Figure 48: Western Europe Photovoltaic Market Attractiveness Analysis by Application, 2016-2032
- Figure 49: Western Europe Photovoltaic Market Revenue (US$ Mn) Market Share by Country in 2022
- Figure 50: Western Europe Photovoltaic Market Attractiveness Analysis by Country, 2016-2032
- Figure 51: Western Europe Photovoltaic Market Revenue (US$ Mn) (2016-2032)
- Figure 52: Western Europe Photovoltaic Market Revenue (US$ Mn) Comparison by Country (2016-2032)
- Figure 53: Western Europe Photovoltaic Market Revenue (US$ Mn) Comparison by Product Type (2016-2032)
- Figure 54: Western Europe Photovoltaic Market Revenue (US$ Mn) Comparison by Component (2016-2032)
- Figure 55: Western Europe Photovoltaic Market Revenue (US$ Mn) Comparison by Application (2016-2032)
- Figure 56: Western Europe Photovoltaic Market Y-o-Y Growth Rate Comparison by Country (2016-2032)
- Figure 57: Western Europe Photovoltaic Market Y-o-Y Growth Rate Comparison by Product Type (2016-2032)
- Figure 58: Western Europe Photovoltaic Market Y-o-Y Growth Rate Comparison by Component (2016-2032)
- Figure 59: Western Europe Photovoltaic Market Y-o-Y Growth Rate Comparison by Application (2016-2032)
- Figure 60: Western Europe Photovoltaic Market Share Comparison by Country (2016-2032)
- Figure 61: Western Europe Photovoltaic Market Share Comparison by Product Type (2016-2032)
- Figure 62: Western Europe Photovoltaic Market Share Comparison by Component (2016-2032)
- Figure 63: Western Europe Photovoltaic Market Share Comparison by Application (2016-2032)
- Figure 64: Eastern Europe Photovoltaic Market Revenue (US$ Mn) Market Share by Product Typein 2022
- Figure 65: Eastern Europe Photovoltaic Market Attractiveness Analysis by Product Type, 2016-2032
- Figure 66: Eastern Europe Photovoltaic Market Revenue (US$ Mn) Market Share by Componentin 2022
- Figure 67: Eastern Europe Photovoltaic Market Attractiveness Analysis by Component, 2016-2032
- Figure 68: Eastern Europe Photovoltaic Market Revenue (US$ Mn) Market Share by Applicationin 2022
- Figure 69: Eastern Europe Photovoltaic Market Attractiveness Analysis by Application, 2016-2032
- Figure 70: Eastern Europe Photovoltaic Market Revenue (US$ Mn) Market Share by Country in 2022
- Figure 71: Eastern Europe Photovoltaic Market Attractiveness Analysis by Country, 2016-2032
- Figure 72: Eastern Europe Photovoltaic Market Revenue (US$ Mn) (2016-2032)
- Figure 73: Eastern Europe Photovoltaic Market Revenue (US$ Mn) Comparison by Country (2016-2032)
- Figure 74: Eastern Europe Photovoltaic Market Revenue (US$ Mn) Comparison by Product Type (2016-2032)
- Figure 75: Eastern Europe Photovoltaic Market Revenue (US$ Mn) Comparison by Component (2016-2032)
- Figure 76: Eastern Europe Photovoltaic Market Revenue (US$ Mn) Comparison by Application (2016-2032)
- Figure 77: Eastern Europe Photovoltaic Market Y-o-Y Growth Rate Comparison by Country (2016-2032)
- Figure 78: Eastern Europe Photovoltaic Market Y-o-Y Growth Rate Comparison by Product Type (2016-2032)
- Figure 79: Eastern Europe Photovoltaic Market Y-o-Y Growth Rate Comparison by Component (2016-2032)
- Figure 80: Eastern Europe Photovoltaic Market Y-o-Y Growth Rate Comparison by Application (2016-2032)
- Figure 81: Eastern Europe Photovoltaic Market Share Comparison by Country (2016-2032)
- Figure 82: Eastern Europe Photovoltaic Market Share Comparison by Product Type (2016-2032)
- Figure 83: Eastern Europe Photovoltaic Market Share Comparison by Component (2016-2032)
- Figure 84: Eastern Europe Photovoltaic Market Share Comparison by Application (2016-2032)
- Figure 85: APAC Photovoltaic Market Revenue (US$ Mn) Market Share by Product Typein 2022
- Figure 86: APAC Photovoltaic Market Attractiveness Analysis by Product Type, 2016-2032
- Figure 87: APAC Photovoltaic Market Revenue (US$ Mn) Market Share by Componentin 2022
- Figure 88: APAC Photovoltaic Market Attractiveness Analysis by Component, 2016-2032
- Figure 89: APAC Photovoltaic Market Revenue (US$ Mn) Market Share by Applicationin 2022
- Figure 90: APAC Photovoltaic Market Attractiveness Analysis by Application, 2016-2032
- Figure 91: APAC Photovoltaic Market Revenue (US$ Mn) Market Share by Country in 2022
- Figure 92: APAC Photovoltaic Market Attractiveness Analysis by Country, 2016-2032
- Figure 93: APAC Photovoltaic Market Revenue (US$ Mn) (2016-2032)
- Figure 94: APAC Photovoltaic Market Revenue (US$ Mn) Comparison by Country (2016-2032)
- Figure 95: APAC Photovoltaic Market Revenue (US$ Mn) Comparison by Product Type (2016-2032)
- Figure 96: APAC Photovoltaic Market Revenue (US$ Mn) Comparison by Component (2016-2032)
- Figure 97: APAC Photovoltaic Market Revenue (US$ Mn) Comparison by Application (2016-2032)
- Figure 98: APAC Photovoltaic Market Y-o-Y Growth Rate Comparison by Country (2016-2032)
- Figure 99: APAC Photovoltaic Market Y-o-Y Growth Rate Comparison by Product Type (2016-2032)
- Figure 100: APAC Photovoltaic Market Y-o-Y Growth Rate Comparison by Component (2016-2032)
- Figure 101: APAC Photovoltaic Market Y-o-Y Growth Rate Comparison by Application (2016-2032)
- Figure 102: APAC Photovoltaic Market Share Comparison by Country (2016-2032)
- Figure 103: APAC Photovoltaic Market Share Comparison by Product Type (2016-2032)
- Figure 104: APAC Photovoltaic Market Share Comparison by Component (2016-2032)
- Figure 105: APAC Photovoltaic Market Share Comparison by Application (2016-2032)
- Figure 106: Latin America Photovoltaic Market Revenue (US$ Mn) Market Share by Product Typein 2022
- Figure 107: Latin America Photovoltaic Market Attractiveness Analysis by Product Type, 2016-2032
- Figure 108: Latin America Photovoltaic Market Revenue (US$ Mn) Market Share by Componentin 2022
- Figure 109: Latin America Photovoltaic Market Attractiveness Analysis by Component, 2016-2032
- Figure 110: Latin America Photovoltaic Market Revenue (US$ Mn) Market Share by Applicationin 2022
- Figure 111: Latin America Photovoltaic Market Attractiveness Analysis by Application, 2016-2032
- Figure 112: Latin America Photovoltaic Market Revenue (US$ Mn) Market Share by Country in 2022
- Figure 113: Latin America Photovoltaic Market Attractiveness Analysis by Country, 2016-2032
- Figure 114: Latin America Photovoltaic Market Revenue (US$ Mn) (2016-2032)
- Figure 115: Latin America Photovoltaic Market Revenue (US$ Mn) Comparison by Country (2016-2032)
- Figure 116: Latin America Photovoltaic Market Revenue (US$ Mn) Comparison by Product Type (2016-2032)
- Figure 117: Latin America Photovoltaic Market Revenue (US$ Mn) Comparison by Component (2016-2032)
- Figure 118: Latin America Photovoltaic Market Revenue (US$ Mn) Comparison by Application (2016-2032)
- Figure 119: Latin America Photovoltaic Market Y-o-Y Growth Rate Comparison by Country (2016-2032)
- Figure 120: Latin America Photovoltaic Market Y-o-Y Growth Rate Comparison by Product Type (2016-2032)
- Figure 121: Latin America Photovoltaic Market Y-o-Y Growth Rate Comparison by Component (2016-2032)
- Figure 122: Latin America Photovoltaic Market Y-o-Y Growth Rate Comparison by Application (2016-2032)
- Figure 123: Latin America Photovoltaic Market Share Comparison by Country (2016-2032)
- Figure 124: Latin America Photovoltaic Market Share Comparison by Product Type (2016-2032)
- Figure 125: Latin America Photovoltaic Market Share Comparison by Component (2016-2032)
- Figure 126: Latin America Photovoltaic Market Share Comparison by Application (2016-2032)
- Figure 127: Middle East & Africa Photovoltaic Market Revenue (US$ Mn) Market Share by Product Typein 2022
- Figure 128: Middle East & Africa Photovoltaic Market Attractiveness Analysis by Product Type, 2016-2032
- Figure 129: Middle East & Africa Photovoltaic Market Revenue (US$ Mn) Market Share by Componentin 2022
- Figure 130: Middle East & Africa Photovoltaic Market Attractiveness Analysis by Component, 2016-2032
- Figure 131: Middle East & Africa Photovoltaic Market Revenue (US$ Mn) Market Share by Applicationin 2022
- Figure 132: Middle East & Africa Photovoltaic Market Attractiveness Analysis by Application, 2016-2032
- Figure 133: Middle East & Africa Photovoltaic Market Revenue (US$ Mn) Market Share by Country in 2022
- Figure 134: Middle East & Africa Photovoltaic Market Attractiveness Analysis by Country, 2016-2032
- Figure 135: Middle East & Africa Photovoltaic Market Revenue (US$ Mn) (2016-2032)
- Figure 136: Middle East & Africa Photovoltaic Market Revenue (US$ Mn) Comparison by Country (2016-2032)
- Figure 137: Middle East & Africa Photovoltaic Market Revenue (US$ Mn) Comparison by Product Type (2016-2032)
- Figure 138: Middle East & Africa Photovoltaic Market Revenue (US$ Mn) Comparison by Component (2016-2032)
- Figure 139: Middle East & Africa Photovoltaic Market Revenue (US$ Mn) Comparison by Application (2016-2032)
- Figure 140: Middle East & Africa Photovoltaic Market Y-o-Y Growth Rate Comparison by Country (2016-2032)
- Figure 141: Middle East & Africa Photovoltaic Market Y-o-Y Growth Rate Comparison by Product Type (2016-2032)
- Figure 142: Middle East & Africa Photovoltaic Market Y-o-Y Growth Rate Comparison by Component (2016-2032)
- Figure 143: Middle East & Africa Photovoltaic Market Y-o-Y Growth Rate Comparison by Application (2016-2032)
- Figure 144: Middle East & Africa Photovoltaic Market Share Comparison by Country (2016-2032)
- Figure 145: Middle East & Africa Photovoltaic Market Share Comparison by Product Type (2016-2032)
- Figure 146: Middle East & Africa Photovoltaic Market Share Comparison by Component (2016-2032)
- Figure 147: Middle East & Africa Photovoltaic Market Share Comparison by Application (2016-2032)
- List of Tables
- Table 1: Global Photovoltaic Market Comparison by Product Type (2016-2032)
- Table 2: Global Photovoltaic Market Comparison by Component (2016-2032)
- Table 3: Global Photovoltaic Market Comparison by Application (2016-2032)
- Table 4: Global Photovoltaic Market Revenue (US$ Mn) Comparison by Region (2016-2032)
- Table 5: Global Photovoltaic Market Revenue (US$ Mn) (2016-2032)
- Table 6: Global Photovoltaic Market Revenue (US$ Mn) Comparison by Region (2016-2032)
- Table 7: Global Photovoltaic Market Revenue (US$ Mn) Comparison by Product Type (2016-2032)
- Table 8: Global Photovoltaic Market Revenue (US$ Mn) Comparison by Component (2016-2032)
- Table 9: Global Photovoltaic Market Revenue (US$ Mn) Comparison by Application (2016-2032)
- Table 10: Global Photovoltaic Market Y-o-Y Growth Rate Comparison by Region (2016-2032)
- Table 11: Global Photovoltaic Market Y-o-Y Growth Rate Comparison by Product Type (2016-2032)
- Table 12: Global Photovoltaic Market Y-o-Y Growth Rate Comparison by Component (2016-2032)
- Table 13: Global Photovoltaic Market Y-o-Y Growth Rate Comparison by Application (2016-2032)
- Table 14: Global Photovoltaic Market Share Comparison by Region (2016-2032)
- Table 15: Global Photovoltaic Market Share Comparison by Product Type (2016-2032)
- Table 16: Global Photovoltaic Market Share Comparison by Component (2016-2032)
- Table 17: Global Photovoltaic Market Share Comparison by Application (2016-2032)
- Table 18: North America Photovoltaic Market Comparison by Component (2016-2032)
- Table 19: North America Photovoltaic Market Comparison by Application (2016-2032)
- Table 20: North America Photovoltaic Market Revenue (US$ Mn) Comparison by Country (2016-2032)
- Table 21: North America Photovoltaic Market Revenue (US$ Mn) (2016-2032)
- Table 22: North America Photovoltaic Market Revenue (US$ Mn) Comparison by Country (2016-2032)
- Table 23: North America Photovoltaic Market Revenue (US$ Mn) Comparison by Product Type (2016-2032)
- Table 24: North America Photovoltaic Market Revenue (US$ Mn) Comparison by Component (2016-2032)
- Table 25: North America Photovoltaic Market Revenue (US$ Mn) Comparison by Application (2016-2032)
- Table 26: North America Photovoltaic Market Y-o-Y Growth Rate Comparison by Country (2016-2032)
- Table 27: North America Photovoltaic Market Y-o-Y Growth Rate Comparison by Product Type (2016-2032)
- Table 28: North America Photovoltaic Market Y-o-Y Growth Rate Comparison by Component (2016-2032)
- Table 29: North America Photovoltaic Market Y-o-Y Growth Rate Comparison by Application (2016-2032)
- Table 30: North America Photovoltaic Market Share Comparison by Country (2016-2032)
- Table 31: North America Photovoltaic Market Share Comparison by Product Type (2016-2032)
- Table 32: North America Photovoltaic Market Share Comparison by Component (2016-2032)
- Table 33: North America Photovoltaic Market Share Comparison by Application (2016-2032)
- Table 34: Western Europe Photovoltaic Market Comparison by Product Type (2016-2032)
- Table 35: Western Europe Photovoltaic Market Comparison by Component (2016-2032)
- Table 36: Western Europe Photovoltaic Market Comparison by Application (2016-2032)
- Table 37: Western Europe Photovoltaic Market Revenue (US$ Mn) Comparison by Country (2016-2032)
- Table 38: Western Europe Photovoltaic Market Revenue (US$ Mn) (2016-2032)
- Table 39: Western Europe Photovoltaic Market Revenue (US$ Mn) Comparison by Country (2016-2032)
- Table 40: Western Europe Photovoltaic Market Revenue (US$ Mn) Comparison by Product Type (2016-2032)
- Table 41: Western Europe Photovoltaic Market Revenue (US$ Mn) Comparison by Component (2016-2032)
- Table 42: Western Europe Photovoltaic Market Revenue (US$ Mn) Comparison by Application (2016-2032)
- Table 43: Western Europe Photovoltaic Market Y-o-Y Growth Rate Comparison by Country (2016-2032)
- Table 44: Western Europe Photovoltaic Market Y-o-Y Growth Rate Comparison by Product Type (2016-2032)
- Table 45: Western Europe Photovoltaic Market Y-o-Y Growth Rate Comparison by Component (2016-2032)
- Table 46: Western Europe Photovoltaic Market Y-o-Y Growth Rate Comparison by Application (2016-2032)
- Table 47: Western Europe Photovoltaic Market Share Comparison by Country (2016-2032)
- Table 48: Western Europe Photovoltaic Market Share Comparison by Product Type (2016-2032)
- Table 49: Western Europe Photovoltaic Market Share Comparison by Component (2016-2032)
- Table 50: Western Europe Photovoltaic Market Share Comparison by Application (2016-2032)
- Table 51: Eastern Europe Photovoltaic Market Comparison by Product Type (2016-2032)
- Table 52: Eastern Europe Photovoltaic Market Comparison by Component (2016-2032)
- Table 53: Eastern Europe Photovoltaic Market Comparison by Application (2016-2032)
- Table 54: Eastern Europe Photovoltaic Market Revenue (US$ Mn) Comparison by Country (2016-2032)
- Table 55: Eastern Europe Photovoltaic Market Revenue (US$ Mn) (2016-2032)
- Table 56: Eastern Europe Photovoltaic Market Revenue (US$ Mn) Comparison by Country (2016-2032)
- Table 57: Eastern Europe Photovoltaic Market Revenue (US$ Mn) Comparison by Product Type (2016-2032)
- Table 58: Eastern Europe Photovoltaic Market Revenue (US$ Mn) Comparison by Component (2016-2032)
- Table 59: Eastern Europe Photovoltaic Market Revenue (US$ Mn) Comparison by Application (2016-2032)
- Table 60: Eastern Europe Photovoltaic Market Y-o-Y Growth Rate Comparison by Country (2016-2032)
- Table 61: Eastern Europe Photovoltaic Market Y-o-Y Growth Rate Comparison by Product Type (2016-2032)
- Table 62: Eastern Europe Photovoltaic Market Y-o-Y Growth Rate Comparison by Component (2016-2032)
- Table 63: Eastern Europe Photovoltaic Market Y-o-Y Growth Rate Comparison by Application (2016-2032)
- Table 64: Eastern Europe Photovoltaic Market Share Comparison by Country (2016-2032)
- Table 65: Eastern Europe Photovoltaic Market Share Comparison by Product Type (2016-2032)
- Table 66: Eastern Europe Photovoltaic Market Share Comparison by Component (2016-2032)
- Table 67: Eastern Europe Photovoltaic Market Share Comparison by Application (2016-2032)
- Table 68: APAC Photovoltaic Market Comparison by Product Type (2016-2032)
- Table 69: APAC Photovoltaic Market Comparison by Component (2016-2032)
- Table 70: APAC Photovoltaic Market Comparison by Application (2016-2032)
- Table 71: APAC Photovoltaic Market Revenue (US$ Mn) Comparison by Country (2016-2032)
- Table 72: APAC Photovoltaic Market Revenue (US$ Mn) (2016-2032)
- Table 73: APAC Photovoltaic Market Revenue (US$ Mn) Comparison by Country (2016-2032)
- Table 74: APAC Photovoltaic Market Revenue (US$ Mn) Comparison by Product Type (2016-2032)
- Table 75: APAC Photovoltaic Market Revenue (US$ Mn) Comparison by Component (2016-2032)
- Table 76: APAC Photovoltaic Market Revenue (US$ Mn) Comparison by Application (2016-2032)
- Table 77: APAC Photovoltaic Market Y-o-Y Growth Rate Comparison by Country (2016-2032)
- Table 78: APAC Photovoltaic Market Y-o-Y Growth Rate Comparison by Product Type (2016-2032)
- Table 79: APAC Photovoltaic Market Y-o-Y Growth Rate Comparison by Component (2016-2032)
- Table 80: APAC Photovoltaic Market Y-o-Y Growth Rate Comparison by Application (2016-2032)
- Table 81: APAC Photovoltaic Market Share Comparison by Country (2016-2032)
- Table 82: APAC Photovoltaic Market Share Comparison by Product Type (2016-2032)
- Table 83: APAC Photovoltaic Market Share Comparison by Component (2016-2032)
- Table 84: APAC Photovoltaic Market Share Comparison by Application (2016-2032)
- Table 85: Latin America Photovoltaic Market Comparison by Product Type (2016-2032)
- Table 86: Latin America Photovoltaic Market Comparison by Component (2016-2032)
- Table 87: Latin America Photovoltaic Market Comparison by Application (2016-2032)
- Table 88: Latin America Photovoltaic Market Revenue (US$ Mn) Comparison by Country (2016-2032)
- Table 89: Latin America Photovoltaic Market Revenue (US$ Mn) (2016-2032)
- Table 90: Latin America Photovoltaic Market Revenue (US$ Mn) Comparison by Country (2016-2032)
- Table 91: Latin America Photovoltaic Market Revenue (US$ Mn) Comparison by Product Type (2016-2032)
- Table 92: Latin America Photovoltaic Market Revenue (US$ Mn) Comparison by Component (2016-2032)
- Table 93: Latin America Photovoltaic Market Revenue (US$ Mn) Comparison by Application (2016-2032)
- Table 94: Latin America Photovoltaic Market Y-o-Y Growth Rate Comparison by Country (2016-2032)
- Table 95: Latin America Photovoltaic Market Y-o-Y Growth Rate Comparison by Product Type (2016-2032)
- Table 96: Latin America Photovoltaic Market Y-o-Y Growth Rate Comparison by Component (2016-2032)
- Table 97: Latin America Photovoltaic Market Y-o-Y Growth Rate Comparison by Application (2016-2032)
- Table 98: Latin America Photovoltaic Market Share Comparison by Country (2016-2032)
- Table 99: Latin America Photovoltaic Market Share Comparison by Product Type (2016-2032)
- Table 100: Latin America Photovoltaic Market Share Comparison by Component (2016-2032)
- Table 101: Latin America Photovoltaic Market Share Comparison by Application (2016-2032)
- Table 102: Middle East & Africa Photovoltaic Market Comparison by Product Type (2016-2032)
- Table 103: Middle East & Africa Photovoltaic Market Comparison by Component (2016-2032)
- Table 104: Middle East & Africa Photovoltaic Market Comparison by Application (2016-2032)
- Table 105: Middle East & Africa Photovoltaic Market Revenue (US$ Mn) Comparison by Country (2016-2032)
- Table 106: Middle East & Africa Photovoltaic Market Revenue (US$ Mn) (2016-2032)
- Table 107: Middle East & Africa Photovoltaic Market Revenue (US$ Mn) Comparison by Country (2016-2032)
- Table 108: Middle East & Africa Photovoltaic Market Revenue (US$ Mn) Comparison by Product Type (2016-2032)
- Table 109: Middle East & Africa Photovoltaic Market Revenue (US$ Mn) Comparison by Component (2016-2032)
- Table 110: Middle East & Africa Photovoltaic Market Revenue (US$ Mn) Comparison by Application (2016-2032)
- Table 111: Middle East & Africa Photovoltaic Market Y-o-Y Growth Rate Comparison by Country (2016-2032)
- Table 112: Middle East & Africa Photovoltaic Market Y-o-Y Growth Rate Comparison by Product Type (2016-2032)
- Table 113: Middle East & Africa Photovoltaic Market Y-o-Y Growth Rate Comparison by Component (2016-2032)
- Table 114: Middle East & Africa Photovoltaic Market Y-o-Y Growth Rate Comparison by Application (2016-2032)
- Table 115: Middle East & Africa Photovoltaic Market Share Comparison by Country (2016-2032)
- Table 116: Middle East & Africa Photovoltaic Market Share Comparison by Product Type (2016-2032)
- Table 117: Middle East & Africa Photovoltaic Market Share Comparison by Component (2016-2032)
- Table 118: Middle East & Africa Photovoltaic Market Share Comparison by Application (2016-2032)
- 1. Executive Summary
-
- Risen Energy Co. Ltd
- Shunfeng International Clean Energy Limited
- Mitsubishi Electric Corporation
- GCL System Integration
- JA Solar Holdings
- Kaneka Corporation
- Sharp Corporation
- Suntech Power Co.
- Trina Solar Limited
- Canadian Solar Inc.
- Jinko Solar Holding Co., Ltd
Our Clients


View Our Licence Options
