
Global Personalized Cancer Treatment Market Size, Share, Growth, and Industry Analysis By Cancer Type (Breast Cancer, Lung Cancer, Others), Treatment Type (Targeted Therapy, Immunotherapy, Others), Diagnostic Techniques (Genomic Sequencing, Liquid Biopsy, Others), and By Region Forecast - 2023-2032
-
41178
-
Sep 2023
-
180
-


-
This report was compiled by Correspondence Linkedin | Detailed Market research Methodology Our methodology involves a mix of primary research, including interviews with leading mental health experts, and secondary research from reputable medical journals and databases. View Detailed Methodology Page
-
Quick Navigation
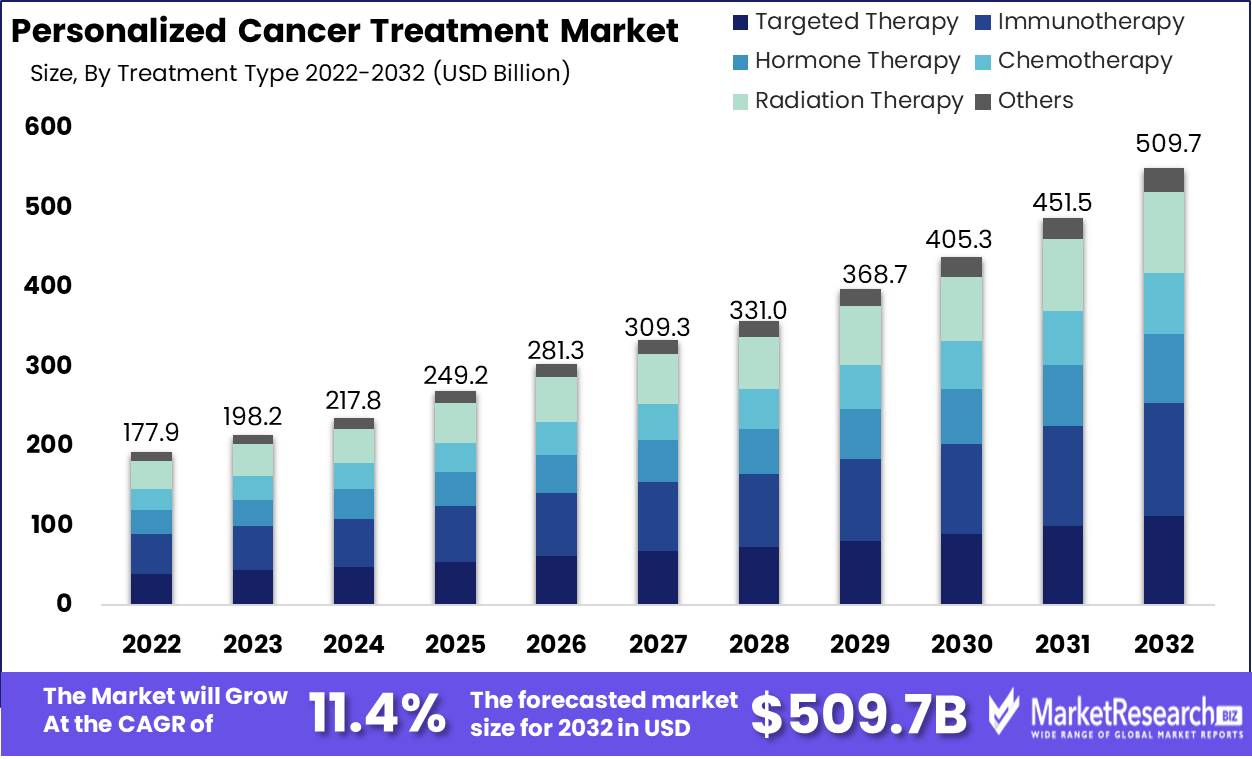
Global Personalized Cancer Treatment Market size is expected to be worth around USD 509.7 Bn by 2032 from USD 177.9 Bn in 2022, growing at a CAGR of 11.4% during the forecast period from 2023 to 2032.
Key Takeaways
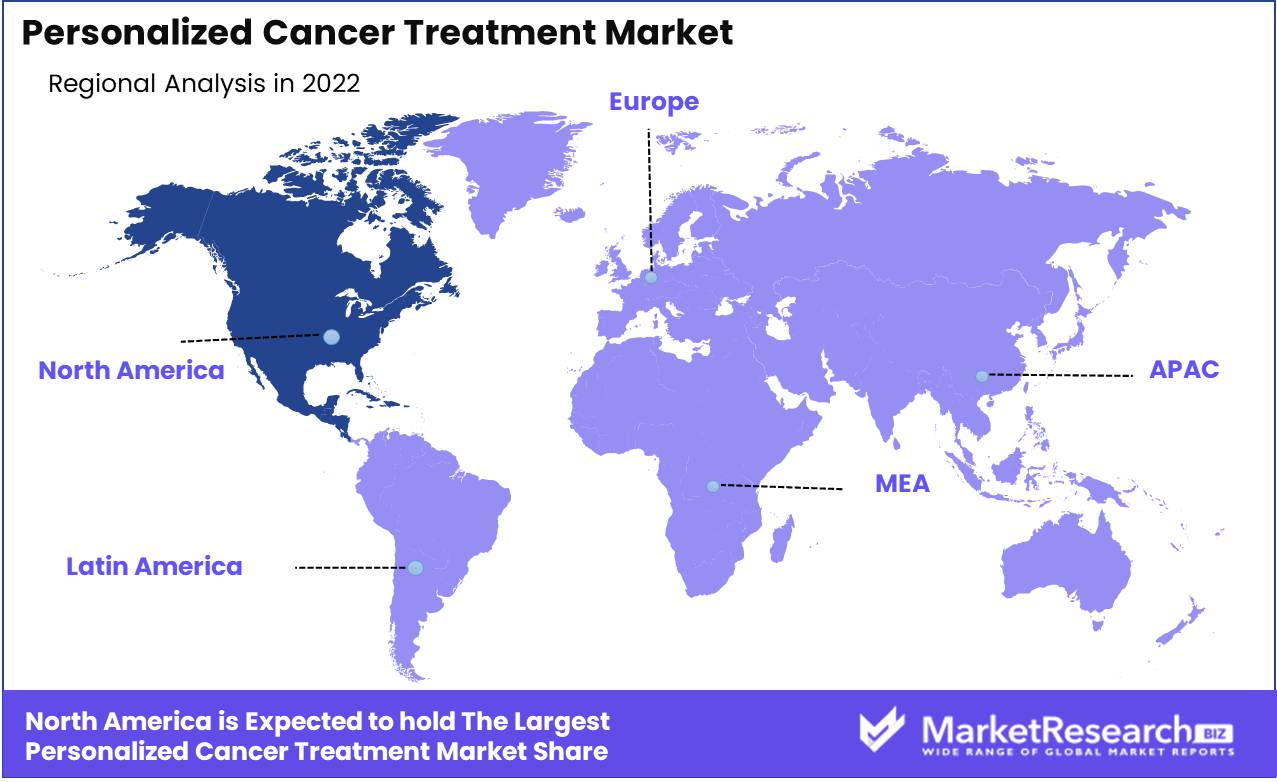
- North America accounted for 49.1% of the overall global personalized cancer treatment market revenue in 2022 and is expected to reach approximately USD 249.22 billion in 2032
- Asia-Pacific currently is expected to continue to register fastest revenue CAGR of 11.1% compared to other regional markets in the global personalized cancer market over the forecast period
- The immunotherapy segment accounted for a significantly larger revenue share of USD XX.X in 2022 and is expected to maintain its dominance among the other treatment-type segments over the forecast period.
- According to Cancer Research UK, there were 18.1 million new cases of cancer worldwide in 2020, with the four most common cancers occurring worldwide being female breast, lung, bowel and prostate cancers.
- Female breast, lung, bowel and prostate cancers account for over four in 10 cancers diagnosed worldwide.
- Worldwide there will be 28 million new cases of cancer each year by 2040 and preference for novel and personalized cancer treatment and medicine is expected to increase substantially as compared to that for other treatment options.
Market Overview
Personalized cancer treatment, which is a cornerstone of modern oncology, comprises tailored therapies to an individual's unique genetic and molecular profile, thereby offering more precise and effective treatment options. Key technologies include genomic profiling to identify genetic mutations, liquid biopsies for non-invasive monitoring, and Artificial Intelligence (AI) for data analysis. Targeted therapies, immunotherapies, and hormone therapies are widely employed, often in combination, to attack cancer at source. Companion diagnostics help determine treatment suitability. Equipment such as sequencing machines and diagnostic devices are integral. Services encompass genetic counseling, clinical trials, and data interpretation. This approach revolutionizes cancer care, and serves to optimize outcomes while minimizing side effects.
The global personalized cancer treatment market registered substantial revenue growth in 2022, driven by factors such as increasing cancer prevalence and advancements in genomics driving steady adoption of personalized treatment among an expanding patient pool globally. Also, rising awareness regarding the benefits and advantages of personalized cancer treatment, coupled with favorable government initiatives and investments, continue to drive revenue growth of the market.
The adoption of personalized cancer treatment ensures patients benefit from reduced side effects and improved outcomes due to tailored therapies, such as targeted drugs and immunotherapy. Liquid biopsies and AI-driven data analysis further enhance treatment precision. Genetic counseling services also play a vital role in outcomes. In addition, continuous research and innovative companion diagnostics are revolutionizing cancer care worldwide and enabling the offering of tailored, effective, and less toxic treatments. Antibody-drug conjugates (ADCs) show promise in revolutionizing personalized cancer treatment by precisely delivering drugs to tumor cells.
Driving Factors
Advancements in Genomic Sequencing
Next-generation sequencing technologies have become more affordable and accessible in recent times, thus allowing for comprehensive genomic profiling. This not only enables oncologists to identify precise genetic mutations driving cancer but also facilitates targeted therapy selection. Increasing awareness regarding the advantages and benefits of this technology is driving revenue growth.Immunotherapy Expansion
Immunotherapies, like immune checkpoint inhibitors and CAR-T cell therapies, have gained robust prominence across the healthcare sector. These innovative treatments boost the body's immune system to fight cancer, and increasing preference is creating new revenue streams in the personalized cancer treatment market.Liquid Biopsies
Non-invasive liquid biopsies continue to transform cancer diagnostics owing to advantages such as real-time monitoring of tumor dynamics and enabling oncologists to adjust treatments as required. Liquid biopsies or CellSearch Circulating Tumor Cell (CTC) test, are used to analyze blood samples for the presence of circulating tumor cells. Monitoring using this technique can help doctors evaluate how a certain treatment is working and aid in determining what follow-up tests could be required. The increasing prevalence of cancer and patients opting for more cutting-edge treatments are expected to continue to drive revenue growth of the personalized cancer treatment market over the forecast period.AI-Driven Analytics
Artificial Intelligence (AI) and Machine Learning (ML) are enhancing data analysis, thereby enabling more accurate patient profiling and treatment predictions. AI-driven tools are steadily becoming indispensable in optimizing treatment plans, and increasing dependence is contributing significantly to revenue growth of the market.Companion Diagnostics
The development of companion diagnostics that identify biomarkers for specific therapies has become a lucrative segment. These diagnostics are multi-purpose, as the test not only gives insight into patients most likely to benefit from treatment with the corresponding drug but can also be used to determine whether the medicine will actually work during the course of treatment. This doubly ensures that patients receive the most suitable treatments, thereby increasing treatment efficacy. An increasing number of individuals and patients opting for more novel and efficient treatment options such as companion diagnostics is expected to continue to support an incline in market revenue.Restraining Factors
High Treatment Costs
The cost of personalized cancer treatment can be significantly higher than conventional therapies, which can be a restraint for patients and healthcare systems, especially in a number of developing economies.Limited Access to Advanced Healthcare
Disparities in healthcare access, particularly in lower-income regions or countries with underdeveloped healthcare infrastructure, can restrain adoption of personalized cancer treatment.Regulatory Challenges
Stringent regulatory requirements and lengthy approval processes for personalized treatments can dampen market growth, as delays in securing regulatory approval can limit the availability of new therapies, and this has an impact on revenue potential.No Payer Inclusion
Genetic testing can be expensive and is omitted by in number of insurance provider plans. In addition, the tests conducted take time to produce results and this results in a longer period to contemplate whether personalized treatment is an option that a patient can wait for, or opt for something more timely, considering what stage of the disease one has progressed to.Undesired Outcomes and Treatment Resistance
Despite the promise of personalized treatments, some patients may still develop resistance to therapies over time. This can lead to suboptimal outcomes and dissatisfaction, potentially affecting the credibility of personalized cancer treatments.Genetic Privacy Concerns
Collection and storage of sensitive genetic data raises concerns about patient privacy and data security. Breaches or misuse of this information can erode patient trust, result in hesitation to opt for such treatment options, and restrain potential market growth.Health Disparities
If personalized cancer treatments become primarily accessible to affluent populations or those in well-developed healthcare systems, it could exacerbate healthcare disparities and limit the global reach of these innovative therapies. This is another factor that can restrain revenue growth to some extent.Opportunities
Diagnostics-Centric Focus
Companies can capitalize on the rising demand for companion diagnostics, which are essential for identifying suitable patients for specific personalized cancer treatments. Developing accurate and efficient diagnostic tests that match patients with the most appropriate therapies presents a significant revenue opportunity.Data Analytics and AI Solutions
Businesses specializing in data analytics and AI can arm healthcare providers with advanced tools for analyzing patient data and optimizing treatment plans. Developing AI-driven platforms that offer insights into treatment effectiveness and personalized care pathways can generate revenue through licensing and subscription models.Clinical Trial Services
Continuous development of personalized cancer treatments is driving need for clinical trials to test safety and efficacy of these therapies. Companies that offer services related to patient recruitment, trial management, and data analysis can secure revenue streams by supporting pharmaceutical and biotech firms in their research efforts.Segment Analysis
By Treatment Type
Among the treatment types segments in the global personalized cancer treatment market report, the immunotherapy segment accounted for a significantly larger revenue share in 2022. Immunotherapy has gained prominence due to its effectiveness in enhancing patient's immune system to fight cancer cells and is highly preferred in personalized cancer treatment currently. Robust revenue growth can also be attributed to ongoing R&D efforts leading to the introduction of new immunotherapeutic agents and combination therapies. These innovations expand the range of cancers that can be treated with immunotherapy, thus attracting a larger patient pool.
Also, increasing understanding of the tumor microenvironment and biomarkers has allowed for better patient selection. Oncologists can provide more personalized treatment plans by identifying patients who are more likely to respond to immunotherapy. This enhances treatment efficacy and patient outcomes, and growing patient awareness of these aspects is contributing significantly to the revenue growth of the immunotherapy segment.
By Diagnostic Techniques
The genomic sequencing segment among the other diagnostic techniques segments accounted for the largest revenue share in 2022. Genomic sequencing is a crucial diagnostic technique and involves analyzing the genetic makeup of a patient's tumor to identify specific genetic mutations driving cancer growth. Key factors such as technological advancements and increasing adoption of the technique in personalized cancer treatment, and advances in high-throughput sequencing technologies that have made genomic profiling faster and more cost-effective, thereby widening its accessibility are driving revenue growth of this segment.
In addition, healthcare providers and patients are increasingly recognizing the benefits of tailoring cancer treatment based on genetic information, and this is driving the adoption of genomic sequencing. In addition, growing demand for accurate genetic profiling to guide treatment decisions is a key factor driving revenue growth of the genomic sequencing segment.
By End-User
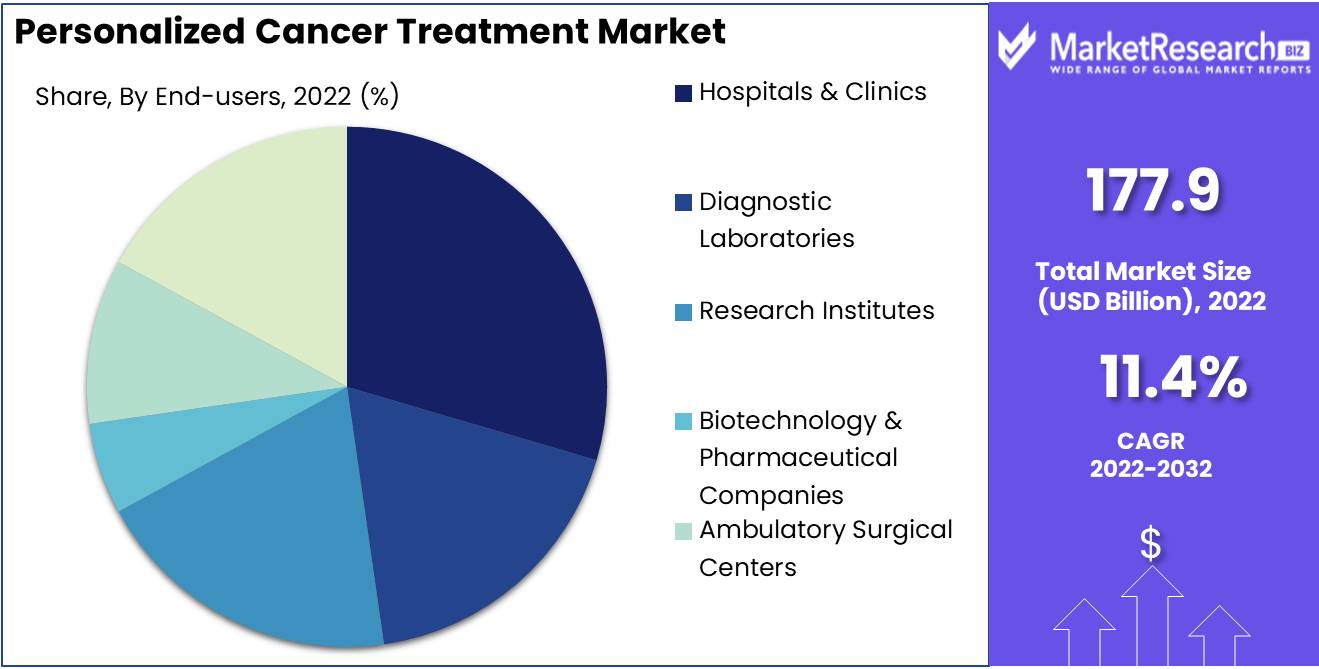
Hospitals & Clinics segment among the end-user segments accounted for a significantly larger revenue share in the global personalized cancer treatment market in 2022. These healthcare facilities serve as the primary points of care for cancer patients, where diagnosis, treatment planning, and administration are conducted.
Increasing prevalence of cancer, steady adoption of personalized treatment approaches, rising global cancer burden resulting in a higher number of patients seeking treatment in hospitals and clinics, and shift towards personalized cancer treatment, including targeted therapies and immunotherapies, necessitates the involvement of specialized healthcare institutions equipped to deliver these advanced treatments. As personalized cancer treatments become more widespread and integral to cancer care, footfalls and patient consulting at hospitals and clinics is expected to increase substantially over the forecast period. This is also expected to drive revenue share incline of the hospitals and clinics segment to a major extent.
Market Segmentation
By Cancer Type
- Breast Cancer
- Lung Cancer
- Colorectal Cancer
- Prostate Cancer
- Melanoma
- Others
Treatment Type
- Targeted Therapy
- Immunotherapy
- Hormone Therapy
- Chemotherapy
- Radiation Therapy
- Others
Diagnostic Techniques
- Genomic Sequencing
- Liquid Biopsy
- Immunohistochemistry
- In Situ Hybridization
- Biomarker Testing
- Others
End-users
- Hospitals & Clinics
- Diagnostic Laboratories
- Research Institutes
- Biotechnology & Pharmaceutical Companies
- Ambulatory Surgical Centers
- Others
Regional Analysis
North America
North America dominates other regional markets in terms of revenue share contribution to the global personalized cancer treatment market, owing to its well-established healthcare infrastructure, significant investments in research and development, and a high prevalence of cancer in countries in the region. The United States, in particular, accounts for a substantially large market share.
Market growth is also supported by initiatives such as the Cancer Moonshot program, which encourage innovation, thereby leading to technological advancements in the field. In addition, companies in the region are investing significantly in companion diagnostics, AI-driven analytics, and immunotherapy. Moreover, the availability of advanced genomics facilities and clinical trial services further supports advancements in personalized cancer treatment. These factors, among others, are expected to continue to enable North America to maintain its dominance over other regional markets over the forecast period.
Europe
Europe personalized cancer treatment market growth is driven by factors such as increasing awareness about personalized cancer treatment and government initiatives to promote precision medicine. For instance, the European Union's Horizon 2020 program has funded several cancer research projects, and encouraged and supported technological advancements, and this coupled with a robust pharmaceutical and biotechnology sector in the region are contributing significantly to further advancements in companion diagnostics and targeted therapies. Also, countries such as Germany, France, and the United Kingdom are key players in the market in Europe in terms of market share. Advancements in genomics and immunotherapy in these countries are creating more avenues for adoption of personalized cancer treatment and this is expected to present lucrative opportunities for companies operating in the region.
Asia-Pacific
Asia-Pacific presents substantial growth opportunities for players in the personalized cancer treatment market in the region. The large population and rising prevalence of cancer in some countries in the region are key factors expected to drive demand for personalized cancer treatment over the forecast period. Initiatives such as China's Precision Medicine Initiative and Japan's Moonshot Program aim to accelerate the adoption of precision oncology, which is also expected to result in major technological advancements in the medical field.
In addition, increasing investments in genomics research, data analytics, and AI-driven solutions, as well as modernization of healthcare infrastructure and expanding access to advanced cancer treatments, including immunotherapy, are contributing significantly to the adoption of novel treatments and supporting revenue growth potential. Furthermore, major companies are actively targeting countries including China, Japan, and India to expand their geographical reach, thereby making Asia-Pacific a key region for future market expansion for other medical breakthroughs.
Segmentation By Region
North America
- United States
- Canada
Asia Pacific
- China
- India
- Japan
- Australia & New Zealand
- Association of Southeast Asian Nations (ASEAN)
- Rest of Asia Pacific
Europe
- Germany
- The U.K.
- France
- Spain
- Italy
- Russia
- Poland
- BENELUX (Belgium, the Netherlands, Luxembourg)
- NORDIC (Norway, Sweden, Finland, Denmark)
- Rest of Europe
Latin America
- Brazil
- Mexico
- Argentina
- Rest of Latin America
Middle East & Africa
- Saudi Arabia
- United Arab Emirates
- South Africa
- Egypt
- Israel
- Rest of MEA (Middle East & Africa)
Competitive Landscape Analysis
The global personalized cancer treatment market is highly competitive, with a significantly large number of pharmaceutical companies, biotechnology firms, diagnostic laboratories, and research institutions competing for market share. Leading players in these fields have adopted various strategies to maintain their robust positions and stay ahead in this rapidly evolving industry. Some trends and strategies observed in the market are presented below.
The majority of leading companies are allocating significant resources to R&D to discover and develop new targeted therapies and companion diagnostics. These companies are continuously exploring innovative ways to identify and target specific genetic mutations and biomarkers associated with different cancer types. These investments not only drive scientific advancements but also enhance the respective company’s competitive edge.
Strategic partnerships and collaborations are another major trend observed in the market. Collaboration is a common strategy among major players and partnerships with academic institutions, hospitals, and other industry leaders enable access to valuable patient data and research capabilities. Collaborations also facilitate the development and commercialization of new personalized cancer treatments and diagnostic tools. Portfolio expansion and pipeline development enable leading companies to maintain extensive portfolios of personalized cancer treatments and companion diagnostics. Companies actively seek to expand their product offerings by acquiring smaller biotech firms with promising pipelines or through in-house development as a robust pipeline ensures a continuous flow of innovative therapies to the market.
In addition, in order to maximize geographical reach, companies are focused on expanding their presence in emerging markets, where adoption of personalized cancer treatment is growing. These companies tailor their products and services to meet the specific needs and regulations prevalent in each region, thereby ensuring a competitive advantage in diverse markets. Marketing and patient education is another focus area for a number of companies operating in the market. Effective marketing and patient education campaigns are essential to create awareness about personalized cancer treatment options. Leading companies invest in patient support programs, genetic counseling services, and educational resources to empower patients and healthcare providers with knowledge about these advanced therapies.
Furthermore, market leaders harness the power of data analytics and Artificial Intelligence (AI) to enhance their diagnostic and treatment solutions. These technologies enable efficient and accurate analysis of vast datasets, predict treatment responses, and identify potential drug candidates more effectively, and this strategy creates a competitive edge in delivering precision medicine.
Regulatory compliance and quality assurance is another aspect that poses major challenges for companies in the market. Given the stringent regulatory environment in healthcare, leading companies prioritize compliance and quality assurance, as maintaining rigorous standards ensures the safety and efficacy of their personalized cancer treatments and diagnostics, as well as lends credibility and competitiveness.
Also, companies often take a leadership role in conducting clinical trials for their products. By designing and executing successful trials, companies generate valuable clinical data that can support regulatory approvals and further establish their position as key players in the personalized cancer treatment market.
Company List
- Roche Holding AG
- Novartis AG
- Bristol Myers Squibb
- Merck & Co., Inc.
- Pfizer Inc.
- AstraZeneca
- Eli Lilly and Company
- Amgen Inc.
- Illumina, Inc.
- Foundation Medicine, Inc. (a Roche company)
- Guardant Health, Inc.
- Exact Sciences Corporation
- Myriad Genetics, Inc.
- Thermo Fisher Scientific, Inc.
- Qiagen N.V.
- Agilent Technologies, Inc.
- Invitae Corporation
- Tempus Labs, Inc.
- Cancer Genetics, Inc.
- Takeda Pharmaceutical Company Limited
Recent Developments
- Biotech company Transgene, which designs and develops virus-based immunotherapies for cancer treatment, and NEC Corporation, which is a leader in IT, network and AI technologies, announced on 18 April 2023 at the American Association for Cancer Research (AACR) Annual Meeting in Orlando, Florida, that new data will be presented on TG4050. The TG4050 is based on Transgene’s myvac platform and powered by NEC’s cutting-edge AI capabilities. TG4050 has demonstrated the ability to induce strong immune responses against targeted antigens in patients, which are expected to result in extended remission periods.
- On 23 March 2022, the targeted radiodrug lutetium Lu 177 vipivotide tetraxetan (Pluvicto) was approved by the U.S. Food and Drug Administration (FDA) for patients with metastatic castration-resistant prostate cancer that is positive for a protein called Prostate-Specific Membrane Antigen (PSMA). The approval was the latest advance in the field of theranostics, which uses radioactive substances to visualize cancer cells and destroy them without harming normal cells.
- A new combination therapy has shown positive results in treating persons with metastatic bladder cancer. Results of a clinical trial that tested the effectiveness of the antibody-drug conjugate enfortumab vedotin (Padcev) combined with the checkpoint inhibitor pembrolizumab (Keytruda) were presented at the annual meeting of the European Society for Medical Oncology (ESMO) on September 12, 2022. The treatment shrank tumors in about 65% of patients.
Report Scope
Report Features Description Market Value (2022) USD 177.9 Bn Forecast Revenue (2032) USD 509.7 Bn CAGR (2023-2032) 11.4% Base Year for Estimation 2022 Historic Period 2016-2022 Forecast Period 2023-2032 Report Coverage Revenue Forecast, Market Dynamics, COVID-19 Impact, Competitive Landscape, Recent Developments Segments Covered By Cancer Type (Breast Cancer, Lung Cancer, Colorectal Cancer, Prostate Cancer, Melanoma, Others); Treatment Type (Targeted Therapy, Immunotherapy, Hormone Therapy, Chemotherapy, Radiation Therapy); Diagnostic Techniques (Genomic Sequencing, Liquid Biopsy, Immunohistochemistry, In Situ Hybridization, Biomarker Testing), End-users (Hospitals & Clinics, Diagnostic Laboratories, Research Institutes, Biotechnology & Pharmaceutical Companies, Ambulatory Surgical Centers) Regional Analysis North America – The US, Canada, & Mexico; Western Europe – Germany, France, The UK, Spain, Italy, Portugal, Ireland, Austria, Switzerland, Benelux, Nordic, & Rest of Western Europe; Eastern Europe – Russia, Poland, The Czech Republic, Greece, & Rest of Eastern Europe; APAC – China, Japan, South Korea, India, Australia & New Zealand, Indonesia, Malaysia, Philippines, Singapore, Thailand, Vietnam, & Rest of APAC; Latin America – Brazil, Colombia, Chile, Argentina, Costa Rica, & Rest of Latin America; Middle East & Africa – Algeria, Egypt, Israel, Kuwait, Nigeria, Saudi Arabia, South Africa, Turkey, United Arab Emirates, & Rest of MEA Competitive Landscape Roche Holding AG, Novartis AG, Bristol Myers Squibb, Merck & Co., Inc., Pfizer Inc., AstraZeneca, Eli Lilly and Company, Amgen Inc., Illumina, Inc., Foundation Medicine, Inc. (a Roche company), Guardant Health, Inc., Exact Sciences Corporation, Myriad Genetics, Inc., Thermo Fisher Scientific, Inc., Qiagen N.V., Agilent Technologies, Inc., Invitae Corporation, Tempus Labs, Inc., Cancer Genetics, Inc., Takeda Pharmaceutical Company Limited Customization Scope Customization for segments, region/country-level will be provided. Moreover, additional customization can be done based on the requirements. Purchase Options We have three licenses to opt for: Single User License, Multi-User License (Up to 5 Users), Corporate Use License (Unlimited User and Printable PDF) -
- 1. Executive Summary
- 1.1. Definition
- 1.2. Taxonomy
- 1.3. Research Scope
- 1.4. Key Analysis
- 1.5. Key Findings by Major Segments
- 1.6. Top strategies by Major Players
- 2. Global Personalized Cancer Treatment Market Overview
- 2.1. Personalized Cancer Treatment Market Dynamics
- 2.1.1. Drivers
- 2.1.2. Opportunities
- 2.1.3. Restraints
- 2.1.4. Challenges
- 2.2. Macro-economic Factors
- 2.3. Regulatory Framework
- 2.4. Market Investment Feasibility Index
- 2.5. PEST Analysis
- 2.6. PORTER’S Five Force Analysis
- 2.7. Drivers & Restraints Impact Analysis
- 2.8. Industry Chain Analysis
- 2.9. Cost Structure Analysis
- 2.10. Marketing Strategy
- 2.11. Russia-Ukraine War Impact Analysis
- 2.12. Opportunity Map Analysis
- 2.13. Market Competition Scenario Analysis
- 2.14. Product Life Cycle Analysis
- 2.15. Opportunity Orbits
- 2.16. Manufacturer Intensity Map
- 2.17. Major Companies sales by Value & Volume
- 2.1. Personalized Cancer Treatment Market Dynamics
- 3. Global Personalized Cancer Treatment Market Analysis, Opportunity and Forecast, 2016-2032
- 3.1. Global Personalized Cancer Treatment Market Analysis, 2016-2021
- 3.2. Global Personalized Cancer Treatment Market Opportunity and Forecast, 2023-2032
- 3.3. Global Personalized Cancer Treatment Market Analysis, Opportunity and Forecast, By By Cancer Type, 2016-2032
- 3.3.1. Global Personalized Cancer Treatment Market Analysis by By Cancer Type: Introduction
- 3.3.2. Market Size Absolute $ Opportunity Analysis and Forecast, By By Cancer Type, 2016-2032
- 3.3.3. Breast Cancer
- 3.3.4. Lung Cancer
- 3.3.5. Colorectal Cancer
- 3.3.6. Prostate Cancer
- 3.3.7. Melanoma
- 3.3.8. Others
- 3.4. Global Personalized Cancer Treatment Market Analysis, Opportunity and Forecast, By Treatment Type, 2016-2032
- 3.4.1. Global Personalized Cancer Treatment Market Analysis by Treatment Type: Introduction
- 3.4.2. Market Size Absolute $ Opportunity Analysis and Forecast, By Treatment Type, 2016-2032
- 3.4.3. Targeted Therapy
- 3.4.4. Immunotherapy
- 3.4.5. Hormone Therapy
- 3.4.6. Chemotherapy
- 3.4.7. Radiation Therapy
- 3.4.8. Others
- 3.5. Global Personalized Cancer Treatment Market Analysis, Opportunity and Forecast, By Diagnostic Techniques, 2016-2032
- 3.5.1. Global Personalized Cancer Treatment Market Analysis by Diagnostic Techniques: Introduction
- 3.5.2. Market Size Absolute $ Opportunity Analysis and Forecast, By Diagnostic Techniques, 2016-2032
- 3.5.3. Genomic Sequencing
- 3.5.4. Liquid Biopsy
- 3.5.5. Immunohistochemistry
- 3.5.6. In Situ Hybridization
- 3.5.7. Biomarker Testing
- 3.5.8. Others
- 3.6. Global Personalized Cancer Treatment Market Analysis, Opportunity and Forecast, By End-users, 2016-2032
- 3.6.1. Global Personalized Cancer Treatment Market Analysis by End-users: Introduction
- 3.6.2. Market Size Absolute $ Opportunity Analysis and Forecast, By End-users, 2016-2032
- 3.6.3. Hospitals & Clinics
- 3.6.4. Diagnostic Laboratories
- 3.6.5. Research Institutes
- 3.6.6. Biotechnology & Pharmaceutical Companies
- 3.6.7. Ambulatory Surgical Centers
- 3.6.8. Others
- 4. North America Personalized Cancer Treatment Market Analysis, Opportunity and Forecast, 2016-2032
- 4.1. North America Personalized Cancer Treatment Market Analysis, 2016-2021
- 4.2. North America Personalized Cancer Treatment Market Opportunity and Forecast, 2023-2032
- 4.3. North America Personalized Cancer Treatment Market Analysis, Opportunity and Forecast, By By Cancer Type, 2016-2032
- 4.3.1. North America Personalized Cancer Treatment Market Analysis by By Cancer Type: Introduction
- 4.3.2. Market Size Absolute $ Opportunity Analysis and Forecast, By By Cancer Type, 2016-2032
- 4.3.3. Breast Cancer
- 4.3.4. Lung Cancer
- 4.3.5. Colorectal Cancer
- 4.3.6. Prostate Cancer
- 4.3.7. Melanoma
- 4.3.8. Others
- 4.4. North America Personalized Cancer Treatment Market Analysis, Opportunity and Forecast, By Treatment Type, 2016-2032
- 4.4.1. North America Personalized Cancer Treatment Market Analysis by Treatment Type: Introduction
- 4.4.2. Market Size Absolute $ Opportunity Analysis and Forecast, By Treatment Type, 2016-2032
- 4.4.3. Targeted Therapy
- 4.4.4. Immunotherapy
- 4.4.5. Hormone Therapy
- 4.4.6. Chemotherapy
- 4.4.7. Radiation Therapy
- 4.4.8. Others
- 4.5. North America Personalized Cancer Treatment Market Analysis, Opportunity and Forecast, By Diagnostic Techniques, 2016-2032
- 4.5.1. North America Personalized Cancer Treatment Market Analysis by Diagnostic Techniques: Introduction
- 4.5.2. Market Size Absolute $ Opportunity Analysis and Forecast, By Diagnostic Techniques, 2016-2032
- 4.5.3. Genomic Sequencing
- 4.5.4. Liquid Biopsy
- 4.5.5. Immunohistochemistry
- 4.5.6. In Situ Hybridization
- 4.5.7. Biomarker Testing
- 4.5.8. Others
- 4.6. North America Personalized Cancer Treatment Market Analysis, Opportunity and Forecast, By End-users, 2016-2032
- 4.6.1. North America Personalized Cancer Treatment Market Analysis by End-users: Introduction
- 4.6.2. Market Size Absolute $ Opportunity Analysis and Forecast, By End-users, 2016-2032
- 4.6.3. Hospitals & Clinics
- 4.6.4. Diagnostic Laboratories
- 4.6.5. Research Institutes
- 4.6.6. Biotechnology & Pharmaceutical Companies
- 4.6.7. Ambulatory Surgical Centers
- 4.6.8. Others
- 4.7. North America Personalized Cancer Treatment Market Analysis, Opportunity and Forecast, By Country , 2016-2032
- 4.7.1. North America Personalized Cancer Treatment Market Analysis by Country : Introduction
- 4.7.2. Market Size Absolute $ Opportunity Analysis and Forecast, Country , 2016-2032
- 4.7.2.1. The US
- 4.7.2.2. Canada
- 4.7.2.3. Mexico
- 5. Western Europe Personalized Cancer Treatment Market Analysis, Opportunity and Forecast, 2016-2032
- 5.1. Western Europe Personalized Cancer Treatment Market Analysis, 2016-2021
- 5.2. Western Europe Personalized Cancer Treatment Market Opportunity and Forecast, 2023-2032
- 5.3. Western Europe Personalized Cancer Treatment Market Analysis, Opportunity and Forecast, By By Cancer Type, 2016-2032
- 5.3.1. Western Europe Personalized Cancer Treatment Market Analysis by By Cancer Type: Introduction
- 5.3.2. Market Size Absolute $ Opportunity Analysis and Forecast, By By Cancer Type, 2016-2032
- 5.3.3. Breast Cancer
- 5.3.4. Lung Cancer
- 5.3.5. Colorectal Cancer
- 5.3.6. Prostate Cancer
- 5.3.7. Melanoma
- 5.3.8. Others
- 5.4. Western Europe Personalized Cancer Treatment Market Analysis, Opportunity and Forecast, By Treatment Type, 2016-2032
- 5.4.1. Western Europe Personalized Cancer Treatment Market Analysis by Treatment Type: Introduction
- 5.4.2. Market Size Absolute $ Opportunity Analysis and Forecast, By Treatment Type, 2016-2032
- 5.4.3. Targeted Therapy
- 5.4.4. Immunotherapy
- 5.4.5. Hormone Therapy
- 5.4.6. Chemotherapy
- 5.4.7. Radiation Therapy
- 5.4.8. Others
- 5.5. Western Europe Personalized Cancer Treatment Market Analysis, Opportunity and Forecast, By Diagnostic Techniques, 2016-2032
- 5.5.1. Western Europe Personalized Cancer Treatment Market Analysis by Diagnostic Techniques: Introduction
- 5.5.2. Market Size Absolute $ Opportunity Analysis and Forecast, By Diagnostic Techniques, 2016-2032
- 5.5.3. Genomic Sequencing
- 5.5.4. Liquid Biopsy
- 5.5.5. Immunohistochemistry
- 5.5.6. In Situ Hybridization
- 5.5.7. Biomarker Testing
- 5.5.8. Others
- 5.6. Western Europe Personalized Cancer Treatment Market Analysis, Opportunity and Forecast, By End-users, 2016-2032
- 5.6.1. Western Europe Personalized Cancer Treatment Market Analysis by End-users: Introduction
- 5.6.2. Market Size Absolute $ Opportunity Analysis and Forecast, By End-users, 2016-2032
- 5.6.3. Hospitals & Clinics
- 5.6.4. Diagnostic Laboratories
- 5.6.5. Research Institutes
- 5.6.6. Biotechnology & Pharmaceutical Companies
- 5.6.7. Ambulatory Surgical Centers
- 5.6.8. Others
- 5.7. Western Europe Personalized Cancer Treatment Market Analysis, Opportunity and Forecast, By Country , 2016-2032
- 5.7.1. Western Europe Personalized Cancer Treatment Market Analysis by Country : Introduction
- 5.7.2. Market Size Absolute $ Opportunity Analysis and Forecast, Country , 2016-2032
- 5.7.2.1. Germany
- 5.7.2.2. France
- 5.7.2.3. The UK
- 5.7.2.4. Spain
- 5.7.2.5. Italy
- 5.7.2.6. Portugal
- 5.7.2.7. Ireland
- 5.7.2.8. Austria
- 5.7.2.9. Switzerland
- 5.7.2.10. Benelux
- 5.7.2.11. Nordic
- 5.7.2.12. Rest of Western Europe
- 6. Eastern Europe Personalized Cancer Treatment Market Analysis, Opportunity and Forecast, 2016-2032
- 6.1. Eastern Europe Personalized Cancer Treatment Market Analysis, 2016-2021
- 6.2. Eastern Europe Personalized Cancer Treatment Market Opportunity and Forecast, 2023-2032
- 6.3. Eastern Europe Personalized Cancer Treatment Market Analysis, Opportunity and Forecast, By By Cancer Type, 2016-2032
- 6.3.1. Eastern Europe Personalized Cancer Treatment Market Analysis by By Cancer Type: Introduction
- 6.3.2. Market Size Absolute $ Opportunity Analysis and Forecast, By By Cancer Type, 2016-2032
- 6.3.3. Breast Cancer
- 6.3.4. Lung Cancer
- 6.3.5. Colorectal Cancer
- 6.3.6. Prostate Cancer
- 6.3.7. Melanoma
- 6.3.8. Others
- 6.4. Eastern Europe Personalized Cancer Treatment Market Analysis, Opportunity and Forecast, By Treatment Type, 2016-2032
- 6.4.1. Eastern Europe Personalized Cancer Treatment Market Analysis by Treatment Type: Introduction
- 6.4.2. Market Size Absolute $ Opportunity Analysis and Forecast, By Treatment Type, 2016-2032
- 6.4.3. Targeted Therapy
- 6.4.4. Immunotherapy
- 6.4.5. Hormone Therapy
- 6.4.6. Chemotherapy
- 6.4.7. Radiation Therapy
- 6.4.8. Others
- 6.5. Eastern Europe Personalized Cancer Treatment Market Analysis, Opportunity and Forecast, By Diagnostic Techniques, 2016-2032
- 6.5.1. Eastern Europe Personalized Cancer Treatment Market Analysis by Diagnostic Techniques: Introduction
- 6.5.2. Market Size Absolute $ Opportunity Analysis and Forecast, By Diagnostic Techniques, 2016-2032
- 6.5.3. Genomic Sequencing
- 6.5.4. Liquid Biopsy
- 6.5.5. Immunohistochemistry
- 6.5.6. In Situ Hybridization
- 6.5.7. Biomarker Testing
- 6.5.8. Others
- 6.6. Eastern Europe Personalized Cancer Treatment Market Analysis, Opportunity and Forecast, By End-users, 2016-2032
- 6.6.1. Eastern Europe Personalized Cancer Treatment Market Analysis by End-users: Introduction
- 6.6.2. Market Size Absolute $ Opportunity Analysis and Forecast, By End-users, 2016-2032
- 6.6.3. Hospitals & Clinics
- 6.6.4. Diagnostic Laboratories
- 6.6.5. Research Institutes
- 6.6.6. Biotechnology & Pharmaceutical Companies
- 6.6.7. Ambulatory Surgical Centers
- 6.6.8. Others
- 6.7. Eastern Europe Personalized Cancer Treatment Market Analysis, Opportunity and Forecast, By Country , 2016-2032
- 6.7.1. Eastern Europe Personalized Cancer Treatment Market Analysis by Country : Introduction
- 6.7.2. Market Size Absolute $ Opportunity Analysis and Forecast, Country , 2016-2032
- 6.7.2.1. Russia
- 6.7.2.2. Poland
- 6.7.2.3. The Czech Republic
- 6.7.2.4. Greece
- 6.7.2.5. Rest of Eastern Europe
- 7. APAC Personalized Cancer Treatment Market Analysis, Opportunity and Forecast, 2016-2032
- 7.1. APAC Personalized Cancer Treatment Market Analysis, 2016-2021
- 7.2. APAC Personalized Cancer Treatment Market Opportunity and Forecast, 2023-2032
- 7.3. APAC Personalized Cancer Treatment Market Analysis, Opportunity and Forecast, By By Cancer Type, 2016-2032
- 7.3.1. APAC Personalized Cancer Treatment Market Analysis by By Cancer Type: Introduction
- 7.3.2. Market Size Absolute $ Opportunity Analysis and Forecast, By By Cancer Type, 2016-2032
- 7.3.3. Breast Cancer
- 7.3.4. Lung Cancer
- 7.3.5. Colorectal Cancer
- 7.3.6. Prostate Cancer
- 7.3.7. Melanoma
- 7.3.8. Others
- 7.4. APAC Personalized Cancer Treatment Market Analysis, Opportunity and Forecast, By Treatment Type, 2016-2032
- 7.4.1. APAC Personalized Cancer Treatment Market Analysis by Treatment Type: Introduction
- 7.4.2. Market Size Absolute $ Opportunity Analysis and Forecast, By Treatment Type, 2016-2032
- 7.4.3. Targeted Therapy
- 7.4.4. Immunotherapy
- 7.4.5. Hormone Therapy
- 7.4.6. Chemotherapy
- 7.4.7. Radiation Therapy
- 7.4.8. Others
- 7.5. APAC Personalized Cancer Treatment Market Analysis, Opportunity and Forecast, By Diagnostic Techniques, 2016-2032
- 7.5.1. APAC Personalized Cancer Treatment Market Analysis by Diagnostic Techniques: Introduction
- 7.5.2. Market Size Absolute $ Opportunity Analysis and Forecast, By Diagnostic Techniques, 2016-2032
- 7.5.3. Genomic Sequencing
- 7.5.4. Liquid Biopsy
- 7.5.5. Immunohistochemistry
- 7.5.6. In Situ Hybridization
- 7.5.7. Biomarker Testing
- 7.5.8. Others
- 7.6. APAC Personalized Cancer Treatment Market Analysis, Opportunity and Forecast, By End-users, 2016-2032
- 7.6.1. APAC Personalized Cancer Treatment Market Analysis by End-users: Introduction
- 7.6.2. Market Size Absolute $ Opportunity Analysis and Forecast, By End-users, 2016-2032
- 7.6.3. Hospitals & Clinics
- 7.6.4. Diagnostic Laboratories
- 7.6.5. Research Institutes
- 7.6.6. Biotechnology & Pharmaceutical Companies
- 7.6.7. Ambulatory Surgical Centers
- 7.6.8. Others
- 7.7. APAC Personalized Cancer Treatment Market Analysis, Opportunity and Forecast, By Country , 2016-2032
- 7.7.1. APAC Personalized Cancer Treatment Market Analysis by Country : Introduction
- 7.7.2. Market Size Absolute $ Opportunity Analysis and Forecast, Country , 2016-2032
- 7.7.2.1. China
- 7.7.2.2. Japan
- 7.7.2.3. South Korea
- 7.7.2.4. India
- 7.7.2.5. Australia & New Zeland
- 7.7.2.6. Indonesia
- 7.7.2.7. Malaysia
- 7.7.2.8. Philippines
- 7.7.2.9. Singapore
- 7.7.2.10. Thailand
- 7.7.2.11. Vietnam
- 7.7.2.12. Rest of APAC
- 8. Latin America Personalized Cancer Treatment Market Analysis, Opportunity and Forecast, 2016-2032
- 8.1. Latin America Personalized Cancer Treatment Market Analysis, 2016-2021
- 8.2. Latin America Personalized Cancer Treatment Market Opportunity and Forecast, 2023-2032
- 8.3. Latin America Personalized Cancer Treatment Market Analysis, Opportunity and Forecast, By By Cancer Type, 2016-2032
- 8.3.1. Latin America Personalized Cancer Treatment Market Analysis by By Cancer Type: Introduction
- 8.3.2. Market Size Absolute $ Opportunity Analysis and Forecast, By By Cancer Type, 2016-2032
- 8.3.3. Breast Cancer
- 8.3.4. Lung Cancer
- 8.3.5. Colorectal Cancer
- 8.3.6. Prostate Cancer
- 8.3.7. Melanoma
- 8.3.8. Others
- 8.4. Latin America Personalized Cancer Treatment Market Analysis, Opportunity and Forecast, By Treatment Type, 2016-2032
- 8.4.1. Latin America Personalized Cancer Treatment Market Analysis by Treatment Type: Introduction
- 8.4.2. Market Size Absolute $ Opportunity Analysis and Forecast, By Treatment Type, 2016-2032
- 8.4.3. Targeted Therapy
- 8.4.4. Immunotherapy
- 8.4.5. Hormone Therapy
- 8.4.6. Chemotherapy
- 8.4.7. Radiation Therapy
- 8.4.8. Others
- 8.5. Latin America Personalized Cancer Treatment Market Analysis, Opportunity and Forecast, By Diagnostic Techniques, 2016-2032
- 8.5.1. Latin America Personalized Cancer Treatment Market Analysis by Diagnostic Techniques: Introduction
- 8.5.2. Market Size Absolute $ Opportunity Analysis and Forecast, By Diagnostic Techniques, 2016-2032
- 8.5.3. Genomic Sequencing
- 8.5.4. Liquid Biopsy
- 8.5.5. Immunohistochemistry
- 8.5.6. In Situ Hybridization
- 8.5.7. Biomarker Testing
- 8.5.8. Others
- 8.6. Latin America Personalized Cancer Treatment Market Analysis, Opportunity and Forecast, By End-users, 2016-2032
- 8.6.1. Latin America Personalized Cancer Treatment Market Analysis by End-users: Introduction
- 8.6.2. Market Size Absolute $ Opportunity Analysis and Forecast, By End-users, 2016-2032
- 8.6.3. Hospitals & Clinics
- 8.6.4. Diagnostic Laboratories
- 8.6.5. Research Institutes
- 8.6.6. Biotechnology & Pharmaceutical Companies
- 8.6.7. Ambulatory Surgical Centers
- 8.6.8. Others
- 8.7. Latin America Personalized Cancer Treatment Market Analysis, Opportunity and Forecast, By Country , 2016-2032
- 8.7.1. Latin America Personalized Cancer Treatment Market Analysis by Country : Introduction
- 8.7.2. Market Size Absolute $ Opportunity Analysis and Forecast, Country , 2016-2032
- 8.7.2.1. Brazil
- 8.7.2.2. Colombia
- 8.7.2.3. Chile
- 8.7.2.4. Argentina
- 8.7.2.5. Costa Rica
- 8.7.2.6. Rest of Latin America
- 9. Middle East & Africa Personalized Cancer Treatment Market Analysis, Opportunity and Forecast, 2016-2032
- 9.1. Middle East & Africa Personalized Cancer Treatment Market Analysis, 2016-2021
- 9.2. Middle East & Africa Personalized Cancer Treatment Market Opportunity and Forecast, 2023-2032
- 9.3. Middle East & Africa Personalized Cancer Treatment Market Analysis, Opportunity and Forecast, By By Cancer Type, 2016-2032
- 9.3.1. Middle East & Africa Personalized Cancer Treatment Market Analysis by By Cancer Type: Introduction
- 9.3.2. Market Size Absolute $ Opportunity Analysis and Forecast, By By Cancer Type, 2016-2032
- 9.3.3. Breast Cancer
- 9.3.4. Lung Cancer
- 9.3.5. Colorectal Cancer
- 9.3.6. Prostate Cancer
- 9.3.7. Melanoma
- 9.3.8. Others
- 9.4. Middle East & Africa Personalized Cancer Treatment Market Analysis, Opportunity and Forecast, By Treatment Type, 2016-2032
- 9.4.1. Middle East & Africa Personalized Cancer Treatment Market Analysis by Treatment Type: Introduction
- 9.4.2. Market Size Absolute $ Opportunity Analysis and Forecast, By Treatment Type, 2016-2032
- 9.4.3. Targeted Therapy
- 9.4.4. Immunotherapy
- 9.4.5. Hormone Therapy
- 9.4.6. Chemotherapy
- 9.4.7. Radiation Therapy
- 9.4.8. Others
- 9.5. Middle East & Africa Personalized Cancer Treatment Market Analysis, Opportunity and Forecast, By Diagnostic Techniques, 2016-2032
- 9.5.1. Middle East & Africa Personalized Cancer Treatment Market Analysis by Diagnostic Techniques: Introduction
- 9.5.2. Market Size Absolute $ Opportunity Analysis and Forecast, By Diagnostic Techniques, 2016-2032
- 9.5.3. Genomic Sequencing
- 9.5.4. Liquid Biopsy
- 9.5.5. Immunohistochemistry
- 9.5.6. In Situ Hybridization
- 9.5.7. Biomarker Testing
- 9.5.8. Others
- 9.6. Middle East & Africa Personalized Cancer Treatment Market Analysis, Opportunity and Forecast, By End-users, 2016-2032
- 9.6.1. Middle East & Africa Personalized Cancer Treatment Market Analysis by End-users: Introduction
- 9.6.2. Market Size Absolute $ Opportunity Analysis and Forecast, By End-users, 2016-2032
- 9.6.3. Hospitals & Clinics
- 9.6.4. Diagnostic Laboratories
- 9.6.5. Research Institutes
- 9.6.6. Biotechnology & Pharmaceutical Companies
- 9.6.7. Ambulatory Surgical Centers
- 9.6.8. Others
- 9.7. Middle East & Africa Personalized Cancer Treatment Market Analysis, Opportunity and Forecast, By Country , 2016-2032
- 9.7.1. Middle East & Africa Personalized Cancer Treatment Market Analysis by Country : Introduction
- 9.7.2. Market Size Absolute $ Opportunity Analysis and Forecast, Country , 2016-2032
- 9.7.2.1. Algeria
- 9.7.2.2. Egypt
- 9.7.2.3. Israel
- 9.7.2.4. Kuwait
- 9.7.2.5. Nigeria
- 9.7.2.6. Saudi Arabia
- 9.7.2.7. South Africa
- 9.7.2.8. Turkey
- 9.7.2.9. The UAE
- 9.7.2.10. Rest of MEA
- 10. Global Personalized Cancer Treatment Market Analysis, Opportunity and Forecast, By Region , 2016-2032
- 10.1. Global Personalized Cancer Treatment Market Analysis by Region : Introduction
- 10.2. Market Size Absolute $ Opportunity Analysis and Forecast, By Region , 2016-2032
- 10.2.1. North America
- 10.2.2. Western Europe
- 10.2.3. Eastern Europe
- 10.2.4. APAC
- 10.2.5. Latin America
- 10.2.6. Middle East & Africa
- 11. Global Personalized Cancer Treatment Market Competitive Landscape, Market Share Analysis, and Company Profiles
- 11.1. Market Share Analysis
- 11.2. Company Profiles
- 11.3. Roche Holding AG
- 11.3.1. Company Overview
- 11.3.2. Financial Highlights
- 11.3.3. Product Portfolio
- 11.3.4. SWOT Analysis
- 11.3.5. Key Strategies and Developments
- 11.4. Novartis AG
- 11.4.1. Company Overview
- 11.4.2. Financial Highlights
- 11.4.3. Product Portfolio
- 11.4.4. SWOT Analysis
- 11.4.5. Key Strategies and Developments
- 11.5. Bristol Myers Squibb
- 11.5.1. Company Overview
- 11.5.2. Financial Highlights
- 11.5.3. Product Portfolio
- 11.5.4. SWOT Analysis
- 11.5.5. Key Strategies and Developments
- 11.6. Merck & Co., Inc.
- 11.6.1. Company Overview
- 11.6.2. Financial Highlights
- 11.6.3. Product Portfolio
- 11.6.4. SWOT Analysis
- 11.6.5. Key Strategies and Developments
- 11.7. Pfizer Inc.
- 11.7.1. Company Overview
- 11.7.2. Financial Highlights
- 11.7.3. Product Portfolio
- 11.7.4. SWOT Analysis
- 11.7.5. Key Strategies and Developments
- 11.8. AstraZeneca
- 11.8.1. Company Overview
- 11.8.2. Financial Highlights
- 11.8.3. Product Portfolio
- 11.8.4. SWOT Analysis
- 11.8.5. Key Strategies and Developments
- 11.9. Eli Lilly and Company
- 11.9.1. Company Overview
- 11.9.2. Financial Highlights
- 11.9.3. Product Portfolio
- 11.9.4. SWOT Analysis
- 11.9.5. Key Strategies and Developments
- 11.10. Amgen Inc.
- 11.10.1. Company Overview
- 11.10.2. Financial Highlights
- 11.10.3. Product Portfolio
- 11.10.4. SWOT Analysis
- 11.10.5. Key Strategies and Developments
- 11.11. Illumina, Inc.
- 11.11.1. Company Overview
- 11.11.2. Financial Highlights
- 11.11.3. Product Portfolio
- 11.11.4. SWOT Analysis
- 11.11.5. Key Strategies and Developments
- 11.12. Foundation Medicine, Inc. (a Roche company)
- 11.12.1. Company Overview
- 11.12.2. Financial Highlights
- 11.12.3. Product Portfolio
- 11.12.4. SWOT Analysis
- 11.12.5. Key Strategies and Developments
- 11.13. Guardant Health, Inc.
- 11.13.1. Company Overview
- 11.13.2. Financial Highlights
- 11.13.3. Product Portfolio
- 11.13.4. SWOT Analysis
- 11.13.5. Key Strategies and Developments
- 11.14. Exact Sciences Corporation
- 11.14.1. Company Overview
- 11.14.2. Financial Highlights
- 11.14.3. Product Portfolio
- 11.14.4. SWOT Analysis
- 11.14.5. Key Strategies and Developments
- 11.15. Myriad Genetics, Inc.
- 11.15.1. Company Overview
- 11.15.2. Financial Highlights
- 11.15.3. Product Portfolio
- 11.15.4. SWOT Analysis
- 11.15.5. Key Strategies and Developments
- 11.16. Thermo Fisher Scientific, Inc.
- 11.16.1. Company Overview
- 11.16.2. Financial Highlights
- 11.16.3. Product Portfolio
- 11.16.4. SWOT Analysis
- 11.16.5. Key Strategies and Developments
- 11.17. Qiagen N.V.
- 11.17.1. Company Overview
- 11.17.2. Financial Highlights
- 11.17.3. Product Portfolio
- 11.17.4. SWOT Analysis
- 11.17.5. Key Strategies and Developments
- 11.18. Agilent Technologies, Inc.
- 11.18.1. Company Overview
- 11.18.2. Financial Highlights
- 11.18.3. Product Portfolio
- 11.18.4. SWOT Analysis
- 11.18.5. Key Strategies and Developments
- 11.19. Invitae Corporation
- 11.19.1. Company Overview
- 11.19.2. Financial Highlights
- 11.19.3. Product Portfolio
- 11.19.4. SWOT Analysis
- 11.19.5. Key Strategies and Developments
- 11.20. Tempus Labs, Inc.
- 11.20.1. Company Overview
- 11.20.2. Financial Highlights
- 11.20.3. Product Portfolio
- 11.20.4. SWOT Analysis
- 11.20.5. Key Strategies and Developments
- 11.21. Cancer Genetics, Inc.
- 11.21.1. Company Overview
- 11.21.2. Financial Highlights
- 11.21.3. Product Portfolio
- 11.21.4. SWOT Analysis
- 11.21.5. Key Strategies and Developments
- 11.22. Takeda Pharmaceutical Company Limited
- 11.22.1. Company Overview
- 11.22.2. Financial Highlights
- 11.22.3. Product Portfolio
- 11.22.4. SWOT Analysis
- 11.22.5. Key Strategies and Developments
- 12. Assumptions and Acronyms
- 13. Research Methodology
- 14. Contact
- List of Figures
- Figure 1: Global Personalized Cancer Treatment Market Revenue (US$ Mn) Market Share by Cancer Type in 2022
- Figure 2: Global Personalized Cancer Treatment Market Attractiveness Analysis by Cancer Type, 2016-2032
- Figure 3: Global Personalized Cancer Treatment Market Revenue (US$ Mn) Market Share by Treatment Typein 2022
- Figure 4: Global Personalized Cancer Treatment Market Attractiveness Analysis by Treatment Type, 2016-2032
- Figure 5: Global Personalized Cancer Treatment Market Revenue (US$ Mn) Market Share by Diagnostic Techniquesin 2022
- Figure 6: Global Personalized Cancer Treatment Market Attractiveness Analysis by Diagnostic Techniques, 2016-2032
- Figure 7: Global Personalized Cancer Treatment Market Revenue (US$ Mn) Market Share by End-usersin 2022
- Figure 8: Global Personalized Cancer Treatment Market Attractiveness Analysis by End-users, 2016-2032
- Figure 9: Global Personalized Cancer Treatment Market Revenue (US$ Mn) Market Share by Region in 2022
- Figure 10: Global Personalized Cancer Treatment Market Attractiveness Analysis by Region, 2016-2032
- Figure 11: Global Personalized Cancer Treatment Market Revenue (US$ Mn) (2016-2032)
- Figure 12: Global Personalized Cancer Treatment Market Revenue (US$ Mn) Comparison by Region (2016-2032)
- Figure 13: Global Personalized Cancer Treatment Market Revenue (US$ Mn) Comparison by Cancer Type (2016-2032)
- Figure 14: Global Personalized Cancer Treatment Market Revenue (US$ Mn) Comparison by Treatment Type (2016-2032)
- Figure 15: Global Personalized Cancer Treatment Market Revenue (US$ Mn) Comparison by Diagnostic Techniques (2016-2032)
- Figure 16: Global Personalized Cancer Treatment Market Revenue (US$ Mn) Comparison by End-users (2016-2032)
- Figure 17: Global Personalized Cancer Treatment Market Y-o-Y Growth Rate Comparison by Region (2016-2032)
- Figure 18: Global Personalized Cancer Treatment Market Y-o-Y Growth Rate Comparison by Cancer Type (2016-2032)
- Figure 19: Global Personalized Cancer Treatment Market Y-o-Y Growth Rate Comparison by Treatment Type (2016-2032)
- Figure 20: Global Personalized Cancer Treatment Market Y-o-Y Growth Rate Comparison by Diagnostic Techniques (2016-2032)
- Figure 21: Global Personalized Cancer Treatment Market Y-o-Y Growth Rate Comparison by End-users (2016-2032)
- Figure 22: Global Personalized Cancer Treatment Market Share Comparison by Region (2016-2032)
- Figure 23: Global Personalized Cancer Treatment Market Share Comparison by Cancer Type (2016-2032)
- Figure 24: Global Personalized Cancer Treatment Market Share Comparison by Treatment Type (2016-2032)
- Figure 25: Global Personalized Cancer Treatment Market Share Comparison by Diagnostic Techniques (2016-2032)
- Figure 26: Global Personalized Cancer Treatment Market Share Comparison by End-users (2016-2032)
- Figure 27: North America Personalized Cancer Treatment Market Revenue (US$ Mn) Market Share by Cancer Typein 2022
- Figure 28: North America Personalized Cancer Treatment Market Attractiveness Analysis by Cancer Type, 2016-2032
- Figure 29: North America Personalized Cancer Treatment Market Revenue (US$ Mn) Market Share by Treatment Typein 2022
- Figure 30: North America Personalized Cancer Treatment Market Attractiveness Analysis by Treatment Type, 2016-2032
- Figure 31: North America Personalized Cancer Treatment Market Revenue (US$ Mn) Market Share by Diagnostic Techniquesin 2022
- Figure 32: North America Personalized Cancer Treatment Market Attractiveness Analysis by Diagnostic Techniques, 2016-2032
- Figure 33: North America Personalized Cancer Treatment Market Revenue (US$ Mn) Market Share by End-usersin 2022
- Figure 34: North America Personalized Cancer Treatment Market Attractiveness Analysis by End-users, 2016-2032
- Figure 35: North America Personalized Cancer Treatment Market Revenue (US$ Mn) Market Share by Country in 2022
- Figure 36: North America Personalized Cancer Treatment Market Attractiveness Analysis by Country, 2016-2032
- Figure 37: North America Personalized Cancer Treatment Market Revenue (US$ Mn) (2016-2032)
- Figure 38: North America Personalized Cancer Treatment Market Revenue (US$ Mn) Comparison by Country (2016-2032)
- Figure 39: North America Personalized Cancer Treatment Market Revenue (US$ Mn) Comparison by Cancer Type (2016-2032)
- Figure 40: North America Personalized Cancer Treatment Market Revenue (US$ Mn) Comparison by Treatment Type (2016-2032)
- Figure 41: North America Personalized Cancer Treatment Market Revenue (US$ Mn) Comparison by Diagnostic Techniques (2016-2032)
- Figure 42: North America Personalized Cancer Treatment Market Revenue (US$ Mn) Comparison by End-users (2016-2032)
- Figure 43: North America Personalized Cancer Treatment Market Y-o-Y Growth Rate Comparison by Country (2016-2032)
- Figure 44: North America Personalized Cancer Treatment Market Y-o-Y Growth Rate Comparison by Cancer Type (2016-2032)
- Figure 45: North America Personalized Cancer Treatment Market Y-o-Y Growth Rate Comparison by Treatment Type (2016-2032)
- Figure 46: North America Personalized Cancer Treatment Market Y-o-Y Growth Rate Comparison by Diagnostic Techniques (2016-2032)
- Figure 47: North America Personalized Cancer Treatment Market Y-o-Y Growth Rate Comparison by End-users (2016-2032)
- Figure 48: North America Personalized Cancer Treatment Market Share Comparison by Country (2016-2032)
- Figure 49: North America Personalized Cancer Treatment Market Share Comparison by Cancer Type (2016-2032)
- Figure 50: North America Personalized Cancer Treatment Market Share Comparison by Treatment Type (2016-2032)
- Figure 51: North America Personalized Cancer Treatment Market Share Comparison by Diagnostic Techniques (2016-2032)
- Figure 52: North America Personalized Cancer Treatment Market Share Comparison by End-users (2016-2032)
- Figure 53: Western Europe Personalized Cancer Treatment Market Revenue (US$ Mn) Market Share by Cancer Typein 2022
- Figure 54: Western Europe Personalized Cancer Treatment Market Attractiveness Analysis by Cancer Type, 2016-2032
- Figure 55: Western Europe Personalized Cancer Treatment Market Revenue (US$ Mn) Market Share by Treatment Typein 2022
- Figure 56: Western Europe Personalized Cancer Treatment Market Attractiveness Analysis by Treatment Type, 2016-2032
- Figure 57: Western Europe Personalized Cancer Treatment Market Revenue (US$ Mn) Market Share by Diagnostic Techniquesin 2022
- Figure 58: Western Europe Personalized Cancer Treatment Market Attractiveness Analysis by Diagnostic Techniques, 2016-2032
- Figure 59: Western Europe Personalized Cancer Treatment Market Revenue (US$ Mn) Market Share by End-usersin 2022
- Figure 60: Western Europe Personalized Cancer Treatment Market Attractiveness Analysis by End-users, 2016-2032
- Figure 61: Western Europe Personalized Cancer Treatment Market Revenue (US$ Mn) Market Share by Country in 2022
- Figure 62: Western Europe Personalized Cancer Treatment Market Attractiveness Analysis by Country, 2016-2032
- Figure 63: Western Europe Personalized Cancer Treatment Market Revenue (US$ Mn) (2016-2032)
- Figure 64: Western Europe Personalized Cancer Treatment Market Revenue (US$ Mn) Comparison by Country (2016-2032)
- Figure 65: Western Europe Personalized Cancer Treatment Market Revenue (US$ Mn) Comparison by Cancer Type (2016-2032)
- Figure 66: Western Europe Personalized Cancer Treatment Market Revenue (US$ Mn) Comparison by Treatment Type (2016-2032)
- Figure 67: Western Europe Personalized Cancer Treatment Market Revenue (US$ Mn) Comparison by Diagnostic Techniques (2016-2032)
- Figure 68: Western Europe Personalized Cancer Treatment Market Revenue (US$ Mn) Comparison by End-users (2016-2032)
- Figure 69: Western Europe Personalized Cancer Treatment Market Y-o-Y Growth Rate Comparison by Country (2016-2032)
- Figure 70: Western Europe Personalized Cancer Treatment Market Y-o-Y Growth Rate Comparison by Cancer Type (2016-2032)
- Figure 71: Western Europe Personalized Cancer Treatment Market Y-o-Y Growth Rate Comparison by Treatment Type (2016-2032)
- Figure 72: Western Europe Personalized Cancer Treatment Market Y-o-Y Growth Rate Comparison by Diagnostic Techniques (2016-2032)
- Figure 73: Western Europe Personalized Cancer Treatment Market Y-o-Y Growth Rate Comparison by End-users (2016-2032)
- Figure 74: Western Europe Personalized Cancer Treatment Market Share Comparison by Country (2016-2032)
- Figure 75: Western Europe Personalized Cancer Treatment Market Share Comparison by Cancer Type (2016-2032)
- Figure 76: Western Europe Personalized Cancer Treatment Market Share Comparison by Treatment Type (2016-2032)
- Figure 77: Western Europe Personalized Cancer Treatment Market Share Comparison by Diagnostic Techniques (2016-2032)
- Figure 78: Western Europe Personalized Cancer Treatment Market Share Comparison by End-users (2016-2032)
- Figure 79: Eastern Europe Personalized Cancer Treatment Market Revenue (US$ Mn) Market Share by Cancer Typein 2022
- Figure 80: Eastern Europe Personalized Cancer Treatment Market Attractiveness Analysis by Cancer Type, 2016-2032
- Figure 81: Eastern Europe Personalized Cancer Treatment Market Revenue (US$ Mn) Market Share by Treatment Typein 2022
- Figure 82: Eastern Europe Personalized Cancer Treatment Market Attractiveness Analysis by Treatment Type, 2016-2032
- Figure 83: Eastern Europe Personalized Cancer Treatment Market Revenue (US$ Mn) Market Share by Diagnostic Techniquesin 2022
- Figure 84: Eastern Europe Personalized Cancer Treatment Market Attractiveness Analysis by Diagnostic Techniques, 2016-2032
- Figure 85: Eastern Europe Personalized Cancer Treatment Market Revenue (US$ Mn) Market Share by End-usersin 2022
- Figure 86: Eastern Europe Personalized Cancer Treatment Market Attractiveness Analysis by End-users, 2016-2032
- Figure 87: Eastern Europe Personalized Cancer Treatment Market Revenue (US$ Mn) Market Share by Country in 2022
- Figure 88: Eastern Europe Personalized Cancer Treatment Market Attractiveness Analysis by Country, 2016-2032
- Figure 89: Eastern Europe Personalized Cancer Treatment Market Revenue (US$ Mn) (2016-2032)
- Figure 90: Eastern Europe Personalized Cancer Treatment Market Revenue (US$ Mn) Comparison by Country (2016-2032)
- Figure 91: Eastern Europe Personalized Cancer Treatment Market Revenue (US$ Mn) Comparison by Cancer Type (2016-2032)
- Figure 92: Eastern Europe Personalized Cancer Treatment Market Revenue (US$ Mn) Comparison by Treatment Type (2016-2032)
- Figure 93: Eastern Europe Personalized Cancer Treatment Market Revenue (US$ Mn) Comparison by Diagnostic Techniques (2016-2032)
- Figure 94: Eastern Europe Personalized Cancer Treatment Market Revenue (US$ Mn) Comparison by End-users (2016-2032)
- Figure 95: Eastern Europe Personalized Cancer Treatment Market Y-o-Y Growth Rate Comparison by Country (2016-2032)
- Figure 96: Eastern Europe Personalized Cancer Treatment Market Y-o-Y Growth Rate Comparison by Cancer Type (2016-2032)
- Figure 97: Eastern Europe Personalized Cancer Treatment Market Y-o-Y Growth Rate Comparison by Treatment Type (2016-2032)
- Figure 98: Eastern Europe Personalized Cancer Treatment Market Y-o-Y Growth Rate Comparison by Diagnostic Techniques (2016-2032)
- Figure 99: Eastern Europe Personalized Cancer Treatment Market Y-o-Y Growth Rate Comparison by End-users (2016-2032)
- Figure 100: Eastern Europe Personalized Cancer Treatment Market Share Comparison by Country (2016-2032)
- Figure 101: Eastern Europe Personalized Cancer Treatment Market Share Comparison by Cancer Type (2016-2032)
- Figure 102: Eastern Europe Personalized Cancer Treatment Market Share Comparison by Treatment Type (2016-2032)
- Figure 103: Eastern Europe Personalized Cancer Treatment Market Share Comparison by Diagnostic Techniques (2016-2032)
- Figure 104: Eastern Europe Personalized Cancer Treatment Market Share Comparison by End-users (2016-2032)
- Figure 105: APAC Personalized Cancer Treatment Market Revenue (US$ Mn) Market Share by Cancer Typein 2022
- Figure 106: APAC Personalized Cancer Treatment Market Attractiveness Analysis by Cancer Type, 2016-2032
- Figure 107: APAC Personalized Cancer Treatment Market Revenue (US$ Mn) Market Share by Treatment Typein 2022
- Figure 108: APAC Personalized Cancer Treatment Market Attractiveness Analysis by Treatment Type, 2016-2032
- Figure 109: APAC Personalized Cancer Treatment Market Revenue (US$ Mn) Market Share by Diagnostic Techniquesin 2022
- Figure 110: APAC Personalized Cancer Treatment Market Attractiveness Analysis by Diagnostic Techniques, 2016-2032
- Figure 111: APAC Personalized Cancer Treatment Market Revenue (US$ Mn) Market Share by End-usersin 2022
- Figure 112: APAC Personalized Cancer Treatment Market Attractiveness Analysis by End-users, 2016-2032
- Figure 113: APAC Personalized Cancer Treatment Market Revenue (US$ Mn) Market Share by Country in 2022
- Figure 114: APAC Personalized Cancer Treatment Market Attractiveness Analysis by Country, 2016-2032
- Figure 115: APAC Personalized Cancer Treatment Market Revenue (US$ Mn) (2016-2032)
- Figure 116: APAC Personalized Cancer Treatment Market Revenue (US$ Mn) Comparison by Country (2016-2032)
- Figure 117: APAC Personalized Cancer Treatment Market Revenue (US$ Mn) Comparison by Cancer Type (2016-2032)
- Figure 118: APAC Personalized Cancer Treatment Market Revenue (US$ Mn) Comparison by Treatment Type (2016-2032)
- Figure 119: APAC Personalized Cancer Treatment Market Revenue (US$ Mn) Comparison by Diagnostic Techniques (2016-2032)
- Figure 120: APAC Personalized Cancer Treatment Market Revenue (US$ Mn) Comparison by End-users (2016-2032)
- Figure 121: APAC Personalized Cancer Treatment Market Y-o-Y Growth Rate Comparison by Country (2016-2032)
- Figure 122: APAC Personalized Cancer Treatment Market Y-o-Y Growth Rate Comparison by Cancer Type (2016-2032)
- Figure 123: APAC Personalized Cancer Treatment Market Y-o-Y Growth Rate Comparison by Treatment Type (2016-2032)
- Figure 124: APAC Personalized Cancer Treatment Market Y-o-Y Growth Rate Comparison by Diagnostic Techniques (2016-2032)
- Figure 125: APAC Personalized Cancer Treatment Market Y-o-Y Growth Rate Comparison by End-users (2016-2032)
- Figure 126: APAC Personalized Cancer Treatment Market Share Comparison by Country (2016-2032)
- Figure 127: APAC Personalized Cancer Treatment Market Share Comparison by Cancer Type (2016-2032)
- Figure 128: APAC Personalized Cancer Treatment Market Share Comparison by Treatment Type (2016-2032)
- Figure 129: APAC Personalized Cancer Treatment Market Share Comparison by Diagnostic Techniques (2016-2032)
- Figure 130: APAC Personalized Cancer Treatment Market Share Comparison by End-users (2016-2032)
- Figure 131: Latin America Personalized Cancer Treatment Market Revenue (US$ Mn) Market Share by Cancer Typein 2022
- Figure 132: Latin America Personalized Cancer Treatment Market Attractiveness Analysis by Cancer Type, 2016-2032
- Figure 133: Latin America Personalized Cancer Treatment Market Revenue (US$ Mn) Market Share by Treatment Typein 2022
- Figure 134: Latin America Personalized Cancer Treatment Market Attractiveness Analysis by Treatment Type, 2016-2032
- Figure 135: Latin America Personalized Cancer Treatment Market Revenue (US$ Mn) Market Share by Diagnostic Techniquesin 2022
- Figure 136: Latin America Personalized Cancer Treatment Market Attractiveness Analysis by Diagnostic Techniques, 2016-2032
- Figure 137: Latin America Personalized Cancer Treatment Market Revenue (US$ Mn) Market Share by End-usersin 2022
- Figure 138: Latin America Personalized Cancer Treatment Market Attractiveness Analysis by End-users, 2016-2032
- Figure 139: Latin America Personalized Cancer Treatment Market Revenue (US$ Mn) Market Share by Country in 2022
- Figure 140: Latin America Personalized Cancer Treatment Market Attractiveness Analysis by Country, 2016-2032
- Figure 141: Latin America Personalized Cancer Treatment Market Revenue (US$ Mn) (2016-2032)
- Figure 142: Latin America Personalized Cancer Treatment Market Revenue (US$ Mn) Comparison by Country (2016-2032)
- Figure 143: Latin America Personalized Cancer Treatment Market Revenue (US$ Mn) Comparison by Cancer Type (2016-2032)
- Figure 144: Latin America Personalized Cancer Treatment Market Revenue (US$ Mn) Comparison by Treatment Type (2016-2032)
- Figure 145: Latin America Personalized Cancer Treatment Market Revenue (US$ Mn) Comparison by Diagnostic Techniques (2016-2032)
- Figure 146: Latin America Personalized Cancer Treatment Market Revenue (US$ Mn) Comparison by End-users (2016-2032)
- Figure 147: Latin America Personalized Cancer Treatment Market Y-o-Y Growth Rate Comparison by Country (2016-2032)
- Figure 148: Latin America Personalized Cancer Treatment Market Y-o-Y Growth Rate Comparison by Cancer Type (2016-2032)
- Figure 149: Latin America Personalized Cancer Treatment Market Y-o-Y Growth Rate Comparison by Treatment Type (2016-2032)
- Figure 150: Latin America Personalized Cancer Treatment Market Y-o-Y Growth Rate Comparison by Diagnostic Techniques (2016-2032)
- Figure 151: Latin America Personalized Cancer Treatment Market Y-o-Y Growth Rate Comparison by End-users (2016-2032)
- Figure 152: Latin America Personalized Cancer Treatment Market Share Comparison by Country (2016-2032)
- Figure 153: Latin America Personalized Cancer Treatment Market Share Comparison by Cancer Type (2016-2032)
- Figure 154: Latin America Personalized Cancer Treatment Market Share Comparison by Treatment Type (2016-2032)
- Figure 155: Latin America Personalized Cancer Treatment Market Share Comparison by Diagnostic Techniques (2016-2032)
- Figure 156: Latin America Personalized Cancer Treatment Market Share Comparison by End-users (2016-2032)
- Figure 157: Middle East & Africa Personalized Cancer Treatment Market Revenue (US$ Mn) Market Share by Cancer Typein 2022
- Figure 158: Middle East & Africa Personalized Cancer Treatment Market Attractiveness Analysis by Cancer Type, 2016-2032
- Figure 159: Middle East & Africa Personalized Cancer Treatment Market Revenue (US$ Mn) Market Share by Treatment Typein 2022
- Figure 160: Middle East & Africa Personalized Cancer Treatment Market Attractiveness Analysis by Treatment Type, 2016-2032
- Figure 161: Middle East & Africa Personalized Cancer Treatment Market Revenue (US$ Mn) Market Share by Diagnostic Techniquesin 2022
- Figure 162: Middle East & Africa Personalized Cancer Treatment Market Attractiveness Analysis by Diagnostic Techniques, 2016-2032
- Figure 163: Middle East & Africa Personalized Cancer Treatment Market Revenue (US$ Mn) Market Share by End-usersin 2022
- Figure 164: Middle East & Africa Personalized Cancer Treatment Market Attractiveness Analysis by End-users, 2016-2032
- Figure 165: Middle East & Africa Personalized Cancer Treatment Market Revenue (US$ Mn) Market Share by Country in 2022
- Figure 166: Middle East & Africa Personalized Cancer Treatment Market Attractiveness Analysis by Country, 2016-2032
- Figure 167: Middle East & Africa Personalized Cancer Treatment Market Revenue (US$ Mn) (2016-2032)
- Figure 168: Middle East & Africa Personalized Cancer Treatment Market Revenue (US$ Mn) Comparison by Country (2016-2032)
- Figure 169: Middle East & Africa Personalized Cancer Treatment Market Revenue (US$ Mn) Comparison by Cancer Type (2016-2032)
- Figure 170: Middle East & Africa Personalized Cancer Treatment Market Revenue (US$ Mn) Comparison by Treatment Type (2016-2032)
- Figure 171: Middle East & Africa Personalized Cancer Treatment Market Revenue (US$ Mn) Comparison by Diagnostic Techniques (2016-2032)
- Figure 172: Middle East & Africa Personalized Cancer Treatment Market Revenue (US$ Mn) Comparison by End-users (2016-2032)
- Figure 173: Middle East & Africa Personalized Cancer Treatment Market Y-o-Y Growth Rate Comparison by Country (2016-2032)
- Figure 174: Middle East & Africa Personalized Cancer Treatment Market Y-o-Y Growth Rate Comparison by Cancer Type (2016-2032)
- Figure 175: Middle East & Africa Personalized Cancer Treatment Market Y-o-Y Growth Rate Comparison by Treatment Type (2016-2032)
- Figure 176: Middle East & Africa Personalized Cancer Treatment Market Y-o-Y Growth Rate Comparison by Diagnostic Techniques (2016-2032)
- Figure 177: Middle East & Africa Personalized Cancer Treatment Market Y-o-Y Growth Rate Comparison by End-users (2016-2032)
- Figure 178: Middle East & Africa Personalized Cancer Treatment Market Share Comparison by Country (2016-2032)
- Figure 179: Middle East & Africa Personalized Cancer Treatment Market Share Comparison by Cancer Type (2016-2032)
- Figure 180: Middle East & Africa Personalized Cancer Treatment Market Share Comparison by Treatment Type (2016-2032)
- Figure 181: Middle East & Africa Personalized Cancer Treatment Market Share Comparison by Diagnostic Techniques (2016-2032)
- Figure 182: Middle East & Africa Personalized Cancer Treatment Market Share Comparison by End-users (2016-2032)
List of Tables
- Table 1: Global Personalized Cancer Treatment Market Comparison by Cancer Type (2016-2032)
- Table 2: Global Personalized Cancer Treatment Market Comparison by Treatment Type (2016-2032)
- Table 3: Global Personalized Cancer Treatment Market Comparison by Diagnostic Techniques (2016-2032)
- Table 4: Global Personalized Cancer Treatment Market Comparison by End-users (2016-2032)
- Table 5: Global Personalized Cancer Treatment Market Revenue (US$ Mn) Comparison by Region (2016-2032)
- Table 6: Global Personalized Cancer Treatment Market Revenue (US$ Mn) (2016-2032)
- Table 7: Global Personalized Cancer Treatment Market Revenue (US$ Mn) Comparison by Region (2016-2032)
- Table 8: Global Personalized Cancer Treatment Market Revenue (US$ Mn) Comparison by Cancer Type (2016-2032)
- Table 9: Global Personalized Cancer Treatment Market Revenue (US$ Mn) Comparison by Treatment Type (2016-2032)
- Table 10: Global Personalized Cancer Treatment Market Revenue (US$ Mn) Comparison by Diagnostic Techniques (2016-2032)
- Table 11: Global Personalized Cancer Treatment Market Revenue (US$ Mn) Comparison by End-users (2016-2032)
- Table 12: Global Personalized Cancer Treatment Market Y-o-Y Growth Rate Comparison by Region (2016-2032)
- Table 13: Global Personalized Cancer Treatment Market Y-o-Y Growth Rate Comparison by Cancer Type (2016-2032)
- Table 14: Global Personalized Cancer Treatment Market Y-o-Y Growth Rate Comparison by Treatment Type (2016-2032)
- Table 15: Global Personalized Cancer Treatment Market Y-o-Y Growth Rate Comparison by Diagnostic Techniques (2016-2032)
- Table 16: Global Personalized Cancer Treatment Market Y-o-Y Growth Rate Comparison by End-users (2016-2032)
- Table 17: Global Personalized Cancer Treatment Market Share Comparison by Region (2016-2032)
- Table 18: Global Personalized Cancer Treatment Market Share Comparison by Cancer Type (2016-2032)
- Table 19: Global Personalized Cancer Treatment Market Share Comparison by Treatment Type (2016-2032)
- Table 20: Global Personalized Cancer Treatment Market Share Comparison by Diagnostic Techniques (2016-2032)
- Table 21: Global Personalized Cancer Treatment Market Share Comparison by End-users (2016-2032)
- Table 22: North America Personalized Cancer Treatment Market Comparison by Treatment Type (2016-2032)
- Table 23: North America Personalized Cancer Treatment Market Comparison by Diagnostic Techniques (2016-2032)
- Table 24: North America Personalized Cancer Treatment Market Comparison by End-users (2016-2032)
- Table 25: North America Personalized Cancer Treatment Market Revenue (US$ Mn) Comparison by Country (2016-2032)
- Table 26: North America Personalized Cancer Treatment Market Revenue (US$ Mn) (2016-2032)
- Table 27: North America Personalized Cancer Treatment Market Revenue (US$ Mn) Comparison by Country (2016-2032)
- Table 28: North America Personalized Cancer Treatment Market Revenue (US$ Mn) Comparison by Cancer Type (2016-2032)
- Table 29: North America Personalized Cancer Treatment Market Revenue (US$ Mn) Comparison by Treatment Type (2016-2032)
- Table 30: North America Personalized Cancer Treatment Market Revenue (US$ Mn) Comparison by Diagnostic Techniques (2016-2032)
- Table 31: North America Personalized Cancer Treatment Market Revenue (US$ Mn) Comparison by End-users (2016-2032)
- Table 32: North America Personalized Cancer Treatment Market Y-o-Y Growth Rate Comparison by Country (2016-2032)
- Table 33: North America Personalized Cancer Treatment Market Y-o-Y Growth Rate Comparison by Cancer Type (2016-2032)
- Table 34: North America Personalized Cancer Treatment Market Y-o-Y Growth Rate Comparison by Treatment Type (2016-2032)
- Table 35: North America Personalized Cancer Treatment Market Y-o-Y Growth Rate Comparison by Diagnostic Techniques (2016-2032)
- Table 36: North America Personalized Cancer Treatment Market Y-o-Y Growth Rate Comparison by End-users (2016-2032)
- Table 37: North America Personalized Cancer Treatment Market Share Comparison by Country (2016-2032)
- Table 38: North America Personalized Cancer Treatment Market Share Comparison by Cancer Type (2016-2032)
- Table 39: North America Personalized Cancer Treatment Market Share Comparison by Treatment Type (2016-2032)
- Table 40: North America Personalized Cancer Treatment Market Share Comparison by Diagnostic Techniques (2016-2032)
- Table 41: North America Personalized Cancer Treatment Market Share Comparison by End-users (2016-2032)
- Table 42: Western Europe Personalized Cancer Treatment Market Comparison by Cancer Type (2016-2032)
- Table 43: Western Europe Personalized Cancer Treatment Market Comparison by Treatment Type (2016-2032)
- Table 44: Western Europe Personalized Cancer Treatment Market Comparison by Diagnostic Techniques (2016-2032)
- Table 45: Western Europe Personalized Cancer Treatment Market Comparison by End-users (2016-2032)
- Table 46: Western Europe Personalized Cancer Treatment Market Revenue (US$ Mn) Comparison by Country (2016-2032)
- Table 47: Western Europe Personalized Cancer Treatment Market Revenue (US$ Mn) (2016-2032)
- Table 48: Western Europe Personalized Cancer Treatment Market Revenue (US$ Mn) Comparison by Country (2016-2032)
- Table 49: Western Europe Personalized Cancer Treatment Market Revenue (US$ Mn) Comparison by Cancer Type (2016-2032)
- Table 50: Western Europe Personalized Cancer Treatment Market Revenue (US$ Mn) Comparison by Treatment Type (2016-2032)
- Table 51: Western Europe Personalized Cancer Treatment Market Revenue (US$ Mn) Comparison by Diagnostic Techniques (2016-2032)
- Table 52: Western Europe Personalized Cancer Treatment Market Revenue (US$ Mn) Comparison by End-users (2016-2032)
- Table 53: Western Europe Personalized Cancer Treatment Market Y-o-Y Growth Rate Comparison by Country (2016-2032)
- Table 54: Western Europe Personalized Cancer Treatment Market Y-o-Y Growth Rate Comparison by Cancer Type (2016-2032)
- Table 55: Western Europe Personalized Cancer Treatment Market Y-o-Y Growth Rate Comparison by Treatment Type (2016-2032)
- Table 56: Western Europe Personalized Cancer Treatment Market Y-o-Y Growth Rate Comparison by Diagnostic Techniques (2016-2032)
- Table 57: Western Europe Personalized Cancer Treatment Market Y-o-Y Growth Rate Comparison by End-users (2016-2032)
- Table 58: Western Europe Personalized Cancer Treatment Market Share Comparison by Country (2016-2032)
- Table 59: Western Europe Personalized Cancer Treatment Market Share Comparison by Cancer Type (2016-2032)
- Table 60: Western Europe Personalized Cancer Treatment Market Share Comparison by Treatment Type (2016-2032)
- Table 61: Western Europe Personalized Cancer Treatment Market Share Comparison by Diagnostic Techniques (2016-2032)
- Table 62: Western Europe Personalized Cancer Treatment Market Share Comparison by End-users (2016-2032)
- Table 63: Eastern Europe Personalized Cancer Treatment Market Comparison by Cancer Type (2016-2032)
- Table 64: Eastern Europe Personalized Cancer Treatment Market Comparison by Treatment Type (2016-2032)
- Table 65: Eastern Europe Personalized Cancer Treatment Market Comparison by Diagnostic Techniques (2016-2032)
- Table 66: Eastern Europe Personalized Cancer Treatment Market Comparison by End-users (2016-2032)
- Table 67: Eastern Europe Personalized Cancer Treatment Market Revenue (US$ Mn) Comparison by Country (2016-2032)
- Table 68: Eastern Europe Personalized Cancer Treatment Market Revenue (US$ Mn) (2016-2032)
- Table 69: Eastern Europe Personalized Cancer Treatment Market Revenue (US$ Mn) Comparison by Country (2016-2032)
- Table 70: Eastern Europe Personalized Cancer Treatment Market Revenue (US$ Mn) Comparison by Cancer Type (2016-2032)
- Table 71: Eastern Europe Personalized Cancer Treatment Market Revenue (US$ Mn) Comparison by Treatment Type (2016-2032)
- Table 72: Eastern Europe Personalized Cancer Treatment Market Revenue (US$ Mn) Comparison by Diagnostic Techniques (2016-2032)
- Table 73: Eastern Europe Personalized Cancer Treatment Market Revenue (US$ Mn) Comparison by End-users (2016-2032)
- Table 74: Eastern Europe Personalized Cancer Treatment Market Y-o-Y Growth Rate Comparison by Country (2016-2032)
- Table 75: Eastern Europe Personalized Cancer Treatment Market Y-o-Y Growth Rate Comparison by Cancer Type (2016-2032)
- Table 76: Eastern Europe Personalized Cancer Treatment Market Y-o-Y Growth Rate Comparison by Treatment Type (2016-2032)
- Table 77: Eastern Europe Personalized Cancer Treatment Market Y-o-Y Growth Rate Comparison by Diagnostic Techniques (2016-2032)
- Table 78: Eastern Europe Personalized Cancer Treatment Market Y-o-Y Growth Rate Comparison by End-users (2016-2032)
- Table 79: Eastern Europe Personalized Cancer Treatment Market Share Comparison by Country (2016-2032)
- Table 80: Eastern Europe Personalized Cancer Treatment Market Share Comparison by Cancer Type (2016-2032)
- Table 81: Eastern Europe Personalized Cancer Treatment Market Share Comparison by Treatment Type (2016-2032)
- Table 82: Eastern Europe Personalized Cancer Treatment Market Share Comparison by Diagnostic Techniques (2016-2032)
- Table 83: Eastern Europe Personalized Cancer Treatment Market Share Comparison by End-users (2016-2032)
- Table 84: APAC Personalized Cancer Treatment Market Comparison by Cancer Type (2016-2032)
- Table 85: APAC Personalized Cancer Treatment Market Comparison by Treatment Type (2016-2032)
- Table 86: APAC Personalized Cancer Treatment Market Comparison by Diagnostic Techniques (2016-2032)
- Table 87: APAC Personalized Cancer Treatment Market Comparison by End-users (2016-2032)
- Table 88: APAC Personalized Cancer Treatment Market Revenue (US$ Mn) Comparison by Country (2016-2032)
- Table 89: APAC Personalized Cancer Treatment Market Revenue (US$ Mn) (2016-2032)
- Table 90: APAC Personalized Cancer Treatment Market Revenue (US$ Mn) Comparison by Country (2016-2032)
- Table 91: APAC Personalized Cancer Treatment Market Revenue (US$ Mn) Comparison by Cancer Type (2016-2032)
- Table 92: APAC Personalized Cancer Treatment Market Revenue (US$ Mn) Comparison by Treatment Type (2016-2032)
- Table 93: APAC Personalized Cancer Treatment Market Revenue (US$ Mn) Comparison by Diagnostic Techniques (2016-2032)
- Table 94: APAC Personalized Cancer Treatment Market Revenue (US$ Mn) Comparison by End-users (2016-2032)
- Table 95: APAC Personalized Cancer Treatment Market Y-o-Y Growth Rate Comparison by Country (2016-2032)
- Table 96: APAC Personalized Cancer Treatment Market Y-o-Y Growth Rate Comparison by Cancer Type (2016-2032)
- Table 97: APAC Personalized Cancer Treatment Market Y-o-Y Growth Rate Comparison by Treatment Type (2016-2032)
- Table 98: APAC Personalized Cancer Treatment Market Y-o-Y Growth Rate Comparison by Diagnostic Techniques (2016-2032)
- Table 99: APAC Personalized Cancer Treatment Market Y-o-Y Growth Rate Comparison by End-users (2016-2032)
- Table 100: APAC Personalized Cancer Treatment Market Share Comparison by Country (2016-2032)
- Table 101: APAC Personalized Cancer Treatment Market Share Comparison by Cancer Type (2016-2032)
- Table 102: APAC Personalized Cancer Treatment Market Share Comparison by Treatment Type (2016-2032)
- Table 103: APAC Personalized Cancer Treatment Market Share Comparison by Diagnostic Techniques (2016-2032)
- Table 104: APAC Personalized Cancer Treatment Market Share Comparison by End-users (2016-2032)
- Table 105: Latin America Personalized Cancer Treatment Market Comparison by Cancer Type (2016-2032)
- Table 106: Latin America Personalized Cancer Treatment Market Comparison by Treatment Type (2016-2032)
- Table 107: Latin America Personalized Cancer Treatment Market Comparison by Diagnostic Techniques (2016-2032)
- Table 108: Latin America Personalized Cancer Treatment Market Comparison by End-users (2016-2032)
- Table 109: Latin America Personalized Cancer Treatment Market Revenue (US$ Mn) Comparison by Country (2016-2032)
- Table 110: Latin America Personalized Cancer Treatment Market Revenue (US$ Mn) (2016-2032)
- Table 111: Latin America Personalized Cancer Treatment Market Revenue (US$ Mn) Comparison by Country (2016-2032)
- Table 112: Latin America Personalized Cancer Treatment Market Revenue (US$ Mn) Comparison by Cancer Type (2016-2032)
- Table 113: Latin America Personalized Cancer Treatment Market Revenue (US$ Mn) Comparison by Treatment Type (2016-2032)
- Table 114: Latin America Personalized Cancer Treatment Market Revenue (US$ Mn) Comparison by Diagnostic Techniques (2016-2032)
- Table 115: Latin America Personalized Cancer Treatment Market Revenue (US$ Mn) Comparison by End-users (2016-2032)
- Table 116: Latin America Personalized Cancer Treatment Market Y-o-Y Growth Rate Comparison by Country (2016-2032)
- Table 117: Latin America Personalized Cancer Treatment Market Y-o-Y Growth Rate Comparison by Cancer Type (2016-2032)
- Table 118: Latin America Personalized Cancer Treatment Market Y-o-Y Growth Rate Comparison by Treatment Type (2016-2032)
- Table 119: Latin America Personalized Cancer Treatment Market Y-o-Y Growth Rate Comparison by Diagnostic Techniques (2016-2032)
- Table 120: Latin America Personalized Cancer Treatment Market Y-o-Y Growth Rate Comparison by End-users (2016-2032)
- Table 121: Latin America Personalized Cancer Treatment Market Share Comparison by Country (2016-2032)
- Table 122: Latin America Personalized Cancer Treatment Market Share Comparison by Cancer Type (2016-2032)
- Table 123: Latin America Personalized Cancer Treatment Market Share Comparison by Treatment Type (2016-2032)
- Table 124: Latin America Personalized Cancer Treatment Market Share Comparison by Diagnostic Techniques (2016-2032)
- Table 125: Latin America Personalized Cancer Treatment Market Share Comparison by End-users (2016-2032)
- Table 126: Middle East & Africa Personalized Cancer Treatment Market Comparison by Cancer Type (2016-2032)
- Table 127: Middle East & Africa Personalized Cancer Treatment Market Comparison by Treatment Type (2016-2032)
- Table 128: Middle East & Africa Personalized Cancer Treatment Market Comparison by Diagnostic Techniques (2016-2032)
- Table 129: Middle East & Africa Personalized Cancer Treatment Market Comparison by End-users (2016-2032)
- Table 130: Middle East & Africa Personalized Cancer Treatment Market Revenue (US$ Mn) Comparison by Country (2016-2032)
- Table 131: Middle East & Africa Personalized Cancer Treatment Market Revenue (US$ Mn) (2016-2032)
- Table 132: Middle East & Africa Personalized Cancer Treatment Market Revenue (US$ Mn) Comparison by Country (2016-2032)
- Table 133: Middle East & Africa Personalized Cancer Treatment Market Revenue (US$ Mn) Comparison by Cancer Type (2016-2032)
- Table 134: Middle East & Africa Personalized Cancer Treatment Market Revenue (US$ Mn) Comparison by Treatment Type (2016-2032)
- Table 135: Middle East & Africa Personalized Cancer Treatment Market Revenue (US$ Mn) Comparison by Diagnostic Techniques (2016-2032)
- Table 136: Middle East & Africa Personalized Cancer Treatment Market Revenue (US$ Mn) Comparison by End-users (2016-2032)
- Table 137: Middle East & Africa Personalized Cancer Treatment Market Y-o-Y Growth Rate Comparison by Country (2016-2032)
- Table 138: Middle East & Africa Personalized Cancer Treatment Market Y-o-Y Growth Rate Comparison by Cancer Type (2016-2032)
- Table 139: Middle East & Africa Personalized Cancer Treatment Market Y-o-Y Growth Rate Comparison by Treatment Type (2016-2032)
- Table 140: Middle East & Africa Personalized Cancer Treatment Market Y-o-Y Growth Rate Comparison by Diagnostic Techniques (2016-2032)
- Table 141: Middle East & Africa Personalized Cancer Treatment Market Y-o-Y Growth Rate Comparison by End-users (2016-2032)
- Table 142: Middle East & Africa Personalized Cancer Treatment Market Share Comparison by Country (2016-2032)
- Table 143: Middle East & Africa Personalized Cancer Treatment Market Share Comparison by Cancer Type (2016-2032)
- Table 144: Middle East & Africa Personalized Cancer Treatment Market Share Comparison by Treatment Type (2016-2032)
- Table 145: Middle East & Africa Personalized Cancer Treatment Market Share Comparison by Diagnostic Techniques (2016-2032)
- Table 146: Middle East & Africa Personalized Cancer Treatment Market Share Comparison by End-users (2016-2032)
- 1. Executive Summary
-
- Roche Holding AG
- Novartis AG
- Bristol Myers Squibb
- Merck & Co., Inc.
- Pfizer Inc.
- AstraZeneca
- Eli Lilly and Company
- Amgen Inc.
- Illumina, Inc.
- Foundation Medicine, Inc. (a Roche company)
- Guardant Health, Inc.
- Exact Sciences Corporation
- Myriad Genetics, Inc.
- Thermo Fisher Scientific, Inc.
- Qiagen N.V.
- Agilent Technologies, Inc.
- Invitae Corporation
- Tempus Labs, Inc.
- Cancer Genetics, Inc.
- Takeda Pharmaceutical Company Limited
Our Clients


View Our Licence Options
