
Orange Juices Market By Processing Type (Frozen Concentrated Orange Juice (FCOJ), Not-From-Concentrate Juice (NFC), Refrigerated Orange Juice from Concentrate (RECON), Nectar), By Packaging (Cartons, Metal Can, PP Material Bottle, Other Packaging), By Distribution Channel (Food & Beverage Industry, Food Service Provider, Supermarkets & Hypermarkets, Convenience Stores, Specialty Food Stores, Online Retail), By Region and Companies - Industry Segment Outlook, Market Assessment, Competition Scenario, Trends and Forecast 2024-2033
-
40543
-
Aug 2024
-
137
-


-
This report was compiled by Shreyas Rokade Shreyas Rokade is a seasoned Research Analyst with CMFE, bringing extensive expertise in market research and consulting, with a strong background in Chemical Engineering. Correspondence Team Lead-CMFE Linkedin | Detailed Market research Methodology Our methodology involves a mix of primary research, including interviews with leading mental health experts, and secondary research from reputable medical journals and databases. View Detailed Methodology Page
-
Quick Navigation
Report Overview
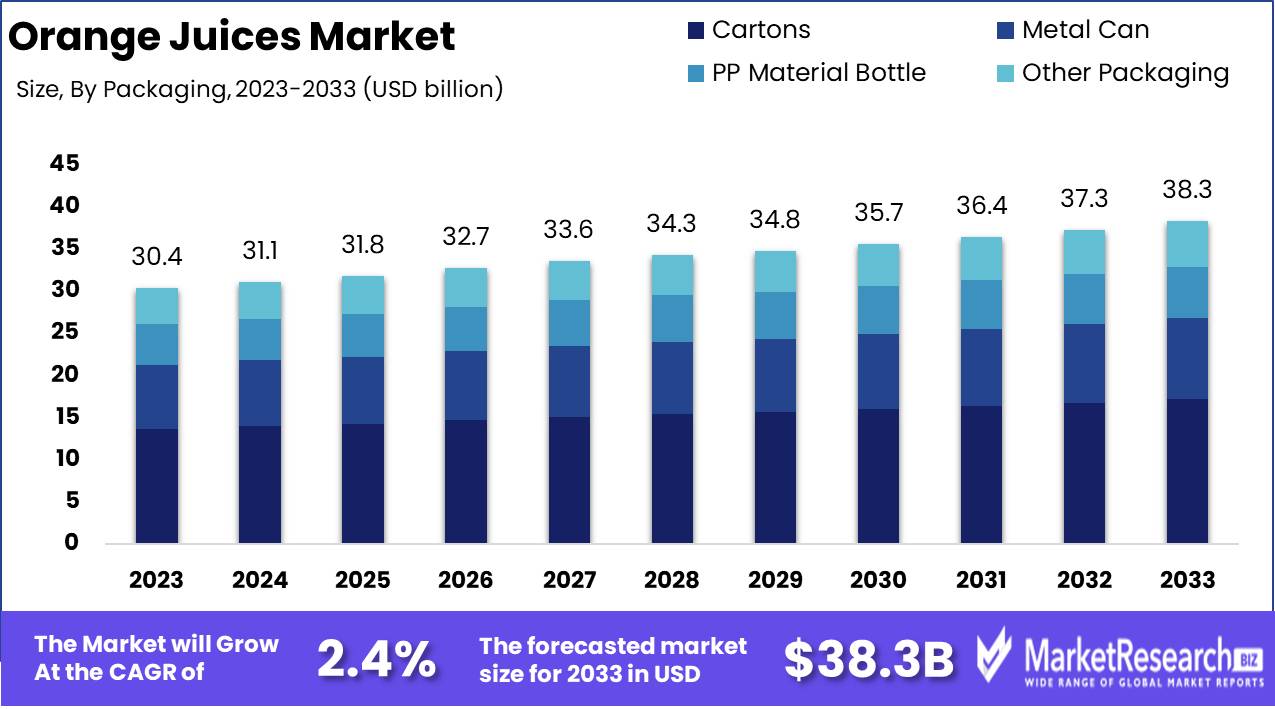
The Global Orange Juices Market was valued at USD 30.4 Bn in 2023. It is expected to reach USD 38.3 Bn by 2033, with a CAGR of 2.4% during the forecast period from 2024 to 2033.
The Orange Juices Market encompasses the production, distribution, and sale of orange juice, including variants like fresh, concentrated, and not-from-concentrate (NFC). This market is driven by consumer preferences for natural and healthy beverages, advancements in production technologies, and growing health consciousness. Key players focus on product differentiation through quality, nutritional value, and taste. The market is influenced by factors such as raw material availability, especially oranges, and the development of sustainable practices to meet consumer demand for eco-friendly products.
 The Orange Juices Market is poised for notable growth, driven by evolving consumer preferences and advancements in production technologies. In the 2023/2024 season, U.S. orange juice production is anticipated to rebound to 110,000 tons, attributed to increased orange availability in Florida, the nation's largest producer. This recovery highlights the market's resilience and its dependence on key agricultural regions.
One significant trend is the rising demand for not-from-concentrate (NFC) orange juice, promoted as a real juice with no added water or preservatives. This product emphasizes fresh orange nutrition and taste, boasting a shelf life of 28 days. The shift towards NFC juice underscores consumer preference for authenticity and minimal processing, aligning with broader health and wellness trends.
Additionally, the market is witnessing a push towards sustainability, with companies adopting eco-friendly practices in their production and packaging processes. This move is in response to increasing consumer awareness and demand for environmentally responsible products. The emphasis on sustainability is expected to further drive market growth as brands leverage this trend to differentiate themselves.
Advancements in production technologies are enhancing juice quality and extending shelf life without compromising nutritional value. This technological progress is crucial in meeting the growing demand for high-quality orange juice.
Key Takeaways
- Market Value: The Global Orange Juices Market was valued at USD 30.4 Bn in 2023. It is expected to reach USD 38.3 Bn by 2033, with a CAGR of 2.4% during the forecast period from 2024 to 2033.
- By Processing Type: Not-From-Concentrate Juice (NFC) constitutes 40%, favored for its natural flavor and nutritional value.
- By Packaging: Cartons dominate with 45%, preferred for their convenience and preservation qualities.
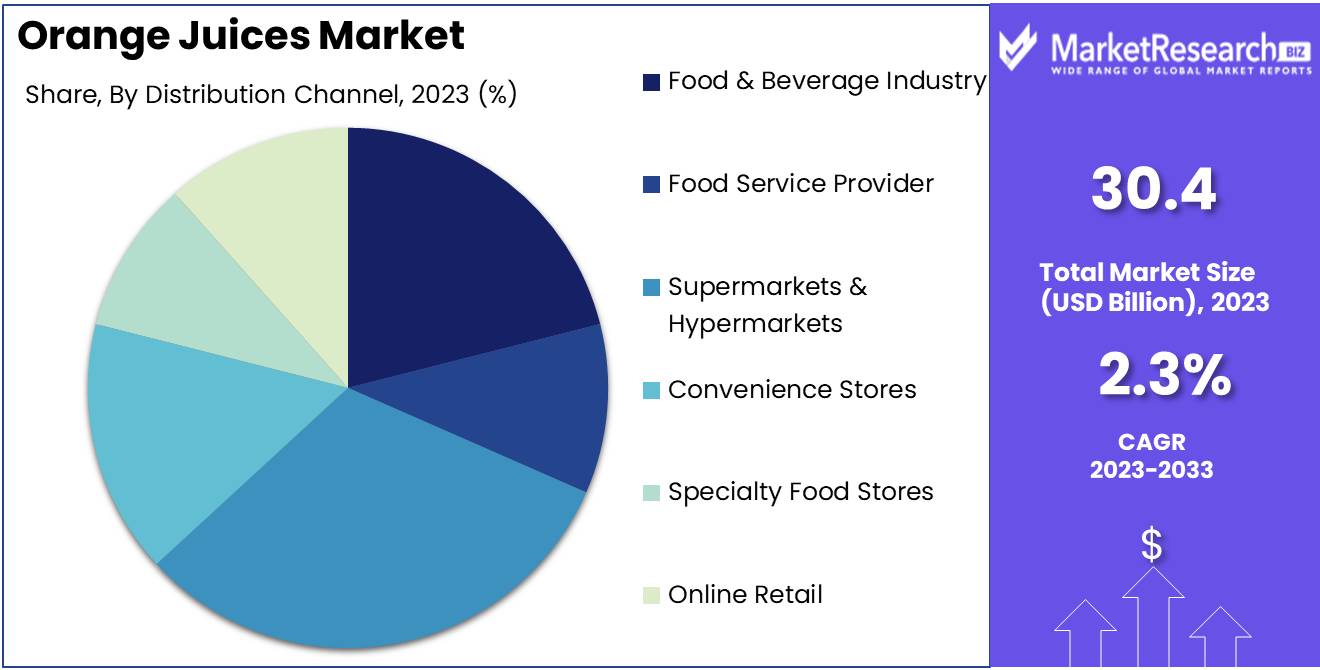
- By Distribution Channel: Supermarkets & Hypermarkets make up 30%, offering wide accessibility to consumers.
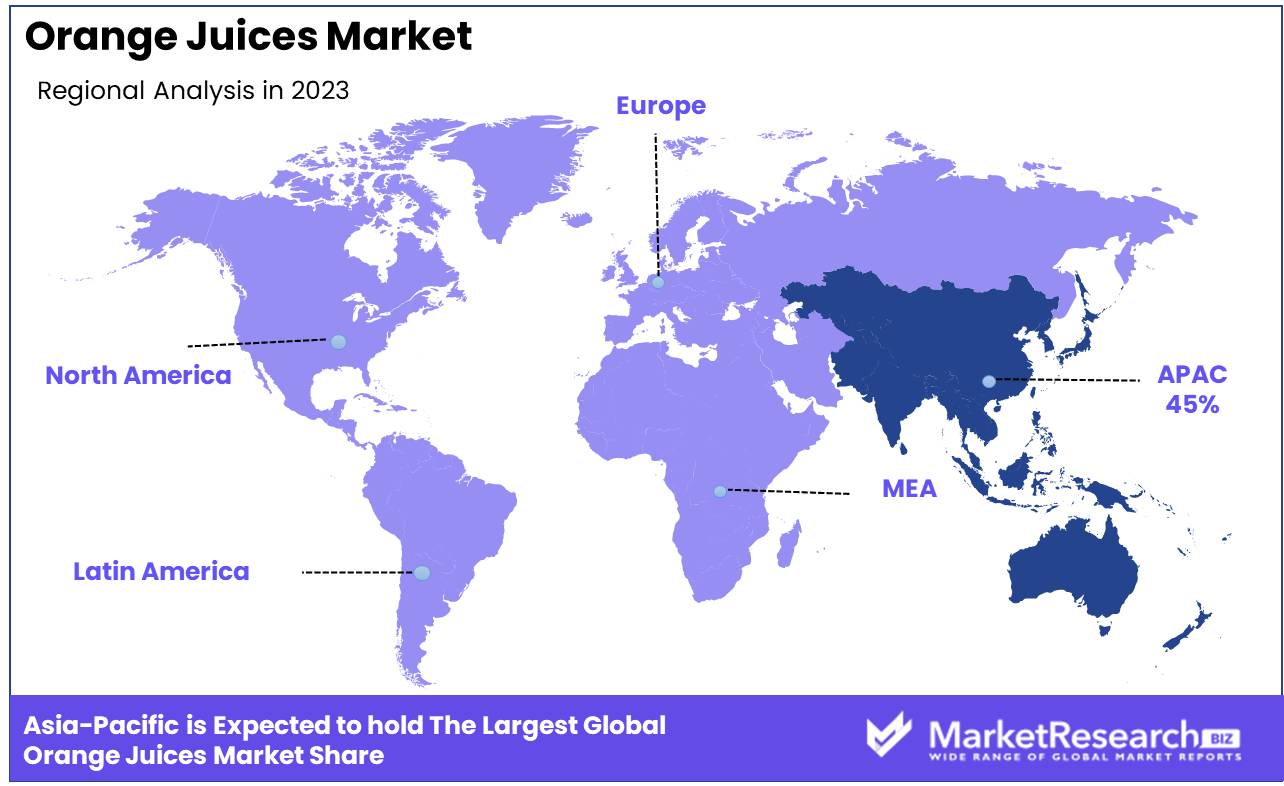
- Regional Dominance: Asia-Pacific holds a 45% market share, driven by rising health awareness and demand for fresh beverages.
- Growth Opportunity: Introducing fortified orange juices with added vitamins and minerals can appeal to health-conscious consumers and boost market growth.
Driving factors
Growing Consumer Demand for Healthy and Natural Beverages
The global Orange Juices Market is significantly driven by the growing consumer demand for healthy and natural beverages. As consumers become increasingly health-conscious, they are shifting away from sugary sodas and artificially flavored energy drinks towards more nutritious options. Orange juice, with its natural sweetness and absence of artificial additives, fits perfectly into this trend.
The rising preference for beverages that offer health benefits is propelling the market for orange juices. This trend is supported by the increasing availability of organic and preservative-free orange juice products, catering to the demand for clean label and natural health products.
Increasing Awareness of the Nutritional Benefits of Orange Juice
The increasing awareness of the nutritional benefits of orange juice is another pivotal factor contributing to the market’s growth. Orange juice is rich in essential nutrients such as vitamin C, potassium, and antioxidants, which are known to boost immune function, improve skin health, and support overall well-being.
This awareness has been bolstered by public health campaigns and educational initiatives emphasizing the importance of a balanced diet and the role of fruits and fruit juices in maintaining health. As consumers become more informed about the health benefits of orange juice, its consumption is expected to rise, driving market growth.
Expansion in Ready-to-Drink Beverage Options
The expansion in ready-to-drink (RTD) beverage options is a significant driver of the Orange Juices Market. The modern, fast-paced lifestyle has led to an increased demand for convenient food and beverage options. Ready-to-drink orange juice products offer a quick and easy way for consumers to enjoy the benefits of orange juice without the need for preparation.
This convenience, combined with innovations in packaging and product variety, has made RTD orange juices highly appealing. The market is seeing a surge in single-serve and portable packaging formats, catering to on-the-go consumers and enhancing the product's accessibility.
Restraining Factors
High Cost of Production and Fluctuating Orange Prices
One of the primary restraining factors for the Orange Juices Market is the high cost of production and the fluctuating prices of oranges. The cultivation of oranges involves significant investment in terms of land, labor, water, and agricultural inputs. Additionally, the process of extracting and packaging orange juice is capital-intensive. These high production costs can be a barrier to market entry and expansion for many producers.
The price of oranges is subject to volatility due to factors such as weather conditions, diseases affecting orange crops, and changes in agricultural policies. For instance, adverse weather events like droughts or hurricanes can drastically reduce orange yields, leading to higher prices for raw materials. This volatility in orange prices can squeeze profit margins for juice producers and make it challenging to maintain consistent pricing for consumers. The uncertainty surrounding production costs and orange prices can deter investment and growth in the market.
Competition from Other Fruit Juices and Beverages
The Orange Juices Market also faces significant competition from other fruit juices and beverages. Consumers have a wide array of choices when it comes to beverages, including apple juice, grape juice, berry blends, and various non-juice options like flavored water, energy drinks, and plant-based beverages. This competition is intensified by the continuous innovation and marketing efforts by producers of alternative beverages, which often highlight unique health benefits, exotic flavors, or lower sugar content compared to orange juice.
This competitive landscape can limit the growth prospects for orange juice as it vies for shelf space and consumer attention. Brands must continuously innovate and differentiate their products to maintain market share, which can be both costly and challenging. The presence of numerous alternatives means that even slight shifts in consumer preferences or trends can impact the demand for orange juice.
By Processing Type Analysis
Not-From-Concentrate Juice (NFC) held a dominant market position in the By Processing Type segment of the Orange Juices Market, capturing more than a 40% share.
In 2023, Not-From-Concentrate Juice (NFC) held a dominant market position in the By Processing Type segment of the Orange Juices Market, capturing more than a 40% share. NFC juice is preferred by consumers for its perceived freshness and higher quality compared to other processing types. It is minimally processed and often marketed as a premium product, which appeals to health-conscious consumers seeking natural and less processed beverages.
Frozen Concentrated Orange Juice (FCOJ), although historically significant, has seen a decline in preference as consumers shift towards more convenient and fresh-tasting options. FCOJ is still popular in regions with limited access to fresh juice and is valued for its longer shelf life and cost-effectiveness.
Refrigerated Orange Juice from Concentrate (RECON) offers a balance between freshness and shelf stability, catering to consumers looking for a mid-range option. Nectar is less common but caters to specific market segments that prefer a thicker and sweeter beverage.
By Packaging Analysis
Cartons held a dominant market position in the By Packaging segment of the Orange Juices Market, capturing more than a 45% share.
In 2023, Cartons held a dominant market position in the By Packaging segment of the Orange Juices Market, capturing more than a 45% share. Cartons are favored for their convenience, cost-effectiveness, and environmental benefits. They provide excellent protection for the juice, preserving its freshness and flavor while being lightweight and easy to transport. The recyclability of cartons also appeals to environmentally conscious consumers and companies aiming to reduce their carbon footprint.
Metal Cans are less popular due to their heavier weight and potential for flavor alteration over time. However, they offer durability and a long shelf life, making them suitable for specific markets and distribution needs.
PP Material Bottles (Polypropylene) are appreciated for their transparency, allowing consumers to see the product. They are also lightweight and shatter-resistant, making them a practical choice for both manufacturers and consumers.
Other Packaging includes glass bottles and innovative packaging solutions aimed at niche markets or specific consumer preferences.
By Distribution Channel Analysis
Supermarkets & Hypermarkets held a dominant market position in the By Distribution Channel segment of the Orange Juices Market, capturing more than a 30% share.
In 2023, Supermarkets & Hypermarkets held a dominant market position in the By Distribution Channel segment of the Orange Juices Market, capturing more than a 30% share. These large retail outlets offer a wide variety of products, making them a preferred shopping destination for consumers. Their ability to offer competitive prices and frequent promotions also drives higher sales volumes for orange juices. The extensive reach and convenience of supermarkets and hypermarkets make them a key distribution channel.
Food & Beverage Industry purchases orange juice in bulk for use in product formulations, catering, and food service operations, contributing significantly to the overall market.
Food Service Providers, including restaurants, cafes, and hotels, are crucial channels for orange juice distribution, especially for freshly prepared and NFC juices.
Convenience Stores cater to on-the-go consumers seeking quick and easy access to beverages. Their smaller footprint and extended hours make them a convenient choice for purchasing orange juice.
Specialty Food Stores focus on high-quality and unique products, attracting health-conscious and discerning consumers.
Online Retail is rapidly growing as a distribution channel, driven by the increasing adoption of e-commerce and consumer preference for home delivery. Online platforms offer a broad range of products and brands, making them an attractive option for busy consumers.
Key Market Segments
By Processing Type
- Frozen Concentrated Orange Juice (FCOJ)
- Not-From-Concentrate Juice (NFC)
- Refrigerated Orange Juice from Concentrate (RECON)
- Nectar
By Packaging
- Cartons
- Metal Can
- PP Material Bottle
- Other Packaging
By Distribution Channel
- Food & Beverage Industry
- Food Service Provider
- Supermarkets & Hypermarkets
- Convenience Stores
- Specialty Food Stores
- Online Retail
Growth Opportunity
Growth Potential in Organic and Fortified Orange Juice Products
In 2024, the global Orange Juices Market is poised to capitalize on the development of organic and fortified orange juice products. With a rising consumer preference for organic foods and beverages, orange juice producers have a significant opportunity to expand their product lines to include organic variants. Organic orange juice appeals to health-conscious consumers who prioritize products free from pesticides and synthetic additives.
The market for fortified orange juice—enriched with vitamins, minerals, and other nutrients—offers further growth potential. These fortified products cater to consumers seeking added health benefits, such as enhanced immunity and better overall nutrition, making them attractive in the competitive beverage market.
Expansion in Emerging Markets Driving Market Growth
The expansion in emerging markets presents a lucrative opportunity for the Orange Juices Market in 2024. Regions such as Asia-Pacific, Latin America, and Africa are experiencing economic growth, urbanization, and increasing disposable incomes, which drive the demand for convenient and nutritious beverages.
As lifestyles become more fast-paced and health awareness rises in these regions, the consumption of orange juice is expected to increase. Companies that invest in distribution networks and localized marketing strategies in these emerging markets can tap into a growing consumer base, thus driving market expansion. The rising middle class and younger demographics in these regions also provide a fertile ground for introducing new and innovative orange juice products.
Latest Trends
Adoption of Sustainable and Eco-Friendly Packaging
In 2024, the global Orange Juices Market is expected to witness a significant trend towards the use of sustainable and eco-friendly packaging. As environmental concerns become increasingly prominent, consumers are demanding more sustainable solutions from their favorite brands. Orange juice producers are responding by adopting packaging materials that are recyclable, biodegradable, or made from renewable resources.
This shift not only helps reduce the environmental footprint but also aligns with the values of eco-conscious consumers. Brands that prioritize sustainable packaging are likely to enhance their market appeal and gain a competitive edge. The use of eco-friendly packaging is also beneficial in meeting regulatory requirements and corporate sustainability goals, further driving its adoption in the industry.
Introduction of New Flavors and Blends
Another notable trend in the Orange Juices Market for 2024 is the introduction of new flavors and blends. As consumers seek variety and unique taste experiences, orange juice producers are innovating with creative combinations and flavor infusions. Blends that incorporate other fruits such as mango, pineapple, or berries, as well as botanical ingredients like ginger or turmeric, are gaining popularity.
These innovative products cater to diverse consumer preferences and create opportunities for premium pricing. Additionally, the introduction of exotic and seasonal flavors helps in attracting adventurous consumers and maintaining their interest in the category.
Regional Analysis
Asia-Pacific led the Orange Juices Market in 2023, capturing a 45% share.
In 2023, the Asia-Pacific region led the Orange Juices Market, capturing a 45% share. The high demand for orange juice in countries like China, India, and Japan drives market growth. Increasing health consciousness, rising disposable incomes, and the growing popularity of fruit juices as a healthy beverage choice contribute to the market's dominance in this region. Additionally, the expansion of distribution networks and the availability of a wide variety of orange juice products further support market growth.
North America is a significant market, with the U.S. being one of the largest consumers of orange juice. The region benefits from a strong focus on health and wellness, along with a well-established beverage industry that promotes the consumption of fruit juices.
Europe follows closely, with countries like Germany, the UK, and France leading in orange juice consumption. The region's high health awareness and preference for natural and organic beverages drive the demand for orange juice.
In the Middle East & Africa, the orange juice market is emerging, with increasing consumer awareness of the health benefits of fruit juices. The UAE and South Africa are notable markets, driven by rising disposable incomes and growing demand for healthy beverages.
Latin America is witnessing steady growth, with Brazil and Mexico being key markets. Brazil, as one of the largest producers of oranges, contributes significantly to the supply side, while rising health consciousness among consumers supports market growth.
Key Regions and Countries
North America
- US
- Canada
- Mexico
Western Europe
- Germany
- France
- The UK
- Spain
- Italy
- Portugal
- Ireland
- Austria
- Switzerland
- Benelux
- Nordic
- Rest of Western Europe
Eastern Europe
- Russia
- Poland
- The Czech Republic
- Greece
- Rest of Eastern Europe
APAC
- China
- Japan
- South Korea
- India
- Australia & New Zealand
- Indonesia
- Malaysia
- Philippines
- Singapore
- Thailand
- Vietnam
- Rest of APAC
Latin America
- Brazil
- Colombia
- Chile
- Argentina
- Costa Rica
- Rest of Latin America
Middle East & Africa
- Algeria
- Egypt
- Israel
- Kuwait
- Nigeria
- Saudi Arabia
- South Africa
- Turkey
- United Arab Emirates
- Rest of MEA
Key Players Analysis
In 2024, the global orange juice market is shaped by consumer preferences for natural and healthy beverages, driving demand for high-quality products. Astral Foods and Campofrio Food Group are significant players, known for their extensive distribution networks and commitment to sourcing high-quality oranges. Their focus on sustainability and natural ingredients resonates with health-conscious consumers.
Cargill Incorporated plays a crucial role in the supply chain, providing ingredients and food processing solutions that enhance the quality and shelf-life of orange juice products. Their expertise in agricultural supply chains ensures consistent quality and supply, supporting the market's growth. Bar-S Foods and Carolina Packers Inc. also contribute to the market with their focus on innovative packaging and value-added products, appealing to a broad consumer base.
The orange juice market in 2024 is driven by trends towards organic and minimally processed beverages. Companies are increasingly investing in sustainable sourcing and production practices to meet consumer demand for ethical and environmentally friendly products. The market's growth is further supported by the introduction of new flavors and fortified products, catering to diverse consumer preferences.
Key players continue to innovate in product development and marketing strategies, emphasizing health benefits and quality. The orange juice market remains competitive, with companies striving to differentiate themselves through superior product quality, sustainable practices, and effective supply chain management, ensuring steady growth and consumer loyalty.
Market Key Players
- Astral Foods
- Bar-S Foods
- Campofrio Food Group
- Cargill
- Incorporated
- Carolina Packers Inc
Recent Development
- In May 2024, Astral Foods invested $15 million in upgrading their juice production facilities to enhance efficiency and meet growing demand. This investment aims to improve production capacity by 25%.
- In January 2024, Cargill, Incorporated launched a new line of organic orange juices. This launch aims to cater to health-conscious consumers and increase market share by 10%.
Report Scope
Report Features Description Market Value (2023) USD 30.4 Bn Forecast Revenue (2033) USD 38.3 Bn CAGR (2024-2033) 2.4% Base Year for Estimation 2023 Historic Period 2018-2023 Forecast Period 2024-2033 Report Coverage Revenue Forecast, Market Dynamics, Competitive Landscape, Recent Developments Segments Covered By Processing Type (Frozen Concentrated Orange Juice (FCOJ), Not-From-Concentrate Juice (NFC), Refrigerated Orange Juice from Concentrate (RECON), Nectar), By Packaging (Cartons, Metal Can, PP Material Bottle, Other Packaging), By Distribution Channel (Food & Beverage Industry, Food Service Provider, Supermarkets & Hypermarkets, Convenience Stores, Specialty Food Stores, Online Retail) Regional Analysis North America - The US, Canada, & Mexico; Western Europe - Germany, France, The UK, Spain, Italy, Portugal, Ireland, Austria, Switzerland, Benelux, Nordic, & Rest of Western Europe; Eastern Europe - Russia, Poland, The Czech Republic, Greece, & Rest of Eastern Europe; APAC - China, Japan, South Korea, India, Australia & New Zealand, Indonesia, Malaysia, Philippines, Singapore, Thailand, Vietnam, & Rest of APAC; Latin America - Brazil, Colombia, Chile, Argentina, Costa Rica, & Rest of Latin America; Middle East & Africa - Algeria, Egypt, Israel, Kuwait, Nigeria, Saudi Arabia, South Africa, Turkey, United Arab Emirates, & Rest of MEA Competitive Landscape Astral Foods, Bar-S Foods, Campofrio Food Group, Cargill, Incorporated, Carolina Packers Inc Customization Scope Customization for segments, region/country-level will be provided. Moreover, additional customization can be done based on the requirements. Purchase Options We have three licenses to opt for: Single User License, Multi-User License (Up to 5 Users), Corporate Use License (Unlimited User and Printable PDF) -
- 1. Executive Summary
- 1.1. Definition
- 1.2. Taxonomy
- 1.3. Research Scope
- 1.4. Key Analysis
- 1.5. Key Findings by Major Segments
- 1.6. Top strategies by Major Players
- 2. Global Orange Juices Market Overview
- 2.1. Orange Juices Market Dynamics
- 2.1.1. Drivers
- 2.1.2. Opportunities
- 2.1.3. Restraints
- 2.1.4. Challenges
- 2.2. Macro-economic Factors
- 2.3. Regulatory Framework
- 2.4. Market Investment Feasibility Index
- 2.5. PEST Analysis
- 2.6. PORTER’S Five Force Analysis
- 2.7. Drivers & Restraints Impact Analysis
- 2.8. Industry Chain Analysis
- 2.9. Cost Structure Analysis
- 2.10. Marketing Strategy
- 2.11. Russia-Ukraine War Impact Analysis
- 2.12. Opportunity Map Analysis
- 2.13. Market Competition Scenario Analysis
- 2.14. Product Life Cycle Analysis
- 2.15. Opportunity Orbits
- 2.16. Manufacturer Intensity Map
- 2.17. Major Companies sales by Value & Volume
- 2.1. Orange Juices Market Dynamics
- 3. Global Orange Juices Market Analysis, Opportunity and Forecast, 2016-2032
- 3.1. Global Orange Juices Market Analysis, 2016-2021
- 3.2. Global Orange Juices Market Opportunity and Forecast, 2023-2032
- 3.3. Global Orange Juices Market Analysis, Opportunity and Forecast, By By Processing Type, 2016-2032
- 3.3.1. Global Orange Juices Market Analysis by By Processing Type: Introduction
- 3.3.2. Market Size Absolute $ Opportunity Analysis and Forecast, By By Processing Type, 2016-2032
- 3.3.3. Frozen Concentrated Orange Juice (FCOJ)
- 3.3.4. Not-From-Concentrate Juice (NFC)
- 3.3.5. Refrigerated Orange Juice from Concentrate (RECON)
- 3.3.6. Nectar
- 3.4. Global Orange Juices Market Analysis, Opportunity and Forecast, By By Packaging, 2016-2032
- 3.4.1. Global Orange Juices Market Analysis by By Packaging: Introduction
- 3.4.2. Market Size Absolute $ Opportunity Analysis and Forecast, By By Packaging, 2016-2032
- 3.4.3. Cartons
- 3.4.4. Metal Can
- 3.4.5. PP Material Bottle
- 3.4.6. Other Packaging
- 3.5. Global Orange Juices Market Analysis, Opportunity and Forecast, By By Distribution Channel, 2016-2032
- 3.5.1. Global Orange Juices Market Analysis by By Distribution Channel: Introduction
- 3.5.2. Market Size Absolute $ Opportunity Analysis and Forecast, By By Distribution Channel, 2016-2032
- 3.5.3. Food & Beverage Industry
- 3.5.4. Food Service Provider
- 3.5.5. Supermarkets & Hypermarkets
- 3.5.6. Convenience Stores
- 3.5.7. Specialty Food Stores
- 3.5.8. Online Retail
- 4. North America Orange Juices Market Analysis, Opportunity and Forecast, 2016-2032
- 4.1. North America Orange Juices Market Analysis, 2016-2021
- 4.2. North America Orange Juices Market Opportunity and Forecast, 2023-2032
- 4.3. North America Orange Juices Market Analysis, Opportunity and Forecast, By By Processing Type, 2016-2032
- 4.3.1. North America Orange Juices Market Analysis by By Processing Type: Introduction
- 4.3.2. Market Size Absolute $ Opportunity Analysis and Forecast, By By Processing Type, 2016-2032
- 4.3.3. Frozen Concentrated Orange Juice (FCOJ)
- 4.3.4. Not-From-Concentrate Juice (NFC)
- 4.3.5. Refrigerated Orange Juice from Concentrate (RECON)
- 4.3.6. Nectar
- 4.4. North America Orange Juices Market Analysis, Opportunity and Forecast, By By Packaging, 2016-2032
- 4.4.1. North America Orange Juices Market Analysis by By Packaging: Introduction
- 4.4.2. Market Size Absolute $ Opportunity Analysis and Forecast, By By Packaging, 2016-2032
- 4.4.3. Cartons
- 4.4.4. Metal Can
- 4.4.5. PP Material Bottle
- 4.4.6. Other Packaging
- 4.5. North America Orange Juices Market Analysis, Opportunity and Forecast, By By Distribution Channel, 2016-2032
- 4.5.1. North America Orange Juices Market Analysis by By Distribution Channel: Introduction
- 4.5.2. Market Size Absolute $ Opportunity Analysis and Forecast, By By Distribution Channel, 2016-2032
- 4.5.3. Food & Beverage Industry
- 4.5.4. Food Service Provider
- 4.5.5. Supermarkets & Hypermarkets
- 4.5.6. Convenience Stores
- 4.5.7. Specialty Food Stores
- 4.5.8. Online Retail
- 4.6. North America Orange Juices Market Analysis, Opportunity and Forecast, By Country , 2016-2032
- 4.6.1. North America Orange Juices Market Analysis by Country : Introduction
- 4.6.2. Market Size Absolute $ Opportunity Analysis and Forecast, Country , 2016-2032
- 4.6.2.1. The US
- 4.6.2.2. Canada
- 4.6.2.3. Mexico
- 5. Western Europe Orange Juices Market Analysis, Opportunity and Forecast, 2016-2032
- 5.1. Western Europe Orange Juices Market Analysis, 2016-2021
- 5.2. Western Europe Orange Juices Market Opportunity and Forecast, 2023-2032
- 5.3. Western Europe Orange Juices Market Analysis, Opportunity and Forecast, By By Processing Type, 2016-2032
- 5.3.1. Western Europe Orange Juices Market Analysis by By Processing Type: Introduction
- 5.3.2. Market Size Absolute $ Opportunity Analysis and Forecast, By By Processing Type, 2016-2032
- 5.3.3. Frozen Concentrated Orange Juice (FCOJ)
- 5.3.4. Not-From-Concentrate Juice (NFC)
- 5.3.5. Refrigerated Orange Juice from Concentrate (RECON)
- 5.3.6. Nectar
- 5.4. Western Europe Orange Juices Market Analysis, Opportunity and Forecast, By By Packaging, 2016-2032
- 5.4.1. Western Europe Orange Juices Market Analysis by By Packaging: Introduction
- 5.4.2. Market Size Absolute $ Opportunity Analysis and Forecast, By By Packaging, 2016-2032
- 5.4.3. Cartons
- 5.4.4. Metal Can
- 5.4.5. PP Material Bottle
- 5.4.6. Other Packaging
- 5.5. Western Europe Orange Juices Market Analysis, Opportunity and Forecast, By By Distribution Channel, 2016-2032
- 5.5.1. Western Europe Orange Juices Market Analysis by By Distribution Channel: Introduction
- 5.5.2. Market Size Absolute $ Opportunity Analysis and Forecast, By By Distribution Channel, 2016-2032
- 5.5.3. Food & Beverage Industry
- 5.5.4. Food Service Provider
- 5.5.5. Supermarkets & Hypermarkets
- 5.5.6. Convenience Stores
- 5.5.7. Specialty Food Stores
- 5.5.8. Online Retail
- 5.6. Western Europe Orange Juices Market Analysis, Opportunity and Forecast, By Country , 2016-2032
- 5.6.1. Western Europe Orange Juices Market Analysis by Country : Introduction
- 5.6.2. Market Size Absolute $ Opportunity Analysis and Forecast, Country , 2016-2032
- 5.6.2.1. Germany
- 5.6.2.2. France
- 5.6.2.3. The UK
- 5.6.2.4. Spain
- 5.6.2.5. Italy
- 5.6.2.6. Portugal
- 5.6.2.7. Ireland
- 5.6.2.8. Austria
- 5.6.2.9. Switzerland
- 5.6.2.10. Benelux
- 5.6.2.11. Nordic
- 5.6.2.12. Rest of Western Europe
- 6. Eastern Europe Orange Juices Market Analysis, Opportunity and Forecast, 2016-2032
- 6.1. Eastern Europe Orange Juices Market Analysis, 2016-2021
- 6.2. Eastern Europe Orange Juices Market Opportunity and Forecast, 2023-2032
- 6.3. Eastern Europe Orange Juices Market Analysis, Opportunity and Forecast, By By Processing Type, 2016-2032
- 6.3.1. Eastern Europe Orange Juices Market Analysis by By Processing Type: Introduction
- 6.3.2. Market Size Absolute $ Opportunity Analysis and Forecast, By By Processing Type, 2016-2032
- 6.3.3. Frozen Concentrated Orange Juice (FCOJ)
- 6.3.4. Not-From-Concentrate Juice (NFC)
- 6.3.5. Refrigerated Orange Juice from Concentrate (RECON)
- 6.3.6. Nectar
- 6.4. Eastern Europe Orange Juices Market Analysis, Opportunity and Forecast, By By Packaging, 2016-2032
- 6.4.1. Eastern Europe Orange Juices Market Analysis by By Packaging: Introduction
- 6.4.2. Market Size Absolute $ Opportunity Analysis and Forecast, By By Packaging, 2016-2032
- 6.4.3. Cartons
- 6.4.4. Metal Can
- 6.4.5. PP Material Bottle
- 6.4.6. Other Packaging
- 6.5. Eastern Europe Orange Juices Market Analysis, Opportunity and Forecast, By By Distribution Channel, 2016-2032
- 6.5.1. Eastern Europe Orange Juices Market Analysis by By Distribution Channel: Introduction
- 6.5.2. Market Size Absolute $ Opportunity Analysis and Forecast, By By Distribution Channel, 2016-2032
- 6.5.3. Food & Beverage Industry
- 6.5.4. Food Service Provider
- 6.5.5. Supermarkets & Hypermarkets
- 6.5.6. Convenience Stores
- 6.5.7. Specialty Food Stores
- 6.5.8. Online Retail
- 6.6. Eastern Europe Orange Juices Market Analysis, Opportunity and Forecast, By Country , 2016-2032
- 6.6.1. Eastern Europe Orange Juices Market Analysis by Country : Introduction
- 6.6.2. Market Size Absolute $ Opportunity Analysis and Forecast, Country , 2016-2032
- 6.6.2.1. Russia
- 6.6.2.2. Poland
- 6.6.2.3. The Czech Republic
- 6.6.2.4. Greece
- 6.6.2.5. Rest of Eastern Europe
- 7. APAC Orange Juices Market Analysis, Opportunity and Forecast, 2016-2032
- 7.1. APAC Orange Juices Market Analysis, 2016-2021
- 7.2. APAC Orange Juices Market Opportunity and Forecast, 2023-2032
- 7.3. APAC Orange Juices Market Analysis, Opportunity and Forecast, By By Processing Type, 2016-2032
- 7.3.1. APAC Orange Juices Market Analysis by By Processing Type: Introduction
- 7.3.2. Market Size Absolute $ Opportunity Analysis and Forecast, By By Processing Type, 2016-2032
- 7.3.3. Frozen Concentrated Orange Juice (FCOJ)
- 7.3.4. Not-From-Concentrate Juice (NFC)
- 7.3.5. Refrigerated Orange Juice from Concentrate (RECON)
- 7.3.6. Nectar
- 7.4. APAC Orange Juices Market Analysis, Opportunity and Forecast, By By Packaging, 2016-2032
- 7.4.1. APAC Orange Juices Market Analysis by By Packaging: Introduction
- 7.4.2. Market Size Absolute $ Opportunity Analysis and Forecast, By By Packaging, 2016-2032
- 7.4.3. Cartons
- 7.4.4. Metal Can
- 7.4.5. PP Material Bottle
- 7.4.6. Other Packaging
- 7.5. APAC Orange Juices Market Analysis, Opportunity and Forecast, By By Distribution Channel, 2016-2032
- 7.5.1. APAC Orange Juices Market Analysis by By Distribution Channel: Introduction
- 7.5.2. Market Size Absolute $ Opportunity Analysis and Forecast, By By Distribution Channel, 2016-2032
- 7.5.3. Food & Beverage Industry
- 7.5.4. Food Service Provider
- 7.5.5. Supermarkets & Hypermarkets
- 7.5.6. Convenience Stores
- 7.5.7. Specialty Food Stores
- 7.5.8. Online Retail
- 7.6. APAC Orange Juices Market Analysis, Opportunity and Forecast, By Country , 2016-2032
- 7.6.1. APAC Orange Juices Market Analysis by Country : Introduction
- 7.6.2. Market Size Absolute $ Opportunity Analysis and Forecast, Country , 2016-2032
- 7.6.2.1. China
- 7.6.2.2. Japan
- 7.6.2.3. South Korea
- 7.6.2.4. India
- 7.6.2.5. Australia & New Zeland
- 7.6.2.6. Indonesia
- 7.6.2.7. Malaysia
- 7.6.2.8. Philippines
- 7.6.2.9. Singapore
- 7.6.2.10. Thailand
- 7.6.2.11. Vietnam
- 7.6.2.12. Rest of APAC
- 8. Latin America Orange Juices Market Analysis, Opportunity and Forecast, 2016-2032
- 8.1. Latin America Orange Juices Market Analysis, 2016-2021
- 8.2. Latin America Orange Juices Market Opportunity and Forecast, 2023-2032
- 8.3. Latin America Orange Juices Market Analysis, Opportunity and Forecast, By By Processing Type, 2016-2032
- 8.3.1. Latin America Orange Juices Market Analysis by By Processing Type: Introduction
- 8.3.2. Market Size Absolute $ Opportunity Analysis and Forecast, By By Processing Type, 2016-2032
- 8.3.3. Frozen Concentrated Orange Juice (FCOJ)
- 8.3.4. Not-From-Concentrate Juice (NFC)
- 8.3.5. Refrigerated Orange Juice from Concentrate (RECON)
- 8.3.6. Nectar
- 8.4. Latin America Orange Juices Market Analysis, Opportunity and Forecast, By By Packaging, 2016-2032
- 8.4.1. Latin America Orange Juices Market Analysis by By Packaging: Introduction
- 8.4.2. Market Size Absolute $ Opportunity Analysis and Forecast, By By Packaging, 2016-2032
- 8.4.3. Cartons
- 8.4.4. Metal Can
- 8.4.5. PP Material Bottle
- 8.4.6. Other Packaging
- 8.5. Latin America Orange Juices Market Analysis, Opportunity and Forecast, By By Distribution Channel, 2016-2032
- 8.5.1. Latin America Orange Juices Market Analysis by By Distribution Channel: Introduction
- 8.5.2. Market Size Absolute $ Opportunity Analysis and Forecast, By By Distribution Channel, 2016-2032
- 8.5.3. Food & Beverage Industry
- 8.5.4. Food Service Provider
- 8.5.5. Supermarkets & Hypermarkets
- 8.5.6. Convenience Stores
- 8.5.7. Specialty Food Stores
- 8.5.8. Online Retail
- 8.6. Latin America Orange Juices Market Analysis, Opportunity and Forecast, By Country , 2016-2032
- 8.6.1. Latin America Orange Juices Market Analysis by Country : Introduction
- 8.6.2. Market Size Absolute $ Opportunity Analysis and Forecast, Country , 2016-2032
- 8.6.2.1. Brazil
- 8.6.2.2. Colombia
- 8.6.2.3. Chile
- 8.6.2.4. Argentina
- 8.6.2.5. Costa Rica
- 8.6.2.6. Rest of Latin America
- 9. Middle East & Africa Orange Juices Market Analysis, Opportunity and Forecast, 2016-2032
- 9.1. Middle East & Africa Orange Juices Market Analysis, 2016-2021
- 9.2. Middle East & Africa Orange Juices Market Opportunity and Forecast, 2023-2032
- 9.3. Middle East & Africa Orange Juices Market Analysis, Opportunity and Forecast, By By Processing Type, 2016-2032
- 9.3.1. Middle East & Africa Orange Juices Market Analysis by By Processing Type: Introduction
- 9.3.2. Market Size Absolute $ Opportunity Analysis and Forecast, By By Processing Type, 2016-2032
- 9.3.3. Frozen Concentrated Orange Juice (FCOJ)
- 9.3.4. Not-From-Concentrate Juice (NFC)
- 9.3.5. Refrigerated Orange Juice from Concentrate (RECON)
- 9.3.6. Nectar
- 9.4. Middle East & Africa Orange Juices Market Analysis, Opportunity and Forecast, By By Packaging, 2016-2032
- 9.4.1. Middle East & Africa Orange Juices Market Analysis by By Packaging: Introduction
- 9.4.2. Market Size Absolute $ Opportunity Analysis and Forecast, By By Packaging, 2016-2032
- 9.4.3. Cartons
- 9.4.4. Metal Can
- 9.4.5. PP Material Bottle
- 9.4.6. Other Packaging
- 9.5. Middle East & Africa Orange Juices Market Analysis, Opportunity and Forecast, By By Distribution Channel, 2016-2032
- 9.5.1. Middle East & Africa Orange Juices Market Analysis by By Distribution Channel: Introduction
- 9.5.2. Market Size Absolute $ Opportunity Analysis and Forecast, By By Distribution Channel, 2016-2032
- 9.5.3. Food & Beverage Industry
- 9.5.4. Food Service Provider
- 9.5.5. Supermarkets & Hypermarkets
- 9.5.6. Convenience Stores
- 9.5.7. Specialty Food Stores
- 9.5.8. Online Retail
- 9.6. Middle East & Africa Orange Juices Market Analysis, Opportunity and Forecast, By Country , 2016-2032
- 9.6.1. Middle East & Africa Orange Juices Market Analysis by Country : Introduction
- 9.6.2. Market Size Absolute $ Opportunity Analysis and Forecast, Country , 2016-2032
- 9.6.2.1. Algeria
- 9.6.2.2. Egypt
- 9.6.2.3. Israel
- 9.6.2.4. Kuwait
- 9.6.2.5. Nigeria
- 9.6.2.6. Saudi Arabia
- 9.6.2.7. South Africa
- 9.6.2.8. Turkey
- 9.6.2.9. The UAE
- 9.6.2.10. Rest of MEA
- 10. Global Orange Juices Market Analysis, Opportunity and Forecast, By Region , 2016-2032
- 10.1. Global Orange Juices Market Analysis by Region : Introduction
- 10.2. Market Size Absolute $ Opportunity Analysis and Forecast, By Region , 2016-2032
- 10.2.1. North America
- 10.2.2. Western Europe
- 10.2.3. Eastern Europe
- 10.2.4. APAC
- 10.2.5. Latin America
- 10.2.6. Middle East & Africa
- 11. Global Orange Juices Market Competitive Landscape, Market Share Analysis, and Company Profiles
- 11.1. Market Share Analysis
- 11.2. Company Profiles
- 11.3. Astral Foods
- 11.3.1. Company Overview
- 11.3.2. Financial Highlights
- 11.3.3. Product Portfolio
- 11.3.4. SWOT Analysis
- 11.3.5. Key Strategies and Developments
- 11.4. Bar-S Foods
- 11.4.1. Company Overview
- 11.4.2. Financial Highlights
- 11.4.3. Product Portfolio
- 11.4.4. SWOT Analysis
- 11.4.5. Key Strategies and Developments
- 11.5. Campofrio Food Group
- 11.5.1. Company Overview
- 11.5.2. Financial Highlights
- 11.5.3. Product Portfolio
- 11.5.4. SWOT Analysis
- 11.5.5. Key Strategies and Developments
- 11.6. Cargill
- 11.6.1. Company Overview
- 11.6.2. Financial Highlights
- 11.6.3. Product Portfolio
- 11.6.4. SWOT Analysis
- 11.6.5. Key Strategies and Developments
- 11.7. Incorporated
- 11.7.1. Company Overview
- 11.7.2. Financial Highlights
- 11.7.3. Product Portfolio
- 11.7.4. SWOT Analysis
- 11.7.5. Key Strategies and Developments
- 11.8. Carolina Packers Inc
- 11.8.1. Company Overview
- 11.8.2. Financial Highlights
- 11.8.3. Product Portfolio
- 11.8.4. SWOT Analysis
- 11.8.5. Key Strategies and Developments
- 12. Assumptions and Acronyms
- 13. Research Methodology
- 14. Contact
- List of Figures
- Figure 1: Global Orange Juices Market Revenue (US$ Mn) Market Share by By Processing Type in 2022
- Figure 2: Global Orange JuicesMarket Attractiveness Analysis by By Processing Type, 2016-2032
- Figure 3: Global Orange Juices Market Revenue (US$ Mn) Market Share by By Packagingin 2022
- Figure 4: Global Orange JuicesMarket Attractiveness Analysis by By Packaging, 2016-2032
- Figure 5: Global Orange Juices Market Revenue (US$ Mn) Market Share by By Distribution Channelin 2022
- Figure 6: Global Orange JuicesMarket Attractiveness Analysis by By Distribution Channel, 2016-2032
- Figure 7: Global Orange Juices Market Revenue (US$ Mn) Market Share by Region in 2022
- Figure 8: Global Orange JuicesMarket Attractiveness Analysis by Region, 2016-2032
- Figure 9: Global Orange JuicesMarket Revenue (US$ Mn) (2016-2032)
- Figure 10: Global Orange JuicesMarket Revenue (US$ Mn) Comparison by Region (2016-2032)
- Figure 11: Global Orange JuicesMarket Revenue (US$ Mn) Comparison by By Processing Type (2016-2032)
- Figure 12: Global Orange JuicesMarket Revenue (US$ Mn) Comparison by By Packaging (2016-2032)
- Figure 13: Global Orange JuicesMarket Revenue (US$ Mn) Comparison by By Distribution Channel (2016-2032)
- Figure 14: Global Orange JuicesMarket Y-o-Y Growth Rate Comparison by Region (2016-2032)
- Figure 15: Global Orange JuicesMarket Y-o-Y Growth Rate Comparison by By Processing Type (2016-2032)
- Figure 16: Global Orange JuicesMarket Y-o-Y Growth Rate Comparison by By Packaging (2016-2032)
- Figure 17: Global Orange JuicesMarket Y-o-Y Growth Rate Comparison by By Distribution Channel (2016-2032)
- Figure 18: Global Orange JuicesMarket Share Comparison by Region (2016-2032)
- Figure 19: Global Orange JuicesMarket Share Comparison by By Processing Type (2016-2032)
- Figure 20: Global Orange JuicesMarket Share Comparison by By Packaging (2016-2032)
- Figure 21: Global Orange JuicesMarket Share Comparison by By Distribution Channel (2016-2032)
- Figure 22: North America Orange Juices Market Revenue (US$ Mn) Market Share by By Processing Typein 2022
- Figure 23: North America Orange JuicesMarket Attractiveness Analysis by By Processing Type, 2016-2032
- Figure 24: North America Orange Juices Market Revenue (US$ Mn) Market Share by By Packagingin 2022
- Figure 25: North America Orange JuicesMarket Attractiveness Analysis by By Packaging, 2016-2032
- Figure 26: North America Orange Juices Market Revenue (US$ Mn) Market Share by By Distribution Channelin 2022
- Figure 27: North America Orange JuicesMarket Attractiveness Analysis by By Distribution Channel, 2016-2032
- Figure 28: North America Orange Juices Market Revenue (US$ Mn) Market Share by Country in 2022
- Figure 29: North America Orange JuicesMarket Attractiveness Analysis by Country, 2016-2032
- Figure 30: North America Orange JuicesMarket Revenue (US$ Mn) (2016-2032)
- Figure 31: North America Orange JuicesMarket Revenue (US$ Mn) Comparison by Country (2016-2032)
- Figure 32: North America Orange JuicesMarket Revenue (US$ Mn) Comparison by By Processing Type (2016-2032)
- Figure 33: North America Orange JuicesMarket Revenue (US$ Mn) Comparison by By Packaging (2016-2032)
- Figure 34: North America Orange JuicesMarket Revenue (US$ Mn) Comparison by By Distribution Channel (2016-2032)
- Figure 35: North America Orange JuicesMarket Y-o-Y Growth Rate Comparison by Country (2016-2032)
- Figure 36: North America Orange JuicesMarket Y-o-Y Growth Rate Comparison by By Processing Type (2016-2032)
- Figure 37: North America Orange JuicesMarket Y-o-Y Growth Rate Comparison by By Packaging (2016-2032)
- Figure 38: North America Orange JuicesMarket Y-o-Y Growth Rate Comparison by By Distribution Channel (2016-2032)
- Figure 39: North America Orange JuicesMarket Share Comparison by Country (2016-2032)
- Figure 40: North America Orange JuicesMarket Share Comparison by By Processing Type (2016-2032)
- Figure 41: North America Orange JuicesMarket Share Comparison by By Packaging (2016-2032)
- Figure 42: North America Orange JuicesMarket Share Comparison by By Distribution Channel (2016-2032)
- Figure 43: Western Europe Orange Juices Market Revenue (US$ Mn) Market Share by By Processing Typein 2022
- Figure 44: Western Europe Orange JuicesMarket Attractiveness Analysis by By Processing Type, 2016-2032
- Figure 45: Western Europe Orange Juices Market Revenue (US$ Mn) Market Share by By Packagingin 2022
- Figure 46: Western Europe Orange JuicesMarket Attractiveness Analysis by By Packaging, 2016-2032
- Figure 47: Western Europe Orange Juices Market Revenue (US$ Mn) Market Share by By Distribution Channelin 2022
- Figure 48: Western Europe Orange JuicesMarket Attractiveness Analysis by By Distribution Channel, 2016-2032
- Figure 49: Western Europe Orange Juices Market Revenue (US$ Mn) Market Share by Country in 2022
- Figure 50: Western Europe Orange JuicesMarket Attractiveness Analysis by Country, 2016-2032
- Figure 51: Western Europe Orange JuicesMarket Revenue (US$ Mn) (2016-2032)
- Figure 52: Western Europe Orange JuicesMarket Revenue (US$ Mn) Comparison by Country (2016-2032)
- Figure 53: Western Europe Orange JuicesMarket Revenue (US$ Mn) Comparison by By Processing Type (2016-2032)
- Figure 54: Western Europe Orange JuicesMarket Revenue (US$ Mn) Comparison by By Packaging (2016-2032)
- Figure 55: Western Europe Orange JuicesMarket Revenue (US$ Mn) Comparison by By Distribution Channel (2016-2032)
- Figure 56: Western Europe Orange JuicesMarket Y-o-Y Growth Rate Comparison by Country (2016-2032)
- Figure 57: Western Europe Orange JuicesMarket Y-o-Y Growth Rate Comparison by By Processing Type (2016-2032)
- Figure 58: Western Europe Orange JuicesMarket Y-o-Y Growth Rate Comparison by By Packaging (2016-2032)
- Figure 59: Western Europe Orange JuicesMarket Y-o-Y Growth Rate Comparison by By Distribution Channel (2016-2032)
- Figure 60: Western Europe Orange JuicesMarket Share Comparison by Country (2016-2032)
- Figure 61: Western Europe Orange JuicesMarket Share Comparison by By Processing Type (2016-2032)
- Figure 62: Western Europe Orange JuicesMarket Share Comparison by By Packaging (2016-2032)
- Figure 63: Western Europe Orange JuicesMarket Share Comparison by By Distribution Channel (2016-2032)
- Figure 64: Eastern Europe Orange Juices Market Revenue (US$ Mn) Market Share by By Processing Typein 2022
- Figure 65: Eastern Europe Orange JuicesMarket Attractiveness Analysis by By Processing Type, 2016-2032
- Figure 66: Eastern Europe Orange Juices Market Revenue (US$ Mn) Market Share by By Packagingin 2022
- Figure 67: Eastern Europe Orange JuicesMarket Attractiveness Analysis by By Packaging, 2016-2032
- Figure 68: Eastern Europe Orange Juices Market Revenue (US$ Mn) Market Share by By Distribution Channelin 2022
- Figure 69: Eastern Europe Orange JuicesMarket Attractiveness Analysis by By Distribution Channel, 2016-2032
- Figure 70: Eastern Europe Orange Juices Market Revenue (US$ Mn) Market Share by Country in 2022
- Figure 71: Eastern Europe Orange JuicesMarket Attractiveness Analysis by Country, 2016-2032
- Figure 72: Eastern Europe Orange JuicesMarket Revenue (US$ Mn) (2016-2032)
- Figure 73: Eastern Europe Orange JuicesMarket Revenue (US$ Mn) Comparison by Country (2016-2032)
- Figure 74: Eastern Europe Orange JuicesMarket Revenue (US$ Mn) Comparison by By Processing Type (2016-2032)
- Figure 75: Eastern Europe Orange JuicesMarket Revenue (US$ Mn) Comparison by By Packaging (2016-2032)
- Figure 76: Eastern Europe Orange JuicesMarket Revenue (US$ Mn) Comparison by By Distribution Channel (2016-2032)
- Figure 77: Eastern Europe Orange JuicesMarket Y-o-Y Growth Rate Comparison by Country (2016-2032)
- Figure 78: Eastern Europe Orange JuicesMarket Y-o-Y Growth Rate Comparison by By Processing Type (2016-2032)
- Figure 79: Eastern Europe Orange JuicesMarket Y-o-Y Growth Rate Comparison by By Packaging (2016-2032)
- Figure 80: Eastern Europe Orange JuicesMarket Y-o-Y Growth Rate Comparison by By Distribution Channel (2016-2032)
- Figure 81: Eastern Europe Orange JuicesMarket Share Comparison by Country (2016-2032)
- Figure 82: Eastern Europe Orange JuicesMarket Share Comparison by By Processing Type (2016-2032)
- Figure 83: Eastern Europe Orange JuicesMarket Share Comparison by By Packaging (2016-2032)
- Figure 84: Eastern Europe Orange JuicesMarket Share Comparison by By Distribution Channel (2016-2032)
- Figure 85: APAC Orange Juices Market Revenue (US$ Mn) Market Share by By Processing Typein 2022
- Figure 86: APAC Orange JuicesMarket Attractiveness Analysis by By Processing Type, 2016-2032
- Figure 87: APAC Orange Juices Market Revenue (US$ Mn) Market Share by By Packagingin 2022
- Figure 88: APAC Orange JuicesMarket Attractiveness Analysis by By Packaging, 2016-2032
- Figure 89: APAC Orange Juices Market Revenue (US$ Mn) Market Share by By Distribution Channelin 2022
- Figure 90: APAC Orange JuicesMarket Attractiveness Analysis by By Distribution Channel, 2016-2032
- Figure 91: APAC Orange Juices Market Revenue (US$ Mn) Market Share by Country in 2022
- Figure 92: APAC Orange JuicesMarket Attractiveness Analysis by Country, 2016-2032
- Figure 93: APAC Orange JuicesMarket Revenue (US$ Mn) (2016-2032)
- Figure 94: APAC Orange JuicesMarket Revenue (US$ Mn) Comparison by Country (2016-2032)
- Figure 95: APAC Orange JuicesMarket Revenue (US$ Mn) Comparison by By Processing Type (2016-2032)
- Figure 96: APAC Orange JuicesMarket Revenue (US$ Mn) Comparison by By Packaging (2016-2032)
- Figure 97: APAC Orange JuicesMarket Revenue (US$ Mn) Comparison by By Distribution Channel (2016-2032)
- Figure 98: APAC Orange JuicesMarket Y-o-Y Growth Rate Comparison by Country (2016-2032)
- Figure 99: APAC Orange JuicesMarket Y-o-Y Growth Rate Comparison by By Processing Type (2016-2032)
- Figure 100: APAC Orange JuicesMarket Y-o-Y Growth Rate Comparison by By Packaging (2016-2032)
- Figure 101: APAC Orange JuicesMarket Y-o-Y Growth Rate Comparison by By Distribution Channel (2016-2032)
- Figure 102: APAC Orange JuicesMarket Share Comparison by Country (2016-2032)
- Figure 103: APAC Orange JuicesMarket Share Comparison by By Processing Type (2016-2032)
- Figure 104: APAC Orange JuicesMarket Share Comparison by By Packaging (2016-2032)
- Figure 105: APAC Orange JuicesMarket Share Comparison by By Distribution Channel (2016-2032)
- Figure 106: Latin America Orange Juices Market Revenue (US$ Mn) Market Share by By Processing Typein 2022
- Figure 107: Latin America Orange JuicesMarket Attractiveness Analysis by By Processing Type, 2016-2032
- Figure 108: Latin America Orange Juices Market Revenue (US$ Mn) Market Share by By Packagingin 2022
- Figure 109: Latin America Orange JuicesMarket Attractiveness Analysis by By Packaging, 2016-2032
- Figure 110: Latin America Orange Juices Market Revenue (US$ Mn) Market Share by By Distribution Channelin 2022
- Figure 111: Latin America Orange JuicesMarket Attractiveness Analysis by By Distribution Channel, 2016-2032
- Figure 112: Latin America Orange Juices Market Revenue (US$ Mn) Market Share by Country in 2022
- Figure 113: Latin America Orange JuicesMarket Attractiveness Analysis by Country, 2016-2032
- Figure 114: Latin America Orange JuicesMarket Revenue (US$ Mn) (2016-2032)
- Figure 115: Latin America Orange JuicesMarket Revenue (US$ Mn) Comparison by Country (2016-2032)
- Figure 116: Latin America Orange JuicesMarket Revenue (US$ Mn) Comparison by By Processing Type (2016-2032)
- Figure 117: Latin America Orange JuicesMarket Revenue (US$ Mn) Comparison by By Packaging (2016-2032)
- Figure 118: Latin America Orange JuicesMarket Revenue (US$ Mn) Comparison by By Distribution Channel (2016-2032)
- Figure 119: Latin America Orange JuicesMarket Y-o-Y Growth Rate Comparison by Country (2016-2032)
- Figure 120: Latin America Orange JuicesMarket Y-o-Y Growth Rate Comparison by By Processing Type (2016-2032)
- Figure 121: Latin America Orange JuicesMarket Y-o-Y Growth Rate Comparison by By Packaging (2016-2032)
- Figure 122: Latin America Orange JuicesMarket Y-o-Y Growth Rate Comparison by By Distribution Channel (2016-2032)
- Figure 123: Latin America Orange JuicesMarket Share Comparison by Country (2016-2032)
- Figure 124: Latin America Orange JuicesMarket Share Comparison by By Processing Type (2016-2032)
- Figure 125: Latin America Orange JuicesMarket Share Comparison by By Packaging (2016-2032)
- Figure 126: Latin America Orange JuicesMarket Share Comparison by By Distribution Channel (2016-2032)
- Figure 127: Middle East & Africa Orange Juices Market Revenue (US$ Mn) Market Share by By Processing Typein 2022
- Figure 128: Middle East & Africa Orange JuicesMarket Attractiveness Analysis by By Processing Type, 2016-2032
- Figure 129: Middle East & Africa Orange Juices Market Revenue (US$ Mn) Market Share by By Packagingin 2022
- Figure 130: Middle East & Africa Orange JuicesMarket Attractiveness Analysis by By Packaging, 2016-2032
- Figure 131: Middle East & Africa Orange Juices Market Revenue (US$ Mn) Market Share by By Distribution Channelin 2022
- Figure 132: Middle East & Africa Orange JuicesMarket Attractiveness Analysis by By Distribution Channel, 2016-2032
- Figure 133: Middle East & Africa Orange Juices Market Revenue (US$ Mn) Market Share by Country in 2022
- Figure 134: Middle East & Africa Orange JuicesMarket Attractiveness Analysis by Country, 2016-2032
- Figure 135: Middle East & Africa Orange JuicesMarket Revenue (US$ Mn) (2016-2032)
- Figure 136: Middle East & Africa Orange JuicesMarket Revenue (US$ Mn) Comparison by Country (2016-2032)
- Figure 137: Middle East & Africa Orange JuicesMarket Revenue (US$ Mn) Comparison by By Processing Type (2016-2032)
- Figure 138: Middle East & Africa Orange JuicesMarket Revenue (US$ Mn) Comparison by By Packaging (2016-2032)
- Figure 139: Middle East & Africa Orange JuicesMarket Revenue (US$ Mn) Comparison by By Distribution Channel (2016-2032)
- Figure 140: Middle East & Africa Orange JuicesMarket Y-o-Y Growth Rate Comparison by Country (2016-2032)
- Figure 141: Middle East & Africa Orange JuicesMarket Y-o-Y Growth Rate Comparison by By Processing Type (2016-2032)
- Figure 142: Middle East & Africa Orange JuicesMarket Y-o-Y Growth Rate Comparison by By Packaging (2016-2032)
- Figure 143: Middle East & Africa Orange JuicesMarket Y-o-Y Growth Rate Comparison by By Distribution Channel (2016-2032)
- Figure 144: Middle East & Africa Orange JuicesMarket Share Comparison by Country (2016-2032)
- Figure 145: Middle East & Africa Orange JuicesMarket Share Comparison by By Processing Type (2016-2032)
- Figure 146: Middle East & Africa Orange JuicesMarket Share Comparison by By Packaging (2016-2032)
- Figure 147: Middle East & Africa Orange JuicesMarket Share Comparison by By Distribution Channel (2016-2032)
- List of Tables
- Table 1: Global Orange JuicesMarket Comparison by By Processing Type (2016-2032)
- Table 2: Global Orange JuicesMarket Comparison by By Packaging (2016-2032)
- Table 3: Global Orange JuicesMarket Comparison by By Distribution Channel (2016-2032)
- Table 4: Global Orange Juices Market Revenue (US$ Mn) Comparison by Region (2016-2032)
- Table 5: Global Orange JuicesMarket Revenue (US$ Mn) (2016-2032)
- Table 6: Global Orange JuicesMarket Revenue (US$ Mn) Comparison by Region (2016-2032)
- Table 7: Global Orange JuicesMarket Revenue (US$ Mn) Comparison by By Processing Type (2016-2032)
- Table 8: Global Orange JuicesMarket Revenue (US$ Mn) Comparison by By Packaging (2016-2032)
- Table 9: Global Orange JuicesMarket Revenue (US$ Mn) Comparison by By Distribution Channel (2016-2032)
- Table 10: Global Orange JuicesMarket Y-o-Y Growth Rate Comparison by Region (2016-2032)
- Table 11: Global Orange JuicesMarket Y-o-Y Growth Rate Comparison by By Processing Type (2016-2032)
- Table 12: Global Orange JuicesMarket Y-o-Y Growth Rate Comparison by By Packaging (2016-2032)
- Table 13: Global Orange JuicesMarket Y-o-Y Growth Rate Comparison by By Distribution Channel (2016-2032)
- Table 14: Global Orange JuicesMarket Share Comparison by Region (2016-2032)
- Table 15: Global Orange JuicesMarket Share Comparison by By Processing Type (2016-2032)
- Table 16: Global Orange JuicesMarket Share Comparison by By Packaging (2016-2032)
- Table 17: Global Orange JuicesMarket Share Comparison by By Distribution Channel (2016-2032)
- Table 18: North America Orange JuicesMarket Comparison by By Packaging (2016-2032)
- Table 19: North America Orange JuicesMarket Comparison by By Distribution Channel (2016-2032)
- Table 20: North America Orange Juices Market Revenue (US$ Mn) Comparison by Country (2016-2032)
- Table 21: North America Orange JuicesMarket Revenue (US$ Mn) (2016-2032)
- Table 22: North America Orange JuicesMarket Revenue (US$ Mn) Comparison by Country (2016-2032)
- Table 23: North America Orange JuicesMarket Revenue (US$ Mn) Comparison by By Processing Type (2016-2032)
- Table 24: North America Orange JuicesMarket Revenue (US$ Mn) Comparison by By Packaging (2016-2032)
- Table 25: North America Orange JuicesMarket Revenue (US$ Mn) Comparison by By Distribution Channel (2016-2032)
- Table 26: North America Orange JuicesMarket Y-o-Y Growth Rate Comparison by Country (2016-2032)
- Table 27: North America Orange JuicesMarket Y-o-Y Growth Rate Comparison by By Processing Type (2016-2032)
- Table 28: North America Orange JuicesMarket Y-o-Y Growth Rate Comparison by By Packaging (2016-2032)
- Table 29: North America Orange JuicesMarket Y-o-Y Growth Rate Comparison by By Distribution Channel (2016-2032)
- Table 30: North America Orange JuicesMarket Share Comparison by Country (2016-2032)
- Table 31: North America Orange JuicesMarket Share Comparison by By Processing Type (2016-2032)
- Table 32: North America Orange JuicesMarket Share Comparison by By Packaging (2016-2032)
- Table 33: North America Orange JuicesMarket Share Comparison by By Distribution Channel (2016-2032)
- Table 34: Western Europe Orange JuicesMarket Comparison by By Processing Type (2016-2032)
- Table 35: Western Europe Orange JuicesMarket Comparison by By Packaging (2016-2032)
- Table 36: Western Europe Orange JuicesMarket Comparison by By Distribution Channel (2016-2032)
- Table 37: Western Europe Orange Juices Market Revenue (US$ Mn) Comparison by Country (2016-2032)
- Table 38: Western Europe Orange JuicesMarket Revenue (US$ Mn) (2016-2032)
- Table 39: Western Europe Orange JuicesMarket Revenue (US$ Mn) Comparison by Country (2016-2032)
- Table 40: Western Europe Orange JuicesMarket Revenue (US$ Mn) Comparison by By Processing Type (2016-2032)
- Table 41: Western Europe Orange JuicesMarket Revenue (US$ Mn) Comparison by By Packaging (2016-2032)
- Table 42: Western Europe Orange JuicesMarket Revenue (US$ Mn) Comparison by By Distribution Channel (2016-2032)
- Table 43: Western Europe Orange JuicesMarket Y-o-Y Growth Rate Comparison by Country (2016-2032)
- Table 44: Western Europe Orange JuicesMarket Y-o-Y Growth Rate Comparison by By Processing Type (2016-2032)
- Table 45: Western Europe Orange JuicesMarket Y-o-Y Growth Rate Comparison by By Packaging (2016-2032)
- Table 46: Western Europe Orange JuicesMarket Y-o-Y Growth Rate Comparison by By Distribution Channel (2016-2032)
- Table 47: Western Europe Orange JuicesMarket Share Comparison by Country (2016-2032)
- Table 48: Western Europe Orange JuicesMarket Share Comparison by By Processing Type (2016-2032)
- Table 49: Western Europe Orange JuicesMarket Share Comparison by By Packaging (2016-2032)
- Table 50: Western Europe Orange JuicesMarket Share Comparison by By Distribution Channel (2016-2032)
- Table 51: Eastern Europe Orange JuicesMarket Comparison by By Processing Type (2016-2032)
- Table 52: Eastern Europe Orange JuicesMarket Comparison by By Packaging (2016-2032)
- Table 53: Eastern Europe Orange JuicesMarket Comparison by By Distribution Channel (2016-2032)
- Table 54: Eastern Europe Orange Juices Market Revenue (US$ Mn) Comparison by Country (2016-2032)
- Table 55: Eastern Europe Orange JuicesMarket Revenue (US$ Mn) (2016-2032)
- Table 56: Eastern Europe Orange JuicesMarket Revenue (US$ Mn) Comparison by Country (2016-2032)
- Table 57: Eastern Europe Orange JuicesMarket Revenue (US$ Mn) Comparison by By Processing Type (2016-2032)
- Table 58: Eastern Europe Orange JuicesMarket Revenue (US$ Mn) Comparison by By Packaging (2016-2032)
- Table 59: Eastern Europe Orange JuicesMarket Revenue (US$ Mn) Comparison by By Distribution Channel (2016-2032)
- Table 60: Eastern Europe Orange JuicesMarket Y-o-Y Growth Rate Comparison by Country (2016-2032)
- Table 61: Eastern Europe Orange JuicesMarket Y-o-Y Growth Rate Comparison by By Processing Type (2016-2032)
- Table 62: Eastern Europe Orange JuicesMarket Y-o-Y Growth Rate Comparison by By Packaging (2016-2032)
- Table 63: Eastern Europe Orange JuicesMarket Y-o-Y Growth Rate Comparison by By Distribution Channel (2016-2032)
- Table 64: Eastern Europe Orange JuicesMarket Share Comparison by Country (2016-2032)
- Table 65: Eastern Europe Orange JuicesMarket Share Comparison by By Processing Type (2016-2032)
- Table 66: Eastern Europe Orange JuicesMarket Share Comparison by By Packaging (2016-2032)
- Table 67: Eastern Europe Orange JuicesMarket Share Comparison by By Distribution Channel (2016-2032)
- Table 68: APAC Orange JuicesMarket Comparison by By Processing Type (2016-2032)
- Table 69: APAC Orange JuicesMarket Comparison by By Packaging (2016-2032)
- Table 70: APAC Orange JuicesMarket Comparison by By Distribution Channel (2016-2032)
- Table 71: APAC Orange Juices Market Revenue (US$ Mn) Comparison by Country (2016-2032)
- Table 72: APAC Orange JuicesMarket Revenue (US$ Mn) (2016-2032)
- Table 73: APAC Orange JuicesMarket Revenue (US$ Mn) Comparison by Country (2016-2032)
- Table 74: APAC Orange JuicesMarket Revenue (US$ Mn) Comparison by By Processing Type (2016-2032)
- Table 75: APAC Orange JuicesMarket Revenue (US$ Mn) Comparison by By Packaging (2016-2032)
- Table 76: APAC Orange JuicesMarket Revenue (US$ Mn) Comparison by By Distribution Channel (2016-2032)
- Table 77: APAC Orange JuicesMarket Y-o-Y Growth Rate Comparison by Country (2016-2032)
- Table 78: APAC Orange JuicesMarket Y-o-Y Growth Rate Comparison by By Processing Type (2016-2032)
- Table 79: APAC Orange JuicesMarket Y-o-Y Growth Rate Comparison by By Packaging (2016-2032)
- Table 80: APAC Orange JuicesMarket Y-o-Y Growth Rate Comparison by By Distribution Channel (2016-2032)
- Table 81: APAC Orange JuicesMarket Share Comparison by Country (2016-2032)
- Table 82: APAC Orange JuicesMarket Share Comparison by By Processing Type (2016-2032)
- Table 83: APAC Orange JuicesMarket Share Comparison by By Packaging (2016-2032)
- Table 84: APAC Orange JuicesMarket Share Comparison by By Distribution Channel (2016-2032)
- Table 85: Latin America Orange JuicesMarket Comparison by By Processing Type (2016-2032)
- Table 86: Latin America Orange JuicesMarket Comparison by By Packaging (2016-2032)
- Table 87: Latin America Orange JuicesMarket Comparison by By Distribution Channel (2016-2032)
- Table 88: Latin America Orange Juices Market Revenue (US$ Mn) Comparison by Country (2016-2032)
- Table 89: Latin America Orange JuicesMarket Revenue (US$ Mn) (2016-2032)
- Table 90: Latin America Orange JuicesMarket Revenue (US$ Mn) Comparison by Country (2016-2032)
- Table 91: Latin America Orange JuicesMarket Revenue (US$ Mn) Comparison by By Processing Type (2016-2032)
- Table 92: Latin America Orange JuicesMarket Revenue (US$ Mn) Comparison by By Packaging (2016-2032)
- Table 93: Latin America Orange JuicesMarket Revenue (US$ Mn) Comparison by By Distribution Channel (2016-2032)
- Table 94: Latin America Orange JuicesMarket Y-o-Y Growth Rate Comparison by Country (2016-2032)
- Table 95: Latin America Orange JuicesMarket Y-o-Y Growth Rate Comparison by By Processing Type (2016-2032)
- Table 96: Latin America Orange JuicesMarket Y-o-Y Growth Rate Comparison by By Packaging (2016-2032)
- Table 97: Latin America Orange JuicesMarket Y-o-Y Growth Rate Comparison by By Distribution Channel (2016-2032)
- Table 98: Latin America Orange JuicesMarket Share Comparison by Country (2016-2032)
- Table 99: Latin America Orange JuicesMarket Share Comparison by By Processing Type (2016-2032)
- Table 100: Latin America Orange JuicesMarket Share Comparison by By Packaging (2016-2032)
- Table 101: Latin America Orange JuicesMarket Share Comparison by By Distribution Channel (2016-2032)
- Table 102: Middle East & Africa Orange JuicesMarket Comparison by By Processing Type (2016-2032)
- Table 103: Middle East & Africa Orange JuicesMarket Comparison by By Packaging (2016-2032)
- Table 104: Middle East & Africa Orange JuicesMarket Comparison by By Distribution Channel (2016-2032)
- Table 105: Middle East & Africa Orange Juices Market Revenue (US$ Mn) Comparison by Country (2016-2032)
- Table 106: Middle East & Africa Orange JuicesMarket Revenue (US$ Mn) (2016-2032)
- Table 107: Middle East & Africa Orange JuicesMarket Revenue (US$ Mn) Comparison by Country (2016-2032)
- Table 108: Middle East & Africa Orange JuicesMarket Revenue (US$ Mn) Comparison by By Processing Type (2016-2032)
- Table 109: Middle East & Africa Orange JuicesMarket Revenue (US$ Mn) Comparison by By Packaging (2016-2032)
- Table 110: Middle East & Africa Orange JuicesMarket Revenue (US$ Mn) Comparison by By Distribution Channel (2016-2032)
- Table 111: Middle East & Africa Orange JuicesMarket Y-o-Y Growth Rate Comparison by Country (2016-2032)
- Table 112: Middle East & Africa Orange JuicesMarket Y-o-Y Growth Rate Comparison by By Processing Type (2016-2032)
- Table 113: Middle East & Africa Orange JuicesMarket Y-o-Y Growth Rate Comparison by By Packaging (2016-2032)
- Table 114: Middle East & Africa Orange JuicesMarket Y-o-Y Growth Rate Comparison by By Distribution Channel (2016-2032)
- Table 115: Middle East & Africa Orange JuicesMarket Share Comparison by Country (2016-2032)
- Table 116: Middle East & Africa Orange JuicesMarket Share Comparison by By Processing Type (2016-2032)
- Table 117: Middle East & Africa Orange JuicesMarket Share Comparison by By Packaging (2016-2032)
- Table 118: Middle East & Africa Orange JuicesMarket Share Comparison by By Distribution Channel (2016-2032)
- 1. Executive Summary
-
- Astral Foods
- Bar-S Foods
- Campofrio Food Group
- Cargill
- Incorporated
- Carolina Packers Inc
Our Clients


View Our Licence Options
