Noble Ferroalloys Market Report By Type of Ferroalloy (Ferrovanadium, Ferromolybdenum, Ferrotungsten, Ferroniobium, Ferrotitanium, Others), By Application (Steel Production, Alloy Production, Welding Electrodes, Superalloys, Chemical Industry, Others), By End User Industry (Automotive, Aerospace, Construction, Energy, Machinery, Electronics, Others), By Region and Companies - Industry Segment Outlook, Market Assessment, Competition Scenario, Trends and Forecast 2024-2033
-
46688
-
May 2024
-
325
-


-
This report was compiled by Shreyas Rokade Shreyas Rokade is a seasoned Research Analyst with CMFE, bringing extensive expertise in market research and consulting, with a strong background in Chemical Engineering. Correspondence Team Lead-CMFE Linkedin | Detailed Market research Methodology Our methodology involves a mix of primary research, including interviews with leading mental health experts, and secondary research from reputable medical journals and databases. View Detailed Methodology Page
-
Quick Navigation
Report Overview
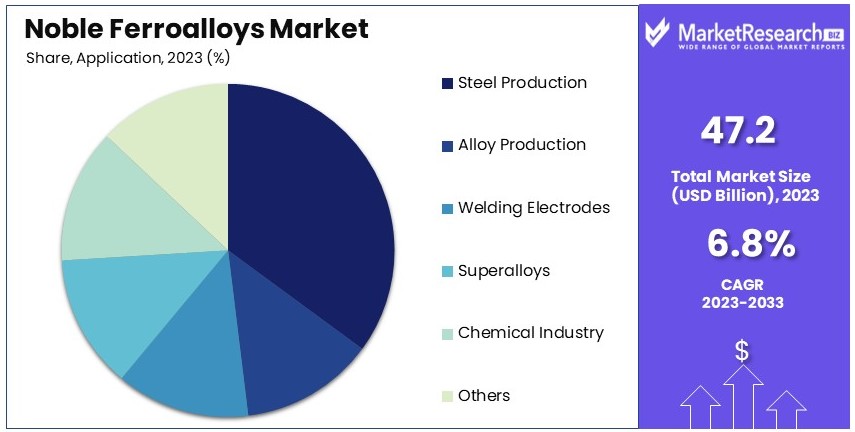
The Global Noble Ferroalloys Market size is expected to be worth around USD 89.6 Billion by 2033, from USD 47.2 Billion in 2023, growing at a CAGR of 6.8% during the forecast period from 2024 to 2033.
The Noble Ferroalloys Market includes high-quality alloys used in steelmaking and metallurgy. These alloys, like ferrochrome and ferromanganese, improve steel’s strength, durability, and resistance to corrosion. Key sectors using noble ferroalloys include construction, automotive, and manufacturing. The market's growth is driven by rising steel production and infrastructure development.
Innovations in alloy production and sustainable practices are also enhancing market dynamics. Major players invest in research to improve product quality and reduce costs. Overall, the noble ferroalloys market is crucial for advancing modern steel applications and supporting global industrial growth.

The Noble Ferroalloys Market is poised for significant growth, driven by the robust expansion of the construction industry and the increasing demand for steel. In 2022, global expenditure on construction activities surpassed $11 trillion, representing approximately 13% of the global GDP. This expenditure is projected to escalate to nearly $14.8 trillion by 2030, underscoring the critical role of construction in global economic development.
Notably, the construction sector is a substantial contributor to many countries' GDPs. For instance, in the United States, construction work valued at around $1.4 trillion was ongoing as of February 2020, with over $1 trillion attributed to the private sector.
Steel production, a key driver of the noble ferroalloys market, also exhibits strong growth trends. In 2020, global steel production reached 1,878 million tonnes, with the top 10 steel-producing countries contributing 86% of this output. By 2022, total world crude steel production had approached 1.9 billion tonnes, with China accounting for 54% of the global production. The European steel industry, with a turnover of approximately €130 billion, directly employed a significant workforce, reflecting its vital role in the region's economy. In the same year, the EU imported 28.9 million tonnes of finished steel products.
The increasing demand for high-quality steel, essential in various construction and industrial applications, is expected to drive the growth of the noble ferroalloys market. These alloys, which include elements like vanadium, tungsten, and molybdenum, enhance the strength, durability, and corrosion resistance of steel. As construction activities and steel production continue to rise globally, the demand for noble ferroalloys is anticipated to follow suit, presenting substantial growth opportunities for market participants.
Key Takeaways
- Market Value:The Global Noble Ferroalloys Market is expected to reach USD 89.6 billion by 2033, from USD 47.2 billion in 2023, growing at a CAGR of 6.8%.
- Type of Ferroalloy Analysis: Ferrovanadium dominates due to its crucial role in enhancing steel strength and hardness.
- Application Analysis: Steel production leads with the largest market share due to extensive use in enhancing steel properties.
- End User Industry Analysis: Construction industry dominates with the largest share due to high demand for durable and corrosion-resistant steel.
- Dominant Region: APAC dominates with 39.8% market share, driven by construction and automotive growth.
- High Growth Region: North America holds 25% market share, significant for advanced industrial applications.
- Analyst Viewpoint: The market exhibits strong growth with increasing demand in construction and automotive sectors, fostering competition.
- Growth Opportunities: Key players can leverage technological advancements and expanding applications in emerging markets to stand out.
Driving Factors
Increasing Demand from the Steel Industry Drives Market Growth
The steel industry is a primary consumer of noble ferroalloys like ferrosilicon, ferromanganese, and ferrochrome. These alloys enhance steel's properties, such as strength, hardness, and corrosion resistance. As global steel production rises, particularly in developing economies like China and India, the demand for noble ferroalloys grows correspondingly.
According to the World Steel Association, global crude steel production reached 1,950.5 million metric tons in 2022, with China contributing around 53% of the global output. This massive production volume underscores the critical role of noble ferroalloys in steel manufacturing. The ongoing urbanization and industrialization in these regions further fuel the steel industry's expansion. Consequently, the noble ferroalloys market is experiencing significant growth, driven by the increasing need for high-quality steel in various applications. This demand is likely to continue as these economies develop, ensuring steady market growth for noble ferroalloys.
Increasing Construction and Infrastructure Activities Drive Market Growth
The construction and infrastructure sectors are major consumers of steel and noble ferroalloys. Rapid urbanization and infrastructure projects in emerging economies drive the demand for these materials. For instance, India's National Infrastructure Pipeline envisions a $1.4 trillion investment in infrastructure projects between 2019 and 2025. Such large-scale projects significantly boost the demand for steel, and by extension, noble ferroalloys.
These alloys are essential in producing high-strength steel required for building bridges, roads, and buildings. As urban areas expand and new infrastructure is developed, the need for robust construction materials increases, leading to higher consumption of noble ferroalloys. This trend is particularly evident in regions undergoing significant development, where the construction boom directly translates into increased market growth for noble ferroalloys.
Technological Advancements Drive Market Growth
Technological advancements in ferroalloy production, such as the use of electric arc furnaces and energy-efficient processes, have improved product quality and reduced production costs. These developments make noble ferroalloys more accessible and cost-effective, driving their adoption across various industries. Improved production technologies enhance the efficiency of manufacturing processes, resulting in higher output and better-quality products.
This increased efficiency reduces costs and allows for competitive pricing, making noble ferroalloys more attractive to end-users. As industries seek cost-effective solutions without compromising quality, the adoption of technologically advanced ferroalloys rises. This trend supports the market's growth by meeting the demand for high-performance materials while maintaining economic feasibility.
Restraining Factors
High Production Costs Restrain Market Growth
The production of noble ferroalloys requires significant capital investments in equipment, energy, and raw materials. These high production costs can limit the profitability of ferroalloy producers, especially in regions with limited access to low-cost raw materials and energy sources. The need for expensive machinery and the consumption of large amounts of electricity contribute to these costs.
Additionally, fluctuations in the prices of raw materials like manganese, silicon, and chromium further impact production expenses. High operational costs can reduce profit margins and make it challenging for producers to compete, particularly against those in regions with cheaper resources. This financial strain can slow market expansion as companies struggle to maintain competitive pricing while covering production expenses.
Trade Tensions and Tariffs Restrain Market Growth
The noble ferroalloys market is global, involving producers and consumers across various regions. Trade tensions and tariffs imposed by different countries on ferroalloy imports can disrupt supply chains and affect market dynamics. For instance, ongoing trade tensions between the United States and China have led to tariffs on various steel and ferroalloy products.
These tariffs increase costs for importers, disrupt trade flows, and create uncertainty in pricing. Such trade barriers can hinder market growth by limiting the availability of noble ferroalloys in key markets and increasing costs for manufacturers and end-users. This disruption can cause volatility in the market, making it difficult for companies to plan and invest confidently in the sector.
Type of Ferroalloy Analysis
Ferrovanadium dominates with a significant market share due to its crucial role in enhancing steel strength and hardness.
The noble ferroalloys market is segmented into various types, including ferrovanadium, ferromolybdenum, ferrotungsten, ferroniobium, ferrotitanium, and others. Among these, ferrovanadium dominates with a significant market share. Ferrovanadium is crucial in enhancing the strength and hardness of steel, making it essential for high-strength low-alloy (HSLA) steels used in construction, automotive, and pipeline applications. The increasing demand for HSLA steels, particularly in emerging economies, drives the demand for ferrovanadium.
For example, the construction boom in China and India, coupled with their expanding automotive industries, significantly boosts ferrovanadium consumption. Additionally, ferrovanadium’s ability to improve the durability and corrosion resistance of steel makes it indispensable in various critical applications, thereby reinforcing its market dominance. Other segments, such as ferromolybdenum and ferrotungsten, also play vital roles in the industry. Ferromolybdenum is essential for producing stainless steel foil and alloy steels, enhancing their strength and corrosion resistance. This alloy is crucial in industries where durability and resistance to harsh environments are paramount, such as in the chemical and oil and gas industries.
Ferrotungsten, known for its high melting point and hardness, is vital in manufacturing cutting tools and wear-resistant materials. These applications drive the demand for ferrotungsten, although its market share is smaller compared to ferrovanadium. Ferroniobium and ferrotitanium are also important but serve more niche markets, contributing to specialized steel and alloy productions. The demand for these ferroalloys is growing, driven by advancements in technology and the need for high-performance materials in various industrial applications.
Application Analysis
Steel production dominates with the largest market share due to the extensive use of noble ferroalloys in enhancing steel properties.
In the noble ferroalloys market, the application segment includes steel production, alloy production, welding electrodes, superalloys, chemical industry, and others. Steel production is the dominant application, accounting for the largest market share. Noble ferroalloys like ferrovanadium, ferromolybdenum, and ferrotungsten are essential in steelmaking due to their ability to enhance the mechanical properties of steel.
As global steel production continues to rise, driven by infrastructure development and industrialization, the demand for noble ferroalloys in steel production is expected to grow. According to the World Steel Association, global crude steel production reached 1,950.5 million metric tons in 2022, highlighting the immense scale of this segment. Alloy production is another critical application, where noble ferroalloys are used to produce various high-performance alloys. These alloys are essential in industries requiring materials with exceptional strength, heat resistance, and corrosion resistance, such as aerospace and automotive.
Welding electrodes and superalloys are specialized applications that also contribute to market growth. Welding electrodes containing noble ferroalloys are vital for producing high-quality welds in construction and manufacturing. Superalloys, which incorporate noble ferroalloys, are crucial in high-temperature applications, particularly in the aerospace and power generation sectors. The chemical industry, while a smaller segment, utilizes noble ferroalloys for their catalytic properties and in the production of specialized chemicals. Overall, each application segment plays a significant role in driving the noble ferroalloys market, with steel production leading the charge due to its extensive and varied uses across multiple industries.
End User Industry Analysis
Construction industry dominates with the largest share due to high demand for durable and corrosion-resistant steel.
The noble ferroalloys market is segmented by end-user industries, including automotive, aerospace, construction, energy, machinery, electronics, and others. The construction industry is the dominant end-user, driving the largest share of the market. Noble ferroalloys are essential in producing high-strength and corrosion-resistant steel used in construction. The ongoing urbanization and infrastructure development in emerging economies, such as China's Belt and Road Initiative and India's Smart Cities Mission, significantly boost the demand for noble ferroalloys in the construction sector.
The automotive industry is another major consumer of noble ferroalloys, utilizing them in the production of high-strength steel and specialized alloys for vehicle manufacturing. As the automotive industry shifts towards lighter and stronger materials to improve fuel efficiency and safety, the demand for noble ferroalloys is expected to grow. The aerospace industry also significantly contributes to the market, using noble ferroalloys in the production of superalloys for aircraft engines and components that require exceptional strength and heat resistance.
The energy sector, particularly in renewable energy and oil and gas, relies on noble ferroalloys for producing durable and high-performance materials needed for energy infrastructure. Machinery and electronics industries, while smaller segments, also use noble ferroalloys in various applications, contributing to overall market growth. Each of these end-user industries drives the demand for noble ferroalloys, with the construction industry leading due to the extensive use of steel in infrastructure projects.
Key Market Segments
By Type of Ferroalloy
- Ferrovanadium
- Ferromolybdenum
- Ferrotungsten
- Ferroniobium
- Ferrotitanium
- Others
By Application
- Steel Production
- Alloy Production
- Welding Electrodes
- Superalloys
- Chemical Industry
- Others
By End User Industry
- Automotive
- Aerospace
- Construction
- Energy
- Machinery
- Electronics
- Others
Growth Opportunities
Increasing Demand for High-Grade Steel Offers Growth Opportunity
The demand for high-grade steel is rising due to its strength, durability, and performance in industries like automotive, construction, and machinery. Noble ferroalloys are crucial in producing high-grade steel by enhancing properties like strength, hardness, and corrosion resistance.
The automotive industry's need for lightweight, high-strength steel for better fuel efficiency and safety is driving the demand for ferroalloys like ferrochrome and ferromanganese. For instance, the global push towards electric vehicles and more stringent fuel efficiency standards in traditional vehicles are significant drivers. This trend presents a substantial growth opportunity for noble ferroalloy producers, enabling them to capitalize on the increasing need for superior steel products in various applications.
Expansion into Emerging Markets Offers Growth Opportunity
Emerging economies in Asia, Africa, and Latin America are rapidly industrializing and urbanizing, leading to higher demand for steel and related products. These regions offer significant growth opportunities for noble ferroalloy producers. In India, for example, ambitious infrastructure development plans and a growing construction sector are driving demand for noble ferroalloys like ferrosilicon and ferromanganese.
The National Infrastructure Pipeline in India, which envisions substantial investments, highlights this potential. As these economies expand, noble ferroalloy producers can tap into the burgeoning steel production and construction activities, ensuring sustained market growth.
Trending Factors
Sustainability and Environmental Considerations Are Trending Factors
Environmental concerns and stricter regulations are driving the trend towards sustainable and eco-friendly production processes in the noble ferroalloys industry. Producers are focusing on reducing emissions, optimizing energy consumption, and smart waste management. Regulatory pressures, consumer demands, and industry efforts to reduce environmental footprints are fueling this trend.
The adoption of electric arc furnaces and energy-efficient technologies in ferroalloy production is becoming more prevalent. These advancements not only comply with environmental standards but also reduce production costs, thereby enhancing market appeal and positioning noble ferroalloy producers as environmentally responsible and economically efficient.
Vertical Integration and Consolidation Are Trending Factors
Vertical integration and consolidation are trending in the noble ferroalloys market as companies aim to enhance supply chain efficiency, reduce costs, and gain a competitive edge. Major steel producers are acquiring or partnering with ferroalloy producers to secure a stable supply of raw materials. Mergers and acquisitions among ferroalloy producers are also occurring to achieve economies of scale and expand market reach.
For instance, ArcelorMittal's acquisition of a majority stake in Sideralba in 2021 exemplifies this trend. These strategic moves help companies streamline operations, improve profitability, and strengthen their market position, making vertical integration and consolidation critical trends in the noble ferroalloys industry.
Regional Analysis
APAC Dominates with 39.8% Market Share
APAC's dominance in the noble ferroalloys market is driven by rapid industrialization and urbanization. Major economies like China and India lead in steel production, which heavily relies on noble ferroalloys. For instance, China alone accounted for 53% of global crude steel production in 2022. The region's robust infrastructure projects and growing automotive industry further fuel demand.
Regional characteristics such as abundant raw materials and lower production costs enhance market performance. APAC's favorable government policies and significant investments in infrastructure projects also play a crucial role. For example, India's National Infrastructure Pipeline envisions a $1.4 trillion investment, boosting steel and ferroalloy demand.
APAC's market presence is expected to grow, driven by continued industrial expansion and urbanization. The increasing adoption of advanced production technologies will also enhance market growth. By 2025, APAC is projected to maintain its leading position with a steady increase in market share.
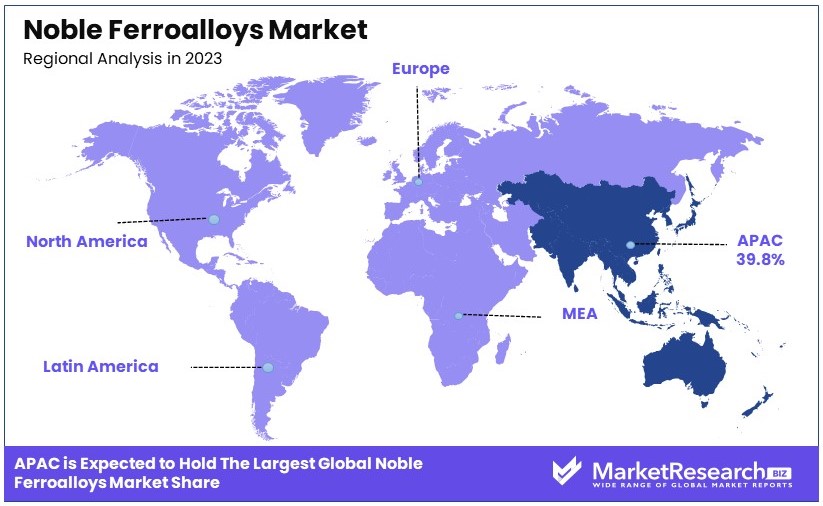
North America Holds 25% Market Share
North America holds a 25% market share in the noble ferroalloys market. The region benefits from advanced technological infrastructure and a strong automotive sector. The U.S. and Canada are key players, with significant investments in high-grade steel production. North America's focus on innovation and sustainability will continue to drive market growth.
Europe Accounts for 20% Market Share
Europe accounts for 20% of the noble ferroalloys market. The region's emphasis on sustainable and eco-friendly production methods drives demand. Germany and France lead in automotive and machinery manufacturing, which boosts the need for high-quality steel and ferroalloys. Europe's commitment to green technologies will support steady market growth.
Middle East & Africa Holds 10% Market Share
The Middle East & Africa region holds a 10% market share. This region's market is driven by ongoing infrastructure projects and urbanization efforts, particularly in Gulf countries. The construction boom and industrial developments in these areas contribute significantly to the demand for noble ferroalloys.
Latin America Accounts for 5.2% Market Share
Latin America accounts for 5.2% of the noble ferroalloys market. Brazil is a key player, with its growing steel industry and expanding construction sector. The region's focus on industrialization and infrastructure development will continue to foster market growth in the coming years.
Key Regions and Countries
- North America
- The US
- Canada
- Mexico
- Western Europe
- Germany
- France
- The UK
- Spain
- Italy
- Portugal
- Ireland
- Austria
- Switzerland
- Benelux
- Nordic
- Rest of Western Europe
- Eastern Europe
- Russia
- Poland
- The Czech Republic
- Greece
- Rest of Eastern Europe
- APAC
- China
- Japan
- South Korea
- India
- Australia & New Zealand
- Indonesia
- Malaysia
- Philippines
- Singapore
- Thailand
- Vietnam
- Rest of APAC
- Latin America
- Brazil
- Colombia
- Chile
- Argentina
- Costa Rica
- Rest of Latin America
- Middle East & Africa
- Algeria
- Egypt
- Israel
- Kuwait
- Nigeria
- Saudi Arabia
- South Africa
- Turkey
- United Arab Emirates
- Rest of MEA
Key Players Analysis
The Noble Ferroalloys market features a diverse array of influential companies that significantly shape industry dynamics. Notable among these are Eurasian Resources Group (ERG), Glencore plc, and China Minmetals Corporation, each holding substantial global footprints and extensive resource control. These entities excel in production capabilities and distribution networks, enhancing their market leverage.
Samancor Chrome, Tata Steel, and Jindal Stainless Limited stand out for their vertical integration strategies, controlling both raw material sourcing and end-product manufacturing. This integration not only stabilizes their supply chains but also allows for aggressive market positioning in response to industry demands.
Firms like OM Holdings Ltd., Sakura Ferroalloys, and Ferroglobe are pivotal in specialized product segments, offering customized solutions that cater to specific industry needs. Their focus on niche markets provides them with a competitive edge, particularly in regions with unique market requirements.
Additionally, Erdos Group and Henan Xibao Metallurgy Group Co., Ltd. are key players in the Chinese market, the largest consumer of noble ferroalloys. Their strategic positioning within China supports their influence over pricing and market trends, impacting global market dynamics.
Smaller, yet significant players such as Votorantim Metais, Hindustan Ferro Alloy Industries, Gulf Ferro Alloys Company (SABAYEK), and Yildirim Group contribute to the market by fulfilling regional demand and specializing in specific types of ferroalloys.
Collectively, these companies drive the noble ferroalloys market through strategic resource management, innovative production techniques, and adaptive market strategies, maintaining robustness in the face of fluctuating economic and industrial conditions. Their roles are crucial in setting industry standards and directing future market trajectories.
Market Key Players
- Eurasian Resources Group (ERG)
- Glencore plc
- Samancor Chrome
- Tata Steel
- Erdos Group
- Henan Xibao Metallurgy Group Co., Ltd.
- Jindal Stainless Limited
- OM Holdings Ltd.
- Sakura Ferroalloys
- Ferroglobe
- China Minmetals Corporation
- Votorantim Metais
- Hindustan Ferro Alloy Industries
- Gulf Ferro Alloys Company (SABAYEK)
- Yildirim Group
Recent Developments
- Expected on November 2024: Fastmarkets 40th International Ferroalloys 2024 in Istanbul, Turkey, will host Europe's largest gathering of ferroalloys traders, featuring extensive networking opportunities and key industry representatives from major international steel mills.
- April 2024: India's Ministry of Steel mandates BIS certification for ferroalloys, including ferrosilicon, ferrochrome, ferromanganese, and silicomanganese, to enhance quality, safety, and reliability for imports and domestic sales.
- March 11, 2024: The ferro-alloys sector in China showed a muted response to the 2024 economic targets announced at the Two Sessions conference, with key prices in ferro-silicon, tungsten, and vanadium fluctuating modestly.
- February 1, 2024: Indian Metals & Ferro Alloys Q3 FY24 results: Profit surged 899.91% YoY, revenue up 9.89% YoY, and EPS increased by 535.81% YoY. Operating income rose 497.01% YoY.
Report Scope
Report Features Description Market Value (2023) USD 47.2 Billion Forecast Revenue (2033) USD 89.6 Billion CAGR (2024-2033) 6.8% Base Year for Estimation 2023 Historic Period 2018-2023 Forecast Period 2024-2033 Report Coverage Revenue Forecast, Market Dynamics, Competitive Landscape, Recent Developments Segments Covered By Type of Ferroalloy (Ferrovanadium, Ferromolybdenum, Ferrotungsten, Ferroniobium, Ferrotitanium, Others), By Application (Steel Production, Alloy Production, Welding Electrodes, Superalloys, Chemical Industry, Others), By End User Industry (Automotive, Aerospace, Construction, Energy, Machinery, Electronics, Others) Regional Analysis North America - The US, Canada, & Mexico; Western Europe - Germany, France, The UK, Spain, Italy, Portugal, Ireland, Austria, Switzerland, Benelux, Nordic, & Rest of Western Europe; Eastern Europe - Russia, Poland, The Czech Republic, Greece, & Rest of Eastern Europe; APAC - China, Japan, South Korea, India, Australia & New Zealand, Indonesia, Malaysia, Philippines, Singapore, Thailand, Vietnam, & Rest of APAC; Latin America - Brazil, Colombia, Chile, Argentina, Costa Rica, & Rest of Latin America; Middle East & Africa - Algeria, Egypt, Israel, Kuwait, Nigeria, Saudi Arabia, South Africa, Turkey, United Arab Emirates, & Rest of MEA Competitive Landscape Eurasian Resources Group (ERG), Glencore plc, Samancor Chrome, Tata Steel, Erdos Group, Henan Xibao Metallurgy Group Co., Ltd., Jindal Stainless Limited, OM Holdings Ltd., Sakura Ferroalloys, Ferroglobe, China Minmetals Corporation, Votorantim Metais, Hindustan Ferro Alloy Industries, Gulf Ferro Alloys Company (SABAYEK), Yildirim Group Customization Scope Customization for segments, region/country-level will be provided. Moreover, additional customization can be done based on the requirements. Purchase Options We have three licenses to opt for: Single User License, Multi-User License (Up to 5 Users), Corporate Use License (Unlimited User and Printable PDF) -
- 1. Executive Summary
- 1.1. Definition
- 1.2. Taxonomy
- 1.3. Research Scope
- 1.4. Key Analysis
- 1.5. Key Findings by Major Segments
- 1.6. Top strategies by Major Players
- 2. Global Noble Ferroalloys Market Overview
- 2.1. Noble Ferroalloys Market Dynamics
- 2.1.1. Drivers
- 2.1.2. Opportunities
- 2.1.3. Restraints
- 2.1.4. Challenges
- 2.2. Macro-economic Factors
- 2.3. Regulatory Framework
- 2.4. Market Investment Feasibility Index
- 2.5. PEST Analysis
- 2.6. PORTER’S Five Force Analysis
- 2.7. Drivers & Restraints Impact Analysis
- 2.8. Industry Chain Analysis
- 2.9. Cost Structure Analysis
- 2.10. Marketing Strategy
- 2.11. Russia-Ukraine War Impact Analysis
- 2.12. Opportunity Map Analysis
- 2.13. Market Competition Scenario Analysis
- 2.14. Product Life Cycle Analysis
- 2.15. Opportunity Orbits
- 2.16. Manufacturer Intensity Map
- 2.17. Major Companies sales by Value & Volume
- 2.1. Noble Ferroalloys Market Dynamics
- 3. Global Noble Ferroalloys Market Analysis, Opportunity and Forecast, 2016-2032
- 3.1. Global Noble Ferroalloys Market Analysis, 2016-2021
- 3.2. Global Noble Ferroalloys Market Opportunity and Forecast, 2023-2032
- 3.3. Global Noble Ferroalloys Market Analysis, Opportunity and Forecast, By Type of Ferroalloy, 2016-2032
- 3.3.1. Global Noble Ferroalloys Market Analysis by Type of Ferroalloy: Introduction
- 3.3.2. Market Size Absolute $ Opportunity Analysis and Forecast, By Type of Ferroalloy, 2016-2032
- 3.3.3. Ferrovanadium
- 3.3.4. Ferromolybdenum
- 3.3.5. Ferrotungsten
- 3.3.6. Ferroniobium
- 3.3.7. Ferrotitanium
- 3.3.8. Others
- 3.4. Global Noble Ferroalloys Market Analysis, Opportunity and Forecast, By Application, 2016-2032
- 3.4.1. Global Noble Ferroalloys Market Analysis by Application: Introduction
- 3.4.2. Market Size Absolute $ Opportunity Analysis and Forecast, By Application, 2016-2032
- 3.4.3. Steel Production
- 3.4.4. Alloy Production
- 3.4.5. Welding Electrodes
- 3.4.6. Superalloys
- 3.4.7. Chemical Industry
- 3.4.8. Others
- 3.5. Global Noble Ferroalloys Market Analysis, Opportunity and Forecast, By End User Industry, 2016-2032
- 3.5.1. Global Noble Ferroalloys Market Analysis by End User Industry: Introduction
- 3.5.2. Market Size Absolute $ Opportunity Analysis and Forecast, By End User Industry, 2016-2032
- 3.5.3. Automotive
- 3.5.4. Aerospace
- 3.5.5. Construction
- 3.5.6. Energy
- 3.5.7. Machinery
- 3.5.8. Electronics
- 3.5.9. Others
- 4. North America Noble Ferroalloys Market Analysis, Opportunity and Forecast, 2016-2032
- 4.1. North America Noble Ferroalloys Market Analysis, 2016-2021
- 4.2. North America Noble Ferroalloys Market Opportunity and Forecast, 2023-2032
- 4.3. North America Noble Ferroalloys Market Analysis, Opportunity and Forecast, By Type of Ferroalloy, 2016-2032
- 4.3.1. North America Noble Ferroalloys Market Analysis by Type of Ferroalloy: Introduction
- 4.3.2. Market Size Absolute $ Opportunity Analysis and Forecast, By Type of Ferroalloy, 2016-2032
- 4.3.3. Ferrovanadium
- 4.3.4. Ferromolybdenum
- 4.3.5. Ferrotungsten
- 4.3.6. Ferroniobium
- 4.3.7. Ferrotitanium
- 4.3.8. Others
- 4.4. North America Noble Ferroalloys Market Analysis, Opportunity and Forecast, By Application, 2016-2032
- 4.4.1. North America Noble Ferroalloys Market Analysis by Application: Introduction
- 4.4.2. Market Size Absolute $ Opportunity Analysis and Forecast, By Application, 2016-2032
- 4.4.3. Steel Production
- 4.4.4. Alloy Production
- 4.4.5. Welding Electrodes
- 4.4.6. Superalloys
- 4.4.7. Chemical Industry
- 4.4.8. Others
- 4.5. North America Noble Ferroalloys Market Analysis, Opportunity and Forecast, By End User Industry, 2016-2032
- 4.5.1. North America Noble Ferroalloys Market Analysis by End User Industry: Introduction
- 4.5.2. Market Size Absolute $ Opportunity Analysis and Forecast, By End User Industry, 2016-2032
- 4.5.3. Automotive
- 4.5.4. Aerospace
- 4.5.5. Construction
- 4.5.6. Energy
- 4.5.7. Machinery
- 4.5.8. Electronics
- 4.5.9. Others
- 4.6. North America Noble Ferroalloys Market Analysis, Opportunity and Forecast, By Country , 2016-2032
- 4.6.1. North America Noble Ferroalloys Market Analysis by Country : Introduction
- 4.6.2. Market Size Absolute $ Opportunity Analysis and Forecast, Country , 2016-2032
- 4.6.2.1. The US
- 4.6.2.2. Canada
- 4.6.2.3. Mexico
- 5. Western Europe Noble Ferroalloys Market Analysis, Opportunity and Forecast, 2016-2032
- 5.1. Western Europe Noble Ferroalloys Market Analysis, 2016-2021
- 5.2. Western Europe Noble Ferroalloys Market Opportunity and Forecast, 2023-2032
- 5.3. Western Europe Noble Ferroalloys Market Analysis, Opportunity and Forecast, By Type of Ferroalloy, 2016-2032
- 5.3.1. Western Europe Noble Ferroalloys Market Analysis by Type of Ferroalloy: Introduction
- 5.3.2. Market Size Absolute $ Opportunity Analysis and Forecast, By Type of Ferroalloy, 2016-2032
- 5.3.3. Ferrovanadium
- 5.3.4. Ferromolybdenum
- 5.3.5. Ferrotungsten
- 5.3.6. Ferroniobium
- 5.3.7. Ferrotitanium
- 5.3.8. Others
- 5.4. Western Europe Noble Ferroalloys Market Analysis, Opportunity and Forecast, By Application, 2016-2032
- 5.4.1. Western Europe Noble Ferroalloys Market Analysis by Application: Introduction
- 5.4.2. Market Size Absolute $ Opportunity Analysis and Forecast, By Application, 2016-2032
- 5.4.3. Steel Production
- 5.4.4. Alloy Production
- 5.4.5. Welding Electrodes
- 5.4.6. Superalloys
- 5.4.7. Chemical Industry
- 5.4.8. Others
- 5.5. Western Europe Noble Ferroalloys Market Analysis, Opportunity and Forecast, By End User Industry, 2016-2032
- 5.5.1. Western Europe Noble Ferroalloys Market Analysis by End User Industry: Introduction
- 5.5.2. Market Size Absolute $ Opportunity Analysis and Forecast, By End User Industry, 2016-2032
- 5.5.3. Automotive
- 5.5.4. Aerospace
- 5.5.5. Construction
- 5.5.6. Energy
- 5.5.7. Machinery
- 5.5.8. Electronics
- 5.5.9. Others
- 5.6. Western Europe Noble Ferroalloys Market Analysis, Opportunity and Forecast, By Country , 2016-2032
- 5.6.1. Western Europe Noble Ferroalloys Market Analysis by Country : Introduction
- 5.6.2. Market Size Absolute $ Opportunity Analysis and Forecast, Country , 2016-2032
- 5.6.2.1. Germany
- 5.6.2.2. France
- 5.6.2.3. The UK
- 5.6.2.4. Spain
- 5.6.2.5. Italy
- 5.6.2.6. Portugal
- 5.6.2.7. Ireland
- 5.6.2.8. Austria
- 5.6.2.9. Switzerland
- 5.6.2.10. Benelux
- 5.6.2.11. Nordic
- 5.6.2.12. Rest of Western Europe
- 6. Eastern Europe Noble Ferroalloys Market Analysis, Opportunity and Forecast, 2016-2032
- 6.1. Eastern Europe Noble Ferroalloys Market Analysis, 2016-2021
- 6.2. Eastern Europe Noble Ferroalloys Market Opportunity and Forecast, 2023-2032
- 6.3. Eastern Europe Noble Ferroalloys Market Analysis, Opportunity and Forecast, By Type of Ferroalloy, 2016-2032
- 6.3.1. Eastern Europe Noble Ferroalloys Market Analysis by Type of Ferroalloy: Introduction
- 6.3.2. Market Size Absolute $ Opportunity Analysis and Forecast, By Type of Ferroalloy, 2016-2032
- 6.3.3. Ferrovanadium
- 6.3.4. Ferromolybdenum
- 6.3.5. Ferrotungsten
- 6.3.6. Ferroniobium
- 6.3.7. Ferrotitanium
- 6.3.8. Others
- 6.4. Eastern Europe Noble Ferroalloys Market Analysis, Opportunity and Forecast, By Application, 2016-2032
- 6.4.1. Eastern Europe Noble Ferroalloys Market Analysis by Application: Introduction
- 6.4.2. Market Size Absolute $ Opportunity Analysis and Forecast, By Application, 2016-2032
- 6.4.3. Steel Production
- 6.4.4. Alloy Production
- 6.4.5. Welding Electrodes
- 6.4.6. Superalloys
- 6.4.7. Chemical Industry
- 6.4.8. Others
- 6.5. Eastern Europe Noble Ferroalloys Market Analysis, Opportunity and Forecast, By End User Industry, 2016-2032
- 6.5.1. Eastern Europe Noble Ferroalloys Market Analysis by End User Industry: Introduction
- 6.5.2. Market Size Absolute $ Opportunity Analysis and Forecast, By End User Industry, 2016-2032
- 6.5.3. Automotive
- 6.5.4. Aerospace
- 6.5.5. Construction
- 6.5.6. Energy
- 6.5.7. Machinery
- 6.5.8. Electronics
- 6.5.9. Others
- 6.6. Eastern Europe Noble Ferroalloys Market Analysis, Opportunity and Forecast, By Country , 2016-2032
- 6.6.1. Eastern Europe Noble Ferroalloys Market Analysis by Country : Introduction
- 6.6.2. Market Size Absolute $ Opportunity Analysis and Forecast, Country , 2016-2032
- 6.6.2.1. Russia
- 6.6.2.2. Poland
- 6.6.2.3. The Czech Republic
- 6.6.2.4. Greece
- 6.6.2.5. Rest of Eastern Europe
- 7. APAC Noble Ferroalloys Market Analysis, Opportunity and Forecast, 2016-2032
- 7.1. APAC Noble Ferroalloys Market Analysis, 2016-2021
- 7.2. APAC Noble Ferroalloys Market Opportunity and Forecast, 2023-2032
- 7.3. APAC Noble Ferroalloys Market Analysis, Opportunity and Forecast, By Type of Ferroalloy, 2016-2032
- 7.3.1. APAC Noble Ferroalloys Market Analysis by Type of Ferroalloy: Introduction
- 7.3.2. Market Size Absolute $ Opportunity Analysis and Forecast, By Type of Ferroalloy, 2016-2032
- 7.3.3. Ferrovanadium
- 7.3.4. Ferromolybdenum
- 7.3.5. Ferrotungsten
- 7.3.6. Ferroniobium
- 7.3.7. Ferrotitanium
- 7.3.8. Others
- 7.4. APAC Noble Ferroalloys Market Analysis, Opportunity and Forecast, By Application, 2016-2032
- 7.4.1. APAC Noble Ferroalloys Market Analysis by Application: Introduction
- 7.4.2. Market Size Absolute $ Opportunity Analysis and Forecast, By Application, 2016-2032
- 7.4.3. Steel Production
- 7.4.4. Alloy Production
- 7.4.5. Welding Electrodes
- 7.4.6. Superalloys
- 7.4.7. Chemical Industry
- 7.4.8. Others
- 7.5. APAC Noble Ferroalloys Market Analysis, Opportunity and Forecast, By End User Industry, 2016-2032
- 7.5.1. APAC Noble Ferroalloys Market Analysis by End User Industry: Introduction
- 7.5.2. Market Size Absolute $ Opportunity Analysis and Forecast, By End User Industry, 2016-2032
- 7.5.3. Automotive
- 7.5.4. Aerospace
- 7.5.5. Construction
- 7.5.6. Energy
- 7.5.7. Machinery
- 7.5.8. Electronics
- 7.5.9. Others
- 7.6. APAC Noble Ferroalloys Market Analysis, Opportunity and Forecast, By Country , 2016-2032
- 7.6.1. APAC Noble Ferroalloys Market Analysis by Country : Introduction
- 7.6.2. Market Size Absolute $ Opportunity Analysis and Forecast, Country , 2016-2032
- 7.6.2.1. China
- 7.6.2.2. Japan
- 7.6.2.3. South Korea
- 7.6.2.4. India
- 7.6.2.5. Australia & New Zeland
- 7.6.2.6. Indonesia
- 7.6.2.7. Malaysia
- 7.6.2.8. Philippines
- 7.6.2.9. Singapore
- 7.6.2.10. Thailand
- 7.6.2.11. Vietnam
- 7.6.2.12. Rest of APAC
- 8. Latin America Noble Ferroalloys Market Analysis, Opportunity and Forecast, 2016-2032
- 8.1. Latin America Noble Ferroalloys Market Analysis, 2016-2021
- 8.2. Latin America Noble Ferroalloys Market Opportunity and Forecast, 2023-2032
- 8.3. Latin America Noble Ferroalloys Market Analysis, Opportunity and Forecast, By Type of Ferroalloy, 2016-2032
- 8.3.1. Latin America Noble Ferroalloys Market Analysis by Type of Ferroalloy: Introduction
- 8.3.2. Market Size Absolute $ Opportunity Analysis and Forecast, By Type of Ferroalloy, 2016-2032
- 8.3.3. Ferrovanadium
- 8.3.4. Ferromolybdenum
- 8.3.5. Ferrotungsten
- 8.3.6. Ferroniobium
- 8.3.7. Ferrotitanium
- 8.3.8. Others
- 8.4. Latin America Noble Ferroalloys Market Analysis, Opportunity and Forecast, By Application, 2016-2032
- 8.4.1. Latin America Noble Ferroalloys Market Analysis by Application: Introduction
- 8.4.2. Market Size Absolute $ Opportunity Analysis and Forecast, By Application, 2016-2032
- 8.4.3. Steel Production
- 8.4.4. Alloy Production
- 8.4.5. Welding Electrodes
- 8.4.6. Superalloys
- 8.4.7. Chemical Industry
- 8.4.8. Others
- 8.5. Latin America Noble Ferroalloys Market Analysis, Opportunity and Forecast, By End User Industry, 2016-2032
- 8.5.1. Latin America Noble Ferroalloys Market Analysis by End User Industry: Introduction
- 8.5.2. Market Size Absolute $ Opportunity Analysis and Forecast, By End User Industry, 2016-2032
- 8.5.3. Automotive
- 8.5.4. Aerospace
- 8.5.5. Construction
- 8.5.6. Energy
- 8.5.7. Machinery
- 8.5.8. Electronics
- 8.5.9. Others
- 8.6. Latin America Noble Ferroalloys Market Analysis, Opportunity and Forecast, By Country , 2016-2032
- 8.6.1. Latin America Noble Ferroalloys Market Analysis by Country : Introduction
- 8.6.2. Market Size Absolute $ Opportunity Analysis and Forecast, Country , 2016-2032
- 8.6.2.1. Brazil
- 8.6.2.2. Colombia
- 8.6.2.3. Chile
- 8.6.2.4. Argentina
- 8.6.2.5. Costa Rica
- 8.6.2.6. Rest of Latin America
- 9. Middle East & Africa Noble Ferroalloys Market Analysis, Opportunity and Forecast, 2016-2032
- 9.1. Middle East & Africa Noble Ferroalloys Market Analysis, 2016-2021
- 9.2. Middle East & Africa Noble Ferroalloys Market Opportunity and Forecast, 2023-2032
- 9.3. Middle East & Africa Noble Ferroalloys Market Analysis, Opportunity and Forecast, By Type of Ferroalloy, 2016-2032
- 9.3.1. Middle East & Africa Noble Ferroalloys Market Analysis by Type of Ferroalloy: Introduction
- 9.3.2. Market Size Absolute $ Opportunity Analysis and Forecast, By Type of Ferroalloy, 2016-2032
- 9.3.3. Ferrovanadium
- 9.3.4. Ferromolybdenum
- 9.3.5. Ferrotungsten
- 9.3.6. Ferroniobium
- 9.3.7. Ferrotitanium
- 9.3.8. Others
- 9.4. Middle East & Africa Noble Ferroalloys Market Analysis, Opportunity and Forecast, By Application, 2016-2032
- 9.4.1. Middle East & Africa Noble Ferroalloys Market Analysis by Application: Introduction
- 9.4.2. Market Size Absolute $ Opportunity Analysis and Forecast, By Application, 2016-2032
- 9.4.3. Steel Production
- 9.4.4. Alloy Production
- 9.4.5. Welding Electrodes
- 9.4.6. Superalloys
- 9.4.7. Chemical Industry
- 9.4.8. Others
- 9.5. Middle East & Africa Noble Ferroalloys Market Analysis, Opportunity and Forecast, By End User Industry, 2016-2032
- 9.5.1. Middle East & Africa Noble Ferroalloys Market Analysis by End User Industry: Introduction
- 9.5.2. Market Size Absolute $ Opportunity Analysis and Forecast, By End User Industry, 2016-2032
- 9.5.3. Automotive
- 9.5.4. Aerospace
- 9.5.5. Construction
- 9.5.6. Energy
- 9.5.7. Machinery
- 9.5.8. Electronics
- 9.5.9. Others
- 9.6. Middle East & Africa Noble Ferroalloys Market Analysis, Opportunity and Forecast, By Country , 2016-2032
- 9.6.1. Middle East & Africa Noble Ferroalloys Market Analysis by Country : Introduction
- 9.6.2. Market Size Absolute $ Opportunity Analysis and Forecast, Country , 2016-2032
- 9.6.2.1. Algeria
- 9.6.2.2. Egypt
- 9.6.2.3. Israel
- 9.6.2.4. Kuwait
- 9.6.2.5. Nigeria
- 9.6.2.6. Saudi Arabia
- 9.6.2.7. South Africa
- 9.6.2.8. Turkey
- 9.6.2.9. The UAE
- 9.6.2.10. Rest of MEA
- 10. Global Noble Ferroalloys Market Analysis, Opportunity and Forecast, By Region , 2016-2032
- 10.1. Global Noble Ferroalloys Market Analysis by Region : Introduction
- 10.2. Market Size Absolute $ Opportunity Analysis and Forecast, By Region , 2016-2032
- 10.2.1. North America
- 10.2.2. Western Europe
- 10.2.3. Eastern Europe
- 10.2.4. APAC
- 10.2.5. Latin America
- 10.2.6. Middle East & Africa
- 11. Global Noble Ferroalloys Market Competitive Landscape, Market Share Analysis, and Company Profiles
- 11.1. Market Share Analysis
- 11.2. Company Profiles
- 11.3. Eurasian Resources Group (ERG)
- 11.3.1. Company Overview
- 11.3.2. Financial Highlights
- 11.3.3. Product Portfolio
- 11.3.4. SWOT Analysis
- 11.3.5. Key Strategies and Developments
- 11.4. Glencore plc
- 11.4.1. Company Overview
- 11.4.2. Financial Highlights
- 11.4.3. Product Portfolio
- 11.4.4. SWOT Analysis
- 11.4.5. Key Strategies and Developments
- 11.5. Samancor Chrome
- 11.5.1. Company Overview
- 11.5.2. Financial Highlights
- 11.5.3. Product Portfolio
- 11.5.4. SWOT Analysis
- 11.5.5. Key Strategies and Developments
- 11.6. Tata Steel
- 11.6.1. Company Overview
- 11.6.2. Financial Highlights
- 11.6.3. Product Portfolio
- 11.6.4. SWOT Analysis
- 11.6.5. Key Strategies and Developments
- 11.7. Erdos Group
- 11.7.1. Company Overview
- 11.7.2. Financial Highlights
- 11.7.3. Product Portfolio
- 11.7.4. SWOT Analysis
- 11.7.5. Key Strategies and Developments
- 11.8. Henan Xibao Metallurgy Group Co., Ltd.
- 11.8.1. Company Overview
- 11.8.2. Financial Highlights
- 11.8.3. Product Portfolio
- 11.8.4. SWOT Analysis
- 11.8.5. Key Strategies and Developments
- 11.9. Jindal Stainless Limited
- 11.9.1. Company Overview
- 11.9.2. Financial Highlights
- 11.9.3. Product Portfolio
- 11.9.4. SWOT Analysis
- 11.9.5. Key Strategies and Developments
- 11.10. OM Holdings Ltd.
- 11.10.1. Company Overview
- 11.10.2. Financial Highlights
- 11.10.3. Product Portfolio
- 11.10.4. SWOT Analysis
- 11.10.5. Key Strategies and Developments
- 11.11. Sakura Ferroalloys
- 11.11.1. Company Overview
- 11.11.2. Financial Highlights
- 11.11.3. Product Portfolio
- 11.11.4. SWOT Analysis
- 11.11.5. Key Strategies and Developments
- 11.12. Ferroglobe
- 11.12.1. Company Overview
- 11.12.2. Financial Highlights
- 11.12.3. Product Portfolio
- 11.12.4. SWOT Analysis
- 11.12.5. Key Strategies and Developments
- 11.13.1. Company Overview
- 11.13.2. Financial Highlights
- 11.13.3. Product Portfolio
- 11.13.4. SWOT Analysis
- 11.13.5. Key Strategies and Developments
- 11.14. China Minmetals Corporation
- 11.14.1. Company Overview
- 11.14.2. Financial Highlights
- 11.14.3. Product Portfolio
- 11.14.4. SWOT Analysis
- 11.14.5. Key Strategies and Developments
- 11.15. Hindustan Ferro Alloy Industries
- 11.15.1. Company Overview
- 11.15.2. Financial Highlights
- 11.15.3. Product Portfolio
- 11.15.4. SWOT Analysis
- 11.15.5. Key Strategies and Developments
- 11.16. Gulf Ferro Alloys Company (SABAYEK)
- 11.16.1. Company Overview
- 11.16.2. Financial Highlights
- 11.16.3. Product Portfolio
- 11.16.4. SWOT Analysis
- 11.16.5. Key Strategies and Developments
- 11.17. Yildirim Group
- 11.17.1. Company Overview
- 11.17.2. Financial Highlights
- 11.17.3. Product Portfolio
- 11.17.4. SWOT Analysis
- 11.17.5. Key Strategies and Developments
- 12. Assumptions and Acronyms
- 13. Research Methodology
- 14. Contact
- List of Figures
- Figure 1: Global Noble Ferroalloys Market Revenue (US$ Mn) Market Share by Type of Ferroalloy in 2022
- Figure 2: Global Noble Ferroalloys Market Attractiveness Analysis by Type of Ferroalloy, 2016-2032
- Figure 3: Global Noble Ferroalloys Market Revenue (US$ Mn) Market Share by Applicationin 2022
- Figure 4: Global Noble Ferroalloys Market Attractiveness Analysis by Application, 2016-2032
- Figure 5: Global Noble Ferroalloys Market Revenue (US$ Mn) Market Share by End User Industryin 2022
- Figure 6: Global Noble Ferroalloys Market Attractiveness Analysis by End User Industry, 2016-2032
- Figure 7: Global Noble Ferroalloys Market Revenue (US$ Mn) Market Share by Region in 2022
- Figure 8: Global Noble Ferroalloys Market Attractiveness Analysis by Region, 2016-2032
- Figure 9: Global Noble Ferroalloys Market Revenue (US$ Mn) (2016-2032)
- Figure 10: Global Noble Ferroalloys Market Revenue (US$ Mn) Comparison by Region (2016-2032)
- Figure 11: Global Noble Ferroalloys Market Revenue (US$ Mn) Comparison by Type of Ferroalloy (2016-2032)
- Figure 12: Global Noble Ferroalloys Market Revenue (US$ Mn) Comparison by Application (2016-2032)
- Figure 13: Global Noble Ferroalloys Market Revenue (US$ Mn) Comparison by End User Industry (2016-2032)
- Figure 14: Global Noble Ferroalloys Market Y-o-Y Growth Rate Comparison by Region (2016-2032)
- Figure 15: Global Noble Ferroalloys Market Y-o-Y Growth Rate Comparison by Type of Ferroalloy (2016-2032)
- Figure 16: Global Noble Ferroalloys Market Y-o-Y Growth Rate Comparison by Application (2016-2032)
- Figure 17: Global Noble Ferroalloys Market Y-o-Y Growth Rate Comparison by End User Industry (2016-2032)
- Figure 18: Global Noble Ferroalloys Market Share Comparison by Region (2016-2032)
- Figure 19: Global Noble Ferroalloys Market Share Comparison by Type of Ferroalloy (2016-2032)
- Figure 20: Global Noble Ferroalloys Market Share Comparison by Application (2016-2032)
- Figure 21: Global Noble Ferroalloys Market Share Comparison by End User Industry (2016-2032)
- Figure 22: North America Noble Ferroalloys Market Revenue (US$ Mn) Market Share by Type of Ferroalloyin 2022
- Figure 23: North America Noble Ferroalloys Market Attractiveness Analysis by Type of Ferroalloy, 2016-2032
- Figure 24: North America Noble Ferroalloys Market Revenue (US$ Mn) Market Share by Applicationin 2022
- Figure 25: North America Noble Ferroalloys Market Attractiveness Analysis by Application, 2016-2032
- Figure 26: North America Noble Ferroalloys Market Revenue (US$ Mn) Market Share by End User Industryin 2022
- Figure 27: North America Noble Ferroalloys Market Attractiveness Analysis by End User Industry, 2016-2032
- Figure 28: North America Noble Ferroalloys Market Revenue (US$ Mn) Market Share by Country in 2022
- Figure 29: North America Noble Ferroalloys Market Attractiveness Analysis by Country, 2016-2032
- Figure 30: North America Noble Ferroalloys Market Revenue (US$ Mn) (2016-2032)
- Figure 31: North America Noble Ferroalloys Market Revenue (US$ Mn) Comparison by Country (2016-2032)
- Figure 32: North America Noble Ferroalloys Market Revenue (US$ Mn) Comparison by Type of Ferroalloy (2016-2032)
- Figure 33: North America Noble Ferroalloys Market Revenue (US$ Mn) Comparison by Application (2016-2032)
- Figure 34: North America Noble Ferroalloys Market Revenue (US$ Mn) Comparison by End User Industry (2016-2032)
- Figure 35: North America Noble Ferroalloys Market Y-o-Y Growth Rate Comparison by Country (2016-2032)
- Figure 36: North America Noble Ferroalloys Market Y-o-Y Growth Rate Comparison by Type of Ferroalloy (2016-2032)
- Figure 37: North America Noble Ferroalloys Market Y-o-Y Growth Rate Comparison by Application (2016-2032)
- Figure 38: North America Noble Ferroalloys Market Y-o-Y Growth Rate Comparison by End User Industry (2016-2032)
- Figure 39: North America Noble Ferroalloys Market Share Comparison by Country (2016-2032)
- Figure 40: North America Noble Ferroalloys Market Share Comparison by Type of Ferroalloy (2016-2032)
- Figure 41: North America Noble Ferroalloys Market Share Comparison by Application (2016-2032)
- Figure 42: North America Noble Ferroalloys Market Share Comparison by End User Industry (2016-2032)
- Figure 43: Western Europe Noble Ferroalloys Market Revenue (US$ Mn) Market Share by Type of Ferroalloyin 2022
- Figure 44: Western Europe Noble Ferroalloys Market Attractiveness Analysis by Type of Ferroalloy, 2016-2032
- Figure 45: Western Europe Noble Ferroalloys Market Revenue (US$ Mn) Market Share by Applicationin 2022
- Figure 46: Western Europe Noble Ferroalloys Market Attractiveness Analysis by Application, 2016-2032
- Figure 47: Western Europe Noble Ferroalloys Market Revenue (US$ Mn) Market Share by End User Industryin 2022
- Figure 48: Western Europe Noble Ferroalloys Market Attractiveness Analysis by End User Industry, 2016-2032
- Figure 49: Western Europe Noble Ferroalloys Market Revenue (US$ Mn) Market Share by Country in 2022
- Figure 50: Western Europe Noble Ferroalloys Market Attractiveness Analysis by Country, 2016-2032
- Figure 51: Western Europe Noble Ferroalloys Market Revenue (US$ Mn) (2016-2032)
- Figure 52: Western Europe Noble Ferroalloys Market Revenue (US$ Mn) Comparison by Country (2016-2032)
- Figure 53: Western Europe Noble Ferroalloys Market Revenue (US$ Mn) Comparison by Type of Ferroalloy (2016-2032)
- Figure 54: Western Europe Noble Ferroalloys Market Revenue (US$ Mn) Comparison by Application (2016-2032)
- Figure 55: Western Europe Noble Ferroalloys Market Revenue (US$ Mn) Comparison by End User Industry (2016-2032)
- Figure 56: Western Europe Noble Ferroalloys Market Y-o-Y Growth Rate Comparison by Country (2016-2032)
- Figure 57: Western Europe Noble Ferroalloys Market Y-o-Y Growth Rate Comparison by Type of Ferroalloy (2016-2032)
- Figure 58: Western Europe Noble Ferroalloys Market Y-o-Y Growth Rate Comparison by Application (2016-2032)
- Figure 59: Western Europe Noble Ferroalloys Market Y-o-Y Growth Rate Comparison by End User Industry (2016-2032)
- Figure 60: Western Europe Noble Ferroalloys Market Share Comparison by Country (2016-2032)
- Figure 61: Western Europe Noble Ferroalloys Market Share Comparison by Type of Ferroalloy (2016-2032)
- Figure 62: Western Europe Noble Ferroalloys Market Share Comparison by Application (2016-2032)
- Figure 63: Western Europe Noble Ferroalloys Market Share Comparison by End User Industry (2016-2032)
- Figure 64: Eastern Europe Noble Ferroalloys Market Revenue (US$ Mn) Market Share by Type of Ferroalloyin 2022
- Figure 65: Eastern Europe Noble Ferroalloys Market Attractiveness Analysis by Type of Ferroalloy, 2016-2032
- Figure 66: Eastern Europe Noble Ferroalloys Market Revenue (US$ Mn) Market Share by Applicationin 2022
- Figure 67: Eastern Europe Noble Ferroalloys Market Attractiveness Analysis by Application, 2016-2032
- Figure 68: Eastern Europe Noble Ferroalloys Market Revenue (US$ Mn) Market Share by End User Industryin 2022
- Figure 69: Eastern Europe Noble Ferroalloys Market Attractiveness Analysis by End User Industry, 2016-2032
- Figure 70: Eastern Europe Noble Ferroalloys Market Revenue (US$ Mn) Market Share by Country in 2022
- Figure 71: Eastern Europe Noble Ferroalloys Market Attractiveness Analysis by Country, 2016-2032
- Figure 72: Eastern Europe Noble Ferroalloys Market Revenue (US$ Mn) (2016-2032)
- Figure 73: Eastern Europe Noble Ferroalloys Market Revenue (US$ Mn) Comparison by Country (2016-2032)
- Figure 74: Eastern Europe Noble Ferroalloys Market Revenue (US$ Mn) Comparison by Type of Ferroalloy (2016-2032)
- Figure 75: Eastern Europe Noble Ferroalloys Market Revenue (US$ Mn) Comparison by Application (2016-2032)
- Figure 76: Eastern Europe Noble Ferroalloys Market Revenue (US$ Mn) Comparison by End User Industry (2016-2032)
- Figure 77: Eastern Europe Noble Ferroalloys Market Y-o-Y Growth Rate Comparison by Country (2016-2032)
- Figure 78: Eastern Europe Noble Ferroalloys Market Y-o-Y Growth Rate Comparison by Type of Ferroalloy (2016-2032)
- Figure 79: Eastern Europe Noble Ferroalloys Market Y-o-Y Growth Rate Comparison by Application (2016-2032)
- Figure 80: Eastern Europe Noble Ferroalloys Market Y-o-Y Growth Rate Comparison by End User Industry (2016-2032)
- Figure 81: Eastern Europe Noble Ferroalloys Market Share Comparison by Country (2016-2032)
- Figure 82: Eastern Europe Noble Ferroalloys Market Share Comparison by Type of Ferroalloy (2016-2032)
- Figure 83: Eastern Europe Noble Ferroalloys Market Share Comparison by Application (2016-2032)
- Figure 84: Eastern Europe Noble Ferroalloys Market Share Comparison by End User Industry (2016-2032)
- Figure 85: APAC Noble Ferroalloys Market Revenue (US$ Mn) Market Share by Type of Ferroalloyin 2022
- Figure 86: APAC Noble Ferroalloys Market Attractiveness Analysis by Type of Ferroalloy, 2016-2032
- Figure 87: APAC Noble Ferroalloys Market Revenue (US$ Mn) Market Share by Applicationin 2022
- Figure 88: APAC Noble Ferroalloys Market Attractiveness Analysis by Application, 2016-2032
- Figure 89: APAC Noble Ferroalloys Market Revenue (US$ Mn) Market Share by End User Industryin 2022
- Figure 90: APAC Noble Ferroalloys Market Attractiveness Analysis by End User Industry, 2016-2032
- Figure 91: APAC Noble Ferroalloys Market Revenue (US$ Mn) Market Share by Country in 2022
- Figure 92: APAC Noble Ferroalloys Market Attractiveness Analysis by Country, 2016-2032
- Figure 93: APAC Noble Ferroalloys Market Revenue (US$ Mn) (2016-2032)
- Figure 94: APAC Noble Ferroalloys Market Revenue (US$ Mn) Comparison by Country (2016-2032)
- Figure 95: APAC Noble Ferroalloys Market Revenue (US$ Mn) Comparison by Type of Ferroalloy (2016-2032)
- Figure 96: APAC Noble Ferroalloys Market Revenue (US$ Mn) Comparison by Application (2016-2032)
- Figure 97: APAC Noble Ferroalloys Market Revenue (US$ Mn) Comparison by End User Industry (2016-2032)
- Figure 98: APAC Noble Ferroalloys Market Y-o-Y Growth Rate Comparison by Country (2016-2032)
- Figure 99: APAC Noble Ferroalloys Market Y-o-Y Growth Rate Comparison by Type of Ferroalloy (2016-2032)
- Figure 100: APAC Noble Ferroalloys Market Y-o-Y Growth Rate Comparison by Application (2016-2032)
- Figure 101: APAC Noble Ferroalloys Market Y-o-Y Growth Rate Comparison by End User Industry (2016-2032)
- Figure 102: APAC Noble Ferroalloys Market Share Comparison by Country (2016-2032)
- Figure 103: APAC Noble Ferroalloys Market Share Comparison by Type of Ferroalloy (2016-2032)
- Figure 104: APAC Noble Ferroalloys Market Share Comparison by Application (2016-2032)
- Figure 105: APAC Noble Ferroalloys Market Share Comparison by End User Industry (2016-2032)
- Figure 106: Latin America Noble Ferroalloys Market Revenue (US$ Mn) Market Share by Type of Ferroalloyin 2022
- Figure 107: Latin America Noble Ferroalloys Market Attractiveness Analysis by Type of Ferroalloy, 2016-2032
- Figure 108: Latin America Noble Ferroalloys Market Revenue (US$ Mn) Market Share by Applicationin 2022
- Figure 109: Latin America Noble Ferroalloys Market Attractiveness Analysis by Application, 2016-2032
- Figure 110: Latin America Noble Ferroalloys Market Revenue (US$ Mn) Market Share by End User Industryin 2022
- Figure 111: Latin America Noble Ferroalloys Market Attractiveness Analysis by End User Industry, 2016-2032
- Figure 112: Latin America Noble Ferroalloys Market Revenue (US$ Mn) Market Share by Country in 2022
- Figure 113: Latin America Noble Ferroalloys Market Attractiveness Analysis by Country, 2016-2032
- Figure 114: Latin America Noble Ferroalloys Market Revenue (US$ Mn) (2016-2032)
- Figure 115: Latin America Noble Ferroalloys Market Revenue (US$ Mn) Comparison by Country (2016-2032)
- Figure 116: Latin America Noble Ferroalloys Market Revenue (US$ Mn) Comparison by Type of Ferroalloy (2016-2032)
- Figure 117: Latin America Noble Ferroalloys Market Revenue (US$ Mn) Comparison by Application (2016-2032)
- Figure 118: Latin America Noble Ferroalloys Market Revenue (US$ Mn) Comparison by End User Industry (2016-2032)
- Figure 119: Latin America Noble Ferroalloys Market Y-o-Y Growth Rate Comparison by Country (2016-2032)
- Figure 120: Latin America Noble Ferroalloys Market Y-o-Y Growth Rate Comparison by Type of Ferroalloy (2016-2032)
- Figure 121: Latin America Noble Ferroalloys Market Y-o-Y Growth Rate Comparison by Application (2016-2032)
- Figure 122: Latin America Noble Ferroalloys Market Y-o-Y Growth Rate Comparison by End User Industry (2016-2032)
- Figure 123: Latin America Noble Ferroalloys Market Share Comparison by Country (2016-2032)
- Figure 124: Latin America Noble Ferroalloys Market Share Comparison by Type of Ferroalloy (2016-2032)
- Figure 125: Latin America Noble Ferroalloys Market Share Comparison by Application (2016-2032)
- Figure 126: Latin America Noble Ferroalloys Market Share Comparison by End User Industry (2016-2032)
- Figure 127: Middle East & Africa Noble Ferroalloys Market Revenue (US$ Mn) Market Share by Type of Ferroalloyin 2022
- Figure 128: Middle East & Africa Noble Ferroalloys Market Attractiveness Analysis by Type of Ferroalloy, 2016-2032
- Figure 129: Middle East & Africa Noble Ferroalloys Market Revenue (US$ Mn) Market Share by Applicationin 2022
- Figure 130: Middle East & Africa Noble Ferroalloys Market Attractiveness Analysis by Application, 2016-2032
- Figure 131: Middle East & Africa Noble Ferroalloys Market Revenue (US$ Mn) Market Share by End User Industryin 2022
- Figure 132: Middle East & Africa Noble Ferroalloys Market Attractiveness Analysis by End User Industry, 2016-2032
- Figure 133: Middle East & Africa Noble Ferroalloys Market Revenue (US$ Mn) Market Share by Country in 2022
- Figure 134: Middle East & Africa Noble Ferroalloys Market Attractiveness Analysis by Country, 2016-2032
- Figure 135: Middle East & Africa Noble Ferroalloys Market Revenue (US$ Mn) (2016-2032)
- Figure 136: Middle East & Africa Noble Ferroalloys Market Revenue (US$ Mn) Comparison by Country (2016-2032)
- Figure 137: Middle East & Africa Noble Ferroalloys Market Revenue (US$ Mn) Comparison by Type of Ferroalloy (2016-2032)
- Figure 138: Middle East & Africa Noble Ferroalloys Market Revenue (US$ Mn) Comparison by Application (2016-2032)
- Figure 139: Middle East & Africa Noble Ferroalloys Market Revenue (US$ Mn) Comparison by End User Industry (2016-2032)
- Figure 140: Middle East & Africa Noble Ferroalloys Market Y-o-Y Growth Rate Comparison by Country (2016-2032)
- Figure 141: Middle East & Africa Noble Ferroalloys Market Y-o-Y Growth Rate Comparison by Type of Ferroalloy (2016-2032)
- Figure 142: Middle East & Africa Noble Ferroalloys Market Y-o-Y Growth Rate Comparison by Application (2016-2032)
- Figure 143: Middle East & Africa Noble Ferroalloys Market Y-o-Y Growth Rate Comparison by End User Industry (2016-2032)
- Figure 144: Middle East & Africa Noble Ferroalloys Market Share Comparison by Country (2016-2032)
- Figure 145: Middle East & Africa Noble Ferroalloys Market Share Comparison by Type of Ferroalloy (2016-2032)
- Figure 146: Middle East & Africa Noble Ferroalloys Market Share Comparison by Application (2016-2032)
- Figure 147: Middle East & Africa Noble Ferroalloys Market Share Comparison by End User Industry (2016-2032)
- List of Tables
- Table 1: Global Noble Ferroalloys Market Comparison by Type of Ferroalloy (2016-2032)
- Table 2: Global Noble Ferroalloys Market Comparison by Application (2016-2032)
- Table 3: Global Noble Ferroalloys Market Comparison by End User Industry (2016-2032)
- Table 4: Global Noble Ferroalloys Market Revenue (US$ Mn) Comparison by Region (2016-2032)
- Table 5: Global Noble Ferroalloys Market Revenue (US$ Mn) (2016-2032)
- Table 6: Global Noble Ferroalloys Market Revenue (US$ Mn) Comparison by Region (2016-2032)
- Table 7: Global Noble Ferroalloys Market Revenue (US$ Mn) Comparison by Type of Ferroalloy (2016-2032)
- Table 8: Global Noble Ferroalloys Market Revenue (US$ Mn) Comparison by Application (2016-2032)
- Table 9: Global Noble Ferroalloys Market Revenue (US$ Mn) Comparison by End User Industry (2016-2032)
- Table 10: Global Noble Ferroalloys Market Y-o-Y Growth Rate Comparison by Region (2016-2032)
- Table 11: Global Noble Ferroalloys Market Y-o-Y Growth Rate Comparison by Type of Ferroalloy (2016-2032)
- Table 12: Global Noble Ferroalloys Market Y-o-Y Growth Rate Comparison by Application (2016-2032)
- Table 13: Global Noble Ferroalloys Market Y-o-Y Growth Rate Comparison by End User Industry (2016-2032)
- Table 14: Global Noble Ferroalloys Market Share Comparison by Region (2016-2032)
- Table 15: Global Noble Ferroalloys Market Share Comparison by Type of Ferroalloy (2016-2032)
- Table 16: Global Noble Ferroalloys Market Share Comparison by Application (2016-2032)
- Table 17: Global Noble Ferroalloys Market Share Comparison by End User Industry (2016-2032)
- Table 18: North America Noble Ferroalloys Market Comparison by Application (2016-2032)
- Table 19: North America Noble Ferroalloys Market Comparison by End User Industry (2016-2032)
- Table 20: North America Noble Ferroalloys Market Revenue (US$ Mn) Comparison by Country (2016-2032)
- Table 21: North America Noble Ferroalloys Market Revenue (US$ Mn) (2016-2032)
- Table 22: North America Noble Ferroalloys Market Revenue (US$ Mn) Comparison by Country (2016-2032)
- Table 23: North America Noble Ferroalloys Market Revenue (US$ Mn) Comparison by Type of Ferroalloy (2016-2032)
- Table 24: North America Noble Ferroalloys Market Revenue (US$ Mn) Comparison by Application (2016-2032)
- Table 25: North America Noble Ferroalloys Market Revenue (US$ Mn) Comparison by End User Industry (2016-2032)
- Table 26: North America Noble Ferroalloys Market Y-o-Y Growth Rate Comparison by Country (2016-2032)
- Table 27: North America Noble Ferroalloys Market Y-o-Y Growth Rate Comparison by Type of Ferroalloy (2016-2032)
- Table 28: North America Noble Ferroalloys Market Y-o-Y Growth Rate Comparison by Application (2016-2032)
- Table 29: North America Noble Ferroalloys Market Y-o-Y Growth Rate Comparison by End User Industry (2016-2032)
- Table 30: North America Noble Ferroalloys Market Share Comparison by Country (2016-2032)
- Table 31: North America Noble Ferroalloys Market Share Comparison by Type of Ferroalloy (2016-2032)
- Table 32: North America Noble Ferroalloys Market Share Comparison by Application (2016-2032)
- Table 33: North America Noble Ferroalloys Market Share Comparison by End User Industry (2016-2032)
- Table 34: Western Europe Noble Ferroalloys Market Comparison by Type of Ferroalloy (2016-2032)
- Table 35: Western Europe Noble Ferroalloys Market Comparison by Application (2016-2032)
- Table 36: Western Europe Noble Ferroalloys Market Comparison by End User Industry (2016-2032)
- Table 37: Western Europe Noble Ferroalloys Market Revenue (US$ Mn) Comparison by Country (2016-2032)
- Table 38: Western Europe Noble Ferroalloys Market Revenue (US$ Mn) (2016-2032)
- Table 39: Western Europe Noble Ferroalloys Market Revenue (US$ Mn) Comparison by Country (2016-2032)
- Table 40: Western Europe Noble Ferroalloys Market Revenue (US$ Mn) Comparison by Type of Ferroalloy (2016-2032)
- Table 41: Western Europe Noble Ferroalloys Market Revenue (US$ Mn) Comparison by Application (2016-2032)
- Table 42: Western Europe Noble Ferroalloys Market Revenue (US$ Mn) Comparison by End User Industry (2016-2032)
- Table 43: Western Europe Noble Ferroalloys Market Y-o-Y Growth Rate Comparison by Country (2016-2032)
- Table 44: Western Europe Noble Ferroalloys Market Y-o-Y Growth Rate Comparison by Type of Ferroalloy (2016-2032)
- Table 45: Western Europe Noble Ferroalloys Market Y-o-Y Growth Rate Comparison by Application (2016-2032)
- Table 46: Western Europe Noble Ferroalloys Market Y-o-Y Growth Rate Comparison by End User Industry (2016-2032)
- Table 47: Western Europe Noble Ferroalloys Market Share Comparison by Country (2016-2032)
- Table 48: Western Europe Noble Ferroalloys Market Share Comparison by Type of Ferroalloy (2016-2032)
- Table 49: Western Europe Noble Ferroalloys Market Share Comparison by Application (2016-2032)
- Table 50: Western Europe Noble Ferroalloys Market Share Comparison by End User Industry (2016-2032)
- Table 51: Eastern Europe Noble Ferroalloys Market Comparison by Type of Ferroalloy (2016-2032)
- Table 52: Eastern Europe Noble Ferroalloys Market Comparison by Application (2016-2032)
- Table 53: Eastern Europe Noble Ferroalloys Market Comparison by End User Industry (2016-2032)
- Table 54: Eastern Europe Noble Ferroalloys Market Revenue (US$ Mn) Comparison by Country (2016-2032)
- Table 55: Eastern Europe Noble Ferroalloys Market Revenue (US$ Mn) (2016-2032)
- Table 56: Eastern Europe Noble Ferroalloys Market Revenue (US$ Mn) Comparison by Country (2016-2032)
- Table 57: Eastern Europe Noble Ferroalloys Market Revenue (US$ Mn) Comparison by Type of Ferroalloy (2016-2032)
- Table 58: Eastern Europe Noble Ferroalloys Market Revenue (US$ Mn) Comparison by Application (2016-2032)
- Table 59: Eastern Europe Noble Ferroalloys Market Revenue (US$ Mn) Comparison by End User Industry (2016-2032)
- Table 60: Eastern Europe Noble Ferroalloys Market Y-o-Y Growth Rate Comparison by Country (2016-2032)
- Table 61: Eastern Europe Noble Ferroalloys Market Y-o-Y Growth Rate Comparison by Type of Ferroalloy (2016-2032)
- Table 62: Eastern Europe Noble Ferroalloys Market Y-o-Y Growth Rate Comparison by Application (2016-2032)
- Table 63: Eastern Europe Noble Ferroalloys Market Y-o-Y Growth Rate Comparison by End User Industry (2016-2032)
- Table 64: Eastern Europe Noble Ferroalloys Market Share Comparison by Country (2016-2032)
- Table 65: Eastern Europe Noble Ferroalloys Market Share Comparison by Type of Ferroalloy (2016-2032)
- Table 66: Eastern Europe Noble Ferroalloys Market Share Comparison by Application (2016-2032)
- Table 67: Eastern Europe Noble Ferroalloys Market Share Comparison by End User Industry (2016-2032)
- Table 68: APAC Noble Ferroalloys Market Comparison by Type of Ferroalloy (2016-2032)
- Table 69: APAC Noble Ferroalloys Market Comparison by Application (2016-2032)
- Table 70: APAC Noble Ferroalloys Market Comparison by End User Industry (2016-2032)
- Table 71: APAC Noble Ferroalloys Market Revenue (US$ Mn) Comparison by Country (2016-2032)
- Table 72: APAC Noble Ferroalloys Market Revenue (US$ Mn) (2016-2032)
- Table 73: APAC Noble Ferroalloys Market Revenue (US$ Mn) Comparison by Country (2016-2032)
- Table 74: APAC Noble Ferroalloys Market Revenue (US$ Mn) Comparison by Type of Ferroalloy (2016-2032)
- Table 75: APAC Noble Ferroalloys Market Revenue (US$ Mn) Comparison by Application (2016-2032)
- Table 76: APAC Noble Ferroalloys Market Revenue (US$ Mn) Comparison by End User Industry (2016-2032)
- Table 77: APAC Noble Ferroalloys Market Y-o-Y Growth Rate Comparison by Country (2016-2032)
- Table 78: APAC Noble Ferroalloys Market Y-o-Y Growth Rate Comparison by Type of Ferroalloy (2016-2032)
- Table 79: APAC Noble Ferroalloys Market Y-o-Y Growth Rate Comparison by Application (2016-2032)
- Table 80: APAC Noble Ferroalloys Market Y-o-Y Growth Rate Comparison by End User Industry (2016-2032)
- Table 81: APAC Noble Ferroalloys Market Share Comparison by Country (2016-2032)
- Table 82: APAC Noble Ferroalloys Market Share Comparison by Type of Ferroalloy (2016-2032)
- Table 83: APAC Noble Ferroalloys Market Share Comparison by Application (2016-2032)
- Table 84: APAC Noble Ferroalloys Market Share Comparison by End User Industry (2016-2032)
- Table 85: Latin America Noble Ferroalloys Market Comparison by Type of Ferroalloy (2016-2032)
- Table 86: Latin America Noble Ferroalloys Market Comparison by Application (2016-2032)
- Table 87: Latin America Noble Ferroalloys Market Comparison by End User Industry (2016-2032)
- Table 88: Latin America Noble Ferroalloys Market Revenue (US$ Mn) Comparison by Country (2016-2032)
- Table 89: Latin America Noble Ferroalloys Market Revenue (US$ Mn) (2016-2032)
- Table 90: Latin America Noble Ferroalloys Market Revenue (US$ Mn) Comparison by Country (2016-2032)
- Table 91: Latin America Noble Ferroalloys Market Revenue (US$ Mn) Comparison by Type of Ferroalloy (2016-2032)
- Table 92: Latin America Noble Ferroalloys Market Revenue (US$ Mn) Comparison by Application (2016-2032)
- Table 93: Latin America Noble Ferroalloys Market Revenue (US$ Mn) Comparison by End User Industry (2016-2032)
- Table 94: Latin America Noble Ferroalloys Market Y-o-Y Growth Rate Comparison by Country (2016-2032)
- Table 95: Latin America Noble Ferroalloys Market Y-o-Y Growth Rate Comparison by Type of Ferroalloy (2016-2032)
- Table 96: Latin America Noble Ferroalloys Market Y-o-Y Growth Rate Comparison by Application (2016-2032)
- Table 97: Latin America Noble Ferroalloys Market Y-o-Y Growth Rate Comparison by End User Industry (2016-2032)
- Table 98: Latin America Noble Ferroalloys Market Share Comparison by Country (2016-2032)
- Table 99: Latin America Noble Ferroalloys Market Share Comparison by Type of Ferroalloy (2016-2032)
- Table 100: Latin America Noble Ferroalloys Market Share Comparison by Application (2016-2032)
- Table 101: Latin America Noble Ferroalloys Market Share Comparison by End User Industry (2016-2032)
- Table 102: Middle East & Africa Noble Ferroalloys Market Comparison by Type of Ferroalloy (2016-2032)
- Table 103: Middle East & Africa Noble Ferroalloys Market Comparison by Application (2016-2032)
- Table 104: Middle East & Africa Noble Ferroalloys Market Comparison by End User Industry (2016-2032)
- Table 105: Middle East & Africa Noble Ferroalloys Market Revenue (US$ Mn) Comparison by Country (2016-2032)
- Table 106: Middle East & Africa Noble Ferroalloys Market Revenue (US$ Mn) (2016-2032)
- Table 107: Middle East & Africa Noble Ferroalloys Market Revenue (US$ Mn) Comparison by Country (2016-2032)
- Table 108: Middle East & Africa Noble Ferroalloys Market Revenue (US$ Mn) Comparison by Type of Ferroalloy (2016-2032)
- Table 109: Middle East & Africa Noble Ferroalloys Market Revenue (US$ Mn) Comparison by Application (2016-2032)
- Table 110: Middle East & Africa Noble Ferroalloys Market Revenue (US$ Mn) Comparison by End User Industry (2016-2032)
- Table 111: Middle East & Africa Noble Ferroalloys Market Y-o-Y Growth Rate Comparison by Country (2016-2032)
- Table 112: Middle East & Africa Noble Ferroalloys Market Y-o-Y Growth Rate Comparison by Type of Ferroalloy (2016-2032)
- Table 113: Middle East & Africa Noble Ferroalloys Market Y-o-Y Growth Rate Comparison by Application (2016-2032)
- Table 114: Middle East & Africa Noble Ferroalloys Market Y-o-Y Growth Rate Comparison by End User Industry (2016-2032)
- Table 115: Middle East & Africa Noble Ferroalloys Market Share Comparison by Country (2016-2032)
- Table 116: Middle East & Africa Noble Ferroalloys Market Share Comparison by Type of Ferroalloy (2016-2032)
- Table 117: Middle East & Africa Noble Ferroalloys Market Share Comparison by Application (2016-2032)
- Table 118: Middle East & Africa Noble Ferroalloys Market Share Comparison by End User Industry (2016-2032)
- 1. Executive Summary
-
- Eurasian Resources Group (ERG)
- Glencore plc
- Samancor Chrome
- Tata Steel
- Erdos Group
- Henan Xibao Metallurgy Group Co., Ltd.
- Jindal Stainless Limited
- OM Holdings Ltd.
- Sakura Ferroalloys
- Ferroglobe
- China Minmetals Corporation
- Votorantim Metais
- Hindustan Ferro Alloy Industries
- Gulf Ferro Alloys Company (SABAYEK)
- Yildirim Group
Our Clients


View Our Licence Options
