
Mulberry Market By Product Type (Black, Red, White), By Nature (Organic, Conventional), By Form (Fruit, Raw/Fresh, Processed, Frozen/Chilled, Canned, Dehydrated, Pulp, Leaves, Leaf Extract), By End-Use (Households, Food Service, Food Industry, Infant formula, Sports Nutrition, Beverage Industry, Dietary supplements, Animal feed, Pharmaceutical Industry, Personal Care & Cosmetics), By Region and Companies - Industry Segment Outlook, Market Assessment, Competition Scenario, Trends and Forecast 2024-2033
-
4962
-
Aug 2024
-
300
-


-
This report was compiled by Shreyas Rokade Shreyas Rokade is a seasoned Research Analyst with CMFE, bringing extensive expertise in market research and consulting, with a strong background in Chemical Engineering. Correspondence Team Lead-CMFE Linkedin | Detailed Market research Methodology Our methodology involves a mix of primary research, including interviews with leading mental health experts, and secondary research from reputable medical journals and databases. View Detailed Methodology Page
-
Quick Navigation
Report Overview
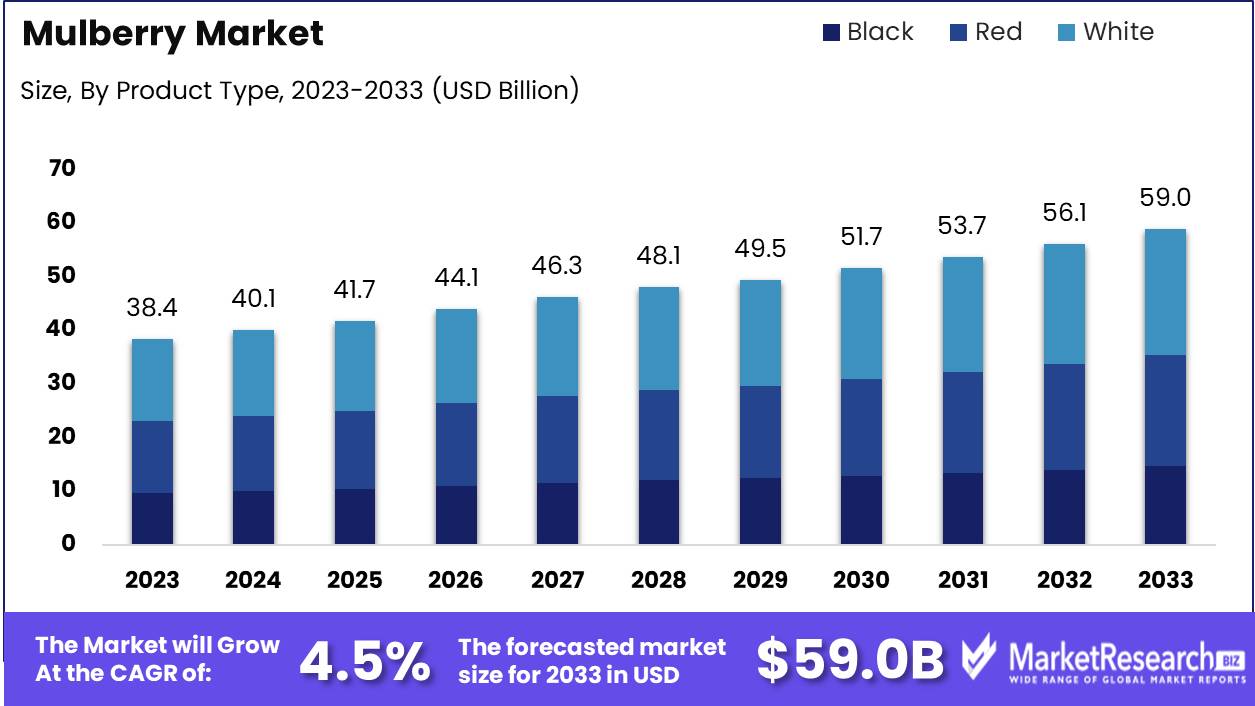
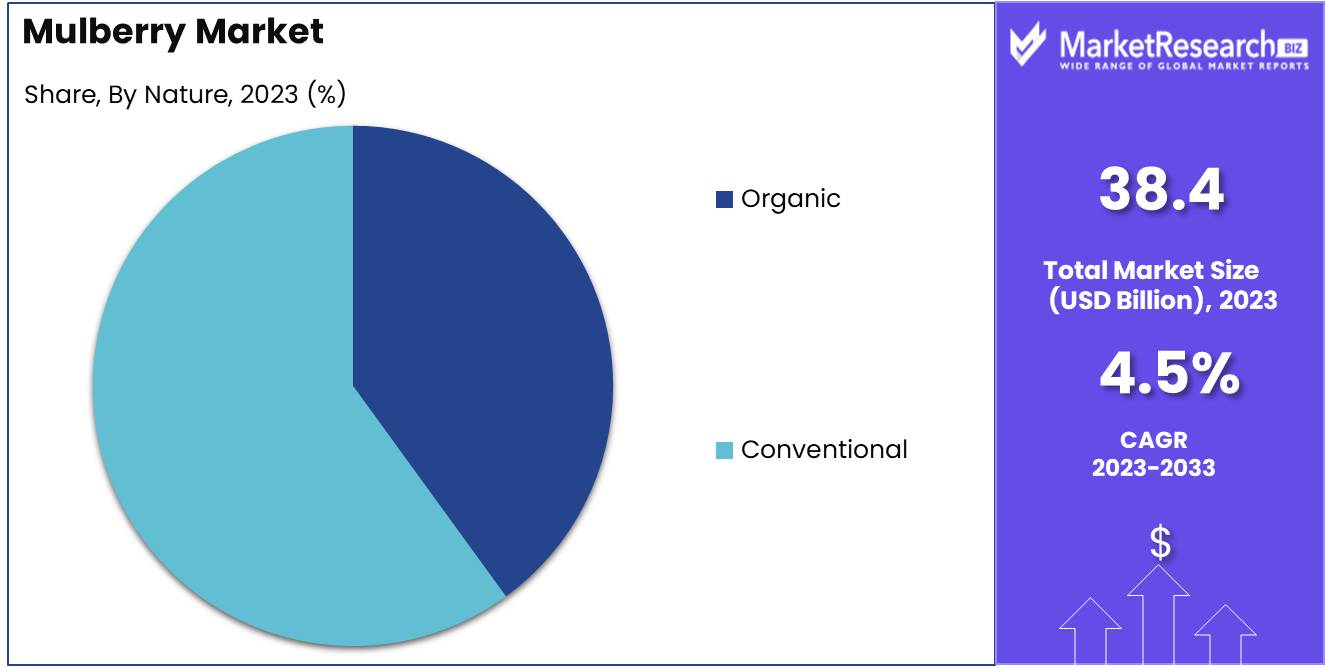
The Global Mulberry Market was valued at USD 38.4 Bn in 2023. It is expected to reach USD 59.0 Bn by 2033, with a CAGR of 4.5% during the forecast period from 2024 to 2033.
The Mulberry Market encompasses the cultivation, processing, and sale of mulberries and mulberry-derived products. This market is driven by the fruit’s applications in the food and beverage industry, its role in the silk industry, and its ecological benefits. The market is influenced by consumer demand for natural and nutritious foods, advancements in agricultural practices, and sustainability trends. Key players focus on quality, supply chain efficiency, and expanding product offerings to meet diverse consumer needs.
 The Mulberry Market is experiencing notable growth, driven by the fruit's multifaceted applications and increasing consumer interest in natural, nutritious foods. In the first 12 weeks of the 2024 financial year, Mulberry reported a remarkable 46% year-on-year increase in international retail sales, outpacing the flat performance of UK retail sales. This surge highlights the growing global demand and market expansion beyond traditional regions.
Mulberries have a rich historical significance, particularly in the silk industry where they have been integral since at least 220 AD. The leaves of the mulberry tree are the primary food source for silkworms, underpinning the production of silk. This longstanding connection continues to influence the market, especially in regions with established silk industries.
Ecologically, mulberries play a crucial role by providing food for wildlife and contributing to biodiversity. This environmental benefit aligns with the increasing consumer preference for sustainable and eco-friendly products, driving demand for mulberries in various sectors.
The market is also witnessing innovation in product offerings, ranging from fresh and dried mulberries to mulberry-based supplements and beverages. Advances in agricultural practices are improving yield and quality, meeting the rising consumer expectations for high-quality, natural products.
Key Takeaways
- Market Value: The Global Mulberry Market was valued at USD 38.4 Bn in 2023. It is expected to reach USD 59.0 Bn by 2033, with a CAGR of 4.5% during the forecast period from 2024 to 2033.
- By Product Type: White mulberries constitute 40% of the market, known for their sweet flavor and health benefits.
- By Nature: Conventional mulberries dominate with 60%, reflecting traditional farming practices.
- By Form: Raw/Fresh mulberries make up 30%, popular for direct consumption and culinary uses.
- By End-Use: Food Industry uses 25%, incorporating mulberries into various products.
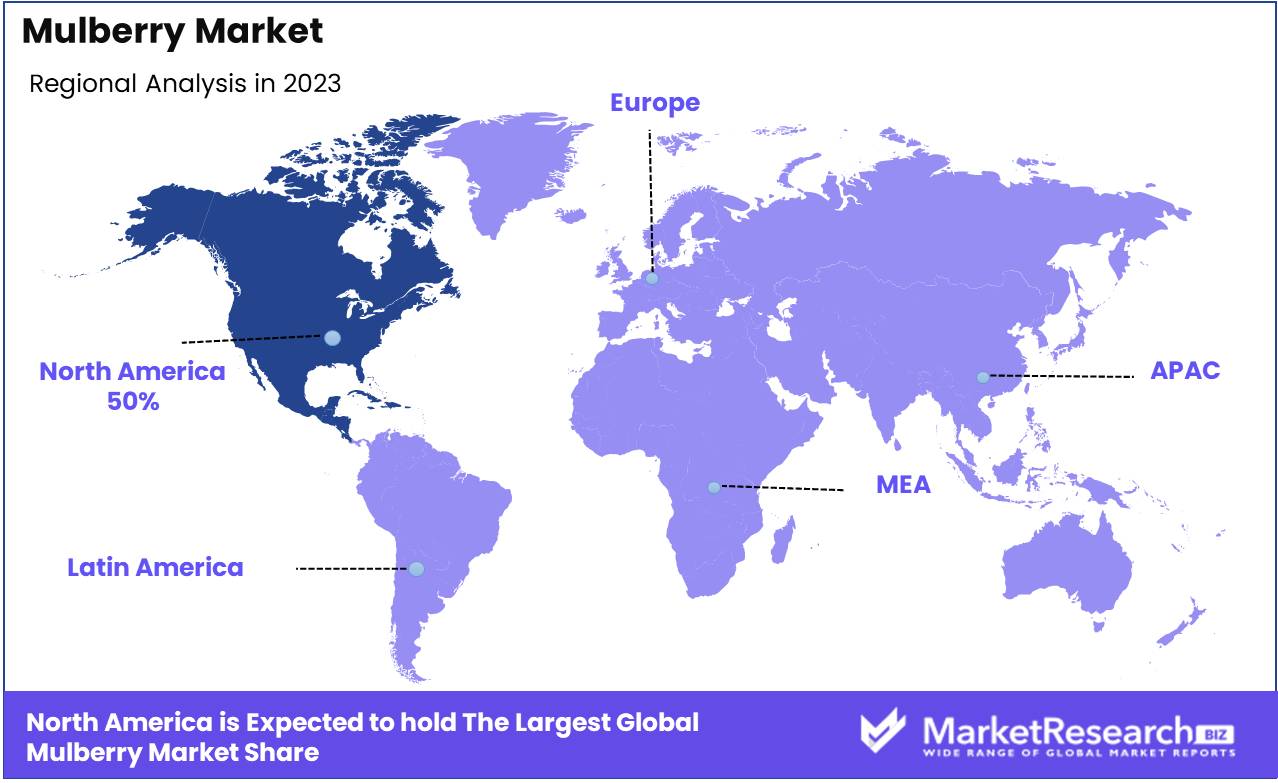
- Regional Dominance: North America holds a 50% market share, driven by high demand for health foods and nutritional products.
- Growth Opportunity: Expanding into value-added products like mulberry-based snacks and supplements can attract health-conscious consumers and enhance market growth.
Driving factors
Increasing Awareness of Health Benefits of Mulberries
The growing awareness of the health benefits associated with mulberries is a significant factor contributing to the market's expansion. Mulberries are rich in essential nutrients, antioxidants, and compounds such as resveratrol, which are known to offer various health benefits, including improved digestion, immune support, and anti-aging properties.
The increased dissemination of information through health campaigns, social media, and scientific studies has heightened consumer awareness, leading to a greater demand for mulberry products. As more consumers seek natural and nutritious options to enhance their well-being, the market for mulberries is expected to grow substantially.
Growing Demand for Superfoods and Functional Foods
The rising demand for superfoods and functional foods is another critical driver for the mulberry market. Superfoods, including mulberries, are celebrated for their high nutrient density and health benefits. The global trend towards healthier eating habits and the incorporation of functional foods into daily diets is fueling this demand. Mulberries, with their rich antioxidant content and various vitamins and minerals, are increasingly being recognized as a valuable superfood.
This trend is particularly strong among health-conscious consumers and those looking to prevent chronic diseases through diet. The integration of mulberries into various food products, such as smoothies, snacks, and cereals, is further boosting their popularity and market reach.
Expansion in Nutraceutical and Dietary Supplement Industries
The expansion of the nutraceutical and dietary supplement industries is a significant factor contributing to the growth of the mulberry market. Mulberries are increasingly being used in the formulation of dietary supplements and nutraceutical products due to their high content of vitamins, minerals, and antioxidants.
These products appeal to consumers seeking convenient and effective ways to improve their health and prevent diseases. The global nutraceutical market's growth, driven by an aging population and rising healthcare costs, is providing lucrative opportunities for mulberry-based products. As more manufacturers incorporate mulberry extracts into their product lines, the demand for raw mulberries is expected to rise, driving market growth.
Restraining Factors
Seasonal Availability and Limited Production
The mulberry market faces significant challenges due to the seasonal availability and limited production of mulberries. As a fruit that thrives in specific climatic conditions, mulberries are only available during certain times of the year, which restricts their supply. This seasonality can lead to price volatility and inconsistency in product availability, affecting both consumer demand and manufacturer supply chains.
Limited production capacity further exacerbates this issue, as not all regions are suitable for mulberry cultivation. Consequently, the market struggles to meet growing consumer demand year-round, potentially hindering market growth and expansion.
Competition from Other Berries and Superfoods
The mulberry market also contends with substantial competition from other berries and superfoods. Berries such as blueberries, raspberries, and goji berries, along with a variety of other superfoods like acai and chia seeds, offer similar health benefits and are often more readily available.
These alternatives are well-established in the market, enjoying widespread consumer recognition and robust supply chains. Mulberries must compete for market share, and their relative novelty can be a disadvantage. Consumers seeking health benefits may opt for more familiar and accessible options, thus limiting the growth potential of the mulberry market.
By Product Type Analysis
White held a dominant market position in the By Product Type segment of the Mulberry Market, capturing more than a 40% share.
In 2023, White mulberries dominated the By Product Type segment of the Mulberry Market, capturing more than a 40% share. White mulberries are favored for their mild, sweet taste and versatility in various culinary and medicinal applications. Their popularity in the health food sector, due to their high antioxidant content and potential benefits for blood sugar control, significantly contributes to their market leadership.
Black mulberries, known for their rich flavor and high nutrient content, follow closely. They are widely used in jams, jellies, and desserts. Red mulberries, though less common, are appreciated for their unique taste and are used in niche markets.
By Nature Analysis
Conventional held a dominant market position in the By Nature segment of the Mulberry Market, capturing more than a 60% share.
In 2023, Conventional mulberries held a dominant market position in the By Nature segment of the Mulberry Market, capturing more than a 60% share. Conventional farming practices enable higher yields and cost-effective production, making these mulberries more accessible and affordable for a broader consumer base.
Organic mulberries, while gaining traction due to increasing health consciousness and demand for pesticide-free produce, still represent a smaller share of the market. However, the organic segment is expected to grow as consumers continue to prioritize health and sustainability.
By Form Analysis
Raw/Fresh held a dominant market position in the By Form segment of the Mulberry Market, capturing more than a 30% share.
In 2023, Raw/Fresh mulberries led the By Form segment of the Mulberry Market, capturing more than a 30% share. The demand for fresh mulberries is driven by their use in smoothies, salads, and as fresh fruit snacks, favored for their natural taste and health benefits.
Processed mulberries, including those used in jams, jellies, and dried forms, are also significant, appealing to consumers seeking longer shelf life and convenience. Frozen/Chilled and Canned mulberries cater to the need for year-round availability. Dehydrated mulberries are popular as healthy snacks and ingredients in trail mixes. Pulp, Leaves, and Leaf Extract are utilized in various health and wellness products, leveraging the medicinal properties of mulberries.
By End-Use Analysis
In 2023, Food Industry held a dominant market position in the By End-Use segment of the Mulberry Market, capturing more than a 25% share.
In 2023, the Food Industry dominated the By End-Use segment of the Mulberry Market, capturing more than a 25% share. The food industry's demand for mulberries spans the production of jams, jellies, baked goods, and health snacks, driving significant market growth.
Households follow as substantial consumers, purchasing mulberries for fresh consumption and homemade preserves. The Food Service sector, including restaurants and cafes, utilizes mulberries in various dishes and beverages, contributing to the market's expansion.
Key Market Segments
By Product Type
- Black
- Red
- White
By Nature
- Organic
- Conventional
By Form
- Fruit
- Raw/Fresh
- Processed
- Frozen/Chilled
- Canned
- Dehydrated
- Pulp
- Leaves
- Leaf Extract
By End-Use
- Households
- Food Service
- Food Industry
- Bakery & Confectionary
- Convenience food
- Jams, jellies, and pickles
- Dressings, dips, and condiments
- Others (Frozen desserts, Snacks & Cereals)
- Infant formula
- Sports Nutrition
- Beverage Industry
- Dietary supplements
- Animal feed
- Pharmaceutical Industry
- Personal Care & Cosmetics
Growth Opportunity
Development of Mulberry-Based Products
In 2024, the global mulberry market stands to benefit significantly from the development of mulberry-based products such as juices, powders, and fruit snacks. As consumer interest in health and wellness continues to rise, there is a growing demand for convenient, nutrient-rich food and beverage options. Mulberry-based products offer a versatile and attractive choice for health-conscious consumers.
Juices and smoothies made from mulberries provide a refreshing and nutritious alternative to traditional fruit juices, healthy energy drink, while mulberry powders can be easily incorporated into various recipes and dietary supplements. Additionally, mulberry snacks cater to the increasing demand for healthy, on-the-go options. This product diversification not only meets consumer needs but also opens new revenue streams for producers and retailers.
Expansion in Organic and Sustainable Farming Practices
The expansion of organic and sustainable farming practices presents another significant opportunity for the mulberry market. Consumers are increasingly concerned about the environmental impact of their food choices and are gravitating towards products that are grown sustainably. By adopting organic farming methods, mulberry producers can appeal to this growing segment of eco-conscious consumers. Organic mulberries are free from synthetic pesticides and fertilizers, making them a healthier choice for both consumers and the environment.
Sustainable farming practices can enhance soil stabilization, increase biodiversity, and improve long-term productivity, ensuring a stable supply of high-quality mulberries. This focus on sustainability not only meets consumer demand but also aligns with broader environmental goals, strengthening the market's position.
Latest Trends
Use of Mulberries in Gourmet and Specialty Food Products
In 2024, the incorporation of mulberries into gourmet and specialty food products is set to be a significant trend shaping the market. As consumers seek unique and premium culinary experiences, mulberries are increasingly being featured in high-end food items such as artisanal jams, gourmet desserts, and specialty sauces.
This trend is driven by the fruit’s distinct flavor profile and its perceived health benefits, which appeal to discerning food enthusiasts and chefs. The use of mulberries in gourmet products not only enhances the fruit’s market visibility but also positions it as a luxury ingredient, thereby commanding higher prices and increasing market value.
Increasing Demand for Dried Mulberries as a Healthy Snack
The rising demand for healthy snacks is another key trend propelling the mulberry market forward in 2024. Dried mulberries, in particular, are gaining popularity as a nutritious and convenient snack option. Rich in fiber, vitamins, and antioxidants, dried mulberries cater to health-conscious consumers looking for snacks that provide both taste and nutritional benefits.
The portability and long shelf life of dried mulberries make them an ideal choice for on-the-go snacking, further driving their demand. This trend aligns with the broader movement towards healthier eating habits and the increasing preference for natural and minimally processed foods.
Regional Analysis
North America led the Mulberry Market in 2023, with a commanding 50% market share.
In 2023, North America emerged as the leading region in the Mulberry Market, holding a commanding 50% market share. The region's dominance is driven by the growing awareness of the health benefits associated with mulberries, including their high antioxidant content and potential in supporting cardiovascular health. The United States, in particular, has seen a surge in demand for mulberry-based products, ranging from fresh and dried berries to supplements and mulberry leaf tea. The presence of advanced agricultural practices and high consumer spending on health and wellness products further bolster the market in North America.
Europe follows as a significant market, with a strong preference for mulberry products in the health and wellness sectors. The Asia Pacific region, known for its traditional use of mulberries in both food and medicine, continues to grow steadily. Latin America and the Middle East & Africa are emerging markets, with increasing cultivation and consumption of mulberries driven by health trends.
Key Regions and Countries
North America
- US
- Canada
- Mexico
Western Europe
- Germany
- France
- The UK
- Spain
- Italy
- Portugal
- Ireland
- Austria
- Switzerland
- Benelux
- Nordic
- Rest of Western Europe
Eastern Europe
- Russia
- Poland
- The Czech Republic
- Greece
- Rest of Eastern Europe
APAC
- China
- Japan
- South Korea
- India
- Australia & New Zealand
- Indonesia
- Malaysia
- Philippines
- Singapore
- Thailand
- Vietnam
- Rest of APAC
Latin America
- Brazil
- Colombia
- Chile
- Argentina
- Costa Rica
- Rest of Latin America
Middle East & Africa
- Algeria
- Egypt
- Israel
- Kuwait
- Nigeria
- Saudi Arabia
- South Africa
- Turkey
- United Arab Emirates
- Rest of MEA
Key Players Analysis
The global Mulberry Market is poised for substantial growth in 2024, driven by increasing awareness of the health benefits associated with mulberries and their derivatives. Leading companies such as Bolt Threads and Novartis are spearheading research and development efforts to harness the medicinal properties and nutritional value of mulberries.
Silk Road Holdings and Body Shop are focusing on integrating mulberry extracts into cosmetic and skincare products, capitalizing on the trend towards natural and organic beauty solutions. Sunrise Agriland Development & Research Pvt. Ltd. and BATA FOOD are expanding their agricultural initiatives to ensure a steady supply of high-quality mulberries, catering to both domestic and international markets.
Top Line Foods and Peony Food Products are emphasizing the development of innovative mulberry-based food and beverage products, appealing to health-conscious consumers seeking natural and nutritious options. Yaban Food and NAVITAS ORGANICS are leveraging their strong distribution networks to enhance market penetration and reach a wider audience.
Sevenhills Wholefoods and Xian Yuensun Biological Technology Co. Ltd. are investing in advanced processing techniques to improve the quality and shelf-life of mulberry products. Dragon Superfoods and Earth Circle Organics are focusing on sustainability and ethical sourcing practices to appeal to environmentally conscious consumers.
The competitive landscape of the Mulberry Market in 2024 will be shaped by continued innovation, strategic partnerships, and a strong emphasis on sustainability and health benefits. Companies that can effectively communicate the unique advantages of mulberries and develop products that meet consumer needs are likely to secure a competitive edge in this growing market.
Market Key Players
- Bolt Threads
- Novartis
- Silk Road Holdings
- Body Shop
- Sunrise Agriland Development & Research Pvt. Ltd.
- BATA FOOD
- Top Line Foods
- Peony Food Products
- Yaban Food
- NAVITAS ORGANICS
- Sevenhills Wholefoods
- Xian Yuensun Biological Technology Co. Ltd.
- Dragon Superfoods
- Earth Circle Organics
- Other
Recent Development
- In May 2024, Dragon Superfoods secured $5 million in funding to expand their production facilities for mulberry products. This investment is projected to increase their production capacity by 20%.
- In March 2024, Top Line Foods introduced a mulberry-based energy bar, targeting fitness enthusiasts. This product launch aims to boost sales by 15%.
Report Scope
Report Features Description Market Value (2023) USD 38.4 Bn Forecast Revenue (2033) USD 59.0 Bn CAGR (2024-2033) 4.5% Base Year for Estimation 2023 Historic Period 2018-2023 Forecast Period 2024-2033 Report Coverage Revenue Forecast, Market Dynamics, Competitive Landscape, Recent Developments Segments Covered By Product Type (Black, Red, White), By Nature (Organic, Conventional), By Form (Fruit, Raw/Fresh, Processed, Frozen/Chilled, Canned, Dehydrated, Pulp, Leaves, Leaf Extract), By End-Use (Households, Food Service, Food Industry, Infant formula, Sports Nutrition, Beverage Industry, Dietary supplements, Animal feed, Pharmaceutical Industry, Personal Care & Cosmetics) Regional Analysis North America - The US, Canada, & Mexico; Western Europe - Germany, France, The UK, Spain, Italy, Portugal, Ireland, Austria, Switzerland, Benelux, Nordic, & Rest of Western Europe; Eastern Europe - Russia, Poland, The Czech Republic, Greece, & Rest of Eastern Europe; APAC - China, Japan, South Korea, India, Australia & New Zealand, Indonesia, Malaysia, Philippines, Singapore, Thailand, Vietnam, & Rest of APAC; Latin America - Brazil, Colombia, Chile, Argentina, Costa Rica, & Rest of Latin America; Middle East & Africa - Algeria, Egypt, Israel, Kuwait, Nigeria, Saudi Arabia, South Africa, Turkey, United Arab Emirates, & Rest of MEA Competitive Landscape Bolt Threads, Novartis, Silk Road Holdings, Body Shop, Sunrise Agriland Development & Research Pvt. Ltd., BATA FOOD, Top Line Foods, Peony Food Products, Yaban Food, NAVITAS ORGANICS, Sevenhills Wholefoods, Xian Yuensun Biological Technology Co. Ltd., Dragon Superfoods, Earth Circle Organics, Other Customization Scope Customization for segments, region/country-level will be provided. Moreover, additional customization can be done based on the requirements. Purchase Options We have three licenses to opt for: Single User License, Multi-User License (Up to 5 Users), Corporate Use License (Unlimited User and Printable PDF) -
- 1. Executive Summary
- 1.1. Definition
- 1.2. Taxonomy
- 1.3. Research Scope
- 1.4. Key Analysis
- 1.5. Key Findings by Major Segments
- 1.6. Top strategies by Major Players
- 2. Global Mulberry Market Overview
- 2.1. Mulberry Market Dynamics
- 2.1.1. Drivers
- 2.1.2. Opportunities
- 2.1.3. Restraints
- 2.1.4. Challenges
- 2.2. Macro-economic Factors
- 2.3. Regulatory Framework
- 2.4. Market Investment Feasibility Index
- 2.5. PEST Analysis
- 2.6. PORTER’S Five Force Analysis
- 2.7. Drivers & Restraints Impact Analysis
- 2.8. Industry Chain Analysis
- 2.9. Cost Structure Analysis
- 2.10. Marketing Strategy
- 2.11. Russia-Ukraine War Impact Analysis
- 2.12. Opportunity Map Analysis
- 2.13. Market Competition Scenario Analysis
- 2.14. Product Life Cycle Analysis
- 2.15. Opportunity Orbits
- 2.16. Manufacturer Intensity Map
- 2.17. Major Companies sales by Value & Volume
- 2.1. Mulberry Market Dynamics
- 3. Global Mulberry Market Analysis, Opportunity and Forecast, 2016-2032
- 3.1. Global Mulberry Market Analysis, 2016-2021
- 3.2. Global Mulberry Market Opportunity and Forecast, 2023-2032
- 3.3. Global Mulberry Market Analysis, Opportunity and Forecast, By By Product Type, 2016-2032
- 3.3.1. Global Mulberry Market Analysis by By Product Type: Introduction
- 3.3.2. Market Size Absolute $ Opportunity Analysis and Forecast, By By Product Type, 2016-2032
- 3.3.3. Handbags
- 3.3.4. Small Leather Goods
- 3.3.5. Ready-to-Wear
- 3.3.6. Shoes
- 3.4. Global Mulberry Market Analysis, Opportunity and Forecast, By By Distribution Channel, 2016-2032
- 3.4.1. Global Mulberry Market Analysis by By Distribution Channel: Introduction
- 3.4.2. Market Size Absolute $ Opportunity Analysis and Forecast, By By Distribution Channel, 2016-2032
- 3.4.3. Retail Stores
- 3.4.4. E-commerce Platforms
- 3.4.5. Travel Retail
- 3.4.6. Online Marketplaces
- 3.5. Global Mulberry Market Analysis, Opportunity and Forecast, By By Form, 2016-2032
- 3.5.1. Global Mulberry Market Analysis by By Form: Introduction
- 3.5.2. Market Size Absolute $ Opportunity Analysis and Forecast, By By Form, 2016-2032
- 3.5.3. Fruit
- 3.5.4. Raw/Fresh
- 3.5.5. Processed
- 3.5.6. Frozen/Chilled
- 3.5.7. Canned
- 3.5.8. Dehydrated
- 4. North America Mulberry Market Analysis, Opportunity and Forecast, 2016-2032
- 4.1. North America Mulberry Market Analysis, 2016-2021
- 4.2. North America Mulberry Market Opportunity and Forecast, 2023-2032
- 4.3. North America Mulberry Market Analysis, Opportunity and Forecast, By By Product Type, 2016-2032
- 4.3.1. North America Mulberry Market Analysis by By Product Type: Introduction
- 4.3.2. Market Size Absolute $ Opportunity Analysis and Forecast, By By Product Type, 2016-2032
- 4.3.3. Handbags
- 4.3.4. Small Leather Goods
- 4.3.5. Ready-to-Wear
- 4.3.6. Shoes
- 4.4. North America Mulberry Market Analysis, Opportunity and Forecast, By By Distribution Channel, 2016-2032
- 4.4.1. North America Mulberry Market Analysis by By Distribution Channel: Introduction
- 4.4.2. Market Size Absolute $ Opportunity Analysis and Forecast, By By Distribution Channel, 2016-2032
- 4.4.3. Retail Stores
- 4.4.4. E-commerce Platforms
- 4.4.5. Travel Retail
- 4.4.6. Online Marketplaces
- 4.5. North America Mulberry Market Analysis, Opportunity and Forecast, By By Form, 2016-2032
- 4.5.1. North America Mulberry Market Analysis by By Form: Introduction
- 4.5.2. Market Size Absolute $ Opportunity Analysis and Forecast, By By Form, 2016-2032
- 4.5.3. Fruit
- 4.5.4. Raw/Fresh
- 4.5.5. Processed
- 4.5.6. Frozen/Chilled
- 4.5.7. Canned
- 4.5.8. Dehydrated
- 4.6. North America Mulberry Market Analysis, Opportunity and Forecast, By Country , 2016-2032
- 4.6.1. North America Mulberry Market Analysis by Country : Introduction
- 4.6.2. Market Size Absolute $ Opportunity Analysis and Forecast, Country , 2016-2032
- 4.6.2.1. The US
- 4.6.2.2. Canada
- 4.6.2.3. Mexico
- 5. Western Europe Mulberry Market Analysis, Opportunity and Forecast, 2016-2032
- 5.1. Western Europe Mulberry Market Analysis, 2016-2021
- 5.2. Western Europe Mulberry Market Opportunity and Forecast, 2023-2032
- 5.3. Western Europe Mulberry Market Analysis, Opportunity and Forecast, By By Product Type, 2016-2032
- 5.3.1. Western Europe Mulberry Market Analysis by By Product Type: Introduction
- 5.3.2. Market Size Absolute $ Opportunity Analysis and Forecast, By By Product Type, 2016-2032
- 5.3.3. Handbags
- 5.3.4. Small Leather Goods
- 5.3.5. Ready-to-Wear
- 5.3.6. Shoes
- 5.4. Western Europe Mulberry Market Analysis, Opportunity and Forecast, By By Distribution Channel, 2016-2032
- 5.4.1. Western Europe Mulberry Market Analysis by By Distribution Channel: Introduction
- 5.4.2. Market Size Absolute $ Opportunity Analysis and Forecast, By By Distribution Channel, 2016-2032
- 5.4.3. Retail Stores
- 5.4.4. E-commerce Platforms
- 5.4.5. Travel Retail
- 5.4.6. Online Marketplaces
- 5.5. Western Europe Mulberry Market Analysis, Opportunity and Forecast, By By Form, 2016-2032
- 5.5.1. Western Europe Mulberry Market Analysis by By Form: Introduction
- 5.5.2. Market Size Absolute $ Opportunity Analysis and Forecast, By By Form, 2016-2032
- 5.5.3. Fruit
- 5.5.4. Raw/Fresh
- 5.5.5. Processed
- 5.5.6. Frozen/Chilled
- 5.5.7. Canned
- 5.5.8. Dehydrated
- 5.6. Western Europe Mulberry Market Analysis, Opportunity and Forecast, By Country , 2016-2032
- 5.6.1. Western Europe Mulberry Market Analysis by Country : Introduction
- 5.6.2. Market Size Absolute $ Opportunity Analysis and Forecast, Country , 2016-2032
- 5.6.2.1. Germany
- 5.6.2.2. France
- 5.6.2.3. The UK
- 5.6.2.4. Spain
- 5.6.2.5. Italy
- 5.6.2.6. Portugal
- 5.6.2.7. Ireland
- 5.6.2.8. Austria
- 5.6.2.9. Switzerland
- 5.6.2.10. Benelux
- 5.6.2.11. Nordic
- 5.6.2.12. Rest of Western Europe
- 6. Eastern Europe Mulberry Market Analysis, Opportunity and Forecast, 2016-2032
- 6.1. Eastern Europe Mulberry Market Analysis, 2016-2021
- 6.2. Eastern Europe Mulberry Market Opportunity and Forecast, 2023-2032
- 6.3. Eastern Europe Mulberry Market Analysis, Opportunity and Forecast, By By Product Type, 2016-2032
- 6.3.1. Eastern Europe Mulberry Market Analysis by By Product Type: Introduction
- 6.3.2. Market Size Absolute $ Opportunity Analysis and Forecast, By By Product Type, 2016-2032
- 6.3.3. Handbags
- 6.3.4. Small Leather Goods
- 6.3.5. Ready-to-Wear
- 6.3.6. Shoes
- 6.4. Eastern Europe Mulberry Market Analysis, Opportunity and Forecast, By By Distribution Channel, 2016-2032
- 6.4.1. Eastern Europe Mulberry Market Analysis by By Distribution Channel: Introduction
- 6.4.2. Market Size Absolute $ Opportunity Analysis and Forecast, By By Distribution Channel, 2016-2032
- 6.4.3. Retail Stores
- 6.4.4. E-commerce Platforms
- 6.4.5. Travel Retail
- 6.4.6. Online Marketplaces
- 6.5. Eastern Europe Mulberry Market Analysis, Opportunity and Forecast, By By Form, 2016-2032
- 6.5.1. Eastern Europe Mulberry Market Analysis by By Form: Introduction
- 6.5.2. Market Size Absolute $ Opportunity Analysis and Forecast, By By Form, 2016-2032
- 6.5.3. Fruit
- 6.5.4. Raw/Fresh
- 6.5.5. Processed
- 6.5.6. Frozen/Chilled
- 6.5.7. Canned
- 6.5.8. Dehydrated
- 6.6. Eastern Europe Mulberry Market Analysis, Opportunity and Forecast, By Country , 2016-2032
- 6.6.1. Eastern Europe Mulberry Market Analysis by Country : Introduction
- 6.6.2. Market Size Absolute $ Opportunity Analysis and Forecast, Country , 2016-2032
- 6.6.2.1. Russia
- 6.6.2.2. Poland
- 6.6.2.3. The Czech Republic
- 6.6.2.4. Greece
- 6.6.2.5. Rest of Eastern Europe
- 7. APAC Mulberry Market Analysis, Opportunity and Forecast, 2016-2032
- 7.1. APAC Mulberry Market Analysis, 2016-2021
- 7.2. APAC Mulberry Market Opportunity and Forecast, 2023-2032
- 7.3. APAC Mulberry Market Analysis, Opportunity and Forecast, By By Product Type, 2016-2032
- 7.3.1. APAC Mulberry Market Analysis by By Product Type: Introduction
- 7.3.2. Market Size Absolute $ Opportunity Analysis and Forecast, By By Product Type, 2016-2032
- 7.3.3. Handbags
- 7.3.4. Small Leather Goods
- 7.3.5. Ready-to-Wear
- 7.3.6. Shoes
- 7.4. APAC Mulberry Market Analysis, Opportunity and Forecast, By By Distribution Channel, 2016-2032
- 7.4.1. APAC Mulberry Market Analysis by By Distribution Channel: Introduction
- 7.4.2. Market Size Absolute $ Opportunity Analysis and Forecast, By By Distribution Channel, 2016-2032
- 7.4.3. Retail Stores
- 7.4.4. E-commerce Platforms
- 7.4.5. Travel Retail
- 7.4.6. Online Marketplaces
- 7.5. APAC Mulberry Market Analysis, Opportunity and Forecast, By By Form, 2016-2032
- 7.5.1. APAC Mulberry Market Analysis by By Form: Introduction
- 7.5.2. Market Size Absolute $ Opportunity Analysis and Forecast, By By Form, 2016-2032
- 7.5.3. Fruit
- 7.5.4. Raw/Fresh
- 7.5.5. Processed
- 7.5.6. Frozen/Chilled
- 7.5.7. Canned
- 7.5.8. Dehydrated
- 7.6. APAC Mulberry Market Analysis, Opportunity and Forecast, By Country , 2016-2032
- 7.6.1. APAC Mulberry Market Analysis by Country : Introduction
- 7.6.2. Market Size Absolute $ Opportunity Analysis and Forecast, Country , 2016-2032
- 7.6.2.1. China
- 7.6.2.2. Japan
- 7.6.2.3. South Korea
- 7.6.2.4. India
- 7.6.2.5. Australia & New Zeland
- 7.6.2.6. Indonesia
- 7.6.2.7. Malaysia
- 7.6.2.8. Philippines
- 7.6.2.9. Singapore
- 7.6.2.10. Thailand
- 7.6.2.11. Vietnam
- 7.6.2.12. Rest of APAC
- 8. Latin America Mulberry Market Analysis, Opportunity and Forecast, 2016-2032
- 8.1. Latin America Mulberry Market Analysis, 2016-2021
- 8.2. Latin America Mulberry Market Opportunity and Forecast, 2023-2032
- 8.3. Latin America Mulberry Market Analysis, Opportunity and Forecast, By By Product Type, 2016-2032
- 8.3.1. Latin America Mulberry Market Analysis by By Product Type: Introduction
- 8.3.2. Market Size Absolute $ Opportunity Analysis and Forecast, By By Product Type, 2016-2032
- 8.3.3. Handbags
- 8.3.4. Small Leather Goods
- 8.3.5. Ready-to-Wear
- 8.3.6. Shoes
- 8.4. Latin America Mulberry Market Analysis, Opportunity and Forecast, By By Distribution Channel, 2016-2032
- 8.4.1. Latin America Mulberry Market Analysis by By Distribution Channel: Introduction
- 8.4.2. Market Size Absolute $ Opportunity Analysis and Forecast, By By Distribution Channel, 2016-2032
- 8.4.3. Retail Stores
- 8.4.4. E-commerce Platforms
- 8.4.5. Travel Retail
- 8.4.6. Online Marketplaces
- 8.5. Latin America Mulberry Market Analysis, Opportunity and Forecast, By By Form, 2016-2032
- 8.5.1. Latin America Mulberry Market Analysis by By Form: Introduction
- 8.5.2. Market Size Absolute $ Opportunity Analysis and Forecast, By By Form, 2016-2032
- 8.5.3. Fruit
- 8.5.4. Raw/Fresh
- 8.5.5. Processed
- 8.5.6. Frozen/Chilled
- 8.5.7. Canned
- 8.5.8. Dehydrated
- 8.6. Latin America Mulberry Market Analysis, Opportunity and Forecast, By Country , 2016-2032
- 8.6.1. Latin America Mulberry Market Analysis by Country : Introduction
- 8.6.2. Market Size Absolute $ Opportunity Analysis and Forecast, Country , 2016-2032
- 8.6.2.1. Brazil
- 8.6.2.2. Colombia
- 8.6.2.3. Chile
- 8.6.2.4. Argentina
- 8.6.2.5. Costa Rica
- 8.6.2.6. Rest of Latin America
- 9. Middle East & Africa Mulberry Market Analysis, Opportunity and Forecast, 2016-2032
- 9.1. Middle East & Africa Mulberry Market Analysis, 2016-2021
- 9.2. Middle East & Africa Mulberry Market Opportunity and Forecast, 2023-2032
- 9.3. Middle East & Africa Mulberry Market Analysis, Opportunity and Forecast, By By Product Type, 2016-2032
- 9.3.1. Middle East & Africa Mulberry Market Analysis by By Product Type: Introduction
- 9.3.2. Market Size Absolute $ Opportunity Analysis and Forecast, By By Product Type, 2016-2032
- 9.3.3. Handbags
- 9.3.4. Small Leather Goods
- 9.3.5. Ready-to-Wear
- 9.3.6. Shoes
- 9.4. Middle East & Africa Mulberry Market Analysis, Opportunity and Forecast, By By Distribution Channel, 2016-2032
- 9.4.1. Middle East & Africa Mulberry Market Analysis by By Distribution Channel: Introduction
- 9.4.2. Market Size Absolute $ Opportunity Analysis and Forecast, By By Distribution Channel, 2016-2032
- 9.4.3. Retail Stores
- 9.4.4. E-commerce Platforms
- 9.4.5. Travel Retail
- 9.4.6. Online Marketplaces
- 9.5. Middle East & Africa Mulberry Market Analysis, Opportunity and Forecast, By By Form, 2016-2032
- 9.5.1. Middle East & Africa Mulberry Market Analysis by By Form: Introduction
- 9.5.2. Market Size Absolute $ Opportunity Analysis and Forecast, By By Form, 2016-2032
- 9.5.3. Fruit
- 9.5.4. Raw/Fresh
- 9.5.5. Processed
- 9.5.6. Frozen/Chilled
- 9.5.7. Canned
- 9.5.8. Dehydrated
- 9.6. Middle East & Africa Mulberry Market Analysis, Opportunity and Forecast, By Country , 2016-2032
- 9.6.1. Middle East & Africa Mulberry Market Analysis by Country : Introduction
- 9.6.2. Market Size Absolute $ Opportunity Analysis and Forecast, Country , 2016-2032
- 9.6.2.1. Algeria
- 9.6.2.2. Egypt
- 9.6.2.3. Israel
- 9.6.2.4. Kuwait
- 9.6.2.5. Nigeria
- 9.6.2.6. Saudi Arabia
- 9.6.2.7. South Africa
- 9.6.2.8. Turkey
- 9.6.2.9. The UAE
- 9.6.2.10. Rest of MEA
- 10. Global Mulberry Market Analysis, Opportunity and Forecast, By Region , 2016-2032
- 10.1. Global Mulberry Market Analysis by Region : Introduction
- 10.2. Market Size Absolute $ Opportunity Analysis and Forecast, By Region , 2016-2032
- 10.2.1. North America
- 10.2.2. Western Europe
- 10.2.3. Eastern Europe
- 10.2.4. APAC
- 10.2.5. Latin America
- 10.2.6. Middle East & Africa
- 11. Global Mulberry Market Competitive Landscape, Market Share Analysis, and Company Profiles
- 11.1. Market Share Analysis
- 11.2. Company Profiles
- 11.3. ASML
- 11.3.1. Company Overview
- 11.3.2. Financial Highlights
- 11.3.3. Product Portfolio
- 11.3.4. SWOT Analysis
- 11.3.5. Key Strategies and Developments
- 11.4. Bolt Threads
- 11.4.1. Company Overview
- 11.4.2. Financial Highlights
- 11.4.3. Product Portfolio
- 11.4.4. SWOT Analysis
- 11.4.5. Key Strategies and Developments
- 11.5. Novartis
- 11.5.1. Company Overview
- 11.5.2. Financial Highlights
- 11.5.3. Product Portfolio
- 11.5.4. SWOT Analysis
- 11.5.5. Key Strategies and Developments
- 11.6. Silk Road Holdings
- 11.6.1. Company Overview
- 11.6.2. Financial Highlights
- 11.6.3. Product Portfolio
- 11.6.4. SWOT Analysis
- 11.6.5. Key Strategies and Developments
- 11.7. Body Shop
- 11.7.1. Company Overview
- 11.7.2. Financial Highlights
- 11.7.3. Product Portfolio
- 11.7.4. SWOT Analysis
- 11.7.5. Key Strategies and Developments
- 11.8. Sunrise Agriland Development & Research Pvt. Ltd.
- 11.8.1. Company Overview
- 11.8.2. Financial Highlights
- 11.8.3. Product Portfolio
- 11.8.4. SWOT Analysis
- 11.8.5. Key Strategies and Developments
- 11.9. BATA FOOD
- 11.9.1. Company Overview
- 11.9.2. Financial Highlights
- 11.9.3. Product Portfolio
- 11.9.4. SWOT Analysis
- 11.9.5. Key Strategies and Developments
- 11.10. DÖHLER
- 11.10.1. Company Overview
- 11.10.2. Financial Highlights
- 11.10.3. Product Portfolio
- 11.10.4. SWOT Analysis
- 11.10.5. Key Strategies and Developments
- 11.11. Top Line Foods
- 11.11.1. Company Overview
- 11.11.2. Financial Highlights
- 11.11.3. Product Portfolio
- 11.11.4. SWOT Analysis
- 11.11.5. Key Strategies and Developments
- 11.12. Peony Food Products
- 11.12.1. Company Overview
- 11.12.2. Financial Highlights
- 11.12.3. Product Portfolio
- 11.12.4. SWOT Analysis
- 11.12.5. Key Strategies and Developments
- 11.13. Yaban Food
- 11.13.1. Company Overview
- 11.13.2. Financial Highlights
- 11.13.3. Product Portfolio
- 11.13.4. SWOT Analysis
- 11.13.5. Key Strategies and Developments
- 11.14. Ken Muir Ltd
- 11.14.1. Company Overview
- 11.14.2. Financial Highlights
- 11.14.3. Product Portfolio
- 11.14.4. SWOT Analysis
- 11.14.5. Key Strategies and Developments
- 11.15. NAVITAS ORGANICS
- 11.15.1. Company Overview
- 11.15.2. Financial Highlights
- 11.15.3. Product Portfolio
- 11.15.4. SWOT Analysis
- 11.15.5. Key Strategies and Developments
- 11.16. Sevenhills Wholefoods
- 11.16.1. Company Overview
- 11.16.2. Financial Highlights
- 11.16.3. Product Portfolio
- 11.16.4. SWOT Analysis
- 11.16.5. Key Strategies and Developments
- 11.17. Nans Products
- 11.17.1. Company Overview
- 11.17.2. Financial Highlights
- 11.17.3. Product Portfolio
- 11.17.4. SWOT Analysis
- 11.17.5. Key Strategies and Developments
- 11.18. Xian Yuensun Biological Technology Co. Ltd.
- 11.18.1. Company Overview
- 11.18.2. Financial Highlights
- 11.18.3. Product Portfolio
- 11.18.4. SWOT Analysis
- 11.18.5. Key Strategies and Developments
- 11.19. ETChem
- 11.19.1. Company Overview
- 11.19.2. Financial Highlights
- 11.19.3. Product Portfolio
- 11.19.4. SWOT Analysis
- 11.19.5. Key Strategies and Developments
- 11.20. Other
- 11.20.1. Company Overview
- 11.20.2. Financial Highlights
- 11.20.3. Product Portfolio
- 11.20.4. SWOT Analysis
- 11.20.5. Key Strategies and Developments
- 12. Assumptions and Acronyms
- 13. Research Methodology
- 14. Contact
List of Figures
-
- Figure 1: Global Mulberry Market Revenue (US$ Mn) Market Share by By Product Type in 2022
- Figure 2: Global Mulberry Market Attractiveness Analysis by By Product Type, 2016-2032
- Figure 3: Global Mulberry Market Revenue (US$ Mn) Market Share by By Distribution Channelin 2022
- Figure 4: Global Mulberry Market Attractiveness Analysis by By Distribution Channel, 2016-2032
- Figure 5: Global Mulberry Market Revenue (US$ Mn) Market Share by By Formin 2022
- Figure 6: Global Mulberry Market Attractiveness Analysis by By Form, 2016-2032
- Figure 7: Global Mulberry Market Revenue (US$ Mn) Market Share by Region in 2022
- Figure 8: Global Mulberry Market Attractiveness Analysis by Region, 2016-2032
- Figure 9: Global Mulberry Market Revenue (US$ Mn) (2016-2032)
- Figure 10: Global Mulberry Market Revenue (US$ Mn) Comparison by Region (2016-2032)
- Figure 11: Global Mulberry Market Revenue (US$ Mn) Comparison by By Product Type (2016-2032)
- Figure 12: Global Mulberry Market Revenue (US$ Mn) Comparison by By Distribution Channel (2016-2032)
- Figure 13: Global Mulberry Market Revenue (US$ Mn) Comparison by By Form (2016-2032)
- Figure 14: Global Mulberry Market Y-o-Y Growth Rate Comparison by Region (2016-2032)
- Figure 15: Global Mulberry Market Y-o-Y Growth Rate Comparison by By Product Type (2016-2032)
- Figure 16: Global Mulberry Market Y-o-Y Growth Rate Comparison by By Distribution Channel (2016-2032)
- Figure 17: Global Mulberry Market Y-o-Y Growth Rate Comparison by By Form (2016-2032)
- Figure 18: Global Mulberry Market Share Comparison by Region (2016-2032)
- Figure 19: Global Mulberry Market Share Comparison by By Product Type (2016-2032)
- Figure 20: Global Mulberry Market Share Comparison by By Distribution Channel (2016-2032)
- Figure 21: Global Mulberry Market Share Comparison by By Form (2016-2032)
- Figure 22: North America Mulberry Market Revenue (US$ Mn) Market Share by By Product Typein 2022
- Figure 23: North America Mulberry Market Attractiveness Analysis by By Product Type, 2016-2032
- Figure 24: North America Mulberry Market Revenue (US$ Mn) Market Share by By Distribution Channelin 2022
- Figure 25: North America Mulberry Market Attractiveness Analysis by By Distribution Channel, 2016-2032
- Figure 26: North America Mulberry Market Revenue (US$ Mn) Market Share by By Formin 2022
- Figure 27: North America Mulberry Market Attractiveness Analysis by By Form, 2016-2032
- Figure 28: North America Mulberry Market Revenue (US$ Mn) Market Share by Country in 2022
- Figure 29: North America Mulberry Market Attractiveness Analysis by Country, 2016-2032
- Figure 30: North America Mulberry Market Revenue (US$ Mn) (2016-2032)
- Figure 31: North America Mulberry Market Revenue (US$ Mn) Comparison by Country (2016-2032)
- Figure 32: North America Mulberry Market Revenue (US$ Mn) Comparison by By Product Type (2016-2032)
- Figure 33: North America Mulberry Market Revenue (US$ Mn) Comparison by By Distribution Channel (2016-2032)
- Figure 34: North America Mulberry Market Revenue (US$ Mn) Comparison by By Form (2016-2032)
- Figure 35: North America Mulberry Market Y-o-Y Growth Rate Comparison by Country (2016-2032)
- Figure 36: North America Mulberry Market Y-o-Y Growth Rate Comparison by By Product Type (2016-2032)
- Figure 37: North America Mulberry Market Y-o-Y Growth Rate Comparison by By Distribution Channel (2016-2032)
- Figure 38: North America Mulberry Market Y-o-Y Growth Rate Comparison by By Form (2016-2032)
- Figure 39: North America Mulberry Market Share Comparison by Country (2016-2032)
- Figure 40: North America Mulberry Market Share Comparison by By Product Type (2016-2032)
- Figure 41: North America Mulberry Market Share Comparison by By Distribution Channel (2016-2032)
- Figure 42: North America Mulberry Market Share Comparison by By Form (2016-2032)
- Figure 43: Western Europe Mulberry Market Revenue (US$ Mn) Market Share by By Product Typein 2022
- Figure 44: Western Europe Mulberry Market Attractiveness Analysis by By Product Type, 2016-2032
- Figure 45: Western Europe Mulberry Market Revenue (US$ Mn) Market Share by By Distribution Channelin 2022
- Figure 46: Western Europe Mulberry Market Attractiveness Analysis by By Distribution Channel, 2016-2032
- Figure 47: Western Europe Mulberry Market Revenue (US$ Mn) Market Share by By Formin 2022
- Figure 48: Western Europe Mulberry Market Attractiveness Analysis by By Form, 2016-2032
- Figure 49: Western Europe Mulberry Market Revenue (US$ Mn) Market Share by Country in 2022
- Figure 50: Western Europe Mulberry Market Attractiveness Analysis by Country, 2016-2032
- Figure 51: Western Europe Mulberry Market Revenue (US$ Mn) (2016-2032)
- Figure 52: Western Europe Mulberry Market Revenue (US$ Mn) Comparison by Country (2016-2032)
- Figure 53: Western Europe Mulberry Market Revenue (US$ Mn) Comparison by By Product Type (2016-2032)
- Figure 54: Western Europe Mulberry Market Revenue (US$ Mn) Comparison by By Distribution Channel (2016-2032)
- Figure 55: Western Europe Mulberry Market Revenue (US$ Mn) Comparison by By Form (2016-2032)
- Figure 56: Western Europe Mulberry Market Y-o-Y Growth Rate Comparison by Country (2016-2032)
- Figure 57: Western Europe Mulberry Market Y-o-Y Growth Rate Comparison by By Product Type (2016-2032)
- Figure 58: Western Europe Mulberry Market Y-o-Y Growth Rate Comparison by By Distribution Channel (2016-2032)
- Figure 59: Western Europe Mulberry Market Y-o-Y Growth Rate Comparison by By Form (2016-2032)
- Figure 60: Western Europe Mulberry Market Share Comparison by Country (2016-2032)
- Figure 61: Western Europe Mulberry Market Share Comparison by By Product Type (2016-2032)
- Figure 62: Western Europe Mulberry Market Share Comparison by By Distribution Channel (2016-2032)
- Figure 63: Western Europe Mulberry Market Share Comparison by By Form (2016-2032)
- Figure 64: Eastern Europe Mulberry Market Revenue (US$ Mn) Market Share by By Product Typein 2022
- Figure 65: Eastern Europe Mulberry Market Attractiveness Analysis by By Product Type, 2016-2032
- Figure 66: Eastern Europe Mulberry Market Revenue (US$ Mn) Market Share by By Distribution Channelin 2022
- Figure 67: Eastern Europe Mulberry Market Attractiveness Analysis by By Distribution Channel, 2016-2032
- Figure 68: Eastern Europe Mulberry Market Revenue (US$ Mn) Market Share by By Formin 2022
- Figure 69: Eastern Europe Mulberry Market Attractiveness Analysis by By Form, 2016-2032
- Figure 70: Eastern Europe Mulberry Market Revenue (US$ Mn) Market Share by Country in 2022
- Figure 71: Eastern Europe Mulberry Market Attractiveness Analysis by Country, 2016-2032
- Figure 72: Eastern Europe Mulberry Market Revenue (US$ Mn) (2016-2032)
- Figure 73: Eastern Europe Mulberry Market Revenue (US$ Mn) Comparison by Country (2016-2032)
- Figure 74: Eastern Europe Mulberry Market Revenue (US$ Mn) Comparison by By Product Type (2016-2032)
- Figure 75: Eastern Europe Mulberry Market Revenue (US$ Mn) Comparison by By Distribution Channel (2016-2032)
- Figure 76: Eastern Europe Mulberry Market Revenue (US$ Mn) Comparison by By Form (2016-2032)
- Figure 77: Eastern Europe Mulberry Market Y-o-Y Growth Rate Comparison by Country (2016-2032)
- Figure 78: Eastern Europe Mulberry Market Y-o-Y Growth Rate Comparison by By Product Type (2016-2032)
- Figure 79: Eastern Europe Mulberry Market Y-o-Y Growth Rate Comparison by By Distribution Channel (2016-2032)
- Figure 80: Eastern Europe Mulberry Market Y-o-Y Growth Rate Comparison by By Form (2016-2032)
- Figure 81: Eastern Europe Mulberry Market Share Comparison by Country (2016-2032)
- Figure 82: Eastern Europe Mulberry Market Share Comparison by By Product Type (2016-2032)
- Figure 83: Eastern Europe Mulberry Market Share Comparison by By Distribution Channel (2016-2032)
- Figure 84: Eastern Europe Mulberry Market Share Comparison by By Form (2016-2032)
- Figure 85: APAC Mulberry Market Revenue (US$ Mn) Market Share by By Product Typein 2022
- Figure 86: APAC Mulberry Market Attractiveness Analysis by By Product Type, 2016-2032
- Figure 87: APAC Mulberry Market Revenue (US$ Mn) Market Share by By Distribution Channelin 2022
- Figure 88: APAC Mulberry Market Attractiveness Analysis by By Distribution Channel, 2016-2032
- Figure 89: APAC Mulberry Market Revenue (US$ Mn) Market Share by By Formin 2022
- Figure 90: APAC Mulberry Market Attractiveness Analysis by By Form, 2016-2032
- Figure 91: APAC Mulberry Market Revenue (US$ Mn) Market Share by Country in 2022
- Figure 92: APAC Mulberry Market Attractiveness Analysis by Country, 2016-2032
- Figure 93: APAC Mulberry Market Revenue (US$ Mn) (2016-2032)
- Figure 94: APAC Mulberry Market Revenue (US$ Mn) Comparison by Country (2016-2032)
- Figure 95: APAC Mulberry Market Revenue (US$ Mn) Comparison by By Product Type (2016-2032)
- Figure 96: APAC Mulberry Market Revenue (US$ Mn) Comparison by By Distribution Channel (2016-2032)
- Figure 97: APAC Mulberry Market Revenue (US$ Mn) Comparison by By Form (2016-2032)
- Figure 98: APAC Mulberry Market Y-o-Y Growth Rate Comparison by Country (2016-2032)
- Figure 99: APAC Mulberry Market Y-o-Y Growth Rate Comparison by By Product Type (2016-2032)
- Figure 100: APAC Mulberry Market Y-o-Y Growth Rate Comparison by By Distribution Channel (2016-2032)
- Figure 101: APAC Mulberry Market Y-o-Y Growth Rate Comparison by By Form (2016-2032)
- Figure 102: APAC Mulberry Market Share Comparison by Country (2016-2032)
- Figure 103: APAC Mulberry Market Share Comparison by By Product Type (2016-2032)
- Figure 104: APAC Mulberry Market Share Comparison by By Distribution Channel (2016-2032)
- Figure 105: APAC Mulberry Market Share Comparison by By Form (2016-2032)
- Figure 106: Latin America Mulberry Market Revenue (US$ Mn) Market Share by By Product Typein 2022
- Figure 107: Latin America Mulberry Market Attractiveness Analysis by By Product Type, 2016-2032
- Figure 108: Latin America Mulberry Market Revenue (US$ Mn) Market Share by By Distribution Channelin 2022
- Figure 109: Latin America Mulberry Market Attractiveness Analysis by By Distribution Channel, 2016-2032
- Figure 110: Latin America Mulberry Market Revenue (US$ Mn) Market Share by By Formin 2022
- Figure 111: Latin America Mulberry Market Attractiveness Analysis by By Form, 2016-2032
- Figure 112: Latin America Mulberry Market Revenue (US$ Mn) Market Share by Country in 2022
- Figure 113: Latin America Mulberry Market Attractiveness Analysis by Country, 2016-2032
- Figure 114: Latin America Mulberry Market Revenue (US$ Mn) (2016-2032)
- Figure 115: Latin America Mulberry Market Revenue (US$ Mn) Comparison by Country (2016-2032)
- Figure 116: Latin America Mulberry Market Revenue (US$ Mn) Comparison by By Product Type (2016-2032)
- Figure 117: Latin America Mulberry Market Revenue (US$ Mn) Comparison by By Distribution Channel (2016-2032)
- Figure 118: Latin America Mulberry Market Revenue (US$ Mn) Comparison by By Form (2016-2032)
- Figure 119: Latin America Mulberry Market Y-o-Y Growth Rate Comparison by Country (2016-2032)
- Figure 120: Latin America Mulberry Market Y-o-Y Growth Rate Comparison by By Product Type (2016-2032)
- Figure 121: Latin America Mulberry Market Y-o-Y Growth Rate Comparison by By Distribution Channel (2016-2032)
- Figure 122: Latin America Mulberry Market Y-o-Y Growth Rate Comparison by By Form (2016-2032)
- Figure 123: Latin America Mulberry Market Share Comparison by Country (2016-2032)
- Figure 124: Latin America Mulberry Market Share Comparison by By Product Type (2016-2032)
- Figure 125: Latin America Mulberry Market Share Comparison by By Distribution Channel (2016-2032)
- Figure 126: Latin America Mulberry Market Share Comparison by By Form (2016-2032)
- Figure 127: Middle East & Africa Mulberry Market Revenue (US$ Mn) Market Share by By Product Typein 2022
- Figure 128: Middle East & Africa Mulberry Market Attractiveness Analysis by By Product Type, 2016-2032
- Figure 129: Middle East & Africa Mulberry Market Revenue (US$ Mn) Market Share by By Distribution Channelin 2022
- Figure 130: Middle East & Africa Mulberry Market Attractiveness Analysis by By Distribution Channel, 2016-2032
- Figure 131: Middle East & Africa Mulberry Market Revenue (US$ Mn) Market Share by By Formin 2022
- Figure 132: Middle East & Africa Mulberry Market Attractiveness Analysis by By Form, 2016-2032
- Figure 133: Middle East & Africa Mulberry Market Revenue (US$ Mn) Market Share by Country in 2022
- Figure 134: Middle East & Africa Mulberry Market Attractiveness Analysis by Country, 2016-2032
- Figure 135: Middle East & Africa Mulberry Market Revenue (US$ Mn) (2016-2032)
- Figure 136: Middle East & Africa Mulberry Market Revenue (US$ Mn) Comparison by Country (2016-2032)
- Figure 137: Middle East & Africa Mulberry Market Revenue (US$ Mn) Comparison by By Product Type (2016-2032)
- Figure 138: Middle East & Africa Mulberry Market Revenue (US$ Mn) Comparison by By Distribution Channel (2016-2032)
- Figure 139: Middle East & Africa Mulberry Market Revenue (US$ Mn) Comparison by By Form (2016-2032)
- Figure 140: Middle East & Africa Mulberry Market Y-o-Y Growth Rate Comparison by Country (2016-2032)
- Figure 141: Middle East & Africa Mulberry Market Y-o-Y Growth Rate Comparison by By Product Type (2016-2032)
- Figure 142: Middle East & Africa Mulberry Market Y-o-Y Growth Rate Comparison by By Distribution Channel (2016-2032)
- Figure 143: Middle East & Africa Mulberry Market Y-o-Y Growth Rate Comparison by By Form (2016-2032)
- Figure 144: Middle East & Africa Mulberry Market Share Comparison by Country (2016-2032)
- Figure 145: Middle East & Africa Mulberry Market Share Comparison by By Product Type (2016-2032)
- Figure 146: Middle East & Africa Mulberry Market Share Comparison by By Distribution Channel (2016-2032)
- Figure 147: Middle East & Africa Mulberry Market Share Comparison by By Form (2016-2032)
List of Tables
- Table 1: Global Mulberry Market Comparison by By Product Type (2016-2032)
- Table 2: Global Mulberry Market Comparison by By Distribution Channel (2016-2032)
- Table 3: Global Mulberry Market Comparison by By Form (2016-2032)
- Table 4: Global Mulberry Market Revenue (US$ Mn) Comparison by Region (2016-2032)
- Table 5: Global Mulberry Market Revenue (US$ Mn) (2016-2032)
- Table 6: Global Mulberry Market Revenue (US$ Mn) Comparison by Region (2016-2032)
- Table 7: Global Mulberry Market Revenue (US$ Mn) Comparison by By Product Type (2016-2032)
- Table 8: Global Mulberry Market Revenue (US$ Mn) Comparison by By Distribution Channel (2016-2032)
- Table 9: Global Mulberry Market Revenue (US$ Mn) Comparison by By Form (2016-2032)
- Table 10: Global Mulberry Market Y-o-Y Growth Rate Comparison by Region (2016-2032)
- Table 11: Global Mulberry Market Y-o-Y Growth Rate Comparison by By Product Type (2016-2032)
- Table 12: Global Mulberry Market Y-o-Y Growth Rate Comparison by By Distribution Channel (2016-2032)
- Table 13: Global Mulberry Market Y-o-Y Growth Rate Comparison by By Form (2016-2032)
- Table 14: Global Mulberry Market Share Comparison by Region (2016-2032)
- Table 15: Global Mulberry Market Share Comparison by By Product Type (2016-2032)
- Table 16: Global Mulberry Market Share Comparison by By Distribution Channel (2016-2032)
- Table 17: Global Mulberry Market Share Comparison by By Form (2016-2032)
- Table 18: North America Mulberry Market Comparison by By Distribution Channel (2016-2032)
- Table 19: North America Mulberry Market Comparison by By Form (2016-2032)
- Table 20: North America Mulberry Market Revenue (US$ Mn) Comparison by Country (2016-2032)
- Table 21: North America Mulberry Market Revenue (US$ Mn) (2016-2032)
- Table 22: North America Mulberry Market Revenue (US$ Mn) Comparison by Country (2016-2032)
- Table 23: North America Mulberry Market Revenue (US$ Mn) Comparison by By Product Type (2016-2032)
- Table 24: North America Mulberry Market Revenue (US$ Mn) Comparison by By Distribution Channel (2016-2032)
- Table 25: North America Mulberry Market Revenue (US$ Mn) Comparison by By Form (2016-2032)
- Table 26: North America Mulberry Market Y-o-Y Growth Rate Comparison by Country (2016-2032)
- Table 27: North America Mulberry Market Y-o-Y Growth Rate Comparison by By Product Type (2016-2032)
- Table 28: North America Mulberry Market Y-o-Y Growth Rate Comparison by By Distribution Channel (2016-2032)
- Table 29: North America Mulberry Market Y-o-Y Growth Rate Comparison by By Form (2016-2032)
- Table 30: North America Mulberry Market Share Comparison by Country (2016-2032)
- Table 31: North America Mulberry Market Share Comparison by By Product Type (2016-2032)
- Table 32: North America Mulberry Market Share Comparison by By Distribution Channel (2016-2032)
- Table 33: North America Mulberry Market Share Comparison by By Form (2016-2032)
- Table 34: Western Europe Mulberry Market Comparison by By Product Type (2016-2032)
- Table 35: Western Europe Mulberry Market Comparison by By Distribution Channel (2016-2032)
- Table 36: Western Europe Mulberry Market Comparison by By Form (2016-2032)
- Table 37: Western Europe Mulberry Market Revenue (US$ Mn) Comparison by Country (2016-2032)
- Table 38: Western Europe Mulberry Market Revenue (US$ Mn) (2016-2032)
- Table 39: Western Europe Mulberry Market Revenue (US$ Mn) Comparison by Country (2016-2032)
- Table 40: Western Europe Mulberry Market Revenue (US$ Mn) Comparison by By Product Type (2016-2032)
- Table 41: Western Europe Mulberry Market Revenue (US$ Mn) Comparison by By Distribution Channel (2016-2032)
- Table 42: Western Europe Mulberry Market Revenue (US$ Mn) Comparison by By Form (2016-2032)
- Table 43: Western Europe Mulberry Market Y-o-Y Growth Rate Comparison by Country (2016-2032)
- Table 44: Western Europe Mulberry Market Y-o-Y Growth Rate Comparison by By Product Type (2016-2032)
- Table 45: Western Europe Mulberry Market Y-o-Y Growth Rate Comparison by By Distribution Channel (2016-2032)
- Table 46: Western Europe Mulberry Market Y-o-Y Growth Rate Comparison by By Form (2016-2032)
- Table 47: Western Europe Mulberry Market Share Comparison by Country (2016-2032)
- Table 48: Western Europe Mulberry Market Share Comparison by By Product Type (2016-2032)
- Table 49: Western Europe Mulberry Market Share Comparison by By Distribution Channel (2016-2032)
- Table 50: Western Europe Mulberry Market Share Comparison by By Form (2016-2032)
- Table 51: Eastern Europe Mulberry Market Comparison by By Product Type (2016-2032)
- Table 52: Eastern Europe Mulberry Market Comparison by By Distribution Channel (2016-2032)
- Table 53: Eastern Europe Mulberry Market Comparison by By Form (2016-2032)
- Table 54: Eastern Europe Mulberry Market Revenue (US$ Mn) Comparison by Country (2016-2032)
- Table 55: Eastern Europe Mulberry Market Revenue (US$ Mn) (2016-2032)
- Table 56: Eastern Europe Mulberry Market Revenue (US$ Mn) Comparison by Country (2016-2032)
- Table 57: Eastern Europe Mulberry Market Revenue (US$ Mn) Comparison by By Product Type (2016-2032)
- Table 58: Eastern Europe Mulberry Market Revenue (US$ Mn) Comparison by By Distribution Channel (2016-2032)
- Table 59: Eastern Europe Mulberry Market Revenue (US$ Mn) Comparison by By Form (2016-2032)
- Table 60: Eastern Europe Mulberry Market Y-o-Y Growth Rate Comparison by Country (2016-2032)
- Table 61: Eastern Europe Mulberry Market Y-o-Y Growth Rate Comparison by By Product Type (2016-2032)
- Table 62: Eastern Europe Mulberry Market Y-o-Y Growth Rate Comparison by By Distribution Channel (2016-2032)
- Table 63: Eastern Europe Mulberry Market Y-o-Y Growth Rate Comparison by By Form (2016-2032)
- Table 64: Eastern Europe Mulberry Market Share Comparison by Country (2016-2032)
- Table 65: Eastern Europe Mulberry Market Share Comparison by By Product Type (2016-2032)
- Table 66: Eastern Europe Mulberry Market Share Comparison by By Distribution Channel (2016-2032)
- Table 67: Eastern Europe Mulberry Market Share Comparison by By Form (2016-2032)
- Table 68: APAC Mulberry Market Comparison by By Product Type (2016-2032)
- Table 69: APAC Mulberry Market Comparison by By Distribution Channel (2016-2032)
- Table 70: APAC Mulberry Market Comparison by By Form (2016-2032)
- Table 71: APAC Mulberry Market Revenue (US$ Mn) Comparison by Country (2016-2032)
- Table 72: APAC Mulberry Market Revenue (US$ Mn) (2016-2032)
- Table 73: APAC Mulberry Market Revenue (US$ Mn) Comparison by Country (2016-2032)
- Table 74: APAC Mulberry Market Revenue (US$ Mn) Comparison by By Product Type (2016-2032)
- Table 75: APAC Mulberry Market Revenue (US$ Mn) Comparison by By Distribution Channel (2016-2032)
- Table 76: APAC Mulberry Market Revenue (US$ Mn) Comparison by By Form (2016-2032)
- Table 77: APAC Mulberry Market Y-o-Y Growth Rate Comparison by Country (2016-2032)
- Table 78: APAC Mulberry Market Y-o-Y Growth Rate Comparison by By Product Type (2016-2032)
- Table 79: APAC Mulberry Market Y-o-Y Growth Rate Comparison by By Distribution Channel (2016-2032)
- Table 80: APAC Mulberry Market Y-o-Y Growth Rate Comparison by By Form (2016-2032)
- Table 81: APAC Mulberry Market Share Comparison by Country (2016-2032)
- Table 82: APAC Mulberry Market Share Comparison by By Product Type (2016-2032)
- Table 83: APAC Mulberry Market Share Comparison by By Distribution Channel (2016-2032)
- Table 84: APAC Mulberry Market Share Comparison by By Form (2016-2032)
- Table 85: Latin America Mulberry Market Comparison by By Product Type (2016-2032)
- Table 86: Latin America Mulberry Market Comparison by By Distribution Channel (2016-2032)
- Table 87: Latin America Mulberry Market Comparison by By Form (2016-2032)
- Table 88: Latin America Mulberry Market Revenue (US$ Mn) Comparison by Country (2016-2032)
- Table 89: Latin America Mulberry Market Revenue (US$ Mn) (2016-2032)
- Table 90: Latin America Mulberry Market Revenue (US$ Mn) Comparison by Country (2016-2032)
- Table 91: Latin America Mulberry Market Revenue (US$ Mn) Comparison by By Product Type (2016-2032)
- Table 92: Latin America Mulberry Market Revenue (US$ Mn) Comparison by By Distribution Channel (2016-2032)
- Table 93: Latin America Mulberry Market Revenue (US$ Mn) Comparison by By Form (2016-2032)
- Table 94: Latin America Mulberry Market Y-o-Y Growth Rate Comparison by Country (2016-2032)
- Table 95: Latin America Mulberry Market Y-o-Y Growth Rate Comparison by By Product Type (2016-2032)
- Table 96: Latin America Mulberry Market Y-o-Y Growth Rate Comparison by By Distribution Channel (2016-2032)
- Table 97: Latin America Mulberry Market Y-o-Y Growth Rate Comparison by By Form (2016-2032)
- Table 98: Latin America Mulberry Market Share Comparison by Country (2016-2032)
- Table 99: Latin America Mulberry Market Share Comparison by By Product Type (2016-2032)
- Table 100: Latin America Mulberry Market Share Comparison by By Distribution Channel (2016-2032)
- Table 101: Latin America Mulberry Market Share Comparison by By Form (2016-2032)
- Table 102: Middle East & Africa Mulberry Market Comparison by By Product Type (2016-2032)
- Table 103: Middle East & Africa Mulberry Market Comparison by By Distribution Channel (2016-2032)
- Table 104: Middle East & Africa Mulberry Market Comparison by By Form (2016-2032)
- Table 105: Middle East & Africa Mulberry Market Revenue (US$ Mn) Comparison by Country (2016-2032)
- Table 106: Middle East & Africa Mulberry Market Revenue (US$ Mn) (2016-2032)
- Table 107: Middle East & Africa Mulberry Market Revenue (US$ Mn) Comparison by Country (2016-2032)
- Table 108: Middle East & Africa Mulberry Market Revenue (US$ Mn) Comparison by By Product Type (2016-2032)
- Table 109: Middle East & Africa Mulberry Market Revenue (US$ Mn) Comparison by By Distribution Channel (2016-2032)
- Table 110: Middle East & Africa Mulberry Market Revenue (US$ Mn) Comparison by By Form (2016-2032)
- Table 111: Middle East & Africa Mulberry Market Y-o-Y Growth Rate Comparison by Country (2016-2032)
- Table 112: Middle East & Africa Mulberry Market Y-o-Y Growth Rate Comparison by By Product Type (2016-2032)
- Table 113: Middle East & Africa Mulberry Market Y-o-Y Growth Rate Comparison by By Distribution Channel (2016-2032)
- Table 114: Middle East & Africa Mulberry Market Y-o-Y Growth Rate Comparison by By Form (2016-2032)
- Table 115: Middle East & Africa Mulberry Market Share Comparison by Country (2016-2032)
- Table 116: Middle East & Africa Mulberry Market Share Comparison by By Product Type (2016-2032)
- Table 117: Middle East & Africa Mulberry Market Share Comparison by By Distribution Channel (2016-2032)
- Table 118: Middle East & Africa Mulberry Market Share Comparison by By Form (2016-2032)
- 1. Executive Summary
-
- Bolt Threads
- Novartis
- Silk Road Holdings
- Body Shop
- Sunrise Agriland Development & Research Pvt. Ltd.
- BATA FOOD
- Top Line Foods
- Peony Food Products
- Yaban Food
- NAVITAS ORGANICS
- Sevenhills Wholefoods
- Xian Yuensun Biological Technology Co. Ltd.
- Dragon Superfoods
- Earth Circle Organics
- Other
Our Clients


View Our Licence Options
