
Global Iced Tea Market By Product(Black Iced Tea, Green Iced Tea), By Form(Powder, Paste, Granules), By Nature(Organic tea, Conventional tea), By Application(Residential, Commercial), By Sales channel(Hypermarket/Supermarket, Convenience Store, Drug Stores, Specialty Stores, Traditional Grocery Store, Online Stores), By Region And Companies - Industry Segment Outlook, Market Assessment, Competition Scenario, Trends, And Forecast 2024-2033
-
7047
-
August 2024
-
300
-


-
This report was compiled by Shreyas Rokade Shreyas Rokade is a seasoned Research Analyst with CMFE, bringing extensive expertise in market research and consulting, with a strong background in Chemical Engineering. Correspondence Team Lead-CMFE Linkedin | Detailed Market research Methodology Our methodology involves a mix of primary research, including interviews with leading mental health experts, and secondary research from reputable medical journals and databases. View Detailed Methodology Page
-
Quick Navigation
Report Overview
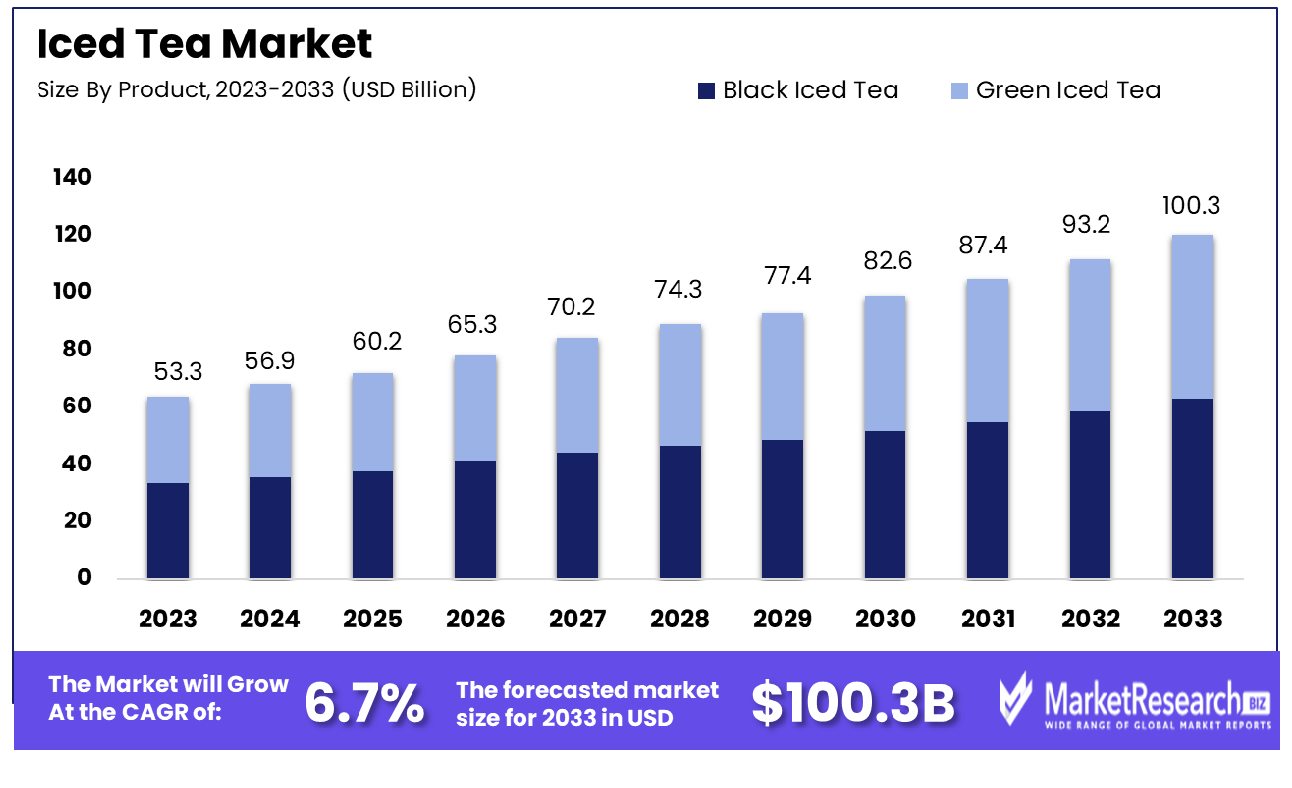
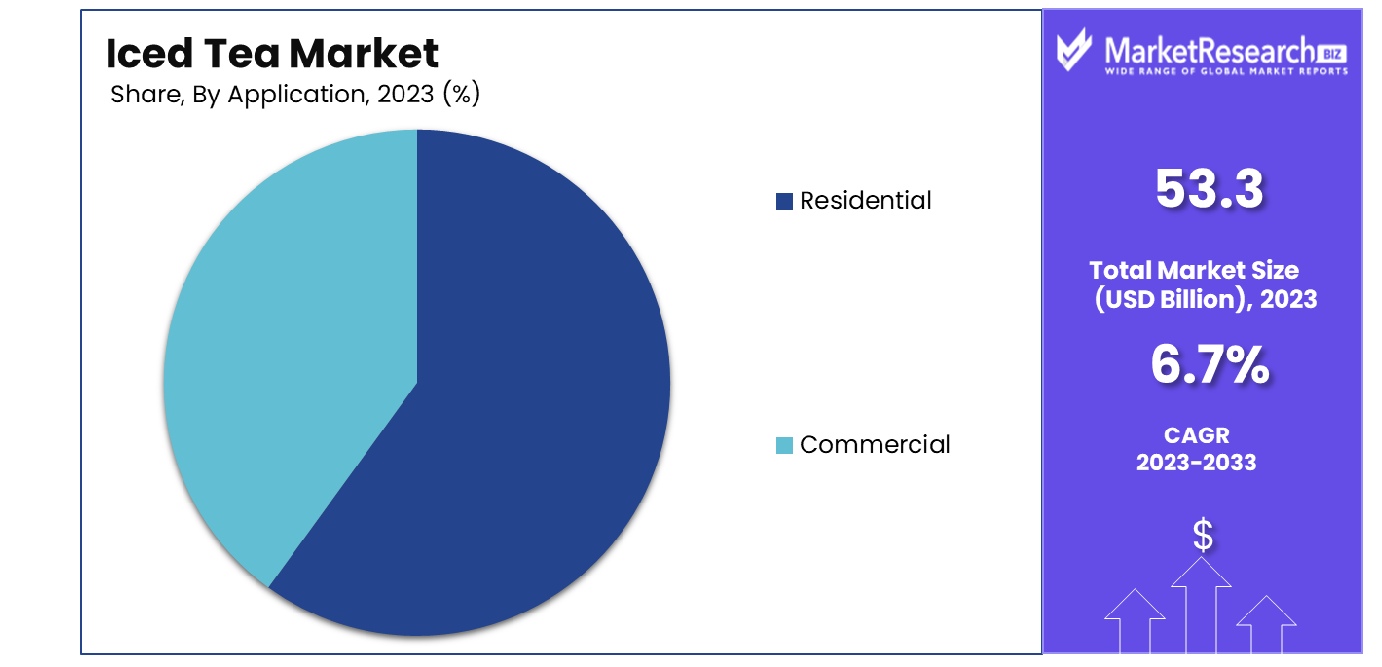
The Global Iced Tea Market was valued at USD 53.3 billion in 2023. It is expected to reach USD 100.3 billion by 2033, with a CAGR of 6.7% during the forecast period from 2024 to 2033.
The Iced Tea Market encompasses a variety of ready-to-drink and freshly brewed iced tea products that cater to consumer demand for refreshing healthier beverage alternatives. This market segment has witnessed significant growth, driven by evolving consumer preferences towards low-calorie, low-sugar options and the rising popularity of functional drinks infused with natural ingredients and antioxidants.
As a focal point in the beverage industry, the iced tea market appeals to health-conscious consumers and capitalizes on trends in organic and natural products. For industry leaders and product managers, this market offers substantial opportunities for innovation in flavors, branding, and sustainable packaging solutions.
The Iced Tea Market has emerged as a dynamic sector within the global beverage industry, capitalizing on shifting consumer preferences towards healthier and more versatile drink options. A standard serving of sweetened iced tea, approximately 257 grams, contains about 80 calories, positioning it as a lower-calorie alternative to many carbonated and sugar-laden beverages.
Furthermore, with approximately 47.5 mg of caffeine per serving, iced tea offers a moderate caffeine level that appeals to consumers seeking a milder stimulant effect compared to coffee. This attribute makes iced tea an appealing choice for those aiming to decrease their caffeine consumption without foregoing an energizing beverage option.
The market's growth is further supported by consumer interest in functional beverages that offer health benefits beyond basic nutrition. Iced teas infused with natural ingredients, antioxidants, and herbal extracts align well with the demand for wellness-oriented products. Moreover, the market is witnessing a significant trend towards organic and sustainably sourced ingredients, which resonates well with environmentally conscious consumers. As manufacturers innovate with flavor profiles and packaging, the market is set to expand its reach.
Strategically, for companies operating within this segment, there is substantial potential to differentiate their products through branding and targeted marketing strategies. The focus on health attributes, coupled with effective communication on product benefits, can enhance brand loyalty and consumer engagement. This market analysis suggests that stakeholders, including product managers and marketing strategists, should consider leveraging these trends to capture and expand their market share in the burgeoning iced tea market.
Key Takeaways
- Market Growth: The Global Iced Tea Market was valued at USD 53.3 billion in 2023. It is expected to reach USD 100.3 billion by 2033, with a CAGR of 6.7% during the forecast period from 2024 to 2033.
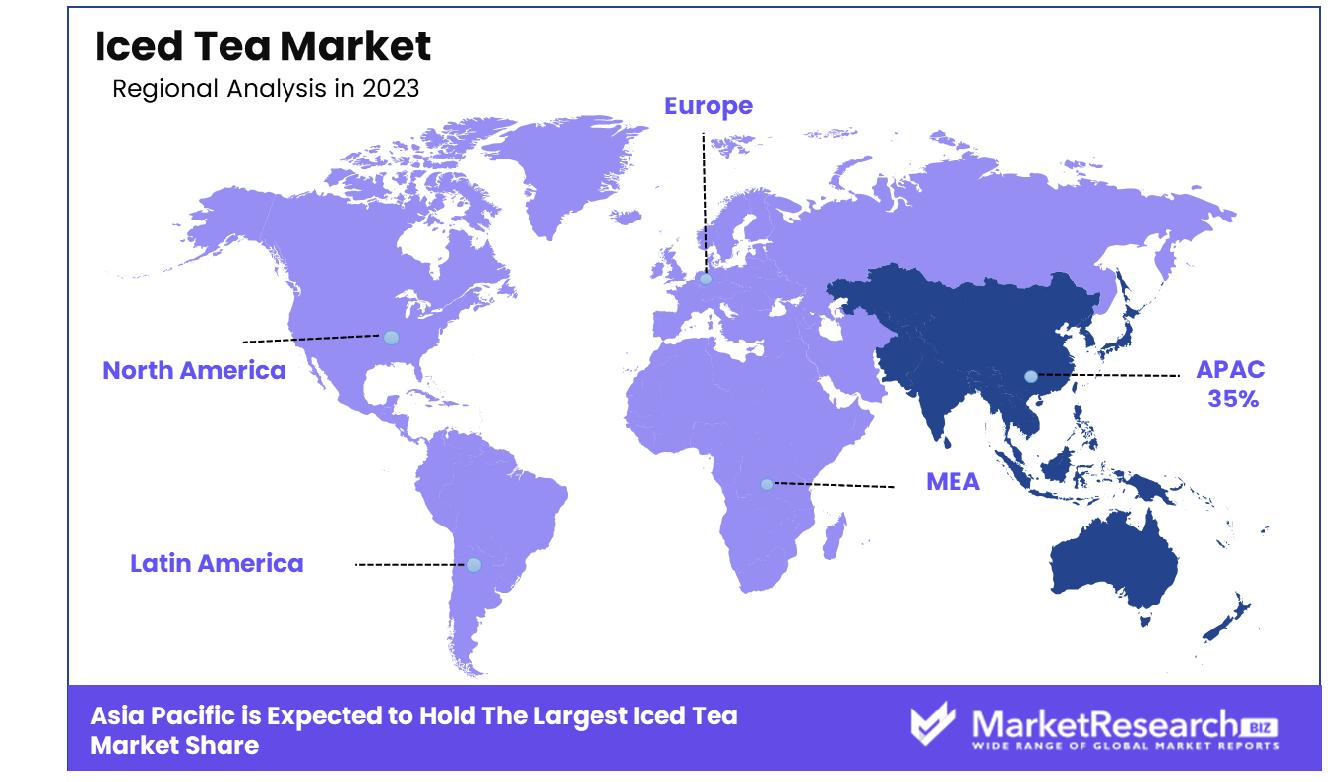
- Regional Dominance: The Asia Pacific region holds a 35% share of the global Iced Tea Market.
- By Product: Black Iced Tea leads the market with a 55% share.
- By Form: Powder form dominates, accounting for 30% of market preference.
- By Nature: Organic tea holds a significant 40% of the market.
- By Application: Residential application dominates, capturing 65% of market usage.
- By Sales Channel: Hypermarkets/Supermarkets lead sales channels with a 40% share.
Driving factors
Shift Towards Healthier Beverage Options
The Iced Tea Market is significantly influenced by the rising consumer preference for healthier beverage alternatives to sugary sodas. As awareness of the health implications associated with high sugar intake intensifies, more consumers are turning towards iced tea, which offers a lower-calorie option.
A standard serving of sweetened iced tea contains about 80 calories, starkly less than most carbonated drinks, thereby supporting its positioning as a healthier choice. This trend not only boosts the consumption of traditional iced teas but also fuels demand for varieties with reduced or no added sugar, aligning with broader public health initiatives and changing dietary preferences.
Expansion of the Ready-to-Drink (RTD) Market
The increase in demand for ready-to-drink (RTD) beverages has been a pivotal driver for the iced tea market. Consumers value convenience and are increasingly seeking beverages that can be consumed on the go without additional preparation. This has led to a proliferation of iced tea products in various flavors and formulations, catering to a wide range of taste preferences and dietary requirements.
The versatility of iced tea, capable of incorporating an array of flavors—from classic lemon to exotic jasmine—allows it to stand out in the crowded RTD market. This adaptability makes iced tea appealing to both traditional tea drinkers and new customers looking for innovative beverage options.
Influence of Global Café Culture
The growing café culture and consumer interest in diverse tea offerings globally enhance the market for iced tea. Cafés have become trendsetters in beverage innovation, often introducing customers to different styles of tea drinks, including various iced versions. This exposure has encouraged the exploration of more diverse and premium iced tea products, reflecting global flavors and artisanal brewing techniques.
As consumers become more adventurous with their beverage choices, driven by experiences in cafés, the demand for upscale and novel iced tea products increases, supporting market expansion and premiumization. This trend is seen worldwide, as global connectivity and cultural exchange further influence consumer preferences in the beverage sector.
Restraining Factors
Intensified Competition from Alternative Cold Beverages
The growth of the Iced Tea Market faces significant challenges from the competition posed by other popular cold beverages such as cold brew coffee and fruit juices. These alternatives attract a substantial segment of health-conscious consumers and those seeking novelty in their beverage choices. Cold brew coffee, known for its smooth flavor and lower acidity, has gained popularity for its perceived health benefits over traditional coffee.
Similarly, fruit juices are often marketed as a natural source of vitamins and antioxidants, appealing to those prioritizing nutritional intake. This competition requires iced tea brands to continually innovate and differentiate their products through unique flavors, health-oriented formulations, and strategic marketing efforts to maintain consumer interest and market share.
Impact of Health Concerns Related to Sugar Content
Another major restraining factor for the Iced Tea Market is the health concerns associated with the high sugar content in many commercially available iced teas. A standard serving of sweetened iced tea contains about 80 calories, predominantly from sugars. With growing public awareness and governmental guidelines emphasizing reduced sugar consumption, consumers are increasingly scrutinizing beverage labels, leading to potential hesitancy towards sugary iced teas.
This scrutiny has prompted manufacturers to develop low-sugar and sugar-free alternatives that cater to health-conscious consumers without sacrificing taste. However, the challenge remains to educate consumers about these options and convince them of their palatability and health benefits, which is crucial for sustaining growth in a market where health considerations are becoming ever more dominant.
By Product Analysis
Black Iced Tea leads the product segment, commanding a dominant 55% market share.
In 2023, Black Iced Tea held a dominant market position in the By Product segment of the Iced Tea Market, capturing more than a 55% share. This segment's substantial market share can be attributed to the widespread consumer preference for the robust flavor profile and perceived health benefits associated with black tea. The global appreciation for black iced tea, coupled with its accessibility and variety in both ready-to-drink formats and loose-leaf preparations, has bolstered its market presence significantly.
Comparatively, Green Iced Tea, which is often marketed for its antioxidant properties and health advantages, secured a smaller portion of the market. Despite growing health consciousness among consumers, green iced tea's market penetration remained less extensive than that of black iced tea. Factors such as taste preference and the availability of product variations might influence this disparity.
The robust performance of Black Iced Tea in the market is supported by aggressive marketing strategies by major beverage corporations, which emphasize the refreshing quality and traditional appeal of black tea. Additionally, innovations in product offerings, such as the introduction of organic or flavored black iced teas, have catered to a broader audience, driving up consumption rates.
This analysis suggests that while Black Iced Tea continues to lead the market in terms of volume and revenue, there is substantial growth potential for Green Iced Tea, especially in markets with increasing demand for healthier beverage alternatives. Future strategies could focus on expanding the market reach of green iced tea through targeted health-centric marketing campaigns and diversifying flavor profiles to attract a larger consumer base.
By Form Analysis
The powder form of iced tea holds a substantial 30% share, leading its category.
In 2023, Powder held a dominant market position in the By Form segment of the Iced Tea Market, capturing more than a 30% share. This leadership can be largely attributed to the convenience and cost-effectiveness of powdered iced tea, which resonates with consumers seeking quick and easy beverage solutions. The ease of preparation, coupled with long shelf life and efficient distribution logistics, enhances its attractiveness in both retail and food service channels.
Contrasting with Powder, the other forms like Paste and Granules held smaller market shares. Paste, while offering a richer flavor profile and potentially shorter preparation time, has not penetrated the market as significantly. Consumer preference tends to favor powder due to its widespread availability and familiarity. Granules, on the other hand, occupy a niche market segment, appealing to those who prioritize texture and taste authenticity but have not garnered widespread acceptance akin to powder.
The dominance of powdered iced tea is also reinforced by extensive product variations and branding efforts by leading manufacturers. These companies have effectively utilized innovative packaging and aggressive marketing strategies to enhance product visibility and appeal. Additionally, the introduction of health-oriented variants, incorporating herbal and fruit infusions, has broadened the consumer base, tapping into the growing trend towards health and wellness.
Given the current market dynamics, the future growth of the powdered iced tea segment appears promising. However, tapping into emerging consumer trends towards natural and organic products could further solidify its market position, while exploring potential growth opportunities for paste and granule forms could diversify consumer choices in the segment.
By Nature Analysis
Organic tea captures 40% of the market by nature, reflecting strong consumer preference.
In 2023, Organic tea held a dominant market position in the By Nature segment of the Iced Tea Market, capturing more than a 40% share. This prominence is primarily driven by the growing consumer demand for sustainable and health-conscious products. Organic tea, known for being cultivated without the use of synthetic pesticides and fertilizers, appeals strongly to health-aware consumers and those concerned with environmental impact.
In contrast, Conventional tea, while still popular, is increasingly scrutinized for its environmental and health implications associated with chemical agricultural practices. Although conventional tea continues to be widely consumed due to its lower price point and extensive availability, the shift towards organic products is unmistakable and represents a significant trend in consumer preferences.
The market strength of organic tea is further bolstered by certifications and labels that reassure consumers about the quality and origin of the product. Such endorsements often translate into a willingness to pay a premium for organically produced iced tea. Moreover, innovative marketing strategies and the introduction of unique flavors in the organic segment are effectively expanding its consumer base.
The robust performance of organic tea highlights a key market shift towards organic and natural products across various consumer goods sectors. As the market evolves, organic tea is likely to maintain or even increase its market share, driven by continuing consumer interest in health, wellness, and sustainability. For stakeholders in the iced tea market, adapting to this shift and increasing offerings in the organic segment could be crucial for maintaining a competitive advantage.
By Application Analysis
Residential applications dominate, comprising 65% of the market, highlighting home consumption trends.
In 2023, Residential held a dominant market position in the By Application segment of the Iced Tea Market, capturing more than a 65% share. This segment’s strong performance is indicative of the high consumption rates of iced tea within household settings, driven by the beverage’s convenience, variety, and appeal to all age groups. The growing preference for home-consumed beverages, particularly those that offer health benefits and refreshing qualities like iced tea, has propelled this segment to the forefront of the market.
Conversely, the Commercial segment, which includes venues such as restaurants, cafes, and other food service establishments, accounted for a smaller share of the market. Despite its lower proportion, this segment plays a crucial role in consumer exposure and product innovation. However, the significant lead of the Residential segment underscores a trend towards in-home consumption, possibly influenced by increasing work-from-home arrangements and heightened health consciousness post-pandemic.
The dominance of the Residential application is further supported by the broad availability of iced tea products in supermarkets, online retail platforms, and specialty stores, making it easily accessible for home consumption. Additionally, marketing strategies targeting families and health-aware consumers have effectively boosted the appeal of iced tea for residential use.
Looking forward, the Residential segment is expected to maintain its market dominance, fueled by ongoing consumer interest in convenient and healthy beverage options. However, potential growth in the Commercial segment could emerge from increased consumer mobility and a resurgence in dining out, suggesting a balanced focus on both segments could be beneficial for market stakeholders.
By Sales Channel Analysis
Hypermarkets and supermarkets are the leading sales channel, controlling 40% of the market.
In 2023, Hypermarkets/Supermarkets held a dominant market position in the By Sales Channel segment of the Iced Tea Market, capturing more than a 40% share. This segment's leadership can be attributed to the extensive range of products offered, including a variety of iced tea brands and flavors that cater to diverse consumer preferences. Hypermarkets and supermarkets provide the convenience of one-stop shopping, which is highly valued by consumers seeking both variety and accessibility in their beverage purchases.
Other sales channels such as Convenience Stores, Drug Stores, Specialty Stores, Traditional Grocery Stores, and Online Stores also contribute to the distribution landscape but to varying extents. Convenience Stores offer quick access but typically a smaller selection, focusing on best-sellers. Drug Stores generally carry a limited assortment of health-oriented beverages, including iced teas aligned with wellness trends.
Specialty Stores provide premium and niche products but have a narrower customer base due to higher pricing and specialized offerings. Traditional Grocery Stores remain popular for routine shopping but have been somewhat overshadowed by larger retail formats. Meanwhile, Online Stores have been gaining traction, particularly among tech-savvy and younger consumers, offering convenience through home delivery and often competitive pricing.
The dominance of Hypermarkets/Supermarkets is underpinned by their ability to leverage scale, offering competitive pricing, promotional deals, and a wide assortment of products. As consumer habits continue to evolve, the strategic placement of iced tea products in these outlets will be critical in maintaining their market lead. However, the growing online segment suggests that a multi-channel strategy could be increasingly important for capturing a broader market share in the coming years.
Key Market Segments
By Product
- Black Iced Tea
- Green Iced Tea
By Form
- Powder
- Paste
- Granules
By Nature
- Organic tea
- Conventional tea
By Application
- Residential
- Commercial
By Sales channel
- Hypermarket/Supermarket
- Convenience Store
- Drug Stores
- Specialty Stores
- Traditional Grocery Store
- Online Stores
Growth Opportunity
Development of Health-Conscious Iced Tea Varieties
In 2023, significant growth opportunities for the global Iced Tea Market are anticipated through the development of low-calorie, sugar-free, and organic iced tea options. As consumers increasingly prioritize health and wellness, the demand for beverages that align with these values continues to rise. By offering low-calorie and sugar-free alternatives, iced tea brands can appeal to a broader demographic concerned with dietary restrictions and calorie intake.
Moreover, the organic iced tea segment is expected to expand as more consumers seek products with clean labels and environmentally friendly production practices. These offerings not only cater to health-conscious buyers but also enhance brand image and competitiveness in a market where consumers are more informed and selective about their purchases.
Expansion of Distribution Channels
Another pivotal growth avenue for the iced tea market in 2023 lies in the expansion of distribution channels, particularly through e-commerce and home delivery services. The ongoing shift towards online shopping, accelerated by the COVID-19 pandemic, has made e-commerce a crucial sales channel for beverage companies. By leveraging online platforms, iced tea brands can reach a wider audience, offer more personalized shopping experiences, and respond more dynamically to changing consumer trends.
Additionally, the integration of home delivery services meets the growing consumer expectation for convenience and immediate gratification. These expanded distribution strategies not only enhance consumer accessibility to iced tea products but also provide opportunities for brands to engage directly with consumers, gather valuable data, and drive loyalty in a competitive market.
Latest Trends
Premiumization through Exotic and Premium Tea Blends
In 2023, the global Iced Tea Market is witnessing a significant trend towards the introduction of exotic and premium tea blends within iced tea formulations. This shift is part of a broader movement toward premiumization, where consumers are increasingly seeking high-quality, distinct flavors and ingredients that offer a unique drinking experience. Exotic teas such as matcha, rooibos, and oolong are being incorporated into iced teas, providing new tastes and broadening the market's appeal.
These premium options often come with stories of origin and artisanal crafting methods that resonate with today’s consumers who value transparency and authenticity. This trend not only caters to the palate of traditional tea enthusiasts but also attracts new customers looking for a sophisticated alternative to conventional iced tea offerings.
Rise of Functional Iced Teas
Concurrently, there is an increasing popularity of functional iced teas that are infused with herbs, vitamins, and minerals, catering to the health-conscious segment of the market. These beverages are designed to provide health benefits beyond hydration, including enhanced energy, improved digestion, and stress relief, aligning with the growing consumer interest in functional foods and beverages.
Ingredients like ginseng, ginger, turmeric, and adaptogens are being added to iced teas to target specific health concerns. This trend towards health-oriented products is transforming the iced tea market into a more diverse and health-conscious space, offering substantial growth opportunities for brands that successfully combine health benefits with great taste and convenience.
Regional Analysis
The Asia Pacific region leads the Iced Tea Market, holding a dominant 35% share of the global market.
The global Iced Tea Market exhibits distinct regional dynamics, reflecting varying consumer preferences and market maturity levels. In the Asia Pacific region, which dominates the market with a 35% share, the popularity of iced tea is underpinned by a deep-rooted tea culture and a strong preference for tea over other beverages. Countries like China and Japan, renowned for their tea traditions, have modernized consumption by introducing innovative iced tea variants that align with local tastes and dietary habits. This region's dominance is further bolstered by the high population density and growing health awareness, leading to increased demand for healthier beverage options.
In North America, the market is characterized by a high demand for ready-to-drink (RTD) iced tea products, driven by convenience and a growing awareness of health-oriented beverages. The U.S. sees a significant trend towards low-calorie and sugar-free iced teas as consumers continue to shift away from sugary sodas. Europe, similarly, has seen a rise in the consumption of iced tea, with an emphasis on organic and natural formulations, reflecting the region's strong environmental and health consciousness.
The markets in Latin America and the Middle East & Africa, while smaller in comparison, are experiencing rapid growth. In Latin America, the expansion is driven by increasing urbanization and the influence of Western dietary trends, whereas in the Middle East & Africa, the growth is spurred by a young population and an increasing café culture, which introduces a variety of iced tea products to a new consumer base eager for diverse beverage options.
Key Regions and Countries
North America
- The US
- Canada
- Rest of North America
Europe
- Germany
- France
- The UK
- Spain
- Netherlands
- Russia
- Italy
- Rest of Europe
Asia-Pacific
- China
- Japan
- Singapore
- Thailand
- South Korea
- Vietnam
- India
- New Zealand
- Rest of Asia Pacific
Latin America
- Mexico
- Brazil
- Rest of Latin America
Middle East & Africa
- Saudi Arabia
- South Africa
- UAE
- Rest of Middle East & Africa
Key Players Analysis
In 2023, the global Iced Tea Market is highly competitive with key players strategically positioning themselves to capitalize on emerging consumer trends. Companies like The Coffee Bean & Tea Leaf and Unilever are notable for their extensive distribution networks and robust product portfolios, which include a variety of iced tea flavors appealing to a broad consumer base. Unilever, with its global reach and strong brand recognition, continues to innovate by introducing health-oriented iced tea options, aligning with the growing demand for wellness products.
Smaller, niche companies such as Harney & Sons Fine Teas and Dilmah Ceylon Tea Company PLC emphasize the quality and authenticity of their offerings, focusing on premium, sustainably sourced teas to cater to the connoisseur market. These companies benefit from the premiumization trend, where consumers are willing to pay a higher price for products perceived as superior in quality or ethical production.
Emerging players like Gourmesso and Ippodo Tea Co. Ltd. are making significant inroads by tapping into the specialty segment, offering unique tea blends and regional specialties that distinguish them from larger brands. Meanwhile, innovative U.S. brands such as Tranquini, Chillbev, and Som Sleep are exploring the functional beverage space, infusing their iced teas with vitamins, minerals, and other supplements to enhance health benefits, targeting health-conscious consumers looking for more than just refreshment.
Finally, companies like BevNet.com provide valuable industry insights and networking opportunities for all market participants, supporting the sector's growth by highlighting trends, new products, and industry best practices. These dynamics illustrate a vibrant and evolving market landscape where traditional and innovative approaches converge to meet diverse consumer preferences.
Market Key Players
- The Coffee Bean & Tea Leaf (U.S)
- Unilever (U.K)
- Gourmesso (U.S)
- Harney & Sons Fine Teas (U.S)
- Dualit (U.K)
- Nestlé SA (Switzerland)
- Dilmah Ceylon Tea Company PLC (Sri Lanka)
- Ippodo Tea Co. Ltd. (China)
- Tranquini (U.S)
- Chillbev (U.S)
- Som Sleep (U.S)
- Phi Drinks, Inc.(U.S)
- BevNet.com (U.S)
Recent Development
- In April 2024, The Coffee Bean & Tea Leaf introduced a new seasonal iced tea line featuring exotic fruit flavors, anticipated to increase their summer sales by 20%. This launch targets the growing trend of flavor experimentation among younger consumers.
- In March 2024, Dualit introduced a new iced tea maker in March 2024 designed for both commercial and home use. This launch is expected to increase Dualit's market penetration by 20% in the U.K., appealing particularly to the domestic consumer segment.
- In February 2024, Harney & Sons Fine Teas partnered with a renowned lifestyle influencer to promote their new organic iced tea range. This marketing strategy has successfully increased its brand visibility and is projected to grow its customer base by 25% over the next six months.
Report Scope
Report Features Description Market Value (2023) USD 53.3 Billion Forecast Revenue (2033) USD 100.3 Billion CAGR (2024-2032) 6.7% Base Year for Estimation 2023 Historic Period 2016-2023 Forecast Period 2024-2033 Report Coverage Revenue Forecast, Market Dynamics, COVID-19 Impact, Competitive Landscape, Recent Developments Segments Covered By Product(Black Iced Tea, Green Iced Tea), By Form(Powder, Paste, Granules), By Nature(Organic tea, Conventional tea), By Application(Residential, Commercial), By Sales channel(Hypermarket/Supermarket, Convenience Store, Drug Stores, Specialty Stores, Traditional Grocery Store, Online Stores) Regional Analysis North America - The US, Canada, Rest of North America, Europe - Germany, France, The UK, Spain, Italy, Russia, Netherlands, Rest of Europe, Asia-Pacific - China, Japan, South Korea, India, New Zealand, Singapore, Thailand, Vietnam, Rest of Asia Pacific, Latin America - Brazil, Mexico, Rest of Latin America, Middle East & Africa - South Africa, Saudi Arabia, UAE, Rest of Middle East & Africa Competitive Landscape The Coffee Bean & Tea Leaf (U.S), Unilever (U.K), Gourmesso (U.S), Harney & Sons Fine Teas (U.S), Dualit (U.K), Nestlé SA (Switzerland), Dilmah Ceylon Tea Company PLC (Sri Lanka), Ippodo Tea Co. Ltd. (China), Tranquini (U.S), Chillbev (U.S), Som Sleep (U.S), Phi Drinks, Inc.(U.S), BevNet.com (U.S) Customization Scope Customization for segments, region/country-level will be provided. Moreover, additional customization can be done based on the requirements. Purchase Options We have three licenses to opt for Single User License, Multi-User License (Up to 5 Users), Corporate Use License (Unlimited User and Printable PDF) -
- 1. Executive Summary
- 1.1. Definition
- 1.2. Taxonomy
- 1.3. Research Scope
- 1.4. Key Analysis
- 1.5. Key Findings by Major Segments
- 1.6. Top strategies by Major Players
- 2. Global Iced Tea Market Overview
- 2.1. Iced Tea Market Dynamics
- 2.1.1. Drivers
- 2.1.2. Opportunities
- 2.1.3. Restraints
- 2.1.4. Challenges
- 2.2. Macro-economic Factors
- 2.3. Regulatory Framework
- 2.4. Market Investment Feasibility Index
- 2.5. PEST Analysis
- 2.6. PORTER’S Five Force Analysis
- 2.7. Drivers & Restraints Impact Analysis
- 2.8. Industry Chain Analysis
- 2.9. Cost Structure Analysis
- 2.10. Marketing Strategy
- 2.11. Russia-Ukraine War Impact Analysis
- 2.12. Opportunity Map Analysis
- 2.13. Market Competition Scenario Analysis
- 2.14. Product Life Cycle Analysis
- 2.15. Opportunity Orbits
- 2.16. Manufacturer Intensity Map
- 2.17. Major Companies sales by Value & Volume
- 2.1. Iced Tea Market Dynamics
- 3. Global Iced Tea Market Analysis, Opportunity and Forecast, 2016-2032
- 3.1. Global Iced Tea Market Analysis, 2016-2021
- 3.2. Global Iced Tea Market Opportunity and Forecast, 2023-2032
- 3.3. Global Iced Tea Market Analysis, Opportunity and Forecast, By By Product, 2016-2032
- 3.3.1. Global Iced Tea Market Analysis by By Product: Introduction
- 3.3.2. Market Size Absolute $ Opportunity Analysis and Forecast, By By Product, 2016-2032
- 3.3.3. Black Iced Tea
- 3.3.4. Green Iced Tea
- 3.4. Global Iced Tea Market Analysis, Opportunity and Forecast, By By Form, 2016-2032
- 3.4.1. Global Iced Tea Market Analysis by By Form: Introduction
- 3.4.2. Market Size Absolute $ Opportunity Analysis and Forecast, By By Form, 2016-2032
- 3.4.3. Powder
- 3.4.4. Paste
- 3.4.5. Granules
- 3.5. Global Iced Tea Market Analysis, Opportunity and Forecast, By By Nature, 2016-2032
- 3.5.1. Global Iced Tea Market Analysis by By Nature: Introduction
- 3.5.2. Market Size Absolute $ Opportunity Analysis and Forecast, By By Nature, 2016-2032
- 3.5.3. Organic tea
- 3.5.4. Conventional tea
- 3.6. Global Iced Tea Market Analysis, Opportunity and Forecast, By By Application, 2016-2032
- 3.6.1. Global Iced Tea Market Analysis by By Application: Introduction
- 3.6.2. Market Size Absolute $ Opportunity Analysis and Forecast, By By Application, 2016-2032
- 3.6.3. Residential
- 3.6.4. Commercial
- 3.7. Global Iced Tea Market Analysis, Opportunity and Forecast, By By Sales channel, 2016-2032
- 3.7.1. Global Iced Tea Market Analysis by By Sales channel: Introduction
- 3.7.2. Market Size Absolute $ Opportunity Analysis and Forecast, By By Sales channel, 2016-2032
- 3.7.3. Hypermarket/Supermarket
- 3.7.4. Convenience Store
- 3.7.5. Drug Stores
- 3.7.6. Specialty Stores
- 3.7.7. Traditional Grocery Store
- 3.7.8. Online Stores
- 4. North America Iced Tea Market Analysis, Opportunity and Forecast, 2016-2032
- 4.1. North America Iced Tea Market Analysis, 2016-2021
- 4.2. North America Iced Tea Market Opportunity and Forecast, 2023-2032
- 4.3. North America Iced Tea Market Analysis, Opportunity and Forecast, By By Product, 2016-2032
- 4.3.1. North America Iced Tea Market Analysis by By Product: Introduction
- 4.3.2. Market Size Absolute $ Opportunity Analysis and Forecast, By By Product, 2016-2032
- 4.3.3. Black Iced Tea
- 4.3.4. Green Iced Tea
- 4.4. North America Iced Tea Market Analysis, Opportunity and Forecast, By By Form, 2016-2032
- 4.4.1. North America Iced Tea Market Analysis by By Form: Introduction
- 4.4.2. Market Size Absolute $ Opportunity Analysis and Forecast, By By Form, 2016-2032
- 4.4.3. Powder
- 4.4.4. Paste
- 4.4.5. Granules
- 4.5. North America Iced Tea Market Analysis, Opportunity and Forecast, By By Nature, 2016-2032
- 4.5.1. North America Iced Tea Market Analysis by By Nature: Introduction
- 4.5.2. Market Size Absolute $ Opportunity Analysis and Forecast, By By Nature, 2016-2032
- 4.5.3. Organic tea
- 4.5.4. Conventional tea
- 4.6. North America Iced Tea Market Analysis, Opportunity and Forecast, By By Application, 2016-2032
- 4.6.1. North America Iced Tea Market Analysis by By Application: Introduction
- 4.6.2. Market Size Absolute $ Opportunity Analysis and Forecast, By By Application, 2016-2032
- 4.6.3. Residential
- 4.6.4. Commercial
- 4.7. North America Iced Tea Market Analysis, Opportunity and Forecast, By By Sales channel, 2016-2032
- 4.7.1. North America Iced Tea Market Analysis by By Sales channel: Introduction
- 4.7.2. Market Size Absolute $ Opportunity Analysis and Forecast, By By Sales channel, 2016-2032
- 4.7.3. Hypermarket/Supermarket
- 4.7.4. Convenience Store
- 4.7.5. Drug Stores
- 4.7.6. Specialty Stores
- 4.7.7. Traditional Grocery Store
- 4.7.8. Online Stores
- 4.8. North America Iced Tea Market Analysis, Opportunity and Forecast, By Country , 2016-2032
- 4.8.1. North America Iced Tea Market Analysis by Country : Introduction
- 4.8.2. Market Size Absolute $ Opportunity Analysis and Forecast, Country , 2016-2032
- 4.8.2.1. The US
- 4.8.2.2. Canada
- 4.8.2.3. Mexico
- 5. Western Europe Iced Tea Market Analysis, Opportunity and Forecast, 2016-2032
- 5.1. Western Europe Iced Tea Market Analysis, 2016-2021
- 5.2. Western Europe Iced Tea Market Opportunity and Forecast, 2023-2032
- 5.3. Western Europe Iced Tea Market Analysis, Opportunity and Forecast, By By Product, 2016-2032
- 5.3.1. Western Europe Iced Tea Market Analysis by By Product: Introduction
- 5.3.2. Market Size Absolute $ Opportunity Analysis and Forecast, By By Product, 2016-2032
- 5.3.3. Black Iced Tea
- 5.3.4. Green Iced Tea
- 5.4. Western Europe Iced Tea Market Analysis, Opportunity and Forecast, By By Form, 2016-2032
- 5.4.1. Western Europe Iced Tea Market Analysis by By Form: Introduction
- 5.4.2. Market Size Absolute $ Opportunity Analysis and Forecast, By By Form, 2016-2032
- 5.4.3. Powder
- 5.4.4. Paste
- 5.4.5. Granules
- 5.5. Western Europe Iced Tea Market Analysis, Opportunity and Forecast, By By Nature, 2016-2032
- 5.5.1. Western Europe Iced Tea Market Analysis by By Nature: Introduction
- 5.5.2. Market Size Absolute $ Opportunity Analysis and Forecast, By By Nature, 2016-2032
- 5.5.3. Organic tea
- 5.5.4. Conventional tea
- 5.6. Western Europe Iced Tea Market Analysis, Opportunity and Forecast, By By Application, 2016-2032
- 5.6.1. Western Europe Iced Tea Market Analysis by By Application: Introduction
- 5.6.2. Market Size Absolute $ Opportunity Analysis and Forecast, By By Application, 2016-2032
- 5.6.3. Residential
- 5.6.4. Commercial
- 5.7. Western Europe Iced Tea Market Analysis, Opportunity and Forecast, By By Sales channel, 2016-2032
- 5.7.1. Western Europe Iced Tea Market Analysis by By Sales channel: Introduction
- 5.7.2. Market Size Absolute $ Opportunity Analysis and Forecast, By By Sales channel, 2016-2032
- 5.7.3. Hypermarket/Supermarket
- 5.7.4. Convenience Store
- 5.7.5. Drug Stores
- 5.7.6. Specialty Stores
- 5.7.7. Traditional Grocery Store
- 5.7.8. Online Stores
- 5.8. Western Europe Iced Tea Market Analysis, Opportunity and Forecast, By Country , 2016-2032
- 5.8.1. Western Europe Iced Tea Market Analysis by Country : Introduction
- 5.8.2. Market Size Absolute $ Opportunity Analysis and Forecast, Country , 2016-2032
- 5.8.2.1. Germany
- 5.8.2.2. France
- 5.8.2.3. The UK
- 5.8.2.4. Spain
- 5.8.2.5. Italy
- 5.8.2.6. Portugal
- 5.8.2.7. Ireland
- 5.8.2.8. Austria
- 5.8.2.9. Switzerland
- 5.8.2.10. Benelux
- 5.8.2.11. Nordic
- 5.8.2.12. Rest of Western Europe
- 6. Eastern Europe Iced Tea Market Analysis, Opportunity and Forecast, 2016-2032
- 6.1. Eastern Europe Iced Tea Market Analysis, 2016-2021
- 6.2. Eastern Europe Iced Tea Market Opportunity and Forecast, 2023-2032
- 6.3. Eastern Europe Iced Tea Market Analysis, Opportunity and Forecast, By By Product, 2016-2032
- 6.3.1. Eastern Europe Iced Tea Market Analysis by By Product: Introduction
- 6.3.2. Market Size Absolute $ Opportunity Analysis and Forecast, By By Product, 2016-2032
- 6.3.3. Black Iced Tea
- 6.3.4. Green Iced Tea
- 6.4. Eastern Europe Iced Tea Market Analysis, Opportunity and Forecast, By By Form, 2016-2032
- 6.4.1. Eastern Europe Iced Tea Market Analysis by By Form: Introduction
- 6.4.2. Market Size Absolute $ Opportunity Analysis and Forecast, By By Form, 2016-2032
- 6.4.3. Powder
- 6.4.4. Paste
- 6.4.5. Granules
- 6.5. Eastern Europe Iced Tea Market Analysis, Opportunity and Forecast, By By Nature, 2016-2032
- 6.5.1. Eastern Europe Iced Tea Market Analysis by By Nature: Introduction
- 6.5.2. Market Size Absolute $ Opportunity Analysis and Forecast, By By Nature, 2016-2032
- 6.5.3. Organic tea
- 6.5.4. Conventional tea
- 6.6. Eastern Europe Iced Tea Market Analysis, Opportunity and Forecast, By By Application, 2016-2032
- 6.6.1. Eastern Europe Iced Tea Market Analysis by By Application: Introduction
- 6.6.2. Market Size Absolute $ Opportunity Analysis and Forecast, By By Application, 2016-2032
- 6.6.3. Residential
- 6.6.4. Commercial
- 6.7. Eastern Europe Iced Tea Market Analysis, Opportunity and Forecast, By By Sales channel, 2016-2032
- 6.7.1. Eastern Europe Iced Tea Market Analysis by By Sales channel: Introduction
- 6.7.2. Market Size Absolute $ Opportunity Analysis and Forecast, By By Sales channel, 2016-2032
- 6.7.3. Hypermarket/Supermarket
- 6.7.4. Convenience Store
- 6.7.5. Drug Stores
- 6.7.6. Specialty Stores
- 6.7.7. Traditional Grocery Store
- 6.7.8. Online Stores
- 6.8. Eastern Europe Iced Tea Market Analysis, Opportunity and Forecast, By Country , 2016-2032
- 6.8.1. Eastern Europe Iced Tea Market Analysis by Country : Introduction
- 6.8.2. Market Size Absolute $ Opportunity Analysis and Forecast, Country , 2016-2032
- 6.8.2.1. Russia
- 6.8.2.2. Poland
- 6.8.2.3. The Czech Republic
- 6.8.2.4. Greece
- 6.8.2.5. Rest of Eastern Europe
- 7. APAC Iced Tea Market Analysis, Opportunity and Forecast, 2016-2032
- 7.1. APAC Iced Tea Market Analysis, 2016-2021
- 7.2. APAC Iced Tea Market Opportunity and Forecast, 2023-2032
- 7.3. APAC Iced Tea Market Analysis, Opportunity and Forecast, By By Product, 2016-2032
- 7.3.1. APAC Iced Tea Market Analysis by By Product: Introduction
- 7.3.2. Market Size Absolute $ Opportunity Analysis and Forecast, By By Product, 2016-2032
- 7.3.3. Black Iced Tea
- 7.3.4. Green Iced Tea
- 7.4. APAC Iced Tea Market Analysis, Opportunity and Forecast, By By Form, 2016-2032
- 7.4.1. APAC Iced Tea Market Analysis by By Form: Introduction
- 7.4.2. Market Size Absolute $ Opportunity Analysis and Forecast, By By Form, 2016-2032
- 7.4.3. Powder
- 7.4.4. Paste
- 7.4.5. Granules
- 7.5. APAC Iced Tea Market Analysis, Opportunity and Forecast, By By Nature, 2016-2032
- 7.5.1. APAC Iced Tea Market Analysis by By Nature: Introduction
- 7.5.2. Market Size Absolute $ Opportunity Analysis and Forecast, By By Nature, 2016-2032
- 7.5.3. Organic tea
- 7.5.4. Conventional tea
- 7.6. APAC Iced Tea Market Analysis, Opportunity and Forecast, By By Application, 2016-2032
- 7.6.1. APAC Iced Tea Market Analysis by By Application: Introduction
- 7.6.2. Market Size Absolute $ Opportunity Analysis and Forecast, By By Application, 2016-2032
- 7.6.3. Residential
- 7.6.4. Commercial
- 7.7. APAC Iced Tea Market Analysis, Opportunity and Forecast, By By Sales channel, 2016-2032
- 7.7.1. APAC Iced Tea Market Analysis by By Sales channel: Introduction
- 7.7.2. Market Size Absolute $ Opportunity Analysis and Forecast, By By Sales channel, 2016-2032
- 7.7.3. Hypermarket/Supermarket
- 7.7.4. Convenience Store
- 7.7.5. Drug Stores
- 7.7.6. Specialty Stores
- 7.7.7. Traditional Grocery Store
- 7.7.8. Online Stores
- 7.8. APAC Iced Tea Market Analysis, Opportunity and Forecast, By Country , 2016-2032
- 7.8.1. APAC Iced Tea Market Analysis by Country : Introduction
- 7.8.2. Market Size Absolute $ Opportunity Analysis and Forecast, Country , 2016-2032
- 7.8.2.1. China
- 7.8.2.2. Japan
- 7.8.2.3. South Korea
- 7.8.2.4. India
- 7.8.2.5. Australia & New Zeland
- 7.8.2.6. Indonesia
- 7.8.2.7. Malaysia
- 7.8.2.8. Philippines
- 7.8.2.9. Singapore
- 7.8.2.10. Thailand
- 7.8.2.11. Vietnam
- 7.8.2.12. Rest of APAC
- 8. Latin America Iced Tea Market Analysis, Opportunity and Forecast, 2016-2032
- 8.1. Latin America Iced Tea Market Analysis, 2016-2021
- 8.2. Latin America Iced Tea Market Opportunity and Forecast, 2023-2032
- 8.3. Latin America Iced Tea Market Analysis, Opportunity and Forecast, By By Product, 2016-2032
- 8.3.1. Latin America Iced Tea Market Analysis by By Product: Introduction
- 8.3.2. Market Size Absolute $ Opportunity Analysis and Forecast, By By Product, 2016-2032
- 8.3.3. Black Iced Tea
- 8.3.4. Green Iced Tea
- 8.4. Latin America Iced Tea Market Analysis, Opportunity and Forecast, By By Form, 2016-2032
- 8.4.1. Latin America Iced Tea Market Analysis by By Form: Introduction
- 8.4.2. Market Size Absolute $ Opportunity Analysis and Forecast, By By Form, 2016-2032
- 8.4.3. Powder
- 8.4.4. Paste
- 8.4.5. Granules
- 8.5. Latin America Iced Tea Market Analysis, Opportunity and Forecast, By By Nature, 2016-2032
- 8.5.1. Latin America Iced Tea Market Analysis by By Nature: Introduction
- 8.5.2. Market Size Absolute $ Opportunity Analysis and Forecast, By By Nature, 2016-2032
- 8.5.3. Organic tea
- 8.5.4. Conventional tea
- 8.6. Latin America Iced Tea Market Analysis, Opportunity and Forecast, By By Application, 2016-2032
- 8.6.1. Latin America Iced Tea Market Analysis by By Application: Introduction
- 8.6.2. Market Size Absolute $ Opportunity Analysis and Forecast, By By Application, 2016-2032
- 8.6.3. Residential
- 8.6.4. Commercial
- 8.7. Latin America Iced Tea Market Analysis, Opportunity and Forecast, By By Sales channel, 2016-2032
- 8.7.1. Latin America Iced Tea Market Analysis by By Sales channel: Introduction
- 8.7.2. Market Size Absolute $ Opportunity Analysis and Forecast, By By Sales channel, 2016-2032
- 8.7.3. Hypermarket/Supermarket
- 8.7.4. Convenience Store
- 8.7.5. Drug Stores
- 8.7.6. Specialty Stores
- 8.7.7. Traditional Grocery Store
- 8.7.8. Online Stores
- 8.8. Latin America Iced Tea Market Analysis, Opportunity and Forecast, By Country , 2016-2032
- 8.8.1. Latin America Iced Tea Market Analysis by Country : Introduction
- 8.8.2. Market Size Absolute $ Opportunity Analysis and Forecast, Country , 2016-2032
- 8.8.2.1. Brazil
- 8.8.2.2. Colombia
- 8.8.2.3. Chile
- 8.8.2.4. Argentina
- 8.8.2.5. Costa Rica
- 8.8.2.6. Rest of Latin America
- 9. Middle East & Africa Iced Tea Market Analysis, Opportunity and Forecast, 2016-2032
- 9.1. Middle East & Africa Iced Tea Market Analysis, 2016-2021
- 9.2. Middle East & Africa Iced Tea Market Opportunity and Forecast, 2023-2032
- 9.3. Middle East & Africa Iced Tea Market Analysis, Opportunity and Forecast, By By Product, 2016-2032
- 9.3.1. Middle East & Africa Iced Tea Market Analysis by By Product: Introduction
- 9.3.2. Market Size Absolute $ Opportunity Analysis and Forecast, By By Product, 2016-2032
- 9.3.3. Black Iced Tea
- 9.3.4. Green Iced Tea
- 9.4. Middle East & Africa Iced Tea Market Analysis, Opportunity and Forecast, By By Form, 2016-2032
- 9.4.1. Middle East & Africa Iced Tea Market Analysis by By Form: Introduction
- 9.4.2. Market Size Absolute $ Opportunity Analysis and Forecast, By By Form, 2016-2032
- 9.4.3. Powder
- 9.4.4. Paste
- 9.4.5. Granules
- 9.5. Middle East & Africa Iced Tea Market Analysis, Opportunity and Forecast, By By Nature, 2016-2032
- 9.5.1. Middle East & Africa Iced Tea Market Analysis by By Nature: Introduction
- 9.5.2. Market Size Absolute $ Opportunity Analysis and Forecast, By By Nature, 2016-2032
- 9.5.3. Organic tea
- 9.5.4. Conventional tea
- 9.6. Middle East & Africa Iced Tea Market Analysis, Opportunity and Forecast, By By Application, 2016-2032
- 9.6.1. Middle East & Africa Iced Tea Market Analysis by By Application: Introduction
- 9.6.2. Market Size Absolute $ Opportunity Analysis and Forecast, By By Application, 2016-2032
- 9.6.3. Residential
- 9.6.4. Commercial
- 9.7. Middle East & Africa Iced Tea Market Analysis, Opportunity and Forecast, By By Sales channel, 2016-2032
- 9.7.1. Middle East & Africa Iced Tea Market Analysis by By Sales channel: Introduction
- 9.7.2. Market Size Absolute $ Opportunity Analysis and Forecast, By By Sales channel, 2016-2032
- 9.7.3. Hypermarket/Supermarket
- 9.7.4. Convenience Store
- 9.7.5. Drug Stores
- 9.7.6. Specialty Stores
- 9.7.7. Traditional Grocery Store
- 9.7.8. Online Stores
- 9.8. Middle East & Africa Iced Tea Market Analysis, Opportunity and Forecast, By Country , 2016-2032
- 9.8.1. Middle East & Africa Iced Tea Market Analysis by Country : Introduction
- 9.8.2. Market Size Absolute $ Opportunity Analysis and Forecast, Country , 2016-2032
- 9.8.2.1. Algeria
- 9.8.2.2. Egypt
- 9.8.2.3. Israel
- 9.8.2.4. Kuwait
- 9.8.2.5. Nigeria
- 9.8.2.6. Saudi Arabia
- 9.8.2.7. South Africa
- 9.8.2.8. Turkey
- 9.8.2.9. The UAE
- 9.8.2.10. Rest of MEA
- 10. Global Iced Tea Market Analysis, Opportunity and Forecast, By Region , 2016-2032
- 10.1. Global Iced Tea Market Analysis by Region : Introduction
- 10.2. Market Size Absolute $ Opportunity Analysis and Forecast, By Region , 2016-2032
- 10.2.1. North America
- 10.2.2. Western Europe
- 10.2.3. Eastern Europe
- 10.2.4. APAC
- 10.2.5. Latin America
- 10.2.6. Middle East & Africa
- 11. Global Iced Tea Market Competitive Landscape, Market Share Analysis, and Company Profiles
- 11.1. Market Share Analysis
- 11.2. Company Profiles
- 11.3. The Coffee Bean & Tea Leaf (U.S)
- 11.3.1. Company Overview
- 11.3.2. Financial Highlights
- 11.3.3. Product Portfolio
- 11.3.4. SWOT Analysis
- 11.3.5. Key Strategies and Developments
- 11.4. Unilever (U.K)
- 11.4.1. Company Overview
- 11.4.2. Financial Highlights
- 11.4.3. Product Portfolio
- 11.4.4. SWOT Analysis
- 11.4.5. Key Strategies and Developments
- 11.5. Gourmesso (U.S)
- 11.5.1. Company Overview
- 11.5.2. Financial Highlights
- 11.5.3. Product Portfolio
- 11.5.4. SWOT Analysis
- 11.5.5. Key Strategies and Developments
- 11.6. Harney & Sons Fine Teas (U.S)
- 11.6.1. Company Overview
- 11.6.2. Financial Highlights
- 11.6.3. Product Portfolio
- 11.6.4. SWOT Analysis
- 11.6.5. Key Strategies and Developments
- 11.7. Dualit (U.K)
- 11.7.1. Company Overview
- 11.7.2. Financial Highlights
- 11.7.3. Product Portfolio
- 11.7.4. SWOT Analysis
- 11.7.5. Key Strategies and Developments
- 11.8. Nestlé SA (Switzerland)
- 11.8.1. Company Overview
- 11.8.2. Financial Highlights
- 11.8.3. Product Portfolio
- 11.8.4. SWOT Analysis
- 11.8.5. Key Strategies and Developments
- 11.9. Dilmah Ceylon Tea Company PLC (Sri Lanka)
- 11.9.1. Company Overview
- 11.9.2. Financial Highlights
- 11.9.3. Product Portfolio
- 11.9.4. SWOT Analysis
- 11.9.5. Key Strategies and Developments
- 11.10. Ippodo Tea Co. Ltd. (China)
- 11.10.1. Company Overview
- 11.10.2. Financial Highlights
- 11.10.3. Product Portfolio
- 11.10.4. SWOT Analysis
- 11.10.5. Key Strategies and Developments
- 11.11. Tranquini (U.S)
- 11.11.1. Company Overview
- 11.11.2. Financial Highlights
- 11.11.3. Product Portfolio
- 11.11.4. SWOT Analysis
- 11.11.5. Key Strategies and Developments
- 11.12. Chillbev (U.S)
- 11.12.1. Company Overview
- 11.12.2. Financial Highlights
- 11.12.3. Product Portfolio
- 11.12.4. SWOT Analysis
- 11.12.5. Key Strategies and Developments
- 11.13.1. Company Overview
- 11.13.2. Financial Highlights
- 11.13.3. Product Portfolio
- 11.13.4. SWOT Analysis
- 11.13.5. Key Strategies and Developments
- 11.14. Som Sleep (U.S)
- 11.14.1. Company Overview
- 11.14.2. Financial Highlights
- 11.14.3. Product Portfolio
- 11.14.4. SWOT Analysis
- 11.14.5. Key Strategies and Developments
- 11.15. BevNet.com (U.S)
- 11.15.1. Company Overview
- 11.15.2. Financial Highlights
- 11.15.3. Product Portfolio
- 11.15.4. SWOT Analysis
- 11.15.5. Key Strategies and Developments
- 12. Assumptions and Acronyms
- 13. Research Methodology
- 14. Contact
"
- List of Figures
- "
- Figure 1: Global Iced Tea Market Revenue (US$ Mn) Market Share by By Product in 2022
- Figure 2: Global Iced Tea Market Market Attractiveness Analysis by By Product, 2016-2032
- Figure 3: Global Iced Tea Market Revenue (US$ Mn) Market Share by By Formin 2022
- Figure 4: Global Iced Tea Market Market Attractiveness Analysis by By Form, 2016-2032
- Figure 5: Global Iced Tea Market Revenue (US$ Mn) Market Share by By Naturein 2022
- Figure 6: Global Iced Tea Market Market Attractiveness Analysis by By Nature, 2016-2032
- Figure 7: Global Iced Tea Market Revenue (US$ Mn) Market Share by By Applicationin 2022
- Figure 8: Global Iced Tea Market Market Attractiveness Analysis by By Application, 2016-2032
- Figure 9: Global Iced Tea Market Revenue (US$ Mn) Market Share by By Sales channelin 2022
- Figure 10: Global Iced Tea Market Market Attractiveness Analysis by By Sales channel, 2016-2032
- Figure 11: Global Iced Tea Market Revenue (US$ Mn) Market Share by Region in 2022
- Figure 12: Global Iced Tea Market Market Attractiveness Analysis by Region, 2016-2032
- Figure 13: Global Iced Tea Market Market Revenue (US$ Mn) (2016-2032)
- Figure 14: Global Iced Tea Market Market Revenue (US$ Mn) Comparison by Region (2016-2032)
- Figure 15: Global Iced Tea Market Market Revenue (US$ Mn) Comparison by By Product (2016-2032)
- Figure 16: Global Iced Tea Market Market Revenue (US$ Mn) Comparison by By Form (2016-2032)
- Figure 17: Global Iced Tea Market Market Revenue (US$ Mn) Comparison by By Nature (2016-2032)
- Figure 18: Global Iced Tea Market Market Revenue (US$ Mn) Comparison by By Application (2016-2032)
- Figure 19: Global Iced Tea Market Market Revenue (US$ Mn) Comparison by By Sales channel (2016-2032)
- Figure 20: Global Iced Tea Market Market Y-o-Y Growth Rate Comparison by Region (2016-2032)
- Figure 21: Global Iced Tea Market Market Y-o-Y Growth Rate Comparison by By Product (2016-2032)
- Figure 22: Global Iced Tea Market Market Y-o-Y Growth Rate Comparison by By Form (2016-2032)
- Figure 23: Global Iced Tea Market Market Y-o-Y Growth Rate Comparison by By Nature (2016-2032)
- Figure 24: Global Iced Tea Market Market Y-o-Y Growth Rate Comparison by By Application (2016-2032)
- Figure 25: Global Iced Tea Market Market Y-o-Y Growth Rate Comparison by By Sales channel (2016-2032)
- Figure 26: Global Iced Tea Market Market Share Comparison by Region (2016-2032)
- Figure 27: Global Iced Tea Market Market Share Comparison by By Product (2016-2032)
- Figure 28: Global Iced Tea Market Market Share Comparison by By Form (2016-2032)
- Figure 29: Global Iced Tea Market Market Share Comparison by By Nature (2016-2032)
- Figure 30: Global Iced Tea Market Market Share Comparison by By Application (2016-2032)
- Figure 31: Global Iced Tea Market Market Share Comparison by By Sales channel (2016-2032)
- Figure 32: North America Iced Tea Market Revenue (US$ Mn) Market Share by By Productin 2022
- Figure 33: North America Iced Tea Market Market Attractiveness Analysis by By Product, 2016-2032
- Figure 34: North America Iced Tea Market Revenue (US$ Mn) Market Share by By Formin 2022
- Figure 35: North America Iced Tea Market Market Attractiveness Analysis by By Form, 2016-2032
- Figure 36: North America Iced Tea Market Revenue (US$ Mn) Market Share by By Naturein 2022
- Figure 37: North America Iced Tea Market Market Attractiveness Analysis by By Nature, 2016-2032
- Figure 38: North America Iced Tea Market Revenue (US$ Mn) Market Share by By Applicationin 2022
- Figure 39: North America Iced Tea Market Market Attractiveness Analysis by By Application, 2016-2032
- Figure 40: North America Iced Tea Market Revenue (US$ Mn) Market Share by By Sales channelin 2022
- Figure 41: North America Iced Tea Market Market Attractiveness Analysis by By Sales channel, 2016-2032
- Figure 42: North America Iced Tea Market Revenue (US$ Mn) Market Share by Country in 2022
- Figure 43: North America Iced Tea Market Market Attractiveness Analysis by Country, 2016-2032
- Figure 44: North America Iced Tea Market Market Revenue (US$ Mn) (2016-2032)
- Figure 45: North America Iced Tea Market Market Revenue (US$ Mn) Comparison by Country (2016-2032)
- Figure 46: North America Iced Tea Market Market Revenue (US$ Mn) Comparison by By Product (2016-2032)
- Figure 47: North America Iced Tea Market Market Revenue (US$ Mn) Comparison by By Form (2016-2032)
- Figure 48: North America Iced Tea Market Market Revenue (US$ Mn) Comparison by By Nature (2016-2032)
- Figure 49: North America Iced Tea Market Market Revenue (US$ Mn) Comparison by By Application (2016-2032)
- Figure 50: North America Iced Tea Market Market Revenue (US$ Mn) Comparison by By Sales channel (2016-2032)
- Figure 51: North America Iced Tea Market Market Y-o-Y Growth Rate Comparison by Country (2016-2032)
- Figure 52: North America Iced Tea Market Market Y-o-Y Growth Rate Comparison by By Product (2016-2032)
- Figure 53: North America Iced Tea Market Market Y-o-Y Growth Rate Comparison by By Form (2016-2032)
- Figure 54: North America Iced Tea Market Market Y-o-Y Growth Rate Comparison by By Nature (2016-2032)
- Figure 55: North America Iced Tea Market Market Y-o-Y Growth Rate Comparison by By Application (2016-2032)
- Figure 56: North America Iced Tea Market Market Y-o-Y Growth Rate Comparison by By Sales channel (2016-2032)
- Figure 57: North America Iced Tea Market Market Share Comparison by Country (2016-2032)
- Figure 58: North America Iced Tea Market Market Share Comparison by By Product (2016-2032)
- Figure 59: North America Iced Tea Market Market Share Comparison by By Form (2016-2032)
- Figure 60: North America Iced Tea Market Market Share Comparison by By Nature (2016-2032)
- Figure 61: North America Iced Tea Market Market Share Comparison by By Application (2016-2032)
- Figure 62: North America Iced Tea Market Market Share Comparison by By Sales channel (2016-2032)
- Figure 63: Western Europe Iced Tea Market Revenue (US$ Mn) Market Share by By Productin 2022
- Figure 64: Western Europe Iced Tea Market Market Attractiveness Analysis by By Product, 2016-2032
- Figure 65: Western Europe Iced Tea Market Revenue (US$ Mn) Market Share by By Formin 2022
- Figure 66: Western Europe Iced Tea Market Market Attractiveness Analysis by By Form, 2016-2032
- Figure 67: Western Europe Iced Tea Market Revenue (US$ Mn) Market Share by By Naturein 2022
- Figure 68: Western Europe Iced Tea Market Market Attractiveness Analysis by By Nature, 2016-2032
- Figure 69: Western Europe Iced Tea Market Revenue (US$ Mn) Market Share by By Applicationin 2022
- Figure 70: Western Europe Iced Tea Market Market Attractiveness Analysis by By Application, 2016-2032
- Figure 71: Western Europe Iced Tea Market Revenue (US$ Mn) Market Share by By Sales channelin 2022
- Figure 72: Western Europe Iced Tea Market Market Attractiveness Analysis by By Sales channel, 2016-2032
- Figure 73: Western Europe Iced Tea Market Revenue (US$ Mn) Market Share by Country in 2022
- Figure 74: Western Europe Iced Tea Market Market Attractiveness Analysis by Country, 2016-2032
- Figure 75: Western Europe Iced Tea Market Market Revenue (US$ Mn) (2016-2032)
- Figure 76: Western Europe Iced Tea Market Market Revenue (US$ Mn) Comparison by Country (2016-2032)
- Figure 77: Western Europe Iced Tea Market Market Revenue (US$ Mn) Comparison by By Product (2016-2032)
- Figure 78: Western Europe Iced Tea Market Market Revenue (US$ Mn) Comparison by By Form (2016-2032)
- Figure 79: Western Europe Iced Tea Market Market Revenue (US$ Mn) Comparison by By Nature (2016-2032)
- Figure 80: Western Europe Iced Tea Market Market Revenue (US$ Mn) Comparison by By Application (2016-2032)
- Figure 81: Western Europe Iced Tea Market Market Revenue (US$ Mn) Comparison by By Sales channel (2016-2032)
- Figure 82: Western Europe Iced Tea Market Market Y-o-Y Growth Rate Comparison by Country (2016-2032)
- Figure 83: Western Europe Iced Tea Market Market Y-o-Y Growth Rate Comparison by By Product (2016-2032)
- Figure 84: Western Europe Iced Tea Market Market Y-o-Y Growth Rate Comparison by By Form (2016-2032)
- Figure 85: Western Europe Iced Tea Market Market Y-o-Y Growth Rate Comparison by By Nature (2016-2032)
- Figure 86: Western Europe Iced Tea Market Market Y-o-Y Growth Rate Comparison by By Application (2016-2032)
- Figure 87: Western Europe Iced Tea Market Market Y-o-Y Growth Rate Comparison by By Sales channel (2016-2032)
- Figure 88: Western Europe Iced Tea Market Market Share Comparison by Country (2016-2032)
- Figure 89: Western Europe Iced Tea Market Market Share Comparison by By Product (2016-2032)
- Figure 90: Western Europe Iced Tea Market Market Share Comparison by By Form (2016-2032)
- Figure 91: Western Europe Iced Tea Market Market Share Comparison by By Nature (2016-2032)
- Figure 92: Western Europe Iced Tea Market Market Share Comparison by By Application (2016-2032)
- Figure 93: Western Europe Iced Tea Market Market Share Comparison by By Sales channel (2016-2032)
- Figure 94: Eastern Europe Iced Tea Market Revenue (US$ Mn) Market Share by By Productin 2022
- Figure 95: Eastern Europe Iced Tea Market Market Attractiveness Analysis by By Product, 2016-2032
- Figure 96: Eastern Europe Iced Tea Market Revenue (US$ Mn) Market Share by By Formin 2022
- Figure 97: Eastern Europe Iced Tea Market Market Attractiveness Analysis by By Form, 2016-2032
- Figure 98: Eastern Europe Iced Tea Market Revenue (US$ Mn) Market Share by By Naturein 2022
- Figure 99: Eastern Europe Iced Tea Market Market Attractiveness Analysis by By Nature, 2016-2032
- Figure 100: Eastern Europe Iced Tea Market Revenue (US$ Mn) Market Share by By Applicationin 2022
- Figure 101: Eastern Europe Iced Tea Market Market Attractiveness Analysis by By Application, 2016-2032
- Figure 102: Eastern Europe Iced Tea Market Revenue (US$ Mn) Market Share by By Sales channelin 2022
- Figure 103: Eastern Europe Iced Tea Market Market Attractiveness Analysis by By Sales channel, 2016-2032
- Figure 104: Eastern Europe Iced Tea Market Revenue (US$ Mn) Market Share by Country in 2022
- Figure 105: Eastern Europe Iced Tea Market Market Attractiveness Analysis by Country, 2016-2032
- Figure 106: Eastern Europe Iced Tea Market Market Revenue (US$ Mn) (2016-2032)
- Figure 107: Eastern Europe Iced Tea Market Market Revenue (US$ Mn) Comparison by Country (2016-2032)
- Figure 108: Eastern Europe Iced Tea Market Market Revenue (US$ Mn) Comparison by By Product (2016-2032)
- Figure 109: Eastern Europe Iced Tea Market Market Revenue (US$ Mn) Comparison by By Form (2016-2032)
- Figure 110: Eastern Europe Iced Tea Market Market Revenue (US$ Mn) Comparison by By Nature (2016-2032)
- Figure 111: Eastern Europe Iced Tea Market Market Revenue (US$ Mn) Comparison by By Application (2016-2032)
- Figure 112: Eastern Europe Iced Tea Market Market Revenue (US$ Mn) Comparison by By Sales channel (2016-2032)
- Figure 113: Eastern Europe Iced Tea Market Market Y-o-Y Growth Rate Comparison by Country (2016-2032)
- Figure 114: Eastern Europe Iced Tea Market Market Y-o-Y Growth Rate Comparison by By Product (2016-2032)
- Figure 115: Eastern Europe Iced Tea Market Market Y-o-Y Growth Rate Comparison by By Form (2016-2032)
- Figure 116: Eastern Europe Iced Tea Market Market Y-o-Y Growth Rate Comparison by By Nature (2016-2032)
- Figure 117: Eastern Europe Iced Tea Market Market Y-o-Y Growth Rate Comparison by By Application (2016-2032)
- Figure 118: Eastern Europe Iced Tea Market Market Y-o-Y Growth Rate Comparison by By Sales channel (2016-2032)
- Figure 119: Eastern Europe Iced Tea Market Market Share Comparison by Country (2016-2032)
- Figure 120: Eastern Europe Iced Tea Market Market Share Comparison by By Product (2016-2032)
- Figure 121: Eastern Europe Iced Tea Market Market Share Comparison by By Form (2016-2032)
- Figure 122: Eastern Europe Iced Tea Market Market Share Comparison by By Nature (2016-2032)
- Figure 123: Eastern Europe Iced Tea Market Market Share Comparison by By Application (2016-2032)
- Figure 124: Eastern Europe Iced Tea Market Market Share Comparison by By Sales channel (2016-2032)
- Figure 125: APAC Iced Tea Market Revenue (US$ Mn) Market Share by By Productin 2022
- Figure 126: APAC Iced Tea Market Market Attractiveness Analysis by By Product, 2016-2032
- Figure 127: APAC Iced Tea Market Revenue (US$ Mn) Market Share by By Formin 2022
- Figure 128: APAC Iced Tea Market Market Attractiveness Analysis by By Form, 2016-2032
- Figure 129: APAC Iced Tea Market Revenue (US$ Mn) Market Share by By Naturein 2022
- Figure 130: APAC Iced Tea Market Market Attractiveness Analysis by By Nature, 2016-2032
- Figure 131: APAC Iced Tea Market Revenue (US$ Mn) Market Share by By Applicationin 2022
- Figure 132: APAC Iced Tea Market Market Attractiveness Analysis by By Application, 2016-2032
- Figure 133: APAC Iced Tea Market Revenue (US$ Mn) Market Share by By Sales channelin 2022
- Figure 134: APAC Iced Tea Market Market Attractiveness Analysis by By Sales channel, 2016-2032
- Figure 135: APAC Iced Tea Market Revenue (US$ Mn) Market Share by Country in 2022
- Figure 136: APAC Iced Tea Market Market Attractiveness Analysis by Country, 2016-2032
- Figure 137: APAC Iced Tea Market Market Revenue (US$ Mn) (2016-2032)
- Figure 138: APAC Iced Tea Market Market Revenue (US$ Mn) Comparison by Country (2016-2032)
- Figure 139: APAC Iced Tea Market Market Revenue (US$ Mn) Comparison by By Product (2016-2032)
- Figure 140: APAC Iced Tea Market Market Revenue (US$ Mn) Comparison by By Form (2016-2032)
- Figure 141: APAC Iced Tea Market Market Revenue (US$ Mn) Comparison by By Nature (2016-2032)
- Figure 142: APAC Iced Tea Market Market Revenue (US$ Mn) Comparison by By Application (2016-2032)
- Figure 143: APAC Iced Tea Market Market Revenue (US$ Mn) Comparison by By Sales channel (2016-2032)
- Figure 144: APAC Iced Tea Market Market Y-o-Y Growth Rate Comparison by Country (2016-2032)
- Figure 145: APAC Iced Tea Market Market Y-o-Y Growth Rate Comparison by By Product (2016-2032)
- Figure 146: APAC Iced Tea Market Market Y-o-Y Growth Rate Comparison by By Form (2016-2032)
- Figure 147: APAC Iced Tea Market Market Y-o-Y Growth Rate Comparison by By Nature (2016-2032)
- Figure 148: APAC Iced Tea Market Market Y-o-Y Growth Rate Comparison by By Application (2016-2032)
- Figure 149: APAC Iced Tea Market Market Y-o-Y Growth Rate Comparison by By Sales channel (2016-2032)
- Figure 150: APAC Iced Tea Market Market Share Comparison by Country (2016-2032)
- Figure 151: APAC Iced Tea Market Market Share Comparison by By Product (2016-2032)
- Figure 152: APAC Iced Tea Market Market Share Comparison by By Form (2016-2032)
- Figure 153: APAC Iced Tea Market Market Share Comparison by By Nature (2016-2032)
- Figure 154: APAC Iced Tea Market Market Share Comparison by By Application (2016-2032)
- Figure 155: APAC Iced Tea Market Market Share Comparison by By Sales channel (2016-2032)
- Figure 156: Latin America Iced Tea Market Revenue (US$ Mn) Market Share by By Productin 2022
- Figure 157: Latin America Iced Tea Market Market Attractiveness Analysis by By Product, 2016-2032
- Figure 158: Latin America Iced Tea Market Revenue (US$ Mn) Market Share by By Formin 2022
- Figure 159: Latin America Iced Tea Market Market Attractiveness Analysis by By Form, 2016-2032
- Figure 160: Latin America Iced Tea Market Revenue (US$ Mn) Market Share by By Naturein 2022
- Figure 161: Latin America Iced Tea Market Market Attractiveness Analysis by By Nature, 2016-2032
- Figure 162: Latin America Iced Tea Market Revenue (US$ Mn) Market Share by By Applicationin 2022
- Figure 163: Latin America Iced Tea Market Market Attractiveness Analysis by By Application, 2016-2032
- Figure 164: Latin America Iced Tea Market Revenue (US$ Mn) Market Share by By Sales channelin 2022
- Figure 165: Latin America Iced Tea Market Market Attractiveness Analysis by By Sales channel, 2016-2032
- Figure 166: Latin America Iced Tea Market Revenue (US$ Mn) Market Share by Country in 2022
- Figure 167: Latin America Iced Tea Market Market Attractiveness Analysis by Country, 2016-2032
- Figure 168: Latin America Iced Tea Market Market Revenue (US$ Mn) (2016-2032)
- Figure 169: Latin America Iced Tea Market Market Revenue (US$ Mn) Comparison by Country (2016-2032)
- Figure 170: Latin America Iced Tea Market Market Revenue (US$ Mn) Comparison by By Product (2016-2032)
- Figure 171: Latin America Iced Tea Market Market Revenue (US$ Mn) Comparison by By Form (2016-2032)
- Figure 172: Latin America Iced Tea Market Market Revenue (US$ Mn) Comparison by By Nature (2016-2032)
- Figure 173: Latin America Iced Tea Market Market Revenue (US$ Mn) Comparison by By Application (2016-2032)
- Figure 174: Latin America Iced Tea Market Market Revenue (US$ Mn) Comparison by By Sales channel (2016-2032)
- Figure 175: Latin America Iced Tea Market Market Y-o-Y Growth Rate Comparison by Country (2016-2032)
- Figure 176: Latin America Iced Tea Market Market Y-o-Y Growth Rate Comparison by By Product (2016-2032)
- Figure 177: Latin America Iced Tea Market Market Y-o-Y Growth Rate Comparison by By Form (2016-2032)
- Figure 178: Latin America Iced Tea Market Market Y-o-Y Growth Rate Comparison by By Nature (2016-2032)
- Figure 179: Latin America Iced Tea Market Market Y-o-Y Growth Rate Comparison by By Application (2016-2032)
- Figure 180: Latin America Iced Tea Market Market Y-o-Y Growth Rate Comparison by By Sales channel (2016-2032)
- Figure 181: Latin America Iced Tea Market Market Share Comparison by Country (2016-2032)
- Figure 182: Latin America Iced Tea Market Market Share Comparison by By Product (2016-2032)
- Figure 183: Latin America Iced Tea Market Market Share Comparison by By Form (2016-2032)
- Figure 184: Latin America Iced Tea Market Market Share Comparison by By Nature (2016-2032)
- Figure 185: Latin America Iced Tea Market Market Share Comparison by By Application (2016-2032)
- Figure 186: Latin America Iced Tea Market Market Share Comparison by By Sales channel (2016-2032)
- Figure 187: Middle East & Africa Iced Tea Market Revenue (US$ Mn) Market Share by By Productin 2022
- Figure 188: Middle East & Africa Iced Tea Market Market Attractiveness Analysis by By Product, 2016-2032
- Figure 189: Middle East & Africa Iced Tea Market Revenue (US$ Mn) Market Share by By Formin 2022
- Figure 190: Middle East & Africa Iced Tea Market Market Attractiveness Analysis by By Form, 2016-2032
- Figure 191: Middle East & Africa Iced Tea Market Revenue (US$ Mn) Market Share by By Naturein 2022
- Figure 192: Middle East & Africa Iced Tea Market Market Attractiveness Analysis by By Nature, 2016-2032
- Figure 193: Middle East & Africa Iced Tea Market Revenue (US$ Mn) Market Share by By Applicationin 2022
- Figure 194: Middle East & Africa Iced Tea Market Market Attractiveness Analysis by By Application, 2016-2032
- Figure 195: Middle East & Africa Iced Tea Market Revenue (US$ Mn) Market Share by By Sales channelin 2022
- Figure 196: Middle East & Africa Iced Tea Market Market Attractiveness Analysis by By Sales channel, 2016-2032
- Figure 197: Middle East & Africa Iced Tea Market Revenue (US$ Mn) Market Share by Country in 2022
- Figure 198: Middle East & Africa Iced Tea Market Market Attractiveness Analysis by Country, 2016-2032
- Figure 199: Middle East & Africa Iced Tea Market Market Revenue (US$ Mn) (2016-2032)
- Figure 200: Middle East & Africa Iced Tea Market Market Revenue (US$ Mn) Comparison by Country (2016-2032)
- Figure 201: Middle East & Africa Iced Tea Market Market Revenue (US$ Mn) Comparison by By Product (2016-2032)
- Figure 202: Middle East & Africa Iced Tea Market Market Revenue (US$ Mn) Comparison by By Form (2016-2032)
- Figure 203: Middle East & Africa Iced Tea Market Market Revenue (US$ Mn) Comparison by By Nature (2016-2032)
- Figure 204: Middle East & Africa Iced Tea Market Market Revenue (US$ Mn) Comparison by By Application (2016-2032)
- Figure 205: Middle East & Africa Iced Tea Market Market Revenue (US$ Mn) Comparison by By Sales channel (2016-2032)
- Figure 206: Middle East & Africa Iced Tea Market Market Y-o-Y Growth Rate Comparison by Country (2016-2032)
- Figure 207: Middle East & Africa Iced Tea Market Market Y-o-Y Growth Rate Comparison by By Product (2016-2032)
- Figure 208: Middle East & Africa Iced Tea Market Market Y-o-Y Growth Rate Comparison by By Form (2016-2032)
- Figure 209: Middle East & Africa Iced Tea Market Market Y-o-Y Growth Rate Comparison by By Nature (2016-2032)
- Figure 210: Middle East & Africa Iced Tea Market Market Y-o-Y Growth Rate Comparison by By Application (2016-2032)
- Figure 211: Middle East & Africa Iced Tea Market Market Y-o-Y Growth Rate Comparison by By Sales channel (2016-2032)
- Figure 212: Middle East & Africa Iced Tea Market Market Share Comparison by Country (2016-2032)
- Figure 213: Middle East & Africa Iced Tea Market Market Share Comparison by By Product (2016-2032)
- Figure 214: Middle East & Africa Iced Tea Market Market Share Comparison by By Form (2016-2032)
- Figure 215: Middle East & Africa Iced Tea Market Market Share Comparison by By Nature (2016-2032)
- Figure 216: Middle East & Africa Iced Tea Market Market Share Comparison by By Application (2016-2032)
- Figure 217: Middle East & Africa Iced Tea Market Market Share Comparison by By Sales channel (2016-2032)
"
- List of Tables
- "
- Table 1: Global Iced Tea Market Market Comparison by By Product (2016-2032)
- Table 2: Global Iced Tea Market Market Comparison by By Form (2016-2032)
- Table 3: Global Iced Tea Market Market Comparison by By Nature (2016-2032)
- Table 4: Global Iced Tea Market Market Comparison by By Application (2016-2032)
- Table 5: Global Iced Tea Market Market Comparison by By Sales channel (2016-2032)
- Table 6: Global Iced Tea Market Revenue (US$ Mn) Comparison by Region (2016-2032)
- Table 7: Global Iced Tea Market Market Revenue (US$ Mn) (2016-2032)
- Table 8: Global Iced Tea Market Market Revenue (US$ Mn) Comparison by Region (2016-2032)
- Table 9: Global Iced Tea Market Market Revenue (US$ Mn) Comparison by By Product (2016-2032)
- Table 10: Global Iced Tea Market Market Revenue (US$ Mn) Comparison by By Form (2016-2032)
- Table 11: Global Iced Tea Market Market Revenue (US$ Mn) Comparison by By Nature (2016-2032)
- Table 12: Global Iced Tea Market Market Revenue (US$ Mn) Comparison by By Application (2016-2032)
- Table 13: Global Iced Tea Market Market Revenue (US$ Mn) Comparison by By Sales channel (2016-2032)
- Table 14: Global Iced Tea Market Market Y-o-Y Growth Rate Comparison by Region (2016-2032)
- Table 15: Global Iced Tea Market Market Y-o-Y Growth Rate Comparison by By Product (2016-2032)
- Table 16: Global Iced Tea Market Market Y-o-Y Growth Rate Comparison by By Form (2016-2032)
- Table 17: Global Iced Tea Market Market Y-o-Y Growth Rate Comparison by By Nature (2016-2032)
- Table 18: Global Iced Tea Market Market Y-o-Y Growth Rate Comparison by By Application (2016-2032)
- Table 19: Global Iced Tea Market Market Y-o-Y Growth Rate Comparison by By Sales channel (2016-2032)
- Table 20: Global Iced Tea Market Market Share Comparison by Region (2016-2032)
- Table 21: Global Iced Tea Market Market Share Comparison by By Product (2016-2032)
- Table 22: Global Iced Tea Market Market Share Comparison by By Form (2016-2032)
- Table 23: Global Iced Tea Market Market Share Comparison by By Nature (2016-2032)
- Table 24: Global Iced Tea Market Market Share Comparison by By Application (2016-2032)
- Table 25: Global Iced Tea Market Market Share Comparison by By Sales channel (2016-2032)
- Table 26: North America Iced Tea Market Market Comparison by By Form (2016-2032)
- Table 27: North America Iced Tea Market Market Comparison by By Nature (2016-2032)
- Table 28: North America Iced Tea Market Market Comparison by By Application (2016-2032)
- Table 29: North America Iced Tea Market Market Comparison by By Sales channel (2016-2032)
- Table 30: North America Iced Tea Market Revenue (US$ Mn) Comparison by Country (2016-2032)
- Table 31: North America Iced Tea Market Market Revenue (US$ Mn) (2016-2032)
- Table 32: North America Iced Tea Market Market Revenue (US$ Mn) Comparison by Country (2016-2032)
- Table 33: North America Iced Tea Market Market Revenue (US$ Mn) Comparison by By Product (2016-2032)
- Table 34: North America Iced Tea Market Market Revenue (US$ Mn) Comparison by By Form (2016-2032)
- Table 35: North America Iced Tea Market Market Revenue (US$ Mn) Comparison by By Nature (2016-2032)
- Table 36: North America Iced Tea Market Market Revenue (US$ Mn) Comparison by By Application (2016-2032)
- Table 37: North America Iced Tea Market Market Revenue (US$ Mn) Comparison by By Sales channel (2016-2032)
- Table 38: North America Iced Tea Market Market Y-o-Y Growth Rate Comparison by Country (2016-2032)
- Table 39: North America Iced Tea Market Market Y-o-Y Growth Rate Comparison by By Product (2016-2032)
- Table 40: North America Iced Tea Market Market Y-o-Y Growth Rate Comparison by By Form (2016-2032)
- Table 41: North America Iced Tea Market Market Y-o-Y Growth Rate Comparison by By Nature (2016-2032)
- Table 42: North America Iced Tea Market Market Y-o-Y Growth Rate Comparison by By Application (2016-2032)
- Table 43: North America Iced Tea Market Market Y-o-Y Growth Rate Comparison by By Sales channel (2016-2032)
- Table 44: North America Iced Tea Market Market Share Comparison by Country (2016-2032)
- Table 45: North America Iced Tea Market Market Share Comparison by By Product (2016-2032)
- Table 46: North America Iced Tea Market Market Share Comparison by By Form (2016-2032)
- Table 47: North America Iced Tea Market Market Share Comparison by By Nature (2016-2032)
- Table 48: North America Iced Tea Market Market Share Comparison by By Application (2016-2032)
- Table 49: North America Iced Tea Market Market Share Comparison by By Sales channel (2016-2032)
- Table 50: Western Europe Iced Tea Market Market Comparison by By Product (2016-2032)
- Table 51: Western Europe Iced Tea Market Market Comparison by By Form (2016-2032)
- Table 52: Western Europe Iced Tea Market Market Comparison by By Nature (2016-2032)
- Table 53: Western Europe Iced Tea Market Market Comparison by By Application (2016-2032)
- Table 54: Western Europe Iced Tea Market Market Comparison by By Sales channel (2016-2032)
- Table 55: Western Europe Iced Tea Market Revenue (US$ Mn) Comparison by Country (2016-2032)
- Table 56: Western Europe Iced Tea Market Market Revenue (US$ Mn) (2016-2032)
- Table 57: Western Europe Iced Tea Market Market Revenue (US$ Mn) Comparison by Country (2016-2032)
- Table 58: Western Europe Iced Tea Market Market Revenue (US$ Mn) Comparison by By Product (2016-2032)
- Table 59: Western Europe Iced Tea Market Market Revenue (US$ Mn) Comparison by By Form (2016-2032)
- Table 60: Western Europe Iced Tea Market Market Revenue (US$ Mn) Comparison by By Nature (2016-2032)
- Table 61: Western Europe Iced Tea Market Market Revenue (US$ Mn) Comparison by By Application (2016-2032)
- Table 62: Western Europe Iced Tea Market Market Revenue (US$ Mn) Comparison by By Sales channel (2016-2032)
- Table 63: Western Europe Iced Tea Market Market Y-o-Y Growth Rate Comparison by Country (2016-2032)
- Table 64: Western Europe Iced Tea Market Market Y-o-Y Growth Rate Comparison by By Product (2016-2032)
- Table 65: Western Europe Iced Tea Market Market Y-o-Y Growth Rate Comparison by By Form (2016-2032)
- Table 66: Western Europe Iced Tea Market Market Y-o-Y Growth Rate Comparison by By Nature (2016-2032)
- Table 67: Western Europe Iced Tea Market Market Y-o-Y Growth Rate Comparison by By Application (2016-2032)
- Table 68: Western Europe Iced Tea Market Market Y-o-Y Growth Rate Comparison by By Sales channel (2016-2032)
- Table 69: Western Europe Iced Tea Market Market Share Comparison by Country (2016-2032)
- Table 70: Western Europe Iced Tea Market Market Share Comparison by By Product (2016-2032)
- Table 71: Western Europe Iced Tea Market Market Share Comparison by By Form (2016-2032)
- Table 72: Western Europe Iced Tea Market Market Share Comparison by By Nature (2016-2032)
- Table 73: Western Europe Iced Tea Market Market Share Comparison by By Application (2016-2032)
- Table 74: Western Europe Iced Tea Market Market Share Comparison by By Sales channel (2016-2032)
- Table 75: Eastern Europe Iced Tea Market Market Comparison by By Product (2016-2032)
- Table 76: Eastern Europe Iced Tea Market Market Comparison by By Form (2016-2032)
- Table 77: Eastern Europe Iced Tea Market Market Comparison by By Nature (2016-2032)
- Table 78: Eastern Europe Iced Tea Market Market Comparison by By Application (2016-2032)
- Table 79: Eastern Europe Iced Tea Market Market Comparison by By Sales channel (2016-2032)
- Table 80: Eastern Europe Iced Tea Market Revenue (US$ Mn) Comparison by Country (2016-2032)
- Table 81: Eastern Europe Iced Tea Market Market Revenue (US$ Mn) (2016-2032)
- Table 82: Eastern Europe Iced Tea Market Market Revenue (US$ Mn) Comparison by Country (2016-2032)
- Table 83: Eastern Europe Iced Tea Market Market Revenue (US$ Mn) Comparison by By Product (2016-2032)
- Table 84: Eastern Europe Iced Tea Market Market Revenue (US$ Mn) Comparison by By Form (2016-2032)
- Table 85: Eastern Europe Iced Tea Market Market Revenue (US$ Mn) Comparison by By Nature (2016-2032)
- Table 86: Eastern Europe Iced Tea Market Market Revenue (US$ Mn) Comparison by By Application (2016-2032)
- Table 87: Eastern Europe Iced Tea Market Market Revenue (US$ Mn) Comparison by By Sales channel (2016-2032)
- Table 88: Eastern Europe Iced Tea Market Market Y-o-Y Growth Rate Comparison by Country (2016-2032)
- Table 89: Eastern Europe Iced Tea Market Market Y-o-Y Growth Rate Comparison by By Product (2016-2032)
- Table 90: Eastern Europe Iced Tea Market Market Y-o-Y Growth Rate Comparison by By Form (2016-2032)
- Table 91: Eastern Europe Iced Tea Market Market Y-o-Y Growth Rate Comparison by By Nature (2016-2032)
- Table 92: Eastern Europe Iced Tea Market Market Y-o-Y Growth Rate Comparison by By Application (2016-2032)
- Table 93: Eastern Europe Iced Tea Market Market Y-o-Y Growth Rate Comparison by By Sales channel (2016-2032)
- Table 94: Eastern Europe Iced Tea Market Market Share Comparison by Country (2016-2032)
- Table 95: Eastern Europe Iced Tea Market Market Share Comparison by By Product (2016-2032)
- Table 96: Eastern Europe Iced Tea Market Market Share Comparison by By Form (2016-2032)
- Table 97: Eastern Europe Iced Tea Market Market Share Comparison by By Nature (2016-2032)
- Table 98: Eastern Europe Iced Tea Market Market Share Comparison by By Application (2016-2032)
- Table 99: Eastern Europe Iced Tea Market Market Share Comparison by By Sales channel (2016-2032)
- Table 100: APAC Iced Tea Market Market Comparison by By Product (2016-2032)
- Table 101: APAC Iced Tea Market Market Comparison by By Form (2016-2032)
- Table 102: APAC Iced Tea Market Market Comparison by By Nature (2016-2032)
- Table 103: APAC Iced Tea Market Market Comparison by By Application (2016-2032)
- Table 104: APAC Iced Tea Market Market Comparison by By Sales channel (2016-2032)
- Table 105: APAC Iced Tea Market Revenue (US$ Mn) Comparison by Country (2016-2032)
- Table 106: APAC Iced Tea Market Market Revenue (US$ Mn) (2016-2032)
- Table 107: APAC Iced Tea Market Market Revenue (US$ Mn) Comparison by Country (2016-2032)
- Table 108: APAC Iced Tea Market Market Revenue (US$ Mn) Comparison by By Product (2016-2032)
- Table 109: APAC Iced Tea Market Market Revenue (US$ Mn) Comparison by By Form (2016-2032)
- Table 110: APAC Iced Tea Market Market Revenue (US$ Mn) Comparison by By Nature (2016-2032)
- Table 111: APAC Iced Tea Market Market Revenue (US$ Mn) Comparison by By Application (2016-2032)
- Table 112: APAC Iced Tea Market Market Revenue (US$ Mn) Comparison by By Sales channel (2016-2032)
- Table 113: APAC Iced Tea Market Market Y-o-Y Growth Rate Comparison by Country (2016-2032)
- Table 114: APAC Iced Tea Market Market Y-o-Y Growth Rate Comparison by By Product (2016-2032)
- Table 115: APAC Iced Tea Market Market Y-o-Y Growth Rate Comparison by By Form (2016-2032)
- Table 116: APAC Iced Tea Market Market Y-o-Y Growth Rate Comparison by By Nature (2016-2032)
- Table 117: APAC Iced Tea Market Market Y-o-Y Growth Rate Comparison by By Application (2016-2032)
- Table 118: APAC Iced Tea Market Market Y-o-Y Growth Rate Comparison by By Sales channel (2016-2032)
- Table 119: APAC Iced Tea Market Market Share Comparison by Country (2016-2032)
- Table 120: APAC Iced Tea Market Market Share Comparison by By Product (2016-2032)
- Table 121: APAC Iced Tea Market Market Share Comparison by By Form (2016-2032)
- Table 122: APAC Iced Tea Market Market Share Comparison by By Nature (2016-2032)
- Table 123: APAC Iced Tea Market Market Share Comparison by By Application (2016-2032)
- Table 124: APAC Iced Tea Market Market Share Comparison by By Sales channel (2016-2032)
- Table 125: Latin America Iced Tea Market Market Comparison by By Product (2016-2032)
- Table 126: Latin America Iced Tea Market Market Comparison by By Form (2016-2032)
- Table 127: Latin America Iced Tea Market Market Comparison by By Nature (2016-2032)
- Table 128: Latin America Iced Tea Market Market Comparison by By Application (2016-2032)
- Table 129: Latin America Iced Tea Market Market Comparison by By Sales channel (2016-2032)
- Table 130: Latin America Iced Tea Market Revenue (US$ Mn) Comparison by Country (2016-2032)
- Table 131: Latin America Iced Tea Market Market Revenue (US$ Mn) (2016-2032)
- Table 132: Latin America Iced Tea Market Market Revenue (US$ Mn) Comparison by Country (2016-2032)
- Table 133: Latin America Iced Tea Market Market Revenue (US$ Mn) Comparison by By Product (2016-2032)
- Table 134: Latin America Iced Tea Market Market Revenue (US$ Mn) Comparison by By Form (2016-2032)
- Table 135: Latin America Iced Tea Market Market Revenue (US$ Mn) Comparison by By Nature (2016-2032)
- Table 136: Latin America Iced Tea Market Market Revenue (US$ Mn) Comparison by By Application (2016-2032)
- Table 137: Latin America Iced Tea Market Market Revenue (US$ Mn) Comparison by By Sales channel (2016-2032)
- Table 138: Latin America Iced Tea Market Market Y-o-Y Growth Rate Comparison by Country (2016-2032)
- Table 139: Latin America Iced Tea Market Market Y-o-Y Growth Rate Comparison by By Product (2016-2032)
- Table 140: Latin America Iced Tea Market Market Y-o-Y Growth Rate Comparison by By Form (2016-2032)
- Table 141: Latin America Iced Tea Market Market Y-o-Y Growth Rate Comparison by By Nature (2016-2032)
- Table 142: Latin America Iced Tea Market Market Y-o-Y Growth Rate Comparison by By Application (2016-2032)
- Table 143: Latin America Iced Tea Market Market Y-o-Y Growth Rate Comparison by By Sales channel (2016-2032)
- Table 144: Latin America Iced Tea Market Market Share Comparison by Country (2016-2032)
- Table 145: Latin America Iced Tea Market Market Share Comparison by By Product (2016-2032)
- Table 146: Latin America Iced Tea Market Market Share Comparison by By Form (2016-2032)
- Table 147: Latin America Iced Tea Market Market Share Comparison by By Nature (2016-2032)
- Table 148: Latin America Iced Tea Market Market Share Comparison by By Application (2016-2032)
- Table 149: Latin America Iced Tea Market Market Share Comparison by By Sales channel (2016-2032)
- Table 150: Middle East & Africa Iced Tea Market Market Comparison by By Product (2016-2032)
- Table 151: Middle East & Africa Iced Tea Market Market Comparison by By Form (2016-2032)
- Table 152: Middle East & Africa Iced Tea Market Market Comparison by By Nature (2016-2032)
- Table 153: Middle East & Africa Iced Tea Market Market Comparison by By Application (2016-2032)
- Table 154: Middle East & Africa Iced Tea Market Market Comparison by By Sales channel (2016-2032)
- Table 155: Middle East & Africa Iced Tea Market Revenue (US$ Mn) Comparison by Country (2016-2032)
- Table 156: Middle East & Africa Iced Tea Market Market Revenue (US$ Mn) (2016-2032)
- Table 157: Middle East & Africa Iced Tea Market Market Revenue (US$ Mn) Comparison by Country (2016-2032)
- Table 158: Middle East & Africa Iced Tea Market Market Revenue (US$ Mn) Comparison by By Product (2016-2032)
- Table 159: Middle East & Africa Iced Tea Market Market Revenue (US$ Mn) Comparison by By Form (2016-2032)
- Table 160: Middle East & Africa Iced Tea Market Market Revenue (US$ Mn) Comparison by By Nature (2016-2032)
- Table 161: Middle East & Africa Iced Tea Market Market Revenue (US$ Mn) Comparison by By Application (2016-2032)
- Table 162: Middle East & Africa Iced Tea Market Market Revenue (US$ Mn) Comparison by By Sales channel (2016-2032)
- Table 163: Middle East & Africa Iced Tea Market Market Y-o-Y Growth Rate Comparison by Country (2016-2032)
- Table 164: Middle East & Africa Iced Tea Market Market Y-o-Y Growth Rate Comparison by By Product (2016-2032)
- Table 165: Middle East & Africa Iced Tea Market Market Y-o-Y Growth Rate Comparison by By Form (2016-2032)
- Table 166: Middle East & Africa Iced Tea Market Market Y-o-Y Growth Rate Comparison by By Nature (2016-2032)
- Table 167: Middle East & Africa Iced Tea Market Market Y-o-Y Growth Rate Comparison by By Application (2016-2032)
- Table 168: Middle East & Africa Iced Tea Market Market Y-o-Y Growth Rate Comparison by By Sales channel (2016-2032)
- Table 169: Middle East & Africa Iced Tea Market Market Share Comparison by Country (2016-2032)
- Table 170: Middle East & Africa Iced Tea Market Market Share Comparison by By Product (2016-2032)
- Table 171: Middle East & Africa Iced Tea Market Market Share Comparison by By Form (2016-2032)
- Table 172: Middle East & Africa Iced Tea Market Market Share Comparison by By Nature (2016-2032)
- Table 173: Middle East & Africa Iced Tea Market Market Share Comparison by By Application (2016-2032)
- Table 174: Middle East & Africa Iced Tea Market Market Share Comparison by By Sales channel (2016-2032)
- 1. Executive Summary
-
- The Coffee Bean & Tea Leaf (U.S)
- Unilever (U.K)
- Gourmesso (U.S)
- Harney & Sons Fine Teas (U.S)
- Dualit (U.K)
- Nestlé SA (Switzerland)
- Dilmah Ceylon Tea Company PLC (Sri Lanka)
- Ippodo Tea Co. Ltd. (China)
- Tranquini (U.S)
- Chillbev (U.S)
- Som Sleep (U.S)
- Phi Drinks, Inc.(U.S)
- BevNet.com (U.S)
Our Clients


View Our Licence Options
