
Hot Drinks Market By Type (Coffee, Tea, Others), By Distribution Channel (Hypermarkets and Supermarkets, Department Stores, Coffee Shops, Online, Others), By Region And Companies - Industry Segment Outlook, Market Assessment, Competition Scenario, Trends, And Forecast 2024-2033
-
15906
-
July 2024
-
300
-


-
This report was compiled by Shreyas Rokade Shreyas Rokade is a seasoned Research Analyst with CMFE, bringing extensive expertise in market research and consulting, with a strong background in Chemical Engineering. Correspondence Team Lead-CMFE Linkedin | Detailed Market research Methodology Our methodology involves a mix of primary research, including interviews with leading mental health experts, and secondary research from reputable medical journals and databases. View Detailed Methodology Page
-
Quick Navigation
Report Overview
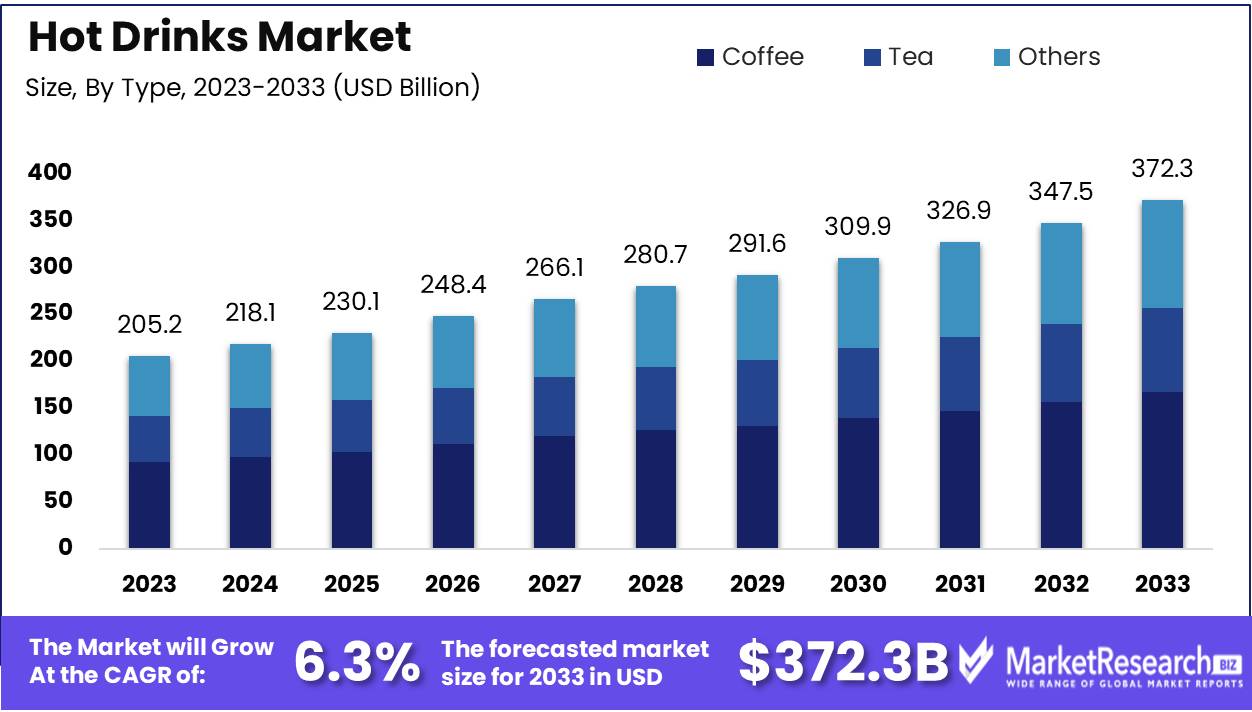
The Hot Drinks Market was valued at USD 205.2 billion in 2023. It is expected to reach USD 372.3 billion by 2033, with a CAGR of 6.3% during the forecast period from 2024 to 2033.
The Hot Drinks Market encompasses the global trade of beverages traditionally served hot, such as coffee, tea, and hot chocolate. This market is driven by increasing consumer demand for premium and specialty beverages, the health benefits of certain hot drinks, and the expanding café culture.The market's growth is further propelled by innovations in flavor, packaging, and sustainability. Major players focus on product diversification and strategic partnerships to capture diverse consumer preferences and expand their global footprint.
The hot drinks market is experiencing significant growth driven by a combination of health awareness and rising disposable incomes. Increasing awareness of the health benefits associated with certain hot drinks, such as tea and herbal infusions, is a primary driver of this market expansion. Consumers are becoming more health-conscious, leading to a higher demand for beverages that offer functional benefits, such as antioxidants and other natural ingredients found in herbal teas.
Moreover, the trend towards premiumization is gaining momentum, with consumers willing to pay more for high-quality and specialty hot drinks. This willingness to invest in premium products is particularly evident in developed markets but is also emerging in developing regions. These factors collectively create a robust market environment for the hot drinks sector.
However, certain challenges may temper this growth trajectory. Increasing health concerns related to high caffeine and sugar content in some hot drinks pose a potential obstacle. As consumers become more health-aware, they may shy away from beverages perceived to contribute to negative health outcomes. Despite this, the overall market outlook remains positive. Growing disposable income, especially in developing regions, is enabling consumers to spend more on premium and specialty hot drinks.
Key Takeaways
- Market Growth: The Hot Drinks Market was valued at USD 205.2 billion in 2023. It is expected to reach USD 372.3 billion by 2033, with a CAGR of 6.3% during the forecast period from 2024 to 2033.
- By Type: Coffee dominated the Hot Drinks Market driven by consumer preferences.
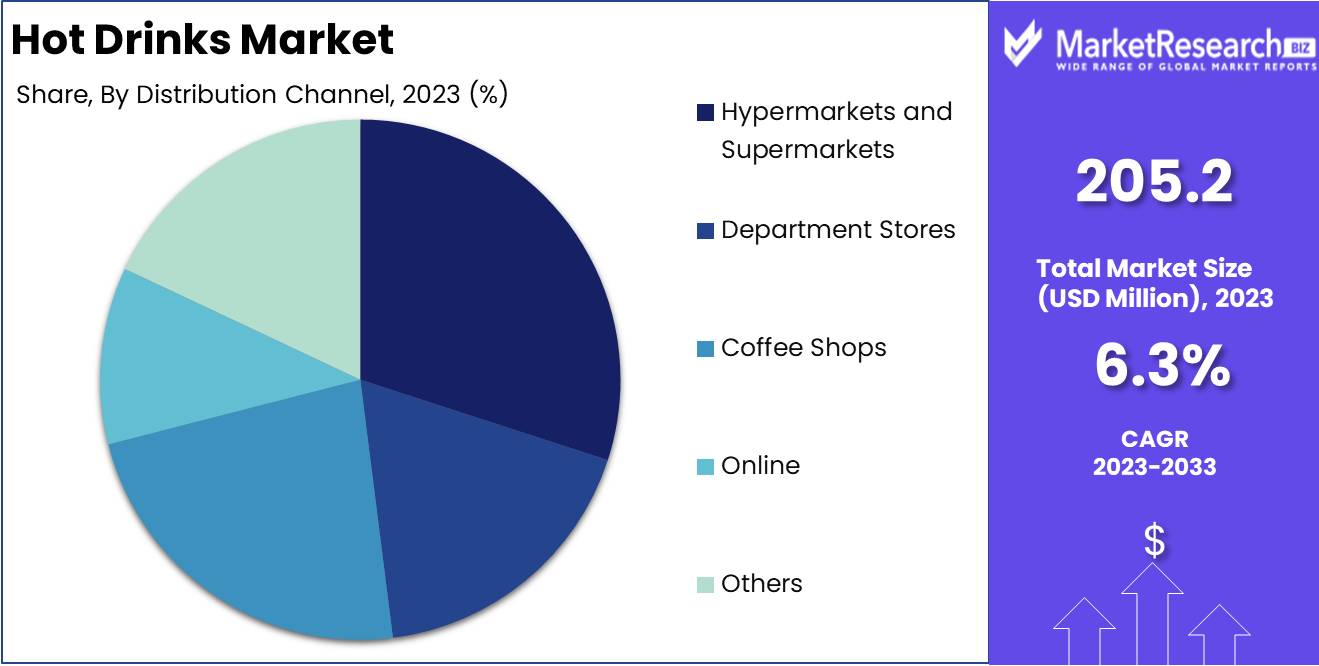
- By Distribution Channel: Hypermarkets and Supermarkets dominated the hot drinks market distribution.
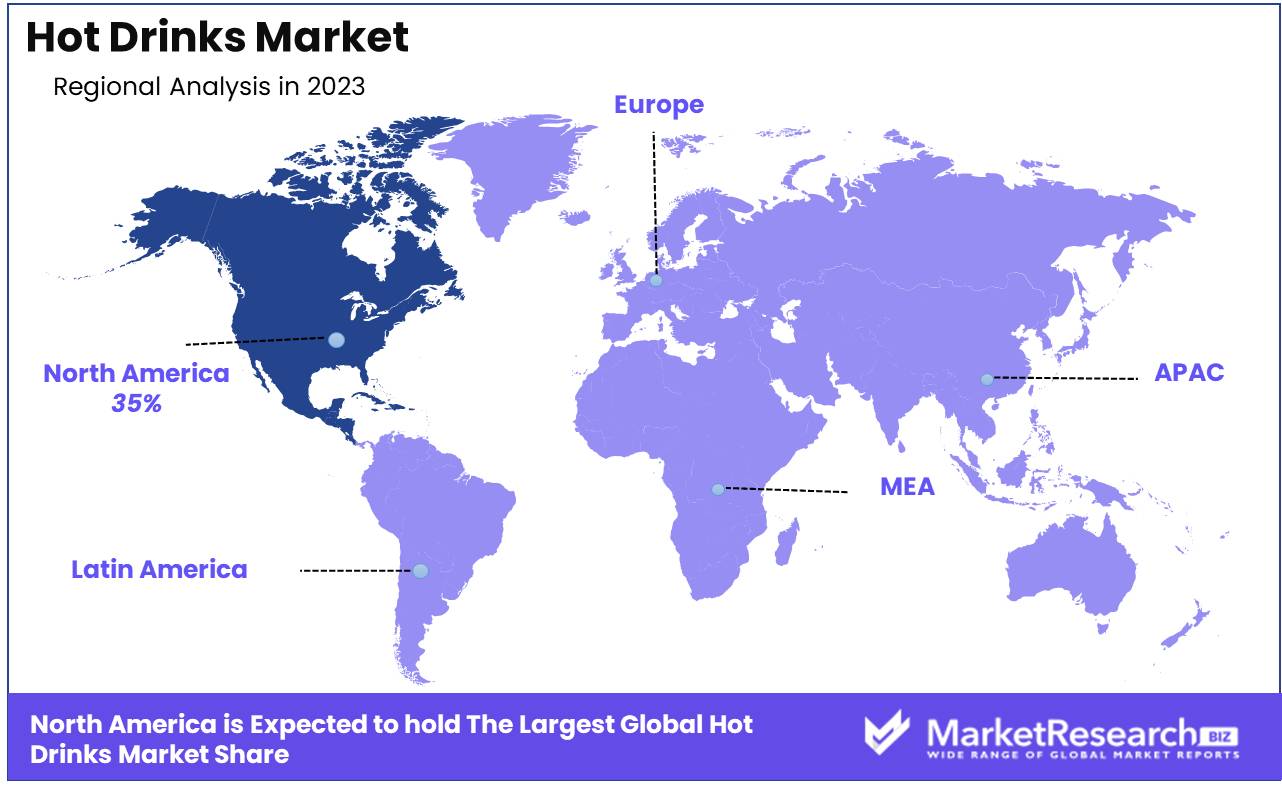
- Regional Dominance: North America dominates the hot drinks market with a 35% largest share.
- Growth Opportunity: The global hot drinks market offers vast opportunities through premiumization and wellness-focused innovations, driving consumer satisfaction and market growth.
Driving factors
Innovation in Flavors and Varieties: Enhancing Consumer Engagement
Innovation in flavors and varieties has significantly contributed to the growth of the hot drinks market. The introduction of unique and diverse flavors caters to the evolving tastes and preferences of consumers, thereby increasing market penetration. For instance, the incorporation of exotic flavors like matcha, turmeric, and various fruit infusions has attracted a broader consumer base. According to recent market data, flavored hot beverages accounted for approximately 35% of total hot drinks sales in 2023, indicating a substantial impact on market dynamics. This trend is expected to continue, driving further market expansion as companies continue to innovate and introduce novel flavors that resonate with consumers.
Convenience and On-the-Go Consumption: Meeting Modern Lifestyle Needs
The increasing demand for convenience and on-the-go consumption options has propelled the growth of the hot drinks market. Modern consumers seek products that align with their fast-paced lifestyles, leading to a surge in the popularity of ready-to-drink (RTD) beverages and single-serve coffee pods. The global market for RTD hot beverages was valued at USD 12.3 billion in 2023, demonstrating a strong preference for convenient consumption formats. Moreover, the proliferation of coffee shops and vending machines offering quick and easy access to hot drinks has further fueled this trend. By providing convenient options, the hot drinks market can effectively capture the attention of busy consumers, thereby driving sustained growth.
Health-Focused Product Development: Catering to Health-Conscious Consumers
Health-focused product development has emerged as a crucial driver of growth in the hot drinks market. With a growing awareness of health and wellness, consumers are increasingly opting for beverages that offer functional benefits. Products such as herbal teas, organic coffees, and hot drinks fortified with vitamins and minerals have gained substantial traction. In 2023, health-focused hot beverages saw a 20% increase in sales, highlighting the market's responsiveness to health trends. Companies are investing in research and development to create products that not only satisfy taste preferences but also contribute to overall well-being. This focus on health is expected to continue driving market growth as consumers prioritize healthier lifestyle choices.
Restraining Factors
Impact of Cold Beverage Alternatives on the Hot Drinks Market
The hot drinks market faces significant competition from cold beverages, which have gained popularity due to their refreshing qualities and convenience. This competition has been intensified by the increasing availability and variety of cold beverage options such as iced coffee, iced tea, and ready-to-drink (RTD) beverages. These alternatives are particularly appealing in warmer climates and during summer months, reducing the overall demand for hot drinks.
A notable statistic illustrating this trend is the growth of the global RTD tea and coffee market, which was valued at approximately USD 86 billion in 2023 and is projected to grow at a compound annual growth rate (CAGR) of 6.5% from 2023 to 2028. This rapid growth indicates a shifting consumer preference toward cold beverages, thereby restraining the expansion of the hot drinks market.
Environmental and Ethical Challenges Restricting Hot Drinks Market Growth
Sustainability concerns play a pivotal role in shaping consumer preferences and behaviors, affecting the growth of the hot drinks market. Issues such as the environmental impact of coffee and tea cultivation, deforestation, and the carbon footprint associated with production and transportation have led consumers to seek more eco-friendly alternatives. This shift in consumer behavior is reflected in the increasing demand for sustainably sourced and certified products, which often come at a higher cost and can limit market expansion.
For instance, the coffee industry alone is responsible for a significant portion of deforestation in tropical regions. It is estimated that 2.5 million acres of forest are cleared annually for coffee cultivation. Additionally, the carbon footprint of coffee production is considerable, with each cup of coffee contributing approximately 59 grams of CO2 emissions.
Moreover, ethical concerns regarding labor practices in coffee and tea plantations have prompted consumers to prioritize products with fair trade and ethical certifications. These certifications, while beneficial for social responsibility, often result in higher production costs, which can be a barrier to market growth as price-sensitive consumers may opt for less expensive, non-certified alternatives.
By Type Analysis
Coffee dominated the Hot Drinks Market in 2023, driven by consumer preferences.
In 2023, Coffee held a dominant market position in the By Type segment of the Hot Drinks Market. Coffee accounted for the largest share, driven by a growing consumer preference for specialty coffee and the proliferation of coffee shops globally. The segment's growth can be attributed to the increasing demand for premium and convenient coffee products, such as single-serve pods and ready-to-drink (RTD) coffee beverages. Technological advancements in coffee brewing and a shift towards sustainable sourcing practices have also played significant roles in boosting the coffee market.
Tea ranked second, experiencing robust growth due to rising health consciousness among consumers. The demand for herbal and specialty teas, particularly green and matcha tea, has seen a significant uptick. Tea's versatility, offering various flavors and health benefits, has enhanced its appeal across diverse demographics.
Others in the segment, which include hot chocolate, malted drinks, and other traditional beverages, maintained a steady market presence. These drinks are particularly popular among younger consumers and in regions with strong cultural preferences for specific hot drinks. Innovations in flavor and packaging have helped sustain their market share.
By Distribution Channel Analysis
In 2023, Hypermarkets and Supermarkets dominated the hot drinks market distribution.
In 2023, Hypermarkets and Supermarkets held a dominant market position in the distribution channel segment of the hot drinks market. This dominance can be attributed to the wide availability and accessibility of hot drink products in these retail environments, where consumers prefer the convenience of one-stop shopping. Hypermarkets and supermarkets cater to a broad consumer base, offering a vast range of hot drink options, from premium brands to budget-friendly choices, thus appealing to diverse consumer preferences.
Department stores also play a significant role in the distribution of hot drinks, particularly in urban areas, where they provide a premium shopping experience and often feature exclusive or high-end brands. Coffee shops, meanwhile, are crucial for the on-the-go consumer, providing freshly brewed hot drinks and becoming increasingly popular as social hubs.
The online distribution channel has witnessed substantial growth, driven by the convenience of home delivery and the rising trend of e-commerce platforms. Consumers are increasingly turning to online platforms for purchasing their favorite hot drinks, benefiting from easy price comparisons and a wide selection of products. Lastly, other channels, including specialty stores and vending machines, contribute to the market by catering to niche segments and offering unique product experiences.
Key Market Segments
By Type
- Coffee
- Tea
- Others
By Distribution Channel
- Hypermarkets and Supermarkets
- Department Stores
- Coffee Shops
- Online
- Others
Growth Opportunity
Focusing on Premiumization and Specialty Products
The global hot drinks market is poised for significant growth driven by a shift towards premiumization and specialty products. Consumers are increasingly willing to pay a premium for high-quality, ethically sourced hot drinks. This trend is especially notable in the coffee and tea segments, where single-origin and artisanal products are gaining traction. Companies that focus on offering unique, high-quality products are well-positioned to capture market share. For example, the rise of specialty coffee shops and tea boutiques underscores this opportunity, with consumers seeking exceptional taste experiences and sustainable sourcing practices.
Developing Functional and Wellness-focused Products
Another key growth driver is the development of functional and wellness-focused hot drinks. As health and wellness trends continue to influence consumer behavior, there is a growing demand for beverages that offer additional health benefits. Functional hot drinks, such as those enriched with vitamins, minerals, or adaptogens, are becoming increasingly popular. This segment is particularly attractive as it caters to health-conscious consumers looking for beverages that support their overall well-being. Brands that innovate in this space by incorporating functional ingredients can differentiate themselves in a competitive market.
Latest Trends
Increased Demand for Natural and Eco-Responsible Products
The hot drinks market is witnessing a significant shift towards natural and eco-responsible products. Consumers are increasingly prioritizing sustainability and health, driving demand for beverages made with organic ingredients and minimal environmental impact. This trend is propelled by a growing awareness of climate change and health consciousness. Companies are responding by sourcing raw materials sustainably, reducing packaging waste, and obtaining certifications such as Fair Trade and Organic. The result is a competitive edge for brands that align with these values, fostering loyalty and enhancing market share.
Expansion of Tea Varieties and Flavors
The diversification of tea varieties and flavors is another prominent trend shaping the hot drinks market. Traditional tea categories are expanding to include innovative blends and exotic flavors, catering to an adventurous consumer base seeking new experiences. Herbal teas, functional teas infused with health benefits, and specialty teas from different regions are gaining traction. This expansion is supported by advancements in flavor extraction and blending techniques, enabling brands to offer unique and appealing products. The proliferation of specialty tea shops and online platforms further facilitates consumer access to these diverse offerings, driving growth in this segment.
Regional Analysis
North America dominates the hot drinks market with a 35% largest share.
The global hot drinks market exhibits significant regional variation, driven by diverse consumer preferences and purchasing power. In North America, the market is robust, characterized by a high demand for premium coffee and specialty teas. The region commands approximately 35% of the global largest market share, driven by a strong coffee culture in the United States and Canada.
Europe follows closely, accounting for around 30% of the market share. Countries like Germany, the UK, and France show a high consumption of both coffee and tea, with a growing trend towards organic and ethically sourced products. The Asia Pacific region is experiencing rapid growth, contributing about 20% to the global market. This growth is propelled by increasing urbanization, rising disposable incomes, and a growing middle class in countries like China, India, and Japan.
In the Middle East & Africa, the market holds approximately 10% of the share, with a notable preference for traditional hot beverages such as tea and coffee, alongside an emerging market for premium brands. Latin America represents around 5% of the market, driven largely by Brazil's significant coffee production and consumption.
Key Regions and Countries
North America
- The US
- Canada
- Rest of North America
Europe
- Germany
- France
- The UK
- Spain
- Netherlands
- Russia
- Italy
- Rest of Europe
Asia-Pacific
- China
- Japan
- Singapore
- Thailand
- South Korea
- Vietnam
- India
- New Zealand
- Rest of Asia Pacific
Latin America
- Mexico
- Brazil
- Rest of Latin America
Middle East & Africa
- Saudi Arabia
- South Africa
- UAE
- Rest of the Middle East & Africa
Key Players Analysis
The global hot drinks market in 2024 is poised for robust growth, driven by a diverse array of key players, each contributing unique strengths and strategic initiatives.
The Coffee Bean & Tea Leaf and Harney & Sons Fine Teas are expected to maintain their strong presence with premium offerings, leveraging their established brand loyalty and expanding their product lines to include healthier and organic options. Unilever and Nestlé SA, giants in the consumer goods sector, are anticipated to further innovate in product formulations and sustainable practices, aligning with the increasing consumer demand for eco-friendly products.
Gourmesso and Dualit will likely continue to capitalize on the growing popularity of convenient, high-quality single-serve coffee pods, while Dilmah Ceylon Tea Company PLC and Ippodo Tea Co. Ltd. focus on their rich heritage and premium tea offerings to attract discerning tea enthusiasts.
New entrants such as Tranquini, Chillbev, Som Sleep, and Phi Drinks, Inc. are expected to disrupt the market with their wellness-focused beverages, catering to the rising trend of functional drinks that promote relaxation and health benefits.
Associated British Foods and JAB Holding will likely strengthen their market position through strategic acquisitions and expanding their product portfolios. At the same time, Food Empire Holdings, Starbucks Corporation and Tchibo continue to explore emerging markets and diversify their offerings.
Overall, the competitive landscape of the hot drinks market in 2024 will be marked by innovation, sustainability, and a keen focus on consumer preferences, driven by these key players' strategic initiatives and market adaptations.
Market Key Players
- The Coffee Bean & Tea Leaf
- Unilever
- Gourmesso
- Harney & Sons Fine Teas
- Dualit
- Nestlé SA
- Dilmah Ceylon Tea Company PLC
- Ippodo Tea Co. Ltd.
- Tranquini
- Chillbev
- Som Sleep
- Phi Drinks, Inc.
- BevNet.com
- Associated British Foods
- JAB Holding
- Food Empire Holdings
- Starbucks Corporation
- Tchibo
Recent Development
- In May 2024, The Kraft Heinz Company debuted a new line of functional teas under its Tassimo brand. These teas are infused with ingredients designed to boost energy, enhance relaxation, and support immune health, aligning with the increasing consumer interest in health and wellness.
- In April 2024, Unilever launched a new initiative focused on sustainable packaging for its hot drinks products, particularly for its Lipton and Brooke Bond tea brands. The initiative includes the introduction of fully recyclable packaging materials and aims to reduce plastic waste significantly.
- In March 2024, Nestlé announced the expansion of its plant-based hot drinks portfolio. The company introduced new variants of its popular brands, including plant-based options for Nescafé and Starbucks at Home products. This move caters to the growing demand for vegan and plant-based beverages.
Report Scope
Report Features Description Market Value (2023) USD 205.2 Billion Forecast Revenue (2033) USD 372.3 Billion CAGR (2024-2032) 6.3% Base Year for Estimation 2023 Historic Period 2016-2023 Forecast Period 2024-2033 Report Coverage Revenue Forecast, Market Dynamics, COVID-19 Impact, Competitive Landscape, Recent Developments Segments Covered By Type (Coffee, Tea, Others), By Distribution Channel (Hypermarkets and Supermarkets, Department Stores, Coffee Shops, Online, Others) Regional Analysis North America - The US, Canada, Rest of North America, Europe - Germany, France, The UK, Spain, Italy, Russia, Netherlands, Rest of Europe, Asia-Pacific - China, Japan, South Korea, India, New Zealand, Singapore, Thailand, Vietnam, Rest of Asia Pacific, Latin America - Brazil, Mexico, Rest of Latin America, Middle East & Africa - South Africa, Saudi Arabia, UAE, Rest of Middle East & Africa Competitive Landscape The Coffee Bean & Tea Leaf, Unilever, Gourmesso, Harney & Sons Fine Teas, Dualit, Nestlé SA, Dilmah Ceylon Tea Company PLC, Ippodo Tea Co. Ltd., Tranquini, Chillbev, Som Sleep, Phi Drinks, Inc., BevNet.com, Associated British Foods, JAB Holding, Food Empire Holdings, Starbucks Corporation, Tchibo Customization Scope Customization for segments, region/country-level will be provided. Moreover, additional customization can be done based on the requirements. Purchase Options We have three licenses to opt for Single User License, Multi-User License (Up to 5 Users), Corporate Use License (Unlimited User and Printable PDF) -
- 1. Executive Summary
- 1.1. Definition
- 1.2. Taxonomy
- 1.3. Research Scope
- 1.4. Key Analysis
- 1.5. Key Findings by Major Segments
- 1.6. Top strategies by Major Players
- 2. Global Hot Drinks Market Overview
- 2.1. Hot Drinks Market Dynamics
- 2.1.1. Drivers
- 2.1.2. Opportunities
- 2.1.3. Restraints
- 2.1.4. Challenges
- 2.2. Macro-economic Factors
- 2.3. Regulatory Framework
- 2.4. Market Investment Feasibility Index
- 2.5. PEST Analysis
- 2.6. PORTER’S Five Force Analysis
- 2.7. Drivers & Restraints Impact Analysis
- 2.8. Industry Chain Analysis
- 2.9. Cost Structure Analysis
- 2.10. Marketing Strategy
- 2.11. Russia-Ukraine War Impact Analysis
- 2.12. Opportunity Map Analysis
- 2.13. Market Competition Scenario Analysis
- 2.14. Product Life Cycle Analysis
- 2.15. Opportunity Orbits
- 2.16. Manufacturer Intensity Map
- 2.17. Major Companies sales by Value & Volume
- 2.1. Hot Drinks Market Dynamics
- 3. Global Hot Drinks Market Analysis, Opportunity and Forecast, 2016-2032
- 3.1. Global Hot Drinks Market Analysis, 2016-2021
- 3.2. Global Hot Drinks Market Opportunity and Forecast, 2023-2032
- 3.3. Global Hot Drinks Market Analysis, Opportunity and Forecast, By Type, 2016-2032
- 3.3.1. Global Hot Drinks Market Analysis by Type: Introduction
- 3.3.2. Market Size Absolute $ Opportunity Analysis and Forecast, By Type, 2016-2032
- 3.3.3. Coffee
- 3.3.4. Tea
- 3.3.5. Others
- 3.4. Global Hot Drinks Market Analysis, Opportunity and Forecast, By Distribution Channel, 2016-2032
- 3.4.1. Global Hot Drinks Market Analysis by Distribution Channel: Introduction
- 3.4.2. Market Size Absolute $ Opportunity Analysis and Forecast, By Distribution Channel, 2016-2032
- 3.4.3. Hypermarkets and Supermarkets
- 3.4.4. Department Stores
- 3.4.5. Coffee Shops
- 3.4.6. Online
- 3.4.7. Others
- 4. North America Hot Drinks Market Analysis, Opportunity and Forecast, 2016-2032
- 4.1. North America Hot Drinks Market Analysis, 2016-2021
- 4.2. North America Hot Drinks Market Opportunity and Forecast, 2023-2032
- 4.3. North America Hot Drinks Market Analysis, Opportunity and Forecast, By Type, 2016-2032
- 4.3.1. North America Hot Drinks Market Analysis by Type: Introduction
- 4.3.2. Market Size Absolute $ Opportunity Analysis and Forecast, By Type, 2016-2032
- 4.3.3. Coffee
- 4.3.4. Tea
- 4.3.5. Others
- 4.4. North America Hot Drinks Market Analysis, Opportunity and Forecast, By Distribution Channel, 2016-2032
- 4.4.1. North America Hot Drinks Market Analysis by Distribution Channel: Introduction
- 4.4.2. Market Size Absolute $ Opportunity Analysis and Forecast, By Distribution Channel, 2016-2032
- 4.4.3. Hypermarkets and Supermarkets
- 4.4.4. Department Stores
- 4.4.5. Coffee Shops
- 4.4.6. Online
- 4.4.7. Others
- 4.5. North America Hot Drinks Market Analysis, Opportunity and Forecast, By Country , 2016-2032
- 4.5.1. North America Hot Drinks Market Analysis by Country : Introduction
- 4.5.2. Market Size Absolute $ Opportunity Analysis and Forecast, Country , 2016-2032
- 4.5.2.1. The US
- 4.5.2.2. Canada
- 4.5.2.3. Mexico
- 5. Western Europe Hot Drinks Market Analysis, Opportunity and Forecast, 2016-2032
- 5.1. Western Europe Hot Drinks Market Analysis, 2016-2021
- 5.2. Western Europe Hot Drinks Market Opportunity and Forecast, 2023-2032
- 5.3. Western Europe Hot Drinks Market Analysis, Opportunity and Forecast, By Type, 2016-2032
- 5.3.1. Western Europe Hot Drinks Market Analysis by Type: Introduction
- 5.3.2. Market Size Absolute $ Opportunity Analysis and Forecast, By Type, 2016-2032
- 5.3.3. Coffee
- 5.3.4. Tea
- 5.3.5. Others
- 5.4. Western Europe Hot Drinks Market Analysis, Opportunity and Forecast, By Distribution Channel, 2016-2032
- 5.4.1. Western Europe Hot Drinks Market Analysis by Distribution Channel: Introduction
- 5.4.2. Market Size Absolute $ Opportunity Analysis and Forecast, By Distribution Channel, 2016-2032
- 5.4.3. Hypermarkets and Supermarkets
- 5.4.4. Department Stores
- 5.4.5. Coffee Shops
- 5.4.6. Online
- 5.4.7. Others
- 5.5. Western Europe Hot Drinks Market Analysis, Opportunity and Forecast, By Country , 2016-2032
- 5.5.1. Western Europe Hot Drinks Market Analysis by Country : Introduction
- 5.5.2. Market Size Absolute $ Opportunity Analysis and Forecast, Country , 2016-2032
- 5.5.2.1. Germany
- 5.5.2.2. France
- 5.5.2.3. The UK
- 5.5.2.4. Spain
- 5.5.2.5. Italy
- 5.5.2.6. Portugal
- 5.5.2.7. Ireland
- 5.5.2.8. Austria
- 5.5.2.9. Switzerland
- 5.5.2.10. Benelux
- 5.5.2.11. Nordic
- 5.5.2.12. Rest of Western Europe
- 6. Eastern Europe Hot Drinks Market Analysis, Opportunity and Forecast, 2016-2032
- 6.1. Eastern Europe Hot Drinks Market Analysis, 2016-2021
- 6.2. Eastern Europe Hot Drinks Market Opportunity and Forecast, 2023-2032
- 6.3. Eastern Europe Hot Drinks Market Analysis, Opportunity and Forecast, By Type, 2016-2032
- 6.3.1. Eastern Europe Hot Drinks Market Analysis by Type: Introduction
- 6.3.2. Market Size Absolute $ Opportunity Analysis and Forecast, By Type, 2016-2032
- 6.3.3. Coffee
- 6.3.4. Tea
- 6.3.5. Others
- 6.4. Eastern Europe Hot Drinks Market Analysis, Opportunity and Forecast, By Distribution Channel, 2016-2032
- 6.4.1. Eastern Europe Hot Drinks Market Analysis by Distribution Channel: Introduction
- 6.4.2. Market Size Absolute $ Opportunity Analysis and Forecast, By Distribution Channel, 2016-2032
- 6.4.3. Hypermarkets and Supermarkets
- 6.4.4. Department Stores
- 6.4.5. Coffee Shops
- 6.4.6. Online
- 6.4.7. Others
- 6.5. Eastern Europe Hot Drinks Market Analysis, Opportunity and Forecast, By Country , 2016-2032
- 6.5.1. Eastern Europe Hot Drinks Market Analysis by Country : Introduction
- 6.5.2. Market Size Absolute $ Opportunity Analysis and Forecast, Country , 2016-2032
- 6.5.2.1. Russia
- 6.5.2.2. Poland
- 6.5.2.3. The Czech Republic
- 6.5.2.4. Greece
- 6.5.2.5. Rest of Eastern Europe
- 7. APAC Hot Drinks Market Analysis, Opportunity and Forecast, 2016-2032
- 7.1. APAC Hot Drinks Market Analysis, 2016-2021
- 7.2. APAC Hot Drinks Market Opportunity and Forecast, 2023-2032
- 7.3. APAC Hot Drinks Market Analysis, Opportunity and Forecast, By Type, 2016-2032
- 7.3.1. APAC Hot Drinks Market Analysis by Type: Introduction
- 7.3.2. Market Size Absolute $ Opportunity Analysis and Forecast, By Type, 2016-2032
- 7.3.3. Coffee
- 7.3.4. Tea
- 7.3.5. Others
- 7.4. APAC Hot Drinks Market Analysis, Opportunity and Forecast, By Distribution Channel, 2016-2032
- 7.4.1. APAC Hot Drinks Market Analysis by Distribution Channel: Introduction
- 7.4.2. Market Size Absolute $ Opportunity Analysis and Forecast, By Distribution Channel, 2016-2032
- 7.4.3. Hypermarkets and Supermarkets
- 7.4.4. Department Stores
- 7.4.5. Coffee Shops
- 7.4.6. Online
- 7.4.7. Others
- 7.5. APAC Hot Drinks Market Analysis, Opportunity and Forecast, By Country , 2016-2032
- 7.5.1. APAC Hot Drinks Market Analysis by Country : Introduction
- 7.5.2. Market Size Absolute $ Opportunity Analysis and Forecast, Country , 2016-2032
- 7.5.2.1. China
- 7.5.2.2. Japan
- 7.5.2.3. South Korea
- 7.5.2.4. India
- 7.5.2.5. Australia & New Zeland
- 7.5.2.6. Indonesia
- 7.5.2.7. Malaysia
- 7.5.2.8. Philippines
- 7.5.2.9. Singapore
- 7.5.2.10. Thailand
- 7.5.2.11. Vietnam
- 7.5.2.12. Rest of APAC
- 8. Latin America Hot Drinks Market Analysis, Opportunity and Forecast, 2016-2032
- 8.1. Latin America Hot Drinks Market Analysis, 2016-2021
- 8.2. Latin America Hot Drinks Market Opportunity and Forecast, 2023-2032
- 8.3. Latin America Hot Drinks Market Analysis, Opportunity and Forecast, By Type, 2016-2032
- 8.3.1. Latin America Hot Drinks Market Analysis by Type: Introduction
- 8.3.2. Market Size Absolute $ Opportunity Analysis and Forecast, By Type, 2016-2032
- 8.3.3. Coffee
- 8.3.4. Tea
- 8.3.5. Others
- 8.4. Latin America Hot Drinks Market Analysis, Opportunity and Forecast, By Distribution Channel, 2016-2032
- 8.4.1. Latin America Hot Drinks Market Analysis by Distribution Channel: Introduction
- 8.4.2. Market Size Absolute $ Opportunity Analysis and Forecast, By Distribution Channel, 2016-2032
- 8.4.3. Hypermarkets and Supermarkets
- 8.4.4. Department Stores
- 8.4.5. Coffee Shops
- 8.4.6. Online
- 8.4.7. Others
- 8.5. Latin America Hot Drinks Market Analysis, Opportunity and Forecast, By Country , 2016-2032
- 8.5.1. Latin America Hot Drinks Market Analysis by Country : Introduction
- 8.5.2. Market Size Absolute $ Opportunity Analysis and Forecast, Country , 2016-2032
- 8.5.2.1. Brazil
- 8.5.2.2. Colombia
- 8.5.2.3. Chile
- 8.5.2.4. Argentina
- 8.5.2.5. Costa Rica
- 8.5.2.6. Rest of Latin America
- 9. Middle East & Africa Hot Drinks Market Analysis, Opportunity and Forecast, 2016-2032
- 9.1. Middle East & Africa Hot Drinks Market Analysis, 2016-2021
- 9.2. Middle East & Africa Hot Drinks Market Opportunity and Forecast, 2023-2032
- 9.3. Middle East & Africa Hot Drinks Market Analysis, Opportunity and Forecast, By Type, 2016-2032
- 9.3.1. Middle East & Africa Hot Drinks Market Analysis by Type: Introduction
- 9.3.2. Market Size Absolute $ Opportunity Analysis and Forecast, By Type, 2016-2032
- 9.3.3. Coffee
- 9.3.4. Tea
- 9.3.5. Others
- 9.4. Middle East & Africa Hot Drinks Market Analysis, Opportunity and Forecast, By Distribution Channel, 2016-2032
- 9.4.1. Middle East & Africa Hot Drinks Market Analysis by Distribution Channel: Introduction
- 9.4.2. Market Size Absolute $ Opportunity Analysis and Forecast, By Distribution Channel, 2016-2032
- 9.4.3. Hypermarkets and Supermarkets
- 9.4.4. Department Stores
- 9.4.5. Coffee Shops
- 9.4.6. Online
- 9.4.7. Others
- 9.5. Middle East & Africa Hot Drinks Market Analysis, Opportunity and Forecast, By Country , 2016-2032
- 9.5.1. Middle East & Africa Hot Drinks Market Analysis by Country : Introduction
- 9.5.2. Market Size Absolute $ Opportunity Analysis and Forecast, Country , 2016-2032
- 9.5.2.1. Algeria
- 9.5.2.2. Egypt
- 9.5.2.3. Israel
- 9.5.2.4. Kuwait
- 9.5.2.5. Nigeria
- 9.5.2.6. Saudi Arabia
- 9.5.2.7. South Africa
- 9.5.2.8. Turkey
- 9.5.2.9. The UAE
- 9.5.2.10. Rest of MEA
- 10. Global Hot Drinks Market Analysis, Opportunity and Forecast, By Region , 2016-2032
- 10.1. Global Hot Drinks Market Analysis by Region : Introduction
- 10.2. Market Size Absolute $ Opportunity Analysis and Forecast, By Region , 2016-2032
- 10.2.1. North America
- 10.2.2. Western Europe
- 10.2.3. Eastern Europe
- 10.2.4. APAC
- 10.2.5. Latin America
- 10.2.6. Middle East & Africa
- 11. Global Hot Drinks Market Competitive Landscape, Market Share Analysis, and Company Profiles
- 11.1. Market Share Analysis
- 11.2. Company Profiles
- 11.3. The Coffee Bean & Tea Leaf
- 11.3.1. Company Overview
- 11.3.2. Financial Highlights
- 11.3.3. Product Portfolio
- 11.3.4. SWOT Analysis
- 11.3.5. Key Strategies and Developments
- 11.4. Unilever
- 11.4.1. Company Overview
- 11.4.2. Financial Highlights
- 11.4.3. Product Portfolio
- 11.4.4. SWOT Analysis
- 11.4.5. Key Strategies and Developments
- 11.5. Gourmesso
- 11.5.1. Company Overview
- 11.5.2. Financial Highlights
- 11.5.3. Product Portfolio
- 11.5.4. SWOT Analysis
- 11.5.5. Key Strategies and Developments
- 11.6. Harney & Sons Fine Teas
- 11.6.1. Company Overview
- 11.6.2. Financial Highlights
- 11.6.3. Product Portfolio
- 11.6.4. SWOT Analysis
- 11.6.5. Key Strategies and Developments
- 11.7. Dualit
- 11.7.1. Company Overview
- 11.7.2. Financial Highlights
- 11.7.3. Product Portfolio
- 11.7.4. SWOT Analysis
- 11.7.5. Key Strategies and Developments
- 11.8. Nestlé SA
- 11.8.1. Company Overview
- 11.8.2. Financial Highlights
- 11.8.3. Product Portfolio
- 11.8.4. SWOT Analysis
- 11.8.5. Key Strategies and Developments
- 11.9. Dilmah Ceylon Tea Company PLC
- 11.9.1. Company Overview
- 11.9.2. Financial Highlights
- 11.9.3. Product Portfolio
- 11.9.4. SWOT Analysis
- 11.9.5. Key Strategies and Developments
- 11.10. Ippodo Tea Co. Ltd.
- 11.10.1. Company Overview
- 11.10.2. Financial Highlights
- 11.10.3. Product Portfolio
- 11.10.4. SWOT Analysis
- 11.10.5. Key Strategies and Developments
- 11.11. Tranquini
- 11.11.1. Company Overview
- 11.11.2. Financial Highlights
- 11.11.3. Product Portfolio
- 11.11.4. SWOT Analysis
- 11.11.5. Key Strategies and Developments
- 11.12. Chillbev
- 11.12.1. Company Overview
- 11.12.2. Financial Highlights
- 11.12.3. Product Portfolio
- 11.12.4. SWOT Analysis
- 11.12.5. Key Strategies and Developments
- 11.13.1. Company Overview
- 11.13.2. Financial Highlights
- 11.13.3. Product Portfolio
- 11.13.4. SWOT Analysis
- 11.13.5. Key Strategies and Developments
- 11.14. Som Sleep
- 11.14.1. Company Overview
- 11.14.2. Financial Highlights
- 11.14.3. Product Portfolio
- 11.14.4. SWOT Analysis
- 11.14.5. Key Strategies and Developments
- 11.15. BevNet.com
- 11.15.1. Company Overview
- 11.15.2. Financial Highlights
- 11.15.3. Product Portfolio
- 11.15.4. SWOT Analysis
- 11.15.5. Key Strategies and Developments
- 11.16. Associated British Foods
- 11.16.1. Company Overview
- 11.16.2. Financial Highlights
- 11.16.3. Product Portfolio
- 11.16.4. SWOT Analysis
- 11.16.5. Key Strategies and Developments
- 11.17. JAB Holding
- 11.17.1. Company Overview
- 11.17.2. Financial Highlights
- 11.17.3. Product Portfolio
- 11.17.4. SWOT Analysis
- 11.17.5. Key Strategies and Developments
- 11.18. Food Empire Holdings
- 11.18.1. Company Overview
- 11.18.2. Financial Highlights
- 11.18.3. Product Portfolio
- 11.18.4. SWOT Analysis
- 11.18.5. Key Strategies and Developments
- 11.19. Starbucks Corporation
- 11.19.1. Company Overview
- 11.19.2. Financial Highlights
- 11.19.3. Product Portfolio
- 11.19.4. SWOT Analysis
- 11.19.5. Key Strategies and Developments
- 11.20. Tchibo
- 11.20.1. Company Overview
- 11.20.2. Financial Highlights
- 11.20.3. Product Portfolio
- 11.20.4. SWOT Analysis
- 11.20.5. Key Strategies and Developments
- 12. Assumptions and Acronyms
- 13. Research Methodology
- 14. Contact
"
- List of Figures
- "
- Figure 1: Global Hot Drinks Market Revenue (US$ Mn) Market Share by Type in 2022
- Figure 2: Global Hot Drinks Market Market Attractiveness Analysis by Type, 2016-2032
- Figure 3: Global Hot Drinks Market Revenue (US$ Mn) Market Share by Distribution Channelin 2022
- Figure 4: Global Hot Drinks Market Market Attractiveness Analysis by Distribution Channel, 2016-2032
- Figure 5: Global Hot Drinks Market Revenue (US$ Mn) Market Share by Region in 2022
- Figure 6: Global Hot Drinks Market Market Attractiveness Analysis by Region, 2016-2032
- Figure 7: Global Hot Drinks Market Market Revenue (US$ Mn) (2016-2032)
- Figure 8: Global Hot Drinks Market Market Revenue (US$ Mn) Comparison by Region (2016-2032)
- Figure 9: Global Hot Drinks Market Market Revenue (US$ Mn) Comparison by Type (2016-2032)
- Figure 10: Global Hot Drinks Market Market Revenue (US$ Mn) Comparison by Distribution Channel (2016-2032)
- Figure 11: Global Hot Drinks Market Market Y-o-Y Growth Rate Comparison by Region (2016-2032)
- Figure 12: Global Hot Drinks Market Market Y-o-Y Growth Rate Comparison by Type (2016-2032)
- Figure 13: Global Hot Drinks Market Market Y-o-Y Growth Rate Comparison by Distribution Channel (2016-2032)
- Figure 14: Global Hot Drinks Market Market Share Comparison by Region (2016-2032)
- Figure 15: Global Hot Drinks Market Market Share Comparison by Type (2016-2032)
- Figure 16: Global Hot Drinks Market Market Share Comparison by Distribution Channel (2016-2032)
- Figure 17: North America Hot Drinks Market Revenue (US$ Mn) Market Share by Typein 2022
- Figure 18: North America Hot Drinks Market Market Attractiveness Analysis by Type, 2016-2032
- Figure 19: North America Hot Drinks Market Revenue (US$ Mn) Market Share by Distribution Channelin 2022
- Figure 20: North America Hot Drinks Market Market Attractiveness Analysis by Distribution Channel, 2016-2032
- Figure 21: North America Hot Drinks Market Revenue (US$ Mn) Market Share by Country in 2022
- Figure 22: North America Hot Drinks Market Market Attractiveness Analysis by Country, 2016-2032
- Figure 23: North America Hot Drinks Market Market Revenue (US$ Mn) (2016-2032)
- Figure 24: North America Hot Drinks Market Market Revenue (US$ Mn) Comparison by Country (2016-2032)
- Figure 25: North America Hot Drinks Market Market Revenue (US$ Mn) Comparison by Type (2016-2032)
- Figure 26: North America Hot Drinks Market Market Revenue (US$ Mn) Comparison by Distribution Channel (2016-2032)
- Figure 27: North America Hot Drinks Market Market Y-o-Y Growth Rate Comparison by Country (2016-2032)
- Figure 28: North America Hot Drinks Market Market Y-o-Y Growth Rate Comparison by Type (2016-2032)
- Figure 29: North America Hot Drinks Market Market Y-o-Y Growth Rate Comparison by Distribution Channel (2016-2032)
- Figure 30: North America Hot Drinks Market Market Share Comparison by Country (2016-2032)
- Figure 31: North America Hot Drinks Market Market Share Comparison by Type (2016-2032)
- Figure 32: North America Hot Drinks Market Market Share Comparison by Distribution Channel (2016-2032)
- Figure 33: Western Europe Hot Drinks Market Revenue (US$ Mn) Market Share by Typein 2022
- Figure 34: Western Europe Hot Drinks Market Market Attractiveness Analysis by Type, 2016-2032
- Figure 35: Western Europe Hot Drinks Market Revenue (US$ Mn) Market Share by Distribution Channelin 2022
- Figure 36: Western Europe Hot Drinks Market Market Attractiveness Analysis by Distribution Channel, 2016-2032
- Figure 37: Western Europe Hot Drinks Market Revenue (US$ Mn) Market Share by Country in 2022
- Figure 38: Western Europe Hot Drinks Market Market Attractiveness Analysis by Country, 2016-2032
- Figure 39: Western Europe Hot Drinks Market Market Revenue (US$ Mn) (2016-2032)
- Figure 40: Western Europe Hot Drinks Market Market Revenue (US$ Mn) Comparison by Country (2016-2032)
- Figure 41: Western Europe Hot Drinks Market Market Revenue (US$ Mn) Comparison by Type (2016-2032)
- Figure 42: Western Europe Hot Drinks Market Market Revenue (US$ Mn) Comparison by Distribution Channel (2016-2032)
- Figure 43: Western Europe Hot Drinks Market Market Y-o-Y Growth Rate Comparison by Country (2016-2032)
- Figure 44: Western Europe Hot Drinks Market Market Y-o-Y Growth Rate Comparison by Type (2016-2032)
- Figure 45: Western Europe Hot Drinks Market Market Y-o-Y Growth Rate Comparison by Distribution Channel (2016-2032)
- Figure 46: Western Europe Hot Drinks Market Market Share Comparison by Country (2016-2032)
- Figure 47: Western Europe Hot Drinks Market Market Share Comparison by Type (2016-2032)
- Figure 48: Western Europe Hot Drinks Market Market Share Comparison by Distribution Channel (2016-2032)
- Figure 49: Eastern Europe Hot Drinks Market Revenue (US$ Mn) Market Share by Typein 2022
- Figure 50: Eastern Europe Hot Drinks Market Market Attractiveness Analysis by Type, 2016-2032
- Figure 51: Eastern Europe Hot Drinks Market Revenue (US$ Mn) Market Share by Distribution Channelin 2022
- Figure 52: Eastern Europe Hot Drinks Market Market Attractiveness Analysis by Distribution Channel, 2016-2032
- Figure 53: Eastern Europe Hot Drinks Market Revenue (US$ Mn) Market Share by Country in 2022
- Figure 54: Eastern Europe Hot Drinks Market Market Attractiveness Analysis by Country, 2016-2032
- Figure 55: Eastern Europe Hot Drinks Market Market Revenue (US$ Mn) (2016-2032)
- Figure 56: Eastern Europe Hot Drinks Market Market Revenue (US$ Mn) Comparison by Country (2016-2032)
- Figure 57: Eastern Europe Hot Drinks Market Market Revenue (US$ Mn) Comparison by Type (2016-2032)
- Figure 58: Eastern Europe Hot Drinks Market Market Revenue (US$ Mn) Comparison by Distribution Channel (2016-2032)
- Figure 59: Eastern Europe Hot Drinks Market Market Y-o-Y Growth Rate Comparison by Country (2016-2032)
- Figure 60: Eastern Europe Hot Drinks Market Market Y-o-Y Growth Rate Comparison by Type (2016-2032)
- Figure 61: Eastern Europe Hot Drinks Market Market Y-o-Y Growth Rate Comparison by Distribution Channel (2016-2032)
- Figure 62: Eastern Europe Hot Drinks Market Market Share Comparison by Country (2016-2032)
- Figure 63: Eastern Europe Hot Drinks Market Market Share Comparison by Type (2016-2032)
- Figure 64: Eastern Europe Hot Drinks Market Market Share Comparison by Distribution Channel (2016-2032)
- Figure 65: APAC Hot Drinks Market Revenue (US$ Mn) Market Share by Typein 2022
- Figure 66: APAC Hot Drinks Market Market Attractiveness Analysis by Type, 2016-2032
- Figure 67: APAC Hot Drinks Market Revenue (US$ Mn) Market Share by Distribution Channelin 2022
- Figure 68: APAC Hot Drinks Market Market Attractiveness Analysis by Distribution Channel, 2016-2032
- Figure 69: APAC Hot Drinks Market Revenue (US$ Mn) Market Share by Country in 2022
- Figure 70: APAC Hot Drinks Market Market Attractiveness Analysis by Country, 2016-2032
- Figure 71: APAC Hot Drinks Market Market Revenue (US$ Mn) (2016-2032)
- Figure 72: APAC Hot Drinks Market Market Revenue (US$ Mn) Comparison by Country (2016-2032)
- Figure 73: APAC Hot Drinks Market Market Revenue (US$ Mn) Comparison by Type (2016-2032)
- Figure 74: APAC Hot Drinks Market Market Revenue (US$ Mn) Comparison by Distribution Channel (2016-2032)
- Figure 75: APAC Hot Drinks Market Market Y-o-Y Growth Rate Comparison by Country (2016-2032)
- Figure 76: APAC Hot Drinks Market Market Y-o-Y Growth Rate Comparison by Type (2016-2032)
- Figure 77: APAC Hot Drinks Market Market Y-o-Y Growth Rate Comparison by Distribution Channel (2016-2032)
- Figure 78: APAC Hot Drinks Market Market Share Comparison by Country (2016-2032)
- Figure 79: APAC Hot Drinks Market Market Share Comparison by Type (2016-2032)
- Figure 80: APAC Hot Drinks Market Market Share Comparison by Distribution Channel (2016-2032)
- Figure 81: Latin America Hot Drinks Market Revenue (US$ Mn) Market Share by Typein 2022
- Figure 82: Latin America Hot Drinks Market Market Attractiveness Analysis by Type, 2016-2032
- Figure 83: Latin America Hot Drinks Market Revenue (US$ Mn) Market Share by Distribution Channelin 2022
- Figure 84: Latin America Hot Drinks Market Market Attractiveness Analysis by Distribution Channel, 2016-2032
- Figure 85: Latin America Hot Drinks Market Revenue (US$ Mn) Market Share by Country in 2022
- Figure 86: Latin America Hot Drinks Market Market Attractiveness Analysis by Country, 2016-2032
- Figure 87: Latin America Hot Drinks Market Market Revenue (US$ Mn) (2016-2032)
- Figure 88: Latin America Hot Drinks Market Market Revenue (US$ Mn) Comparison by Country (2016-2032)
- Figure 89: Latin America Hot Drinks Market Market Revenue (US$ Mn) Comparison by Type (2016-2032)
- Figure 90: Latin America Hot Drinks Market Market Revenue (US$ Mn) Comparison by Distribution Channel (2016-2032)
- Figure 91: Latin America Hot Drinks Market Market Y-o-Y Growth Rate Comparison by Country (2016-2032)
- Figure 92: Latin America Hot Drinks Market Market Y-o-Y Growth Rate Comparison by Type (2016-2032)
- Figure 93: Latin America Hot Drinks Market Market Y-o-Y Growth Rate Comparison by Distribution Channel (2016-2032)
- Figure 94: Latin America Hot Drinks Market Market Share Comparison by Country (2016-2032)
- Figure 95: Latin America Hot Drinks Market Market Share Comparison by Type (2016-2032)
- Figure 96: Latin America Hot Drinks Market Market Share Comparison by Distribution Channel (2016-2032)
- Figure 97: Middle East & Africa Hot Drinks Market Revenue (US$ Mn) Market Share by Typein 2022
- Figure 98: Middle East & Africa Hot Drinks Market Market Attractiveness Analysis by Type, 2016-2032
- Figure 99: Middle East & Africa Hot Drinks Market Revenue (US$ Mn) Market Share by Distribution Channelin 2022
- Figure 100: Middle East & Africa Hot Drinks Market Market Attractiveness Analysis by Distribution Channel, 2016-2032
- Figure 101: Middle East & Africa Hot Drinks Market Revenue (US$ Mn) Market Share by Country in 2022
- Figure 102: Middle East & Africa Hot Drinks Market Market Attractiveness Analysis by Country, 2016-2032
- Figure 103: Middle East & Africa Hot Drinks Market Market Revenue (US$ Mn) (2016-2032)
- Figure 104: Middle East & Africa Hot Drinks Market Market Revenue (US$ Mn) Comparison by Country (2016-2032)
- Figure 105: Middle East & Africa Hot Drinks Market Market Revenue (US$ Mn) Comparison by Type (2016-2032)
- Figure 106: Middle East & Africa Hot Drinks Market Market Revenue (US$ Mn) Comparison by Distribution Channel (2016-2032)
- Figure 107: Middle East & Africa Hot Drinks Market Market Y-o-Y Growth Rate Comparison by Country (2016-2032)
- Figure 108: Middle East & Africa Hot Drinks Market Market Y-o-Y Growth Rate Comparison by Type (2016-2032)
- Figure 109: Middle East & Africa Hot Drinks Market Market Y-o-Y Growth Rate Comparison by Distribution Channel (2016-2032)
- Figure 110: Middle East & Africa Hot Drinks Market Market Share Comparison by Country (2016-2032)
- Figure 111: Middle East & Africa Hot Drinks Market Market Share Comparison by Type (2016-2032)
- Figure 112: Middle East & Africa Hot Drinks Market Market Share Comparison by Distribution Channel (2016-2032)
"
- List of Tables
- "
- Table 1: Global Hot Drinks Market Market Comparison by Type (2016-2032)
- Table 2: Global Hot Drinks Market Market Comparison by Distribution Channel (2016-2032)
- Table 3: Global Hot Drinks Market Revenue (US$ Mn) Comparison by Region (2016-2032)
- Table 4: Global Hot Drinks Market Market Revenue (US$ Mn) (2016-2032)
- Table 5: Global Hot Drinks Market Market Revenue (US$ Mn) Comparison by Region (2016-2032)
- Table 6: Global Hot Drinks Market Market Revenue (US$ Mn) Comparison by Type (2016-2032)
- Table 7: Global Hot Drinks Market Market Revenue (US$ Mn) Comparison by Distribution Channel (2016-2032)
- Table 8: Global Hot Drinks Market Market Y-o-Y Growth Rate Comparison by Region (2016-2032)
- Table 9: Global Hot Drinks Market Market Y-o-Y Growth Rate Comparison by Type (2016-2032)
- Table 10: Global Hot Drinks Market Market Y-o-Y Growth Rate Comparison by Distribution Channel (2016-2032)
- Table 11: Global Hot Drinks Market Market Share Comparison by Region (2016-2032)
- Table 12: Global Hot Drinks Market Market Share Comparison by Type (2016-2032)
- Table 13: Global Hot Drinks Market Market Share Comparison by Distribution Channel (2016-2032)
- Table 14: North America Hot Drinks Market Market Comparison by Distribution Channel (2016-2032)
- Table 15: North America Hot Drinks Market Revenue (US$ Mn) Comparison by Country (2016-2032)
- Table 16: North America Hot Drinks Market Market Revenue (US$ Mn) (2016-2032)
- Table 17: North America Hot Drinks Market Market Revenue (US$ Mn) Comparison by Country (2016-2032)
- Table 18: North America Hot Drinks Market Market Revenue (US$ Mn) Comparison by Type (2016-2032)
- Table 19: North America Hot Drinks Market Market Revenue (US$ Mn) Comparison by Distribution Channel (2016-2032)
- Table 20: North America Hot Drinks Market Market Y-o-Y Growth Rate Comparison by Country (2016-2032)
- Table 21: North America Hot Drinks Market Market Y-o-Y Growth Rate Comparison by Type (2016-2032)
- Table 22: North America Hot Drinks Market Market Y-o-Y Growth Rate Comparison by Distribution Channel (2016-2032)
- Table 23: North America Hot Drinks Market Market Share Comparison by Country (2016-2032)
- Table 24: North America Hot Drinks Market Market Share Comparison by Type (2016-2032)
- Table 25: North America Hot Drinks Market Market Share Comparison by Distribution Channel (2016-2032)
- Table 26: Western Europe Hot Drinks Market Market Comparison by Type (2016-2032)
- Table 27: Western Europe Hot Drinks Market Market Comparison by Distribution Channel (2016-2032)
- Table 28: Western Europe Hot Drinks Market Revenue (US$ Mn) Comparison by Country (2016-2032)
- Table 29: Western Europe Hot Drinks Market Market Revenue (US$ Mn) (2016-2032)
- Table 30: Western Europe Hot Drinks Market Market Revenue (US$ Mn) Comparison by Country (2016-2032)
- Table 31: Western Europe Hot Drinks Market Market Revenue (US$ Mn) Comparison by Type (2016-2032)
- Table 32: Western Europe Hot Drinks Market Market Revenue (US$ Mn) Comparison by Distribution Channel (2016-2032)
- Table 33: Western Europe Hot Drinks Market Market Y-o-Y Growth Rate Comparison by Country (2016-2032)
- Table 34: Western Europe Hot Drinks Market Market Y-o-Y Growth Rate Comparison by Type (2016-2032)
- Table 35: Western Europe Hot Drinks Market Market Y-o-Y Growth Rate Comparison by Distribution Channel (2016-2032)
- Table 36: Western Europe Hot Drinks Market Market Share Comparison by Country (2016-2032)
- Table 37: Western Europe Hot Drinks Market Market Share Comparison by Type (2016-2032)
- Table 38: Western Europe Hot Drinks Market Market Share Comparison by Distribution Channel (2016-2032)
- Table 39: Eastern Europe Hot Drinks Market Market Comparison by Type (2016-2032)
- Table 40: Eastern Europe Hot Drinks Market Market Comparison by Distribution Channel (2016-2032)
- Table 41: Eastern Europe Hot Drinks Market Revenue (US$ Mn) Comparison by Country (2016-2032)
- Table 42: Eastern Europe Hot Drinks Market Market Revenue (US$ Mn) (2016-2032)
- Table 43: Eastern Europe Hot Drinks Market Market Revenue (US$ Mn) Comparison by Country (2016-2032)
- Table 44: Eastern Europe Hot Drinks Market Market Revenue (US$ Mn) Comparison by Type (2016-2032)
- Table 45: Eastern Europe Hot Drinks Market Market Revenue (US$ Mn) Comparison by Distribution Channel (2016-2032)
- Table 46: Eastern Europe Hot Drinks Market Market Y-o-Y Growth Rate Comparison by Country (2016-2032)
- Table 47: Eastern Europe Hot Drinks Market Market Y-o-Y Growth Rate Comparison by Type (2016-2032)
- Table 48: Eastern Europe Hot Drinks Market Market Y-o-Y Growth Rate Comparison by Distribution Channel (2016-2032)
- Table 49: Eastern Europe Hot Drinks Market Market Share Comparison by Country (2016-2032)
- Table 50: Eastern Europe Hot Drinks Market Market Share Comparison by Type (2016-2032)
- Table 51: Eastern Europe Hot Drinks Market Market Share Comparison by Distribution Channel (2016-2032)
- Table 52: APAC Hot Drinks Market Market Comparison by Type (2016-2032)
- Table 53: APAC Hot Drinks Market Market Comparison by Distribution Channel (2016-2032)
- Table 54: APAC Hot Drinks Market Revenue (US$ Mn) Comparison by Country (2016-2032)
- Table 55: APAC Hot Drinks Market Market Revenue (US$ Mn) (2016-2032)
- Table 56: APAC Hot Drinks Market Market Revenue (US$ Mn) Comparison by Country (2016-2032)
- Table 57: APAC Hot Drinks Market Market Revenue (US$ Mn) Comparison by Type (2016-2032)
- Table 58: APAC Hot Drinks Market Market Revenue (US$ Mn) Comparison by Distribution Channel (2016-2032)
- Table 59: APAC Hot Drinks Market Market Y-o-Y Growth Rate Comparison by Country (2016-2032)
- Table 60: APAC Hot Drinks Market Market Y-o-Y Growth Rate Comparison by Type (2016-2032)
- Table 61: APAC Hot Drinks Market Market Y-o-Y Growth Rate Comparison by Distribution Channel (2016-2032)
- Table 62: APAC Hot Drinks Market Market Share Comparison by Country (2016-2032)
- Table 63: APAC Hot Drinks Market Market Share Comparison by Type (2016-2032)
- Table 64: APAC Hot Drinks Market Market Share Comparison by Distribution Channel (2016-2032)
- Table 65: Latin America Hot Drinks Market Market Comparison by Type (2016-2032)
- Table 66: Latin America Hot Drinks Market Market Comparison by Distribution Channel (2016-2032)
- Table 67: Latin America Hot Drinks Market Revenue (US$ Mn) Comparison by Country (2016-2032)
- Table 68: Latin America Hot Drinks Market Market Revenue (US$ Mn) (2016-2032)
- Table 69: Latin America Hot Drinks Market Market Revenue (US$ Mn) Comparison by Country (2016-2032)
- Table 70: Latin America Hot Drinks Market Market Revenue (US$ Mn) Comparison by Type (2016-2032)
- Table 71: Latin America Hot Drinks Market Market Revenue (US$ Mn) Comparison by Distribution Channel (2016-2032)
- Table 72: Latin America Hot Drinks Market Market Y-o-Y Growth Rate Comparison by Country (2016-2032)
- Table 73: Latin America Hot Drinks Market Market Y-o-Y Growth Rate Comparison by Type (2016-2032)
- Table 74: Latin America Hot Drinks Market Market Y-o-Y Growth Rate Comparison by Distribution Channel (2016-2032)
- Table 75: Latin America Hot Drinks Market Market Share Comparison by Country (2016-2032)
- Table 76: Latin America Hot Drinks Market Market Share Comparison by Type (2016-2032)
- Table 77: Latin America Hot Drinks Market Market Share Comparison by Distribution Channel (2016-2032)
- Table 78: Middle East & Africa Hot Drinks Market Market Comparison by Type (2016-2032)
- Table 79: Middle East & Africa Hot Drinks Market Market Comparison by Distribution Channel (2016-2032)
- Table 80: Middle East & Africa Hot Drinks Market Revenue (US$ Mn) Comparison by Country (2016-2032)
- Table 81: Middle East & Africa Hot Drinks Market Market Revenue (US$ Mn) (2016-2032)
- Table 82: Middle East & Africa Hot Drinks Market Market Revenue (US$ Mn) Comparison by Country (2016-2032)
- Table 83: Middle East & Africa Hot Drinks Market Market Revenue (US$ Mn) Comparison by Type (2016-2032)
- Table 84: Middle East & Africa Hot Drinks Market Market Revenue (US$ Mn) Comparison by Distribution Channel (2016-2032)
- Table 85: Middle East & Africa Hot Drinks Market Market Y-o-Y Growth Rate Comparison by Country (2016-2032)
- Table 86: Middle East & Africa Hot Drinks Market Market Y-o-Y Growth Rate Comparison by Type (2016-2032)
- Table 87: Middle East & Africa Hot Drinks Market Market Y-o-Y Growth Rate Comparison by Distribution Channel (2016-2032)
- Table 88: Middle East & Africa Hot Drinks Market Market Share Comparison by Country (2016-2032)
- Table 89: Middle East & Africa Hot Drinks Market Market Share Comparison by Type (2016-2032)
- Table 90: Middle East & Africa Hot Drinks Market Market Share Comparison by Distribution Channel (2016-2032)
- 1. Executive Summary
-
- The Coffee Bean & Tea Leaf
- Unilever
- Gourmesso
- Harney & Sons Fine Teas
- Dualit
- Nestlé SA
- Dilmah Ceylon Tea Company PLC
- Ippodo Tea Co. Ltd.
- Tranquini
- Chillbev
- Som Sleep
- Phi Drinks, Inc.
- BevNet.com
- Associated British Foods
- JAB Holding
- Food Empire Holdings
- Starbucks Corporation
- Tchibo
Our Clients


View Our Licence Options
