
Hepatitis C Treatment Market Report By Treatment Type (Direct-Acting Antivirals (DAAs), Interferon-Based Therapy, Combination Therapy (DAAs + Interferon ± Ribavirin)), By Stage of Liver Disease (Compensated Cirrhosis, Decompensated Cirrhosis, Liver Transplantation), By End Users, By Region and Companies - Industry Segment Outlook, Market Assessment, Competition Scenario, Trends and Forecast 2024-2033
-
45393
-
May 2024
-
290
-


-
This report was compiled by Trishita Deb Trishita Deb is an experienced market research and consulting professional with over 7 years of expertise across healthcare, consumer goods, and materials, contributing to over 400 healthcare-related reports. Correspondence Team Lead- Healthcare Linkedin | Detailed Market research Methodology Our methodology involves a mix of primary research, including interviews with leading mental health experts, and secondary research from reputable medical journals and databases. View Detailed Methodology Page
-
Quick Navigation
Report Overview
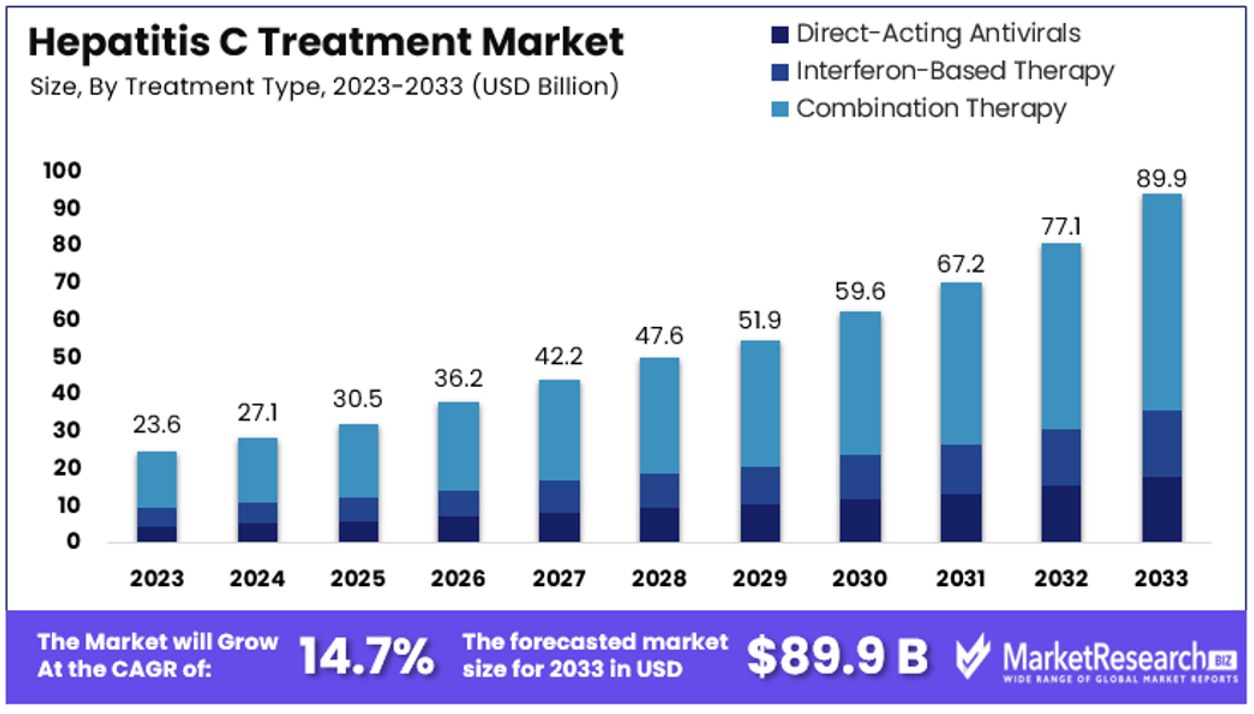
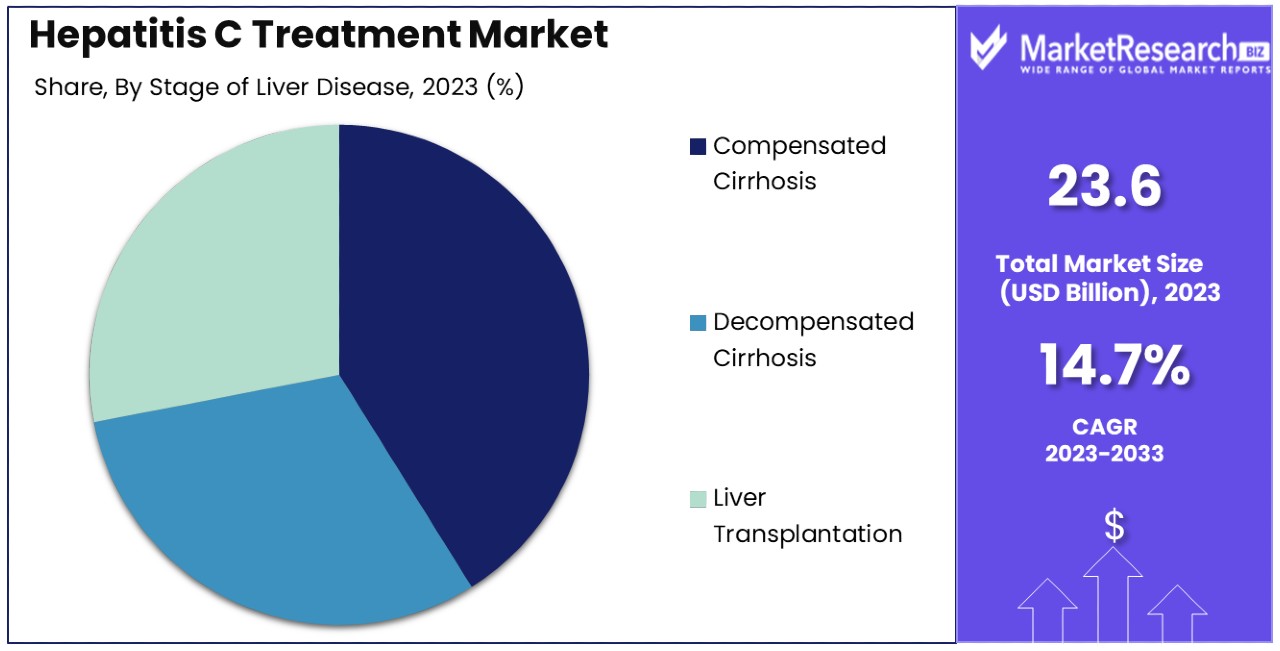
The Global Hepatitis C Treatment Market size is expected to be worth around USD 89.9 Billion by 2033, from USD 23.6 Billion in 2023, growing at a CAGR of 14.7% during the forecast period from 2024 to 2033.
The Hepatitis C Treatment Market encompasses a range of medical solutions aimed at combating the Hepatitis C virus (HCV). This market includes pharmaceuticals like antiviral drugs, which are pivotal in managing and curing the infection. Innovations in therapy, such as combination treatments, have significantly enhanced the efficacy and reduced the duration of treatment, thereby improving patient outcomes.
The market is driven by advancements in diagnostic technologies, increasing awareness of the disease, and improved healthcare infrastructure. As this sector evolves, it offers substantial opportunities for pharmaceutical companies and healthcare providers to develop and market new and effective treatment modalities.
The Hepatitis C Treatment Market is currently positioned at a critical juncture, shaped by a persistent high global prevalence and ongoing medical advancements. Approximately 50 million people worldwide are living with chronic hepatitis C virus (HCV) infection, with around 1.0 million new cases reported annually. This enduring high incidence underlines a robust and continuous demand for effective treatment solutions.
In the United States alone, the year 2021 witnessed 107,300 new identifications of chronic hepatitis C cases, equating to a rate of 39.8 cases per 100,000 individuals. This data not only highlights the significant healthcare burden but also underscores the market's potential capacity for growth and expansion.
Market dynamics are influenced by several key factors, including advancements in pharmaceutical therapies that offer higher cure rates and shorter treatment durations. The introduction of direct-acting antivirals (DAAs) has revolutionized the landscape, offering over 90% cure rates, which significantly drives market growth. Moreover, increasing government initiatives aimed at hepatitis C screening and awareness campaigns are pivotal in diagnosing hidden cases, further fueling the demand for treatment options.
Economic factors also play a crucial role, as treatment affordability and access to healthcare services vary widely across different regions, affecting the market's penetration rates and growth prospects. As stakeholders continue to invest in research and development, the market is expected to see the introduction of more innovative and cost-effective treatment regimens.
Thus, the Hepatitis C Treatment Market presents a valuable opportunity for pharmaceutical companies and healthcare providers to not only contribute to public health improvement but also capitalize on the substantial economic prospects offered by increasing treatment demands.
Key Takeaways
- Market Value: The Global Hepatitis C Treatment Market is anticipated to reach a substantial value of USD 89.9 billion by 2033, showing remarkable growth from USD 23.6 billion in 2023, with a robust CAGR of 14.7% during the forecast period from 2024 to 2033.
- Treatment Type Analysis: Combination Therapy (DAAs + Interferon ± Ribavirin) leads with 65.3% dominance due to its enhanced efficacy and improved patient outcomes. Interferon-Based Therapy serves a smaller segment, primarily in scenarios where DAAs are not suitable or available.
- Stage of Liver Disease Analysis: Compensated and decompensated cirrhosis segments drive ongoing treatment needs and research focus, while Liver Transplantation represents a critical but less frequent stage requiring specialized care.
- End Users Analysis: Hospitals dominate with 47.2% market share due to their comprehensive care facilities and advanced treatment options. Specialty clinics and retail pharmacies also play vital roles in providing specialized care and medication access.
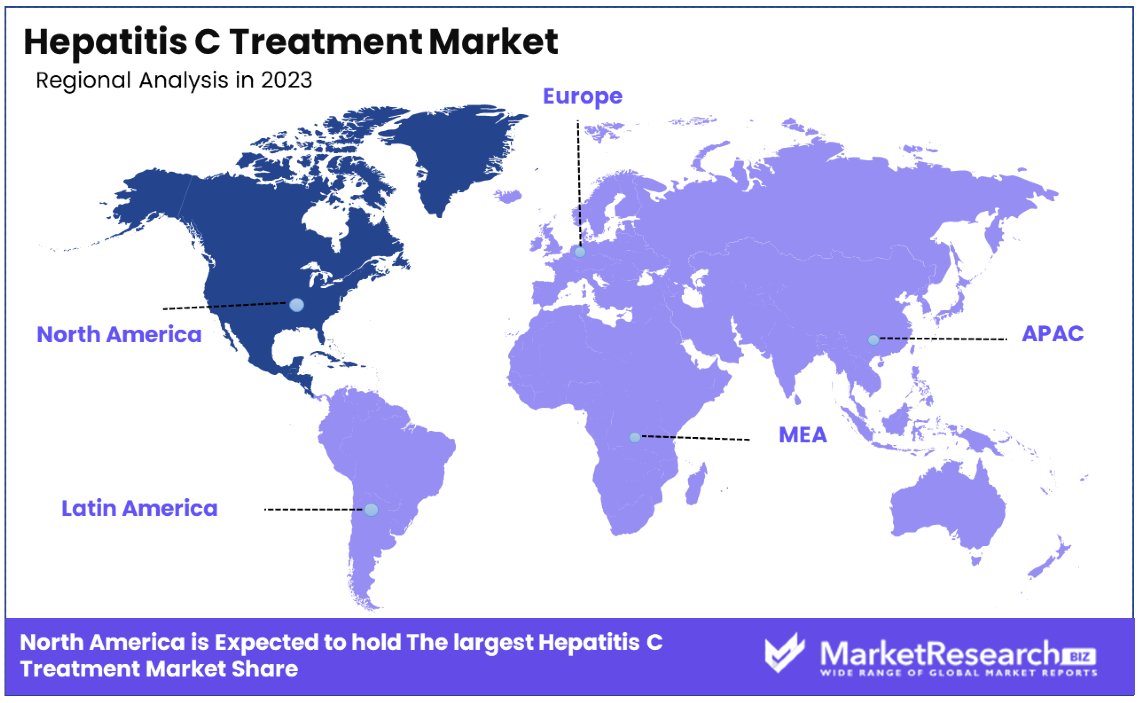
- North America: Dominates the market with a 46.2% share, showcasing advanced healthcare systems and extensive treatment accessibility.
- Europe: Holds a significant share of approximately 25.6%, supported by robust healthcare systems and widespread treatment accessibility.
- Analyst Viewpoint: Opportunities exist for continued advancements in Combination Therapy, focusing on enhancing efficacy and reducing treatment costs. Further research into liver disease stages, especially in decompensated cirrhosis and Liver Transplantation, can lead to improved treatment strategies and outcomes.
Driving Factors
Increasing Prevalence of Hepatitis C Drives Market Growth
The escalating global prevalence of hepatitis C significantly propels the Hepatitis C Treatment Market. Currently, an estimated 58 million individuals worldwide are living with chronic hepatitis C, as reported by the World Health Organization (WHO).
This substantial and growing patient base necessitates a steady demand for effective therapeutic options, thus directly contributing to market expansion. Particularly in regions like Egypt, Pakistan, and China, where hepatitis C rates are notably high, the demand for treatments intensifies. The increasing number of patients correlates with a heightened urgency for healthcare systems to address this healthcare challenge, thereby boosting the market's volume and dynamics.
Launch of Highly Effective Direct-Acting Antiviral (DAA) Therapies Drives Market Growth
The introduction and availability of Direct-Acting Antiviral (DAA) therapies have transformed the Hepatitis C Treatment Market. Drugs such as sofosbuvir, ledipasvir, and velpatasvir deliver high cure rates—often exceeding 90%—alongside shorter treatment durations and fewer side effects compared to older, interferon-based regimens.
This significant improvement in treatment efficacy and patient experience has led to increased adoption of these therapies. Gilead Sciences' DAAs, Harvoni and Sovaldi, are prime examples, having greatly expanded market boundaries through their effectiveness. The shift towards DAA therapies underscores a pivotal trend in market growth, marked by advanced treatment solutions replacing outdated methods.
Favorable Government Initiatives and Awareness Programs Drive Market Growth
Governmental initiatives and awareness programs play a critical role in amplifying the growth of the Hepatitis C Treatment Market. By promoting hepatitis C screening and enhancing disease awareness, these programs aim to facilitate early diagnosis and improve access to effective treatments.
In the United States, for example, the CDC's recommendation for hepatitis C screening among the 1945 to 1965 birth cohort—identified as a high-risk group—has significantly boosted the identification of new cases. These efforts help in diagnosing previously unrecognized infections, increasing the number of individuals seeking treatment, and consequently expanding the market. Such policies not only promote health but also drive demand within the treatment market by ensuring a larger number of patients are aware of and able to access necessary therapies.
Restraining Factors
High Cost of Treatment Restrains Market Growth
The elevated cost of hepatitis C treatment, especially with Direct-Acting Antiviral (DAA) therapies, significantly restricts market growth. In the United States, the price for a standard 12-week course of Harvoni, a leading DAA treatment, can vary from $63,000 to $94,500, depending on the healthcare setting and insurance coverage.
This high cost poses a formidable barrier, particularly for patients in low-income countries or those lacking sufficient health insurance. The financial inaccessibility of these treatments reduces the patient base that can afford these life-saving drugs, thereby limiting market expansion. High treatment costs may deter patients from seeking necessary care, directly impacting market growth as fewer individuals can access these advanced therapies.
Patent Expiration and Generic Competition Restrains Market Growth
The expiration of patents on branded hepatitis C drugs and the consequent surge of generic versions have introduced significant challenges to the market. Generic drugs, typically offered at a lower price, exert downward pressure on the pricing of branded treatments, squeezing profit margins.
This heightened competition not only affects the profitability of existing products but can also discourage pharmaceutical companies from investing in new drug development due to reduced potential returns. As generics become more prevalent, branded manufacturers may see slowed growth rates, hindering overall market expansion and innovation in treatment options.
Treatment Type Analysis
Combination Therapy (DAAs + Interferon ± Ribavirin) dominates with 65.3% due to enhanced efficacy and improved patient outcomes.
The Hepatitis C Treatment Market is segmented by treatment types, among which Combination Therapy emerges as the dominant sub-segment, accounting for 65.3% of the market. This therapy typically combines Direct-Acting Antivirals (DAAs) with Interferon and, in some cases, Ribavirin, capitalizing on the strengths of each to maximize patient recovery rates. The efficacy of Combination Therapy is particularly high, often leading to better clearance rates of the hepatitis C virus from the bloodstream when compared to treatments using a single medication approach.
DAAs alone have transformed Hepatitis C treatment due to their high success rates and fewer side effects compared to older therapies. However, for certain genotypes of the virus and in cases of advanced liver disease, the addition of Interferon and Ribavirin can be necessary to achieve the desired treatment outcomes. While DAAs are highly effective, their high cost can be a limitation, making Combination Therapy a more viable option in varying economic settings.
Interferon-Based Therapy, once the standard of care, now serves a smaller segment of the market. It is primarily used in scenarios where DAAs are not suitable or available. Interferon-Based Therapy has more side effects and a longer treatment duration, which can impact patient adherence and comfort.
Stage of Liver Disease Analysis
Liver Transplantation is a critical but less frequent stage, while compensated and decompensated cirrhosis drive ongoing treatment needs and research focus.
In the segmentation by the stage of liver disease, each sub-segment addresses the specific needs and treatment approaches required for different severities of Hepatitis C-induced liver damage. Compensated cirrhosis, where the liver still maintains function despite damage, and decompensated cirrhosis, a more severe form where the liver cannot function properly, typically require ongoing management and can often be treated with medication to slow disease progression and manage symptoms.
Liver Transplantation represents a smaller but vital segment of the market. It is considered for patients who have developed severe, irreversible liver damage that no longer responds to other forms of therapy. This segment, while not as large in volume as medication therapy for earlier stages of liver disease, is crucial and involves significant medical care and follow-up treatments.
The management of hepatitis C in the context of liver transplantation involves not only the surgical procedure but also pre- and post-transplantation antiviral treatments to prevent the recurrence of the virus, which can infect the new liver. This comprehensive approach underscores the complexity and depth of care required for these patients, reflecting ongoing needs for specialized treatments and medications that can adapt to such high-risk scenarios.
End Users Analysis
Hospitals dominate with 47.2% due to comprehensive care facilities and the ability to administer advanced treatments.
The Hepatitis C Treatment Market by end users is significantly led by hospitals, which account for 47.2% of the market share. Hospitals are typically the primary centers for comprehensive healthcare, offering advanced diagnostic tools and treatment options, including high-end medication therapies and access to specialist care. This makes them a crucial point for the treatment of Hepatitis C, especially for severe cases that may require detailed monitoring or combination therapies.
Specialty clinics, which include gastroenterology and hepatology clinics, also play a vital role in the Hepatitis C Treatment Market. These clinics offer specialized care focused specifically on liver diseases and are essential for managing the ongoing needs of patients with less severe forms of hepatitis C or those in post-treatment recovery.
Retail pharmacies complement the treatment landscape by providing access to prescribed medications and ongoing pharmaceutical care, which is critical for sustained treatment adherence and management of the disease in a community setting.
Hospitals' dominance in the market is due to their equipped facilities that can handle complex and severe medical cases, combined with their role in providing immediate and comprehensive care, which is essential for effective hepatitis C management.
Key Market Segments
By Treatment Type
- Direct-Acting Antivirals (DAAs)
- Interferon-Based Therapy
- Combination Therapy (DAAs + Interferon ± Ribavirin)
By Stage of Liver Disease
- Compensated Cirrhosis
- Decompensated Cirrhosis
- Liver Transplantation
By End Users
- Hospitals
- Specialty Clinics
- Gastroenterology Clinics
- Hepatology Clinics
- Retail Pharmacies
Growth Opportunities
Development of Pan-Genotypic Treatments Offers Growth Opportunity
The advancement of pan-genotypic treatments in the Hepatitis C Treatment Market presents significant growth opportunities. These treatments, capable of targeting multiple virus genotypes, broaden the scope of who can be effectively treated, surpassing the limitations of genotype-specific therapies.
By simplifying treatment regimens and improving patient adherence, pan-genotypic drugs like AbbVie's Mavyret (glecaprevir/pibrentasvir), which is approved for all major genotypes, can serve a larger and more diverse patient base. This capability not only enhances patient outcomes but also extends the market reach into regions with varied genotype distributions. The introduction of such versatile treatments is pivotal in driving market growth by catering to a broader demographic, thus expanding the addressable market significantly.
Expansion into Emerging Markets Offers Growth Opportunity
Emerging markets represent a critical area for expansion within the Hepatitis C Treatment Market. Countries like India, Brazil, and parts of Africa, with their high prevalence of hepatitis C and increasing healthcare access, are ripe for market penetration. Pharmaceutical companies can exploit these opportunities through strategic partnerships and innovative pricing strategies to make treatments more accessible and affordable.
Gilead Sciences' approach of partnering with generic manufacturers to supply low-cost hepatitis C therapies in developing countries exemplifies how companies can effectively enter and expand in these underserved markets. Such strategies not only meet significant healthcare needs but also drive substantial market growth by tapping into new patient populations that were previously unreachable. This strategic market expansion is essential for pharmaceutical companies looking to increase their global footprint and impact on public health.
Trending Factors
Focus on Microelimination Strategies Are Trending Factors
The trend towards microelimination strategies in the Hepatitis C Treatment Market is gaining traction as a method to address the disease in specific, high-risk populations. These targeted approaches include intensified screening, direct linkage to care, and tailored treatments for groups such as people who inject drugs, incarcerated individuals, and certain ethnic minorities.
By focusing on these segments, microelimination efforts aim to significantly lower the overall hepatitis C burden. Initiatives like the CDC's Hepatitis C Microelimination Projects in the United States exemplify this strategy by concentrating resources on eliminating the virus within defined high-risk groups. This focused approach not only improves health outcomes for these communities but also opens up new market opportunities for treatments and diagnostics tailored to meet their specific needs.
Emphasis on Point-of-Care Testing and Decentralized Care Are Trending Factors
The increasing emphasis on point-of-care testing and decentralized care represents a significant trend within the Hepatitis C Treatment Market. This shift is driven by the goal of enhancing accessibility to diagnosis and treatment, particularly in underserved areas. Rapid point-of-care tests, such as those developed by Abbott and OraQuick, allow for immediate hepatitis C detection, which facilitates quicker linkage to treatment.
By bringing care closer to where patients live, these decentralized models help to reduce barriers to access, such as travel or long wait times for appointments. This trend is particularly important for reaching populations that have traditionally been difficult to serve, thereby broadening the market's reach and enhancing the uptake of hepatitis C treatments. These innovations in care delivery are critical for expanding treatment access and improving patient outcomes across diverse settings.
Regional Analysis
North America Dominates with 46.2% Market Share
North America's prominent position in the Hepatitis C Treatment Market, holding a 46.2% share, is driven by several robust factors. High disease awareness, advanced healthcare infrastructure, and the presence of leading pharmaceutical companies contribute significantly. The region's aggressive public health strategies, including widespread screening and the adoption of the latest treatment protocols, also enhance market penetration. Moreover, North America benefits from substantial healthcare spending and supportive government policies that encourage research and development in hepatitis C therapies.
The dynamics within North America are characterized by an integrated approach to hepatitis care. The region's well-established healthcare system enables effective implementation of treatment and management strategies. This, combined with high patient awareness and the availability of medical insurance, facilitates access to the latest treatments, thus maintaining a high treatment uptake rate. The prevalence of key market players in the region supports continuous innovation and availability of advanced therapeutic options, keeping the market vibrant and responsive to patient needs.
Regional Market Shares:
- Europe: Europe holds a significant share of the global market, with approximately 25.6%. This is supported by robust healthcare systems and widespread treatment accessibility.
- Asia Pacific: This region is rapidly growing with a market share of 18.9%, driven by increasing healthcare infrastructure and rising public health awareness.
- Middle East & Africa: Despite being smaller markets, these regions are experiencing gradual growth, currently holding a 4.8% market share, due to improving healthcare systems and government initiatives.
- Latin America: Latin America has a 4.5% share of the market, with growth influenced by increasing public health campaigns and improving treatment access.
Key Regions and Countries
- North America
- The US
- Canada
- Mexico
- Western Europe
- Germany
- France
- The UK
- Spain
- Italy
- Portugal
- Ireland
- Austria
- Switzerland
- Benelux
- Nordic
- Rest of Western Europe
- Eastern Europe
- Russia
- Poland
- The Czech Republic
- Greece
- Rest of Eastern Europe
- APAC
- China
- Japan
- South Korea
- India
- Australia & New Zealand
- Indonesia
- Malaysia
- Philippines
- Singapore
- Thailand
- Vietnam
- Rest of APAC
- Latin America
- Brazil
- Colombia
- Chile
- Argentina
- Costa Rica
- Rest of Latin America
- Middle East & Africa
- Algeria
- Egypt
- Israel
- Kuwait
- Nigeria
- Saudi Arabia
- South Africa
- Turkey
- United Arab Emirates
- Rest of MEA
Key Players Analysis
In the Hepatitis C Treatment Market, several key players exhibit significant influence and strategic positioning. Gilead Sciences Inc. stands out as a dominant force, primarily due to its revolutionary antiviral treatments which have significantly advanced the standard of care. AbbVie Inc. and Merck & Co., Inc. also play crucial roles, with robust drug portfolios and substantial market shares.
Companies like Bristol-Myers Squibb Company and F. Hoffmann-La Roche Ltd. enhance the competitive dynamics through continuous innovation and global outreach, further supported by strong R&D capabilities. Pfizer Inc. and AstraZeneca PLC contribute to the market with their broad therapeutic lines and significant investments in new treatment modalities.
On the generics front, Teva Pharmaceutical Industries Ltd. and Mylan N.V. are important due to their cost-effective alternatives, which are vital for increasing accessibility in lower-income regions. Roche Holding AG, with its dual focus on original and generic medicines, holds a unique position influencing both ends of the market spectrum.
Vertex Pharmaceuticals Inc., Janssen Pharmaceuticals Inc., and Eli Lilly and Company are noted for their targeted therapies and commitment to research that could potentially lead to breakthroughs in Hepatitis C treatment.
Sanofi S.A. and Bayer AG, although more diversified, still impact the Hepatitis C market through their investments in liver diseases and related conditions. Collectively, these companies shape the market landscape, driving forward innovations and accessibility in Hepatitis C treatment.
Market Key Players
- Bristol-Myers Squibb Company
- AbbVie Inc.
- Gilead Sciences Inc.
- Merck & Co., Inc.
- Pfizer Inc.
- F. Hoffmann-La Roche Ltd.
- Teva Pharmaceutical Industries Ltd.
- Roche Holding AG
- Mylan N.V.
- Bayer AG
- Sanofi S.A.
- Vertex Pharmaceuticals Inc.
- Janssen Pharmaceuticals Inc.
- Eli Lilly and Company
- AstraZeneca PLC
Recent Developments
- On April 2024, a study published in the Journal of the American Medical Association (JAMA) found that early treatment with direct-acting antiviral (DAA) therapy for children with perinatally acquired hepatitis C virus (HCV) infection is highly effective and cost-effective in the United States.
- On April 2024, the Health Service Executive (HSE) in Ireland announced that it is on track to meet the World Health Organization's (WHO) target of eliminating 80% of hepatitis C by 2030. The HSE has treated over 7,000 people, 95% of whom have been cured, and has launched a free home testing service to increase diagnosis and treatment.
- On April 2024 the WHO announced upcoming updates on the co-administration of treatment for drug-resistant tuberculosis and hepatitis C, which could have significant implications for the management of these co-occurring conditions.
- On October 2023, researchers at the University of California, San Francisco (UCSF) developed a new model of care that brings hepatitis C treatment directly to people, including those who inject drugs and lack stable housing, immediately after their diagnosis. The study found that 92% of those who completed the treatment had undetectable levels of the hepatitis C virus, and 84% were cured three months after treatment.
Report Scope
Report Features Description Market Value (2023) USD 23.6 Billion Forecast Revenue (2033) USD 89.9 Billion CAGR (2024-2033) 14.70% Base Year for Estimation 2023 Historic Period 2018-2023 Forecast Period 2024-2033 Report Coverage Revenue Forecast, Market Dynamics, Competitive Landscape, Recent Developments Segments Covered By Treatment Type (Direct-Acting Antivirals (DAAs), Interferon-Based Therapy, Combination Therapy (DAAs + Interferon ± Ribavirin)), By Stage of Liver Disease (Compensated Cirrhosis, Decompensated Cirrhosis, Liver Transplantation), By End Users (Hospitals, Specialty Clinics, Gastroenterology Clinics, Hepatology Clinics, Retail Pharmacies) Regional Analysis North America - The US, Canada, & Mexico; Western Europe - Germany, France, The UK, Spain, Italy, Portugal, Ireland, Austria, Switzerland, Benelux, Nordic, & Rest of Western Europe; Eastern Europe - Russia, Poland, The Czech Republic, Greece, & Rest of Eastern Europe; APAC - China, Japan, South Korea, India, Australia & New Zealand, Indonesia, Malaysia, Philippines, Singapore, Thailand, Vietnam, & Rest of APAC; Latin America - Brazil, Colombia, Chile, Argentina, Costa Rica, & Rest of Latin America; Middle East & Africa - Algeria, Egypt, Israel, Kuwait, Nigeria, Saudi Arabia, South Africa, Turkey, United Arab Emirates, & Rest of MEA Competitive Landscape Bristol-Myers Squibb Company, AbbVie Inc., Gilead Sciences Inc., Merck & Co., Inc., Pfizer Inc., F. Hoffmann-La Roche Ltd., Teva Pharmaceutical Industries Ltd., Roche Holding AG, Mylan N.V., Bayer AG, Sanofi S.A., Vertex Pharmaceuticals Inc., Janssen Pharmaceuticals Inc., Eli Lilly and Company, AstraZeneca PLC Customization Scope Customization for segments, region/country-level will be provided. Moreover, additional customization can be done based on the requirements. Purchase Options We have three licenses to opt for: Single User License, Multi-User License (Up to 5 Users), Corporate Use License (Unlimited User and Printable PDF) -
- 1. Executive Summary
- 1.1. Definition
- 1.2. Taxonomy
- 1.3. Research Scope
- 1.4. Key Analysis
- 1.5. Key Findings by Major Segments
- 1.6. Top strategies by Major Players
- 2. Global Hepatitis C Treatment Market Overview
- 2.1. Hepatitis C Treatment Market Dynamics
- 2.1.1. Drivers
- 2.1.2. Opportunities
- 2.1.3. Restraints
- 2.1.4. Challenges
- 2.2. Macro-economic Factors
- 2.3. Regulatory Framework
- 2.4. Market Investment Feasibility Index
- 2.5. PEST Analysis
- 2.6. PORTER’S Five Force Analysis
- 2.7. Drivers & Restraints Impact Analysis
- 2.8. Industry Chain Analysis
- 2.9. Cost Structure Analysis
- 2.10. Marketing Strategy
- 2.11. Russia-Ukraine War Impact Analysis
- 2.12. Opportunity Map Analysis
- 2.13. Market Competition Scenario Analysis
- 2.14. Product Life Cycle Analysis
- 2.15. Opportunity Orbits
- 2.16. Manufacturer Intensity Map
- 2.17. Major Companies sales by Value & Volume
- 2.1. Hepatitis C Treatment Market Dynamics
- 3. Global Hepatitis C Treatment Market Analysis, Opportunity and Forecast, 2016-2032
- 3.1. Global Hepatitis C Treatment Market Analysis, 2016-2021
- 3.2. Global Hepatitis C Treatment Market Opportunity and Forecast, 2023-2032
- 3.3. Global Hepatitis C Treatment Market Analysis, Opportunity and Forecast, By Treatment Type, 2016-2032
- 3.3.1. Global Hepatitis C Treatment Market Analysis by Treatment Type: Introduction
- 3.3.2. Market Size Absolute $ Opportunity Analysis and Forecast, By Treatment Type, 2016-2032
- 3.3.3. Direct-Acting Antivirals
- 3.3.4. Interferon-Based Therapy
- 3.3.5. Combination Therapy
- 3.4. Global Hepatitis C Treatment Market Analysis, Opportunity and Forecast, By Stage of Liver Disease, 2016-2032
- 3.4.1. Global Hepatitis C Treatment Market Analysis by Stage of Liver Disease: Introduction
- 3.4.2. Market Size Absolute $ Opportunity Analysis and Forecast, By Stage of Liver Disease, 2016-2032
- 3.4.3. Compensated Cirrhosis
- 3.4.4. Decompensated Cirrhosis
- 3.4.5. Liver Transplantation
- 3.5. Global Hepatitis C Treatment Market Analysis, Opportunity and Forecast, By End Users, 2016-2032
- 3.5.1. Global Hepatitis C Treatment Market Analysis by End Users: Introduction
- 3.5.2. Market Size Absolute $ Opportunity Analysis and Forecast, By End Users, 2016-2032
- 3.5.3. Hospitals
- 3.5.4. Specialty Clinics
- 3.5.5. Gastroenterology Clinics
- 3.5.6. Hepatology Clinics
- 3.5.7. Retail Pharmacies
- 4. North America Hepatitis C Treatment Market Analysis, Opportunity and Forecast, 2016-2032
- 4.1. North America Hepatitis C Treatment Market Analysis, 2016-2021
- 4.2. North America Hepatitis C Treatment Market Opportunity and Forecast, 2023-2032
- 4.3. North America Hepatitis C Treatment Market Analysis, Opportunity and Forecast, By Treatment Type, 2016-2032
- 4.3.1. North America Hepatitis C Treatment Market Analysis by Treatment Type: Introduction
- 4.3.2. Market Size Absolute $ Opportunity Analysis and Forecast, By Treatment Type, 2016-2032
- 4.3.3. Direct-Acting Antivirals
- 4.3.4. Interferon-Based Therapy
- 4.3.5. Combination Therapy
- 4.4. North America Hepatitis C Treatment Market Analysis, Opportunity and Forecast, By Stage of Liver Disease, 2016-2032
- 4.4.1. North America Hepatitis C Treatment Market Analysis by Stage of Liver Disease: Introduction
- 4.4.2. Market Size Absolute $ Opportunity Analysis and Forecast, By Stage of Liver Disease, 2016-2032
- 4.4.3. Compensated Cirrhosis
- 4.4.4. Decompensated Cirrhosis
- 4.4.5. Liver Transplantation
- 4.5. North America Hepatitis C Treatment Market Analysis, Opportunity and Forecast, By End Users, 2016-2032
- 4.5.1. North America Hepatitis C Treatment Market Analysis by End Users: Introduction
- 4.5.2. Market Size Absolute $ Opportunity Analysis and Forecast, By End Users, 2016-2032
- 4.5.3. Hospitals
- 4.5.4. Specialty Clinics
- 4.5.5. Gastroenterology Clinics
- 4.5.6. Hepatology Clinics
- 4.5.7. Retail Pharmacies
- 4.6. North America Hepatitis C Treatment Market Analysis, Opportunity and Forecast, By Country , 2016-2032
- 4.6.1. North America Hepatitis C Treatment Market Analysis by Country : Introduction
- 4.6.2. Market Size Absolute $ Opportunity Analysis and Forecast, Country , 2016-2032
- 4.6.2.1. The US
- 4.6.2.2. Canada
- 4.6.2.3. Mexico
- 5. Western Europe Hepatitis C Treatment Market Analysis, Opportunity and Forecast, 2016-2032
- 5.1. Western Europe Hepatitis C Treatment Market Analysis, 2016-2021
- 5.2. Western Europe Hepatitis C Treatment Market Opportunity and Forecast, 2023-2032
- 5.3. Western Europe Hepatitis C Treatment Market Analysis, Opportunity and Forecast, By Treatment Type, 2016-2032
- 5.3.1. Western Europe Hepatitis C Treatment Market Analysis by Treatment Type: Introduction
- 5.3.2. Market Size Absolute $ Opportunity Analysis and Forecast, By Treatment Type, 2016-2032
- 5.3.3. Direct-Acting Antivirals
- 5.3.4. Interferon-Based Therapy
- 5.3.5. Combination Therapy
- 5.4. Western Europe Hepatitis C Treatment Market Analysis, Opportunity and Forecast, By Stage of Liver Disease, 2016-2032
- 5.4.1. Western Europe Hepatitis C Treatment Market Analysis by Stage of Liver Disease: Introduction
- 5.4.2. Market Size Absolute $ Opportunity Analysis and Forecast, By Stage of Liver Disease, 2016-2032
- 5.4.3. Compensated Cirrhosis
- 5.4.4. Decompensated Cirrhosis
- 5.4.5. Liver Transplantation
- 5.5. Western Europe Hepatitis C Treatment Market Analysis, Opportunity and Forecast, By End Users, 2016-2032
- 5.5.1. Western Europe Hepatitis C Treatment Market Analysis by End Users: Introduction
- 5.5.2. Market Size Absolute $ Opportunity Analysis and Forecast, By End Users, 2016-2032
- 5.5.3. Hospitals
- 5.5.4. Specialty Clinics
- 5.5.5. Gastroenterology Clinics
- 5.5.6. Hepatology Clinics
- 5.5.7. Retail Pharmacies
- 5.6. Western Europe Hepatitis C Treatment Market Analysis, Opportunity and Forecast, By Country , 2016-2032
- 5.6.1. Western Europe Hepatitis C Treatment Market Analysis by Country : Introduction
- 5.6.2. Market Size Absolute $ Opportunity Analysis and Forecast, Country , 2016-2032
- 5.6.2.1. Germany
- 5.6.2.2. France
- 5.6.2.3. The UK
- 5.6.2.4. Spain
- 5.6.2.5. Italy
- 5.6.2.6. Portugal
- 5.6.2.7. Ireland
- 5.6.2.8. Austria
- 5.6.2.9. Switzerland
- 5.6.2.10. Benelux
- 5.6.2.11. Nordic
- 5.6.2.12. Rest of Western Europe
- 6. Eastern Europe Hepatitis C Treatment Market Analysis, Opportunity and Forecast, 2016-2032
- 6.1. Eastern Europe Hepatitis C Treatment Market Analysis, 2016-2021
- 6.2. Eastern Europe Hepatitis C Treatment Market Opportunity and Forecast, 2023-2032
- 6.3. Eastern Europe Hepatitis C Treatment Market Analysis, Opportunity and Forecast, By Treatment Type, 2016-2032
- 6.3.1. Eastern Europe Hepatitis C Treatment Market Analysis by Treatment Type: Introduction
- 6.3.2. Market Size Absolute $ Opportunity Analysis and Forecast, By Treatment Type, 2016-2032
- 6.3.3. Direct-Acting Antivirals
- 6.3.4. Interferon-Based Therapy
- 6.3.5. Combination Therapy
- 6.4. Eastern Europe Hepatitis C Treatment Market Analysis, Opportunity and Forecast, By Stage of Liver Disease, 2016-2032
- 6.4.1. Eastern Europe Hepatitis C Treatment Market Analysis by Stage of Liver Disease: Introduction
- 6.4.2. Market Size Absolute $ Opportunity Analysis and Forecast, By Stage of Liver Disease, 2016-2032
- 6.4.3. Compensated Cirrhosis
- 6.4.4. Decompensated Cirrhosis
- 6.4.5. Liver Transplantation
- 6.5. Eastern Europe Hepatitis C Treatment Market Analysis, Opportunity and Forecast, By End Users, 2016-2032
- 6.5.1. Eastern Europe Hepatitis C Treatment Market Analysis by End Users: Introduction
- 6.5.2. Market Size Absolute $ Opportunity Analysis and Forecast, By End Users, 2016-2032
- 6.5.3. Hospitals
- 6.5.4. Specialty Clinics
- 6.5.5. Gastroenterology Clinics
- 6.5.6. Hepatology Clinics
- 6.5.7. Retail Pharmacies
- 6.6. Eastern Europe Hepatitis C Treatment Market Analysis, Opportunity and Forecast, By Country , 2016-2032
- 6.6.1. Eastern Europe Hepatitis C Treatment Market Analysis by Country : Introduction
- 6.6.2. Market Size Absolute $ Opportunity Analysis and Forecast, Country , 2016-2032
- 6.6.2.1. Russia
- 6.6.2.2. Poland
- 6.6.2.3. The Czech Republic
- 6.6.2.4. Greece
- 6.6.2.5. Rest of Eastern Europe
- 7. APAC Hepatitis C Treatment Market Analysis, Opportunity and Forecast, 2016-2032
- 7.1. APAC Hepatitis C Treatment Market Analysis, 2016-2021
- 7.2. APAC Hepatitis C Treatment Market Opportunity and Forecast, 2023-2032
- 7.3. APAC Hepatitis C Treatment Market Analysis, Opportunity and Forecast, By Treatment Type, 2016-2032
- 7.3.1. APAC Hepatitis C Treatment Market Analysis by Treatment Type: Introduction
- 7.3.2. Market Size Absolute $ Opportunity Analysis and Forecast, By Treatment Type, 2016-2032
- 7.3.3. Direct-Acting Antivirals
- 7.3.4. Interferon-Based Therapy
- 7.3.5. Combination Therapy
- 7.4. APAC Hepatitis C Treatment Market Analysis, Opportunity and Forecast, By Stage of Liver Disease, 2016-2032
- 7.4.1. APAC Hepatitis C Treatment Market Analysis by Stage of Liver Disease: Introduction
- 7.4.2. Market Size Absolute $ Opportunity Analysis and Forecast, By Stage of Liver Disease, 2016-2032
- 7.4.3. Compensated Cirrhosis
- 7.4.4. Decompensated Cirrhosis
- 7.4.5. Liver Transplantation
- 7.5. APAC Hepatitis C Treatment Market Analysis, Opportunity and Forecast, By End Users, 2016-2032
- 7.5.1. APAC Hepatitis C Treatment Market Analysis by End Users: Introduction
- 7.5.2. Market Size Absolute $ Opportunity Analysis and Forecast, By End Users, 2016-2032
- 7.5.3. Hospitals
- 7.5.4. Specialty Clinics
- 7.5.5. Gastroenterology Clinics
- 7.5.6. Hepatology Clinics
- 7.5.7. Retail Pharmacies
- 7.6. APAC Hepatitis C Treatment Market Analysis, Opportunity and Forecast, By Country , 2016-2032
- 7.6.1. APAC Hepatitis C Treatment Market Analysis by Country : Introduction
- 7.6.2. Market Size Absolute $ Opportunity Analysis and Forecast, Country , 2016-2032
- 7.6.2.1. China
- 7.6.2.2. Japan
- 7.6.2.3. South Korea
- 7.6.2.4. India
- 7.6.2.5. Australia & New Zeland
- 7.6.2.6. Indonesia
- 7.6.2.7. Malaysia
- 7.6.2.8. Philippines
- 7.6.2.9. Singapore
- 7.6.2.10. Thailand
- 7.6.2.11. Vietnam
- 7.6.2.12. Rest of APAC
- 8. Latin America Hepatitis C Treatment Market Analysis, Opportunity and Forecast, 2016-2032
- 8.1. Latin America Hepatitis C Treatment Market Analysis, 2016-2021
- 8.2. Latin America Hepatitis C Treatment Market Opportunity and Forecast, 2023-2032
- 8.3. Latin America Hepatitis C Treatment Market Analysis, Opportunity and Forecast, By Treatment Type, 2016-2032
- 8.3.1. Latin America Hepatitis C Treatment Market Analysis by Treatment Type: Introduction
- 8.3.2. Market Size Absolute $ Opportunity Analysis and Forecast, By Treatment Type, 2016-2032
- 8.3.3. Direct-Acting Antivirals
- 8.3.4. Interferon-Based Therapy
- 8.3.5. Combination Therapy
- 8.4. Latin America Hepatitis C Treatment Market Analysis, Opportunity and Forecast, By Stage of Liver Disease, 2016-2032
- 8.4.1. Latin America Hepatitis C Treatment Market Analysis by Stage of Liver Disease: Introduction
- 8.4.2. Market Size Absolute $ Opportunity Analysis and Forecast, By Stage of Liver Disease, 2016-2032
- 8.4.3. Compensated Cirrhosis
- 8.4.4. Decompensated Cirrhosis
- 8.4.5. Liver Transplantation
- 8.5. Latin America Hepatitis C Treatment Market Analysis, Opportunity and Forecast, By End Users, 2016-2032
- 8.5.1. Latin America Hepatitis C Treatment Market Analysis by End Users: Introduction
- 8.5.2. Market Size Absolute $ Opportunity Analysis and Forecast, By End Users, 2016-2032
- 8.5.3. Hospitals
- 8.5.4. Specialty Clinics
- 8.5.5. Gastroenterology Clinics
- 8.5.6. Hepatology Clinics
- 8.5.7. Retail Pharmacies
- 8.6. Latin America Hepatitis C Treatment Market Analysis, Opportunity and Forecast, By Country , 2016-2032
- 8.6.1. Latin America Hepatitis C Treatment Market Analysis by Country : Introduction
- 8.6.2. Market Size Absolute $ Opportunity Analysis and Forecast, Country , 2016-2032
- 8.6.2.1. Brazil
- 8.6.2.2. Colombia
- 8.6.2.3. Chile
- 8.6.2.4. Argentina
- 8.6.2.5. Costa Rica
- 8.6.2.6. Rest of Latin America
- 9. Middle East & Africa Hepatitis C Treatment Market Analysis, Opportunity and Forecast, 2016-2032
- 9.1. Middle East & Africa Hepatitis C Treatment Market Analysis, 2016-2021
- 9.2. Middle East & Africa Hepatitis C Treatment Market Opportunity and Forecast, 2023-2032
- 9.3. Middle East & Africa Hepatitis C Treatment Market Analysis, Opportunity and Forecast, By Treatment Type, 2016-2032
- 9.3.1. Middle East & Africa Hepatitis C Treatment Market Analysis by Treatment Type: Introduction
- 9.3.2. Market Size Absolute $ Opportunity Analysis and Forecast, By Treatment Type, 2016-2032
- 9.3.3. Direct-Acting Antivirals
- 9.3.4. Interferon-Based Therapy
- 9.3.5. Combination Therapy
- 9.4. Middle East & Africa Hepatitis C Treatment Market Analysis, Opportunity and Forecast, By Stage of Liver Disease, 2016-2032
- 9.4.1. Middle East & Africa Hepatitis C Treatment Market Analysis by Stage of Liver Disease: Introduction
- 9.4.2. Market Size Absolute $ Opportunity Analysis and Forecast, By Stage of Liver Disease, 2016-2032
- 9.4.3. Compensated Cirrhosis
- 9.4.4. Decompensated Cirrhosis
- 9.4.5. Liver Transplantation
- 9.5. Middle East & Africa Hepatitis C Treatment Market Analysis, Opportunity and Forecast, By End Users, 2016-2032
- 9.5.1. Middle East & Africa Hepatitis C Treatment Market Analysis by End Users: Introduction
- 9.5.2. Market Size Absolute $ Opportunity Analysis and Forecast, By End Users, 2016-2032
- 9.5.3. Hospitals
- 9.5.4. Specialty Clinics
- 9.5.5. Gastroenterology Clinics
- 9.5.6. Hepatology Clinics
- 9.5.7. Retail Pharmacies
- 9.6. Middle East & Africa Hepatitis C Treatment Market Analysis, Opportunity and Forecast, By Country , 2016-2032
- 9.6.1. Middle East & Africa Hepatitis C Treatment Market Analysis by Country : Introduction
- 9.6.2. Market Size Absolute $ Opportunity Analysis and Forecast, Country , 2016-2032
- 9.6.2.1. Algeria
- 9.6.2.2. Egypt
- 9.6.2.3. Israel
- 9.6.2.4. Kuwait
- 9.6.2.5. Nigeria
- 9.6.2.6. Saudi Arabia
- 9.6.2.7. South Africa
- 9.6.2.8. Turkey
- 9.6.2.9. The UAE
- 9.6.2.10. Rest of MEA
- 10. Global Hepatitis C Treatment Market Analysis, Opportunity and Forecast, By Region , 2016-2032
- 10.1. Global Hepatitis C Treatment Market Analysis by Region : Introduction
- 10.2. Market Size Absolute $ Opportunity Analysis and Forecast, By Region , 2016-2032
- 10.2.1. North America
- 10.2.2. Western Europe
- 10.2.3. Eastern Europe
- 10.2.4. APAC
- 10.2.5. Latin America
- 10.2.6. Middle East & Africa
- 11. Global Hepatitis C Treatment Market Competitive Landscape, Market Share Analysis, and Company Profiles
- 11.1. Market Share Analysis
- 11.2. Company Profiles
- 11.3. Bristol-Myers Squibb Company
- 11.3.1. Company Overview
- 11.3.2. Financial Highlights
- 11.3.3. Product Portfolio
- 11.3.4. SWOT Analysis
- 11.3.5. Key Strategies and Developments
- 11.4. AbbVie Inc.
- 11.4.1. Company Overview
- 11.4.2. Financial Highlights
- 11.4.3. Product Portfolio
- 11.4.4. SWOT Analysis
- 11.4.5. Key Strategies and Developments
- 11.5. Gilead Sciences Inc.
- 11.5.1. Company Overview
- 11.5.2. Financial Highlights
- 11.5.3. Product Portfolio
- 11.5.4. SWOT Analysis
- 11.5.5. Key Strategies and Developments
- 11.6. Merck & Co., Inc.
- 11.6.1. Company Overview
- 11.6.2. Financial Highlights
- 11.6.3. Product Portfolio
- 11.6.4. SWOT Analysis
- 11.6.5. Key Strategies and Developments
- 11.7. Pfizer Inc.
- 11.7.1. Company Overview
- 11.7.2. Financial Highlights
- 11.7.3. Product Portfolio
- 11.7.4. SWOT Analysis
- 11.7.5. Key Strategies and Developments
- 11.8. F. Hoffmann-La Roche Ltd.
- 11.8.1. Company Overview
- 11.8.2. Financial Highlights
- 11.8.3. Product Portfolio
- 11.8.4. SWOT Analysis
- 11.8.5. Key Strategies and Developments
- 11.9. Teva Pharmaceutical Industries Ltd.
- 11.9.1. Company Overview
- 11.9.2. Financial Highlights
- 11.9.3. Product Portfolio
- 11.9.4. SWOT Analysis
- 11.9.5. Key Strategies and Developments
- 11.10. Roche Holding AG
- 11.10.1. Company Overview
- 11.10.2. Financial Highlights
- 11.10.3. Product Portfolio
- 11.10.4. SWOT Analysis
- 11.10.5. Key Strategies and Developments
- 11.11. Mylan N.V.
- 11.11.1. Company Overview
- 11.11.2. Financial Highlights
- 11.11.3. Product Portfolio
- 11.11.4. SWOT Analysis
- 11.11.5. Key Strategies and Developments
- 11.12. Bayer AG
- 11.12.1. Company Overview
- 11.12.2. Financial Highlights
- 11.12.3. Product Portfolio
- 11.12.4. SWOT Analysis
- 11.12.5. Key Strategies and Developments
- 11.13.1. Company Overview
- 11.13.2. Financial Highlights
- 11.13.3. Product Portfolio
- 11.13.4. SWOT Analysis
- 11.13.5. Key Strategies and Developments
- 11.14. Sanofi S.A.
- 11.14.1. Company Overview
- 11.14.2. Financial Highlights
- 11.14.3. Product Portfolio
- 11.14.4. SWOT Analysis
- 11.14.5. Key Strategies and Developments
- 11.15. Janssen Pharmaceuticals Inc.
- 11.15.1. Company Overview
- 11.15.2. Financial Highlights
- 11.15.3. Product Portfolio
- 11.15.4. SWOT Analysis
- 11.15.5. Key Strategies and Developments
- 11.16. Eli Lilly and Company
- 11.16.1. Company Overview
- 11.16.2. Financial Highlights
- 11.16.3. Product Portfolio
- 11.16.4. SWOT Analysis
- 11.16.5. Key Strategies and Developments
- 11.17. AstraZeneca PLC
- 11.17.1. Company Overview
- 11.17.2. Financial Highlights
- 11.17.3. Product Portfolio
- 11.17.4. SWOT Analysis
- 11.17.5. Key Strategies and Developments
- 12. Assumptions and Acronyms
- 13. Research Methodology
- 14. Contact
- List of Figures
- Figure 1: Global Hepatitis C Treatment Market Revenue (US$ Mn) Market Share by Treatment Type in 2022
- Figure 2: Global Hepatitis C Treatment Market Attractiveness Analysis by Treatment Type, 2016-2032
- Figure 3: Global Hepatitis C Treatment Market Revenue (US$ Mn) Market Share by Stage of Liver Diseasein 2022
- Figure 4: Global Hepatitis C Treatment Market Attractiveness Analysis by Stage of Liver Disease, 2016-2032
- Figure 5: Global Hepatitis C Treatment Market Revenue (US$ Mn) Market Share by End Usersin 2022
- Figure 6: Global Hepatitis C Treatment Market Attractiveness Analysis by End Users, 2016-2032
- Figure 7: Global Hepatitis C Treatment Market Revenue (US$ Mn) Market Share by Region in 2022
- Figure 8: Global Hepatitis C Treatment Market Attractiveness Analysis by Region, 2016-2032
- Figure 9: Global Hepatitis C Treatment Market Revenue (US$ Mn) (2016-2032)
- Figure 10: Global Hepatitis C Treatment Market Revenue (US$ Mn) Comparison by Region (2016-2032)
- Figure 11: Global Hepatitis C Treatment Market Revenue (US$ Mn) Comparison by Treatment Type (2016-2032)
- Figure 12: Global Hepatitis C Treatment Market Revenue (US$ Mn) Comparison by Stage of Liver Disease (2016-2032)
- Figure 13: Global Hepatitis C Treatment Market Revenue (US$ Mn) Comparison by End Users (2016-2032)
- Figure 14: Global Hepatitis C Treatment Market Y-o-Y Growth Rate Comparison by Region (2016-2032)
- Figure 15: Global Hepatitis C Treatment Market Y-o-Y Growth Rate Comparison by Treatment Type (2016-2032)
- Figure 16: Global Hepatitis C Treatment Market Y-o-Y Growth Rate Comparison by Stage of Liver Disease (2016-2032)
- Figure 17: Global Hepatitis C Treatment Market Y-o-Y Growth Rate Comparison by End Users (2016-2032)
- Figure 18: Global Hepatitis C Treatment Market Share Comparison by Region (2016-2032)
- Figure 19: Global Hepatitis C Treatment Market Share Comparison by Treatment Type (2016-2032)
- Figure 20: Global Hepatitis C Treatment Market Share Comparison by Stage of Liver Disease (2016-2032)
- Figure 21: Global Hepatitis C Treatment Market Share Comparison by End Users (2016-2032)
- Figure 22: North America Hepatitis C Treatment Market Revenue (US$ Mn) Market Share by Treatment Typein 2022
- Figure 23: North America Hepatitis C Treatment Market Attractiveness Analysis by Treatment Type, 2016-2032
- Figure 24: North America Hepatitis C Treatment Market Revenue (US$ Mn) Market Share by Stage of Liver Diseasein 2022
- Figure 25: North America Hepatitis C Treatment Market Attractiveness Analysis by Stage of Liver Disease, 2016-2032
- Figure 26: North America Hepatitis C Treatment Market Revenue (US$ Mn) Market Share by End Usersin 2022
- Figure 27: North America Hepatitis C Treatment Market Attractiveness Analysis by End Users, 2016-2032
- Figure 28: North America Hepatitis C Treatment Market Revenue (US$ Mn) Market Share by Country in 2022
- Figure 29: North America Hepatitis C Treatment Market Attractiveness Analysis by Country, 2016-2032
- Figure 30: North America Hepatitis C Treatment Market Revenue (US$ Mn) (2016-2032)
- Figure 31: North America Hepatitis C Treatment Market Revenue (US$ Mn) Comparison by Country (2016-2032)
- Figure 32: North America Hepatitis C Treatment Market Revenue (US$ Mn) Comparison by Treatment Type (2016-2032)
- Figure 33: North America Hepatitis C Treatment Market Revenue (US$ Mn) Comparison by Stage of Liver Disease (2016-2032)
- Figure 34: North America Hepatitis C Treatment Market Revenue (US$ Mn) Comparison by End Users (2016-2032)
- Figure 35: North America Hepatitis C Treatment Market Y-o-Y Growth Rate Comparison by Country (2016-2032)
- Figure 36: North America Hepatitis C Treatment Market Y-o-Y Growth Rate Comparison by Treatment Type (2016-2032)
- Figure 37: North America Hepatitis C Treatment Market Y-o-Y Growth Rate Comparison by Stage of Liver Disease (2016-2032)
- Figure 38: North America Hepatitis C Treatment Market Y-o-Y Growth Rate Comparison by End Users (2016-2032)
- Figure 39: North America Hepatitis C Treatment Market Share Comparison by Country (2016-2032)
- Figure 40: North America Hepatitis C Treatment Market Share Comparison by Treatment Type (2016-2032)
- Figure 41: North America Hepatitis C Treatment Market Share Comparison by Stage of Liver Disease (2016-2032)
- Figure 42: North America Hepatitis C Treatment Market Share Comparison by End Users (2016-2032)
- Figure 43: Western Europe Hepatitis C Treatment Market Revenue (US$ Mn) Market Share by Treatment Typein 2022
- Figure 44: Western Europe Hepatitis C Treatment Market Attractiveness Analysis by Treatment Type, 2016-2032
- Figure 45: Western Europe Hepatitis C Treatment Market Revenue (US$ Mn) Market Share by Stage of Liver Diseasein 2022
- Figure 46: Western Europe Hepatitis C Treatment Market Attractiveness Analysis by Stage of Liver Disease, 2016-2032
- Figure 47: Western Europe Hepatitis C Treatment Market Revenue (US$ Mn) Market Share by End Usersin 2022
- Figure 48: Western Europe Hepatitis C Treatment Market Attractiveness Analysis by End Users, 2016-2032
- Figure 49: Western Europe Hepatitis C Treatment Market Revenue (US$ Mn) Market Share by Country in 2022
- Figure 50: Western Europe Hepatitis C Treatment Market Attractiveness Analysis by Country, 2016-2032
- Figure 51: Western Europe Hepatitis C Treatment Market Revenue (US$ Mn) (2016-2032)
- Figure 52: Western Europe Hepatitis C Treatment Market Revenue (US$ Mn) Comparison by Country (2016-2032)
- Figure 53: Western Europe Hepatitis C Treatment Market Revenue (US$ Mn) Comparison by Treatment Type (2016-2032)
- Figure 54: Western Europe Hepatitis C Treatment Market Revenue (US$ Mn) Comparison by Stage of Liver Disease (2016-2032)
- Figure 55: Western Europe Hepatitis C Treatment Market Revenue (US$ Mn) Comparison by End Users (2016-2032)
- Figure 56: Western Europe Hepatitis C Treatment Market Y-o-Y Growth Rate Comparison by Country (2016-2032)
- Figure 57: Western Europe Hepatitis C Treatment Market Y-o-Y Growth Rate Comparison by Treatment Type (2016-2032)
- Figure 58: Western Europe Hepatitis C Treatment Market Y-o-Y Growth Rate Comparison by Stage of Liver Disease (2016-2032)
- Figure 59: Western Europe Hepatitis C Treatment Market Y-o-Y Growth Rate Comparison by End Users (2016-2032)
- Figure 60: Western Europe Hepatitis C Treatment Market Share Comparison by Country (2016-2032)
- Figure 61: Western Europe Hepatitis C Treatment Market Share Comparison by Treatment Type (2016-2032)
- Figure 62: Western Europe Hepatitis C Treatment Market Share Comparison by Stage of Liver Disease (2016-2032)
- Figure 63: Western Europe Hepatitis C Treatment Market Share Comparison by End Users (2016-2032)
- Figure 64: Eastern Europe Hepatitis C Treatment Market Revenue (US$ Mn) Market Share by Treatment Typein 2022
- Figure 65: Eastern Europe Hepatitis C Treatment Market Attractiveness Analysis by Treatment Type, 2016-2032
- Figure 66: Eastern Europe Hepatitis C Treatment Market Revenue (US$ Mn) Market Share by Stage of Liver Diseasein 2022
- Figure 67: Eastern Europe Hepatitis C Treatment Market Attractiveness Analysis by Stage of Liver Disease, 2016-2032
- Figure 68: Eastern Europe Hepatitis C Treatment Market Revenue (US$ Mn) Market Share by End Usersin 2022
- Figure 69: Eastern Europe Hepatitis C Treatment Market Attractiveness Analysis by End Users, 2016-2032
- Figure 70: Eastern Europe Hepatitis C Treatment Market Revenue (US$ Mn) Market Share by Country in 2022
- Figure 71: Eastern Europe Hepatitis C Treatment Market Attractiveness Analysis by Country, 2016-2032
- Figure 72: Eastern Europe Hepatitis C Treatment Market Revenue (US$ Mn) (2016-2032)
- Figure 73: Eastern Europe Hepatitis C Treatment Market Revenue (US$ Mn) Comparison by Country (2016-2032)
- Figure 74: Eastern Europe Hepatitis C Treatment Market Revenue (US$ Mn) Comparison by Treatment Type (2016-2032)
- Figure 75: Eastern Europe Hepatitis C Treatment Market Revenue (US$ Mn) Comparison by Stage of Liver Disease (2016-2032)
- Figure 76: Eastern Europe Hepatitis C Treatment Market Revenue (US$ Mn) Comparison by End Users (2016-2032)
- Figure 77: Eastern Europe Hepatitis C Treatment Market Y-o-Y Growth Rate Comparison by Country (2016-2032)
- Figure 78: Eastern Europe Hepatitis C Treatment Market Y-o-Y Growth Rate Comparison by Treatment Type (2016-2032)
- Figure 79: Eastern Europe Hepatitis C Treatment Market Y-o-Y Growth Rate Comparison by Stage of Liver Disease (2016-2032)
- Figure 80: Eastern Europe Hepatitis C Treatment Market Y-o-Y Growth Rate Comparison by End Users (2016-2032)
- Figure 81: Eastern Europe Hepatitis C Treatment Market Share Comparison by Country (2016-2032)
- Figure 82: Eastern Europe Hepatitis C Treatment Market Share Comparison by Treatment Type (2016-2032)
- Figure 83: Eastern Europe Hepatitis C Treatment Market Share Comparison by Stage of Liver Disease (2016-2032)
- Figure 84: Eastern Europe Hepatitis C Treatment Market Share Comparison by End Users (2016-2032)
- Figure 85: APAC Hepatitis C Treatment Market Revenue (US$ Mn) Market Share by Treatment Typein 2022
- Figure 86: APAC Hepatitis C Treatment Market Attractiveness Analysis by Treatment Type, 2016-2032
- Figure 87: APAC Hepatitis C Treatment Market Revenue (US$ Mn) Market Share by Stage of Liver Diseasein 2022
- Figure 88: APAC Hepatitis C Treatment Market Attractiveness Analysis by Stage of Liver Disease, 2016-2032
- Figure 89: APAC Hepatitis C Treatment Market Revenue (US$ Mn) Market Share by End Usersin 2022
- Figure 90: APAC Hepatitis C Treatment Market Attractiveness Analysis by End Users, 2016-2032
- Figure 91: APAC Hepatitis C Treatment Market Revenue (US$ Mn) Market Share by Country in 2022
- Figure 92: APAC Hepatitis C Treatment Market Attractiveness Analysis by Country, 2016-2032
- Figure 93: APAC Hepatitis C Treatment Market Revenue (US$ Mn) (2016-2032)
- Figure 94: APAC Hepatitis C Treatment Market Revenue (US$ Mn) Comparison by Country (2016-2032)
- Figure 95: APAC Hepatitis C Treatment Market Revenue (US$ Mn) Comparison by Treatment Type (2016-2032)
- Figure 96: APAC Hepatitis C Treatment Market Revenue (US$ Mn) Comparison by Stage of Liver Disease (2016-2032)
- Figure 97: APAC Hepatitis C Treatment Market Revenue (US$ Mn) Comparison by End Users (2016-2032)
- Figure 98: APAC Hepatitis C Treatment Market Y-o-Y Growth Rate Comparison by Country (2016-2032)
- Figure 99: APAC Hepatitis C Treatment Market Y-o-Y Growth Rate Comparison by Treatment Type (2016-2032)
- Figure 100: APAC Hepatitis C Treatment Market Y-o-Y Growth Rate Comparison by Stage of Liver Disease (2016-2032)
- Figure 101: APAC Hepatitis C Treatment Market Y-o-Y Growth Rate Comparison by End Users (2016-2032)
- Figure 102: APAC Hepatitis C Treatment Market Share Comparison by Country (2016-2032)
- Figure 103: APAC Hepatitis C Treatment Market Share Comparison by Treatment Type (2016-2032)
- Figure 104: APAC Hepatitis C Treatment Market Share Comparison by Stage of Liver Disease (2016-2032)
- Figure 105: APAC Hepatitis C Treatment Market Share Comparison by End Users (2016-2032)
- Figure 106: Latin America Hepatitis C Treatment Market Revenue (US$ Mn) Market Share by Treatment Typein 2022
- Figure 107: Latin America Hepatitis C Treatment Market Attractiveness Analysis by Treatment Type, 2016-2032
- Figure 108: Latin America Hepatitis C Treatment Market Revenue (US$ Mn) Market Share by Stage of Liver Diseasein 2022
- Figure 109: Latin America Hepatitis C Treatment Market Attractiveness Analysis by Stage of Liver Disease, 2016-2032
- Figure 110: Latin America Hepatitis C Treatment Market Revenue (US$ Mn) Market Share by End Usersin 2022
- Figure 111: Latin America Hepatitis C Treatment Market Attractiveness Analysis by End Users, 2016-2032
- Figure 112: Latin America Hepatitis C Treatment Market Revenue (US$ Mn) Market Share by Country in 2022
- Figure 113: Latin America Hepatitis C Treatment Market Attractiveness Analysis by Country, 2016-2032
- Figure 114: Latin America Hepatitis C Treatment Market Revenue (US$ Mn) (2016-2032)
- Figure 115: Latin America Hepatitis C Treatment Market Revenue (US$ Mn) Comparison by Country (2016-2032)
- Figure 116: Latin America Hepatitis C Treatment Market Revenue (US$ Mn) Comparison by Treatment Type (2016-2032)
- Figure 117: Latin America Hepatitis C Treatment Market Revenue (US$ Mn) Comparison by Stage of Liver Disease (2016-2032)
- Figure 118: Latin America Hepatitis C Treatment Market Revenue (US$ Mn) Comparison by End Users (2016-2032)
- Figure 119: Latin America Hepatitis C Treatment Market Y-o-Y Growth Rate Comparison by Country (2016-2032)
- Figure 120: Latin America Hepatitis C Treatment Market Y-o-Y Growth Rate Comparison by Treatment Type (2016-2032)
- Figure 121: Latin America Hepatitis C Treatment Market Y-o-Y Growth Rate Comparison by Stage of Liver Disease (2016-2032)
- Figure 122: Latin America Hepatitis C Treatment Market Y-o-Y Growth Rate Comparison by End Users (2016-2032)
- Figure 123: Latin America Hepatitis C Treatment Market Share Comparison by Country (2016-2032)
- Figure 124: Latin America Hepatitis C Treatment Market Share Comparison by Treatment Type (2016-2032)
- Figure 125: Latin America Hepatitis C Treatment Market Share Comparison by Stage of Liver Disease (2016-2032)
- Figure 126: Latin America Hepatitis C Treatment Market Share Comparison by End Users (2016-2032)
- Figure 127: Middle East & Africa Hepatitis C Treatment Market Revenue (US$ Mn) Market Share by Treatment Typein 2022
- Figure 128: Middle East & Africa Hepatitis C Treatment Market Attractiveness Analysis by Treatment Type, 2016-2032
- Figure 129: Middle East & Africa Hepatitis C Treatment Market Revenue (US$ Mn) Market Share by Stage of Liver Diseasein 2022
- Figure 130: Middle East & Africa Hepatitis C Treatment Market Attractiveness Analysis by Stage of Liver Disease, 2016-2032
- Figure 131: Middle East & Africa Hepatitis C Treatment Market Revenue (US$ Mn) Market Share by End Usersin 2022
- Figure 132: Middle East & Africa Hepatitis C Treatment Market Attractiveness Analysis by End Users, 2016-2032
- Figure 133: Middle East & Africa Hepatitis C Treatment Market Revenue (US$ Mn) Market Share by Country in 2022
- Figure 134: Middle East & Africa Hepatitis C Treatment Market Attractiveness Analysis by Country, 2016-2032
- Figure 135: Middle East & Africa Hepatitis C Treatment Market Revenue (US$ Mn) (2016-2032)
- Figure 136: Middle East & Africa Hepatitis C Treatment Market Revenue (US$ Mn) Comparison by Country (2016-2032)
- Figure 137: Middle East & Africa Hepatitis C Treatment Market Revenue (US$ Mn) Comparison by Treatment Type (2016-2032)
- Figure 138: Middle East & Africa Hepatitis C Treatment Market Revenue (US$ Mn) Comparison by Stage of Liver Disease (2016-2032)
- Figure 139: Middle East & Africa Hepatitis C Treatment Market Revenue (US$ Mn) Comparison by End Users (2016-2032)
- Figure 140: Middle East & Africa Hepatitis C Treatment Market Y-o-Y Growth Rate Comparison by Country (2016-2032)
- Figure 141: Middle East & Africa Hepatitis C Treatment Market Y-o-Y Growth Rate Comparison by Treatment Type (2016-2032)
- Figure 142: Middle East & Africa Hepatitis C Treatment Market Y-o-Y Growth Rate Comparison by Stage of Liver Disease (2016-2032)
- Figure 143: Middle East & Africa Hepatitis C Treatment Market Y-o-Y Growth Rate Comparison by End Users (2016-2032)
- Figure 144: Middle East & Africa Hepatitis C Treatment Market Share Comparison by Country (2016-2032)
- Figure 145: Middle East & Africa Hepatitis C Treatment Market Share Comparison by Treatment Type (2016-2032)
- Figure 146: Middle East & Africa Hepatitis C Treatment Market Share Comparison by Stage of Liver Disease (2016-2032)
- Figure 147: Middle East & Africa Hepatitis C Treatment Market Share Comparison by End Users (2016-2032)
- List of Tables
- Table 1: Global Hepatitis C Treatment Market Comparison by Treatment Type (2016-2032)
- Table 2: Global Hepatitis C Treatment Market Comparison by Stage of Liver Disease (2016-2032)
- Table 3: Global Hepatitis C Treatment Market Comparison by End Users (2016-2032)
- Table 4: Global Hepatitis C Treatment Market Revenue (US$ Mn) Comparison by Region (2016-2032)
- Table 5: Global Hepatitis C Treatment Market Revenue (US$ Mn) (2016-2032)
- Table 6: Global Hepatitis C Treatment Market Revenue (US$ Mn) Comparison by Region (2016-2032)
- Table 7: Global Hepatitis C Treatment Market Revenue (US$ Mn) Comparison by Treatment Type (2016-2032)
- Table 8: Global Hepatitis C Treatment Market Revenue (US$ Mn) Comparison by Stage of Liver Disease (2016-2032)
- Table 9: Global Hepatitis C Treatment Market Revenue (US$ Mn) Comparison by End Users (2016-2032)
- Table 10: Global Hepatitis C Treatment Market Y-o-Y Growth Rate Comparison by Region (2016-2032)
- Table 11: Global Hepatitis C Treatment Market Y-o-Y Growth Rate Comparison by Treatment Type (2016-2032)
- Table 12: Global Hepatitis C Treatment Market Y-o-Y Growth Rate Comparison by Stage of Liver Disease (2016-2032)
- Table 13: Global Hepatitis C Treatment Market Y-o-Y Growth Rate Comparison by End Users (2016-2032)
- Table 14: Global Hepatitis C Treatment Market Share Comparison by Region (2016-2032)
- Table 15: Global Hepatitis C Treatment Market Share Comparison by Treatment Type (2016-2032)
- Table 16: Global Hepatitis C Treatment Market Share Comparison by Stage of Liver Disease (2016-2032)
- Table 17: Global Hepatitis C Treatment Market Share Comparison by End Users (2016-2032)
- Table 18: North America Hepatitis C Treatment Market Comparison by Stage of Liver Disease (2016-2032)
- Table 19: North America Hepatitis C Treatment Market Comparison by End Users (2016-2032)
- Table 20: North America Hepatitis C Treatment Market Revenue (US$ Mn) Comparison by Country (2016-2032)
- Table 21: North America Hepatitis C Treatment Market Revenue (US$ Mn) (2016-2032)
- Table 22: North America Hepatitis C Treatment Market Revenue (US$ Mn) Comparison by Country (2016-2032)
- Table 23: North America Hepatitis C Treatment Market Revenue (US$ Mn) Comparison by Treatment Type (2016-2032)
- Table 24: North America Hepatitis C Treatment Market Revenue (US$ Mn) Comparison by Stage of Liver Disease (2016-2032)
- Table 25: North America Hepatitis C Treatment Market Revenue (US$ Mn) Comparison by End Users (2016-2032)
- Table 26: North America Hepatitis C Treatment Market Y-o-Y Growth Rate Comparison by Country (2016-2032)
- Table 27: North America Hepatitis C Treatment Market Y-o-Y Growth Rate Comparison by Treatment Type (2016-2032)
- Table 28: North America Hepatitis C Treatment Market Y-o-Y Growth Rate Comparison by Stage of Liver Disease (2016-2032)
- Table 29: North America Hepatitis C Treatment Market Y-o-Y Growth Rate Comparison by End Users (2016-2032)
- Table 30: North America Hepatitis C Treatment Market Share Comparison by Country (2016-2032)
- Table 31: North America Hepatitis C Treatment Market Share Comparison by Treatment Type (2016-2032)
- Table 32: North America Hepatitis C Treatment Market Share Comparison by Stage of Liver Disease (2016-2032)
- Table 33: North America Hepatitis C Treatment Market Share Comparison by End Users (2016-2032)
- Table 34: Western Europe Hepatitis C Treatment Market Comparison by Treatment Type (2016-2032)
- Table 35: Western Europe Hepatitis C Treatment Market Comparison by Stage of Liver Disease (2016-2032)
- Table 36: Western Europe Hepatitis C Treatment Market Comparison by End Users (2016-2032)
- Table 37: Western Europe Hepatitis C Treatment Market Revenue (US$ Mn) Comparison by Country (2016-2032)
- Table 38: Western Europe Hepatitis C Treatment Market Revenue (US$ Mn) (2016-2032)
- Table 39: Western Europe Hepatitis C Treatment Market Revenue (US$ Mn) Comparison by Country (2016-2032)
- Table 40: Western Europe Hepatitis C Treatment Market Revenue (US$ Mn) Comparison by Treatment Type (2016-2032)
- Table 41: Western Europe Hepatitis C Treatment Market Revenue (US$ Mn) Comparison by Stage of Liver Disease (2016-2032)
- Table 42: Western Europe Hepatitis C Treatment Market Revenue (US$ Mn) Comparison by End Users (2016-2032)
- Table 43: Western Europe Hepatitis C Treatment Market Y-o-Y Growth Rate Comparison by Country (2016-2032)
- Table 44: Western Europe Hepatitis C Treatment Market Y-o-Y Growth Rate Comparison by Treatment Type (2016-2032)
- Table 45: Western Europe Hepatitis C Treatment Market Y-o-Y Growth Rate Comparison by Stage of Liver Disease (2016-2032)
- Table 46: Western Europe Hepatitis C Treatment Market Y-o-Y Growth Rate Comparison by End Users (2016-2032)
- Table 47: Western Europe Hepatitis C Treatment Market Share Comparison by Country (2016-2032)
- Table 48: Western Europe Hepatitis C Treatment Market Share Comparison by Treatment Type (2016-2032)
- Table 49: Western Europe Hepatitis C Treatment Market Share Comparison by Stage of Liver Disease (2016-2032)
- Table 50: Western Europe Hepatitis C Treatment Market Share Comparison by End Users (2016-2032)
- Table 51: Eastern Europe Hepatitis C Treatment Market Comparison by Treatment Type (2016-2032)
- Table 52: Eastern Europe Hepatitis C Treatment Market Comparison by Stage of Liver Disease (2016-2032)
- Table 53: Eastern Europe Hepatitis C Treatment Market Comparison by End Users (2016-2032)
- Table 54: Eastern Europe Hepatitis C Treatment Market Revenue (US$ Mn) Comparison by Country (2016-2032)
- Table 55: Eastern Europe Hepatitis C Treatment Market Revenue (US$ Mn) (2016-2032)
- Table 56: Eastern Europe Hepatitis C Treatment Market Revenue (US$ Mn) Comparison by Country (2016-2032)
- Table 57: Eastern Europe Hepatitis C Treatment Market Revenue (US$ Mn) Comparison by Treatment Type (2016-2032)
- Table 58: Eastern Europe Hepatitis C Treatment Market Revenue (US$ Mn) Comparison by Stage of Liver Disease (2016-2032)
- Table 59: Eastern Europe Hepatitis C Treatment Market Revenue (US$ Mn) Comparison by End Users (2016-2032)
- Table 60: Eastern Europe Hepatitis C Treatment Market Y-o-Y Growth Rate Comparison by Country (2016-2032)
- Table 61: Eastern Europe Hepatitis C Treatment Market Y-o-Y Growth Rate Comparison by Treatment Type (2016-2032)
- Table 62: Eastern Europe Hepatitis C Treatment Market Y-o-Y Growth Rate Comparison by Stage of Liver Disease (2016-2032)
- Table 63: Eastern Europe Hepatitis C Treatment Market Y-o-Y Growth Rate Comparison by End Users (2016-2032)
- Table 64: Eastern Europe Hepatitis C Treatment Market Share Comparison by Country (2016-2032)
- Table 65: Eastern Europe Hepatitis C Treatment Market Share Comparison by Treatment Type (2016-2032)
- Table 66: Eastern Europe Hepatitis C Treatment Market Share Comparison by Stage of Liver Disease (2016-2032)
- Table 67: Eastern Europe Hepatitis C Treatment Market Share Comparison by End Users (2016-2032)
- Table 68: APAC Hepatitis C Treatment Market Comparison by Treatment Type (2016-2032)
- Table 69: APAC Hepatitis C Treatment Market Comparison by Stage of Liver Disease (2016-2032)
- Table 70: APAC Hepatitis C Treatment Market Comparison by End Users (2016-2032)
- Table 71: APAC Hepatitis C Treatment Market Revenue (US$ Mn) Comparison by Country (2016-2032)
- Table 72: APAC Hepatitis C Treatment Market Revenue (US$ Mn) (2016-2032)
- Table 73: APAC Hepatitis C Treatment Market Revenue (US$ Mn) Comparison by Country (2016-2032)
- Table 74: APAC Hepatitis C Treatment Market Revenue (US$ Mn) Comparison by Treatment Type (2016-2032)
- Table 75: APAC Hepatitis C Treatment Market Revenue (US$ Mn) Comparison by Stage of Liver Disease (2016-2032)
- Table 76: APAC Hepatitis C Treatment Market Revenue (US$ Mn) Comparison by End Users (2016-2032)
- Table 77: APAC Hepatitis C Treatment Market Y-o-Y Growth Rate Comparison by Country (2016-2032)
- Table 78: APAC Hepatitis C Treatment Market Y-o-Y Growth Rate Comparison by Treatment Type (2016-2032)
- Table 79: APAC Hepatitis C Treatment Market Y-o-Y Growth Rate Comparison by Stage of Liver Disease (2016-2032)
- Table 80: APAC Hepatitis C Treatment Market Y-o-Y Growth Rate Comparison by End Users (2016-2032)
- Table 81: APAC Hepatitis C Treatment Market Share Comparison by Country (2016-2032)
- Table 82: APAC Hepatitis C Treatment Market Share Comparison by Treatment Type (2016-2032)
- Table 83: APAC Hepatitis C Treatment Market Share Comparison by Stage of Liver Disease (2016-2032)
- Table 84: APAC Hepatitis C Treatment Market Share Comparison by End Users (2016-2032)
- Table 85: Latin America Hepatitis C Treatment Market Comparison by Treatment Type (2016-2032)
- Table 86: Latin America Hepatitis C Treatment Market Comparison by Stage of Liver Disease (2016-2032)
- Table 87: Latin America Hepatitis C Treatment Market Comparison by End Users (2016-2032)
- Table 88: Latin America Hepatitis C Treatment Market Revenue (US$ Mn) Comparison by Country (2016-2032)
- Table 89: Latin America Hepatitis C Treatment Market Revenue (US$ Mn) (2016-2032)
- Table 90: Latin America Hepatitis C Treatment Market Revenue (US$ Mn) Comparison by Country (2016-2032)
- Table 91: Latin America Hepatitis C Treatment Market Revenue (US$ Mn) Comparison by Treatment Type (2016-2032)
- Table 92: Latin America Hepatitis C Treatment Market Revenue (US$ Mn) Comparison by Stage of Liver Disease (2016-2032)
- Table 93: Latin America Hepatitis C Treatment Market Revenue (US$ Mn) Comparison by End Users (2016-2032)
- Table 94: Latin America Hepatitis C Treatment Market Y-o-Y Growth Rate Comparison by Country (2016-2032)
- Table 95: Latin America Hepatitis C Treatment Market Y-o-Y Growth Rate Comparison by Treatment Type (2016-2032)
- Table 96: Latin America Hepatitis C Treatment Market Y-o-Y Growth Rate Comparison by Stage of Liver Disease (2016-2032)
- Table 97: Latin America Hepatitis C Treatment Market Y-o-Y Growth Rate Comparison by End Users (2016-2032)
- Table 98: Latin America Hepatitis C Treatment Market Share Comparison by Country (2016-2032)
- Table 99: Latin America Hepatitis C Treatment Market Share Comparison by Treatment Type (2016-2032)
- Table 100: Latin America Hepatitis C Treatment Market Share Comparison by Stage of Liver Disease (2016-2032)
- Table 101: Latin America Hepatitis C Treatment Market Share Comparison by End Users (2016-2032)
- Table 102: Middle East & Africa Hepatitis C Treatment Market Comparison by Treatment Type (2016-2032)
- Table 103: Middle East & Africa Hepatitis C Treatment Market Comparison by Stage of Liver Disease (2016-2032)
- Table 104: Middle East & Africa Hepatitis C Treatment Market Comparison by End Users (2016-2032)
- Table 105: Middle East & Africa Hepatitis C Treatment Market Revenue (US$ Mn) Comparison by Country (2016-2032)
- Table 106: Middle East & Africa Hepatitis C Treatment Market Revenue (US$ Mn) (2016-2032)
- Table 107: Middle East & Africa Hepatitis C Treatment Market Revenue (US$ Mn) Comparison by Country (2016-2032)
- Table 108: Middle East & Africa Hepatitis C Treatment Market Revenue (US$ Mn) Comparison by Treatment Type (2016-2032)
- Table 109: Middle East & Africa Hepatitis C Treatment Market Revenue (US$ Mn) Comparison by Stage of Liver Disease (2016-2032)
- Table 110: Middle East & Africa Hepatitis C Treatment Market Revenue (US$ Mn) Comparison by End Users (2016-2032)
- Table 111: Middle East & Africa Hepatitis C Treatment Market Y-o-Y Growth Rate Comparison by Country (2016-2032)
- Table 112: Middle East & Africa Hepatitis C Treatment Market Y-o-Y Growth Rate Comparison by Treatment Type (2016-2032)
- Table 113: Middle East & Africa Hepatitis C Treatment Market Y-o-Y Growth Rate Comparison by Stage of Liver Disease (2016-2032)
- Table 114: Middle East & Africa Hepatitis C Treatment Market Y-o-Y Growth Rate Comparison by End Users (2016-2032)
- Table 115: Middle East & Africa Hepatitis C Treatment Market Share Comparison by Country (2016-2032)
- Table 116: Middle East & Africa Hepatitis C Treatment Market Share Comparison by Treatment Type (2016-2032)
- Table 117: Middle East & Africa Hepatitis C Treatment Market Share Comparison by Stage of Liver Disease (2016-2032)
- Table 118: Middle East & Africa Hepatitis C Treatment Market Share Comparison by End Users (2016-2032)
- 1. Executive Summary
-
- Bristol-Myers Squibb Company
- AbbVie Inc.
- Gilead Sciences Inc.
- Merck & Co., Inc.
- Pfizer Inc.
- F. Hoffmann-La Roche Ltd.
- Teva Pharmaceutical Industries Ltd.
- Roche Holding AG
- Mylan N.V.
- Bayer AG
- Sanofi S.A.
- Vertex Pharmaceuticals Inc.
- Janssen Pharmaceuticals Inc.
- Eli Lilly and Company
- AstraZeneca PLC
Our Clients


View Our Licence Options
