
Global Hardware As A Service Market By Hardware Model(Desktop as a Service,Device as a Service,Infrastructure as a Service ,Platform as a Service), By Enterprise Size(Large Enterprises, Small and Medium Enterprises), By Deployment Model(Cloud, On-premise), By End User(IT and Telecommunication, BFSI, Healthcare), By Region And Companies - Industry Segment Outlook, Market Assessment, Competition Scenario, Trends, And Forecast 2024-2033
-
44657
-
April 2024
-
300
-


-
This report was compiled by Vishwa Gaul Vishwa is an experienced market research and consulting professional with over 8 years of expertise in the ICT industry, contributing to over 700 reports across telecommunications, software, hardware, and digital solutions. Correspondence Team Lead- ICT Linkedin | Detailed Market research Methodology Our methodology involves a mix of primary research, including interviews with leading mental health experts, and secondary research from reputable medical journals and databases. View Detailed Methodology Page
-
Quick Navigation
Report Overview
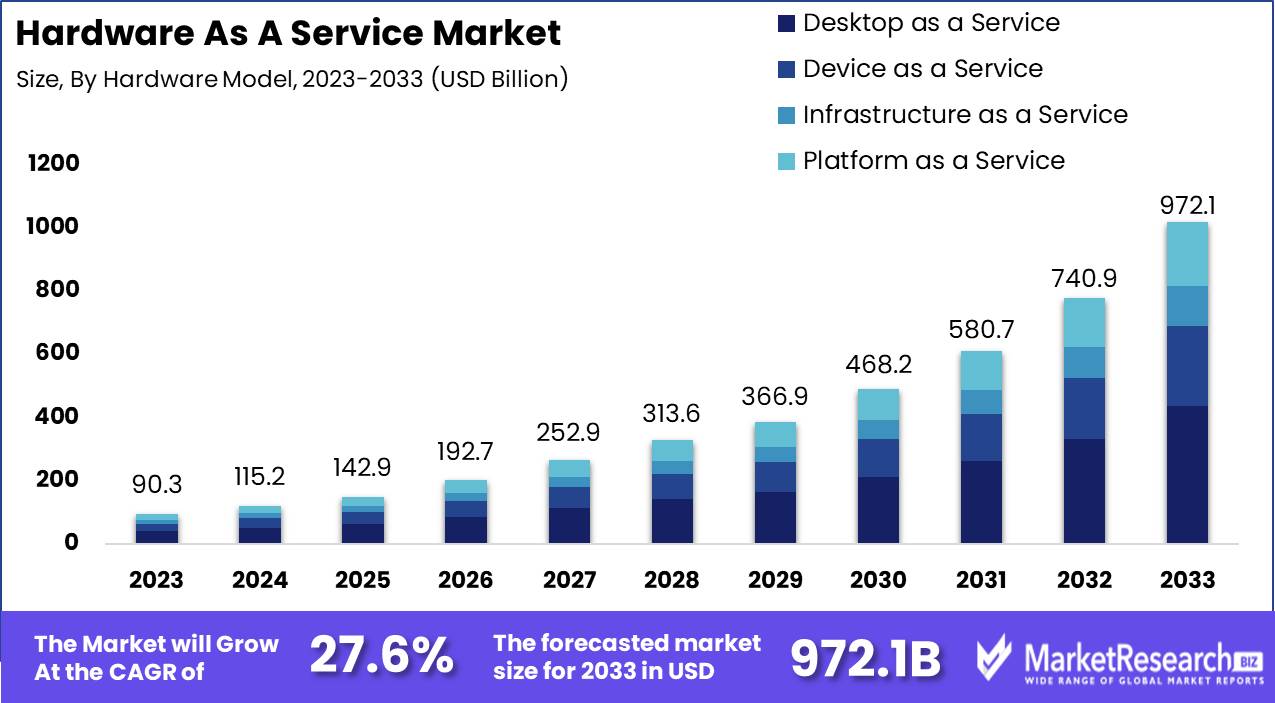
The Global Hardware As A Service Market was valued at USD 90.3 billion in 2023. It is expected to reach USD 972.1 billion by 2033, with a CAGR of 27.6% during the forecast period from 2024 to 2033.
The Hardware as a Service (HaaS) market encompasses a business model where firms provide hardware, combined with managed services, on a subscription basis. This model enables clients to access and utilize the latest technological infrastructure without the significant capital expenditure associated with purchasing and maintaining hardware. Key benefits include cost predictability, scalability, and reduced IT workload, which aligns with strategic business objectives.
The market appeals to organizations prioritizing operational efficiency and technological agility. As such, it holds particular relevance for Product Managers seeking innovative solutions to enhance competitive advantage while managing financial outlays effectively.
The Hardware as a Service (HaaS) market is undergoing a transformative growth phase, driven by an escalating demand for scalable and flexible hardware solutions across various sectors, including transport and digital infrastructure. The Infrastructure Monitor Report 2023 highlights a robust expansion in the broader infrastructure sector, which indirectly supports the proliferation of HaaS offerings. In 2022, the infrastructure market observed an 18% increase in the number of transactions, totaling 1,292. This surge was accompanied by a significant rise in the value of investments, indicating an increase in the average transaction size—a reflection of intensified investments in sectors that commonly require substantial hardware inputs.
In the secondary market for infrastructure, a notable 16% growth was recorded, with the total reaching USD 1 trillion across 1,892 transactions. This growth trajectory was prominently fueled by a 37% increase in acquisitions, amounting to USD 569 billion and accounting for 54% of the total secondary infrastructure investment. Such trends underscore a vibrant market environment for HaaS, as increased infrastructure investments necessitate advanced hardware systems that can be efficiently integrated and managed.
This market dynamics suggest that HaaS providers are well-positioned to leverage these expanding investment patterns. By offering cost-effective, managed hardware solutions, HaaS companies can cater to the growing needs of large-scale infrastructure projects, thereby embedding themselves as crucial enablers in the digital and transport sectors. As this market continues to evolve, the strategic positioning of HaaS offerings in alignment with infrastructure growth will be pivotal in realizing long-term success.
Key Takeaways
- Market Growth: The Global Hardware As A Service Market was valued at USD 90.3 billion in 2023. It is expected to reach USD 972.1 billion by 2033, with a CAGR of 27.6% during the forecast period from 2024 to 2033.
- By Hardware Model: Desktop as a Service dominates hardware model preferences at 45%.
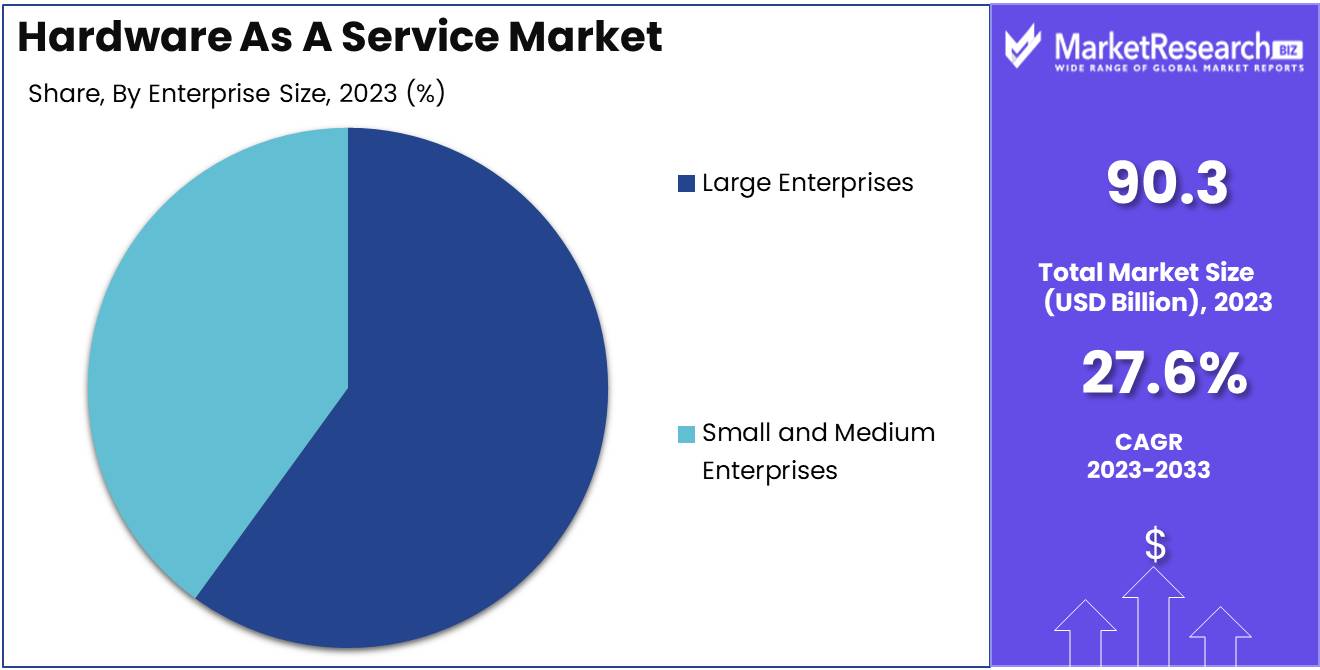
- By Enterprise Size: Large enterprises lead adoption, constituting 65% of users.
- By Deployment Model: Cloud deployment prevails, capturing 65% of the market.
- By End User: IT and telecommunication sectors command 55% of end users.
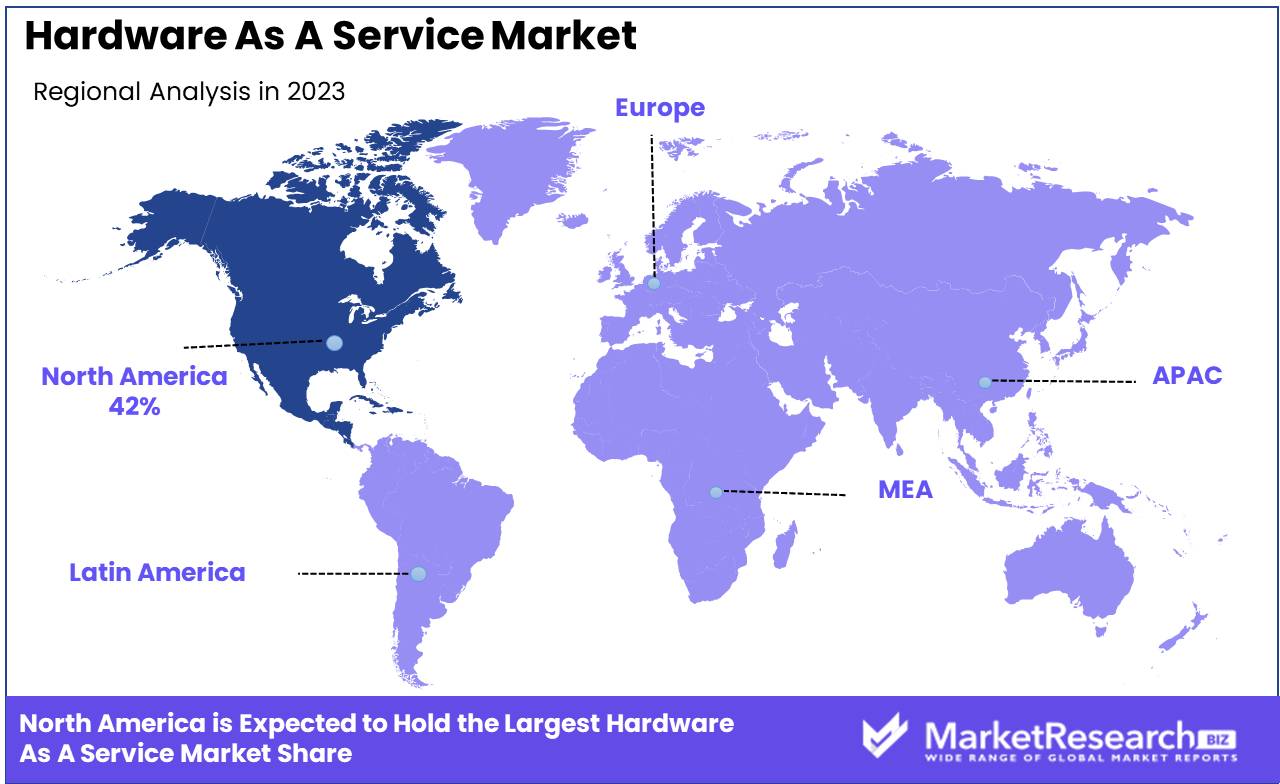
- Regional Dominance: North America holds 42% of the global Hardware as a Service market.
- Growth Opportunity: In 2023, the Hardware as a Service (HaaS) market is poised for growth, driven by its scalability, flexibility, and cost-effectiveness, appealing especially to enterprises and SMEs undergoing digital transformations.
Driving factors
Advancements in Artificial Intelligence (AI) and Machine Learning (ML) Technologies
The integration of Artificial Intelligence (AI) and Machine Learning (ML) into hardware solutions is transforming the Hardware as a Service (HaaS) market. These technologies enable more efficient hardware operations, predictive maintenance, and enhanced performance analytics, crucial for optimizing service delivery.
By leveraging AI and ML, HaaS providers can offer personalized hardware configurations that adapt to real-time data inputs, significantly improving user experience and operational efficiency. This adaptation not only attracts customers seeking cutting-edge technology solutions but also drives market growth by demonstrating increased value through advanced analytics capabilities.
Increased Demand for Smart Devices and Automation in Various Industries
As industries increasingly embrace digital transformation, the demand for smart devices and automation has escalated. This trend is profoundly impacting the HaaS market by expanding its scope beyond traditional IT hardware to include smart appliances and automated systems across sectors such as healthcare, manufacturing, and retail.
The surge in smart device integration necessitates ongoing hardware updates and management, which HaaS providers are uniquely positioned to supply. This not only ensures a continuous revenue stream from hardware upgrades and leases but also from the services required to manage these increasingly complex systems.
Growing Need for Data Storage and Management
In today's data-driven landscape, the exponential growth in data generation across all sectors heightens the demand for robust data storage and management solutions. HaaS models are particularly well-suited to meet this need by providing scalable hardware resources that can adapt to the evolving demands of data-intensive applications.
By offering hardware that supports substantial data storage and efficient data management, HaaS providers ensure that businesses can leverage the latest storage technologies without the associated capital expenditures, thereby facilitating market growth through cost-effective, flexible service offerings.
Restraining Factors
Limited Understanding and Adoption in Certain Industries
The growth of the Hardware as a Service (HaaS) market is significantly hindered by a limited understanding and adoption among certain industries. Traditional sectors such as small-scale manufacturing and older service industries often exhibit reluctance towards transitioning to HaaS models due to unfamiliarity with the concept and perceived complexities in implementation.
This hesitation is compounded by concerns over the return on investment and the disruption of established processes. The lack of industry-specific solutions from HaaS providers can exacerbate this issue, leading to slower market penetration and limited growth within these sectors. Overcoming this barrier requires targeted educational initiatives and the development of tailored HaaS offerings that address specific industry needs and concerns.
Security Concerns and Data Privacy Issues
Security vulnerabilities and data privacy concerns present significant obstacles to the adoption of the HaaS model. As hardware systems increasingly connect to the internet and handle sensitive data, they become prime targets for cyber-attacks. The fear of data breaches and the potential legal and financial repercussions hinder many organizations from adopting HaaS solutions.
According to industry surveys, security concerns are among the top reasons companies hesitate to transition to cloud-based and as-a-service models. Providers must invest heavily in robust security measures and privacy protocols to mitigate these fears and enhance trust among potential customers, thus encouraging wider adoption of HaaS.
By Hardware Model Analysis
In Desktop as a Service, hardware model dominance stands at 45%, emphasizing its growing significance.
In 2023, Desktop as a Service held a dominant market position in the "By Hardware Model" segment of the Hardware as a Service (HaaS) market, capturing more than 45% of the market share. This segment includes various models such as Desktop as a Service, Device as a Service, Infrastructure as a Service, and Platform as a Service.
The robust growth of Desktop as a Service can be attributed to its cost-effectiveness and scalability, offering businesses flexible computing solutions without the heavy upfront costs associated with physical hardware. Enterprises are increasingly adopting this model to enhance their operational efficiency and to reduce the burden of maintaining and updating physical desktop environments.
Device as a Service also showed significant traction, providing companies with the advantage of managing their device lifecycle and reducing the complexity associated with the procurement and management of workplace technology. This service model has been particularly beneficial for organizations looking to streamline operations and focus on core business functions.
Infrastructure as a Service and Platform as a Service has also contributed to the expansion of the HaaS market. These models provide essential back-end services that are critical for cloud computing, including data storage, networking, and servers, which are crucial for supporting the growing demand for online services and applications.
By Enterprise Size Analysis
Large enterprises lead adoption, comprising 65% of users in this realm.
In 2023, Large Enterprises held a dominant market position in the "By Enterprise Size" segment of the Hardware as a Service (HaaS) market, capturing more than 65% of the market share. This segment includes two classifications: Large Enterprises and Small and Medium Enterprises (SMEs).
The substantial share held by Large Enterprises is primarily due to their higher capacity for investment and greater scalability needs, which make the HaaS model particularly attractive. Large organizations often require robust IT infrastructure to support extensive operational demands and customer bases. The HaaS model offers them a way to access the latest hardware and technologies without the associated capital expenditure, thus enabling more predictable budgeting and improved cost management.
On the other hand, Small and Medium Enterprises also benefit from the HaaS model, though they represent a smaller portion of the market share. For SMEs, HaaS provides an opportunity to leverage advanced technologies that might otherwise be inaccessible due to financial constraints. It allows these smaller enterprises to compete more effectively with larger players by enabling technological parity, typically with flexible pricing models suited to their lesser scale.
By Deployment Model Analysis
Cloud deployment prevails with a commanding 65% share, reflecting its scalability and flexibility.
In 2023, Cloud held a dominant market position in the "By Deployment Model" segment of the Hardware as a Service (HaaS) market, capturing more than 65% of the market share. This segment includes two key deployment models: Cloud and On-premise.
The predominant position of Cloud deployment can be largely attributed to its scalability, flexibility, and cost-effectiveness, which are particularly advantageous for businesses looking to adapt to rapidly changing technological landscapes. Cloud-based HaaS allows organizations to access and manage hardware resources over the Internet, eliminating the need for significant capital investments in physical infrastructure. This model supports remote work configurations and enables businesses to easily scale their operations up or down based on current needs, a critical capability in today’s dynamic market environment.
Meanwhile, the On-premise model continues to be relevant, particularly for organizations that require greater control over their hardware and data due to security concerns or regulatory compliance requirements. However, the higher upfront costs and the need for ongoing maintenance and updates make this model less attractive compared to the Cloud.
The Cloud deployment model’s share is expected to grow even further as more businesses move towards digitalization and adopt cloud-first strategies. This shift is driven by the need for greater operational agility and the potential for reduced IT expenditures. As the market evolves, Cloud-based HaaS solutions are poised to play a pivotal role in enabling enterprises to leverage advanced technologies while maintaining flexibility in their IT spending.
By End User Analysis
IT and telecommunication sectors constitute 55% of end users, indicating their reliance on digital infrastructure.
In 2023, IT and Telecommunication held a dominant market position in the "By End User" segment of the Hardware as a Service (HaaS) market, capturing more than 55% of the market share. This segment prominently features three key industries: IT and Telecommunication, BFSI (Banking, Financial Services, and Insurance), and Healthcare.
The commanding lead of the IT and telecommunications sector can be attributed to its inherent need for robust, scalable, and high-performing hardware solutions to manage vast amounts of data and maintain uninterrupted services. The HaaS model is particularly appealing in this sector because it offers the ability to quickly adapt to technological advancements and fluctuating demands without significant capital expenditure. This flexibility not only enhances operational efficiency but also drives innovation within the sector.
The BFSI sector also significantly integrates HaaS solutions to ensure enhanced security and compliance with stringent regulatory requirements while managing large-scale consumer data and complex transactions. Meanwhile, the Healthcare sector leverages HaaS to enhance patient care through better data management and more advanced medical technology, which is critical for diagnostics and treatment.
As businesses in IT and Telecommunication continue to expand their infrastructure to support increasing data traffic and innovative communication solutions, the demand for HaaS is expected to grow. The model's scalability and cost-effectiveness will further solidify its position as a preferred choice for companies aiming to remain competitive in a technologically evolving landscape. Thus, the HaaS market is poised for continued expansion across these key sectors, driven by the ongoing digital transformation and increasing reliance on high-performance computing solutions.
Key Market Segments
By Hardware Model
- Desktop as a Service
- Device as a Service
- Infrastructure as a Service
- Platform as a Service
By Enterprise Size
- Large Enterprises
- Small and Medium Enterprises
By Deployment Model
- Cloud
- On-premise
By End User
- IT and Telecommunication
- BFSI
- Healthcare
Growth Opportunity
Scalability and Flexibility Demand
In 2023, the global Hardware as a Service (HaaS) market is anticipated to experience significant growth driven by increasing demands for scalability and flexibility in corporate IT environments. Organizations are actively seeking solutions that allow them to scale their hardware resources dynamically in response to fluctuating business requirements. The HaaS model addresses this need by offering customizable hardware solutions that can be scaled up or down based on operational demands, without necessitating substantial upfront capital expenditure.
This model not only facilitates greater operational agility but also ensures that businesses can rapidly adapt to changing market conditions and technological advancements. The growth of the market can thus be attributed to the increasing recognition of these benefits among enterprises, particularly those undergoing digital transformation initiatives.
Cost-Effective Hardware Solutions
Economic considerations continue to propel the adoption of the Hardware as a Service model. By transitioning to HaaS, companies can convert large fixed costs into more manageable variable expenses. This shift is particularly advantageous for small to medium-sized enterprises (SMEs) that may lack the financial resources to invest in expensive hardware upfront.
The HaaS model offers a predictable expense structure, often including maintenance, updates, and replacements, thereby reducing the total cost of ownership and eliminating concerns related to hardware obsolescence. The cost-effectiveness of HaaS is further enhanced by the potential for customized service packages, which align precisely with specific business needs, ensuring that organizations pay only for the hardware capabilities they require. This strategic financial flexibility is a key factor driving market expansion in 2023.
Latest Trends
Security Enhancements for Hardware Infrastructure
The global Hardware as a Service (HaaS) market in 2023 is witnessing a pronounced emphasis on security enhancements for hardware infrastructure. As businesses increasingly rely on digital platforms and cloud-based solutions, the necessity for robust hardware security measures becomes paramount. Service providers are enhancing their offerings by integrating advanced security protocols directly into their hardware services, which include real-time threat detection systems, hardware-based encryption, and multi-factor authentication solutions.
These enhancements are crucial in safeguarding sensitive data and ensuring compliance with global data protection regulations. The proactive incorporation of these security measures within the HaaS model significantly increases its attractiveness to sectors with stringent security requirements, such as finance and healthcare. Consequently, the market is observing a heightened adoption rate as confidence in the security capabilities of HaaS solutions strengthens.
Increased Demand for GPU-as-a-Service (GPUaaS)
Parallel to traditional hardware offerings, 2023 marks a surge in demand for GPU-as-a-Service (GPUaaS) within the HaaS market. Driven by advancements in artificial intelligence, machine learning, and complex data analytics, GPUs are becoming indispensable for their superior processing power and efficiency. GPUaaS offers a cost-effective, scalable solution for businesses requiring intensive computational capabilities without the associated capital expenditure on high-end hardware.
This trend is particularly evident in industries engaged in video rendering, scientific computations, and AI research, where GPUs can significantly accelerate project timelines. As businesses continue to leverage data-intensive applications, the demand for GPUaaS is expected to grow, contributing to the broader expansion and diversification of the HaaS market.
Regional Analysis
The Hardware as a Service market in North America accounts for 42% of the global share.
North America continues to lead the global HaaS market, commanding a dominant 42% share. This region's prominence is underpinned by robust IT infrastructure, early adoption of technology solutions by enterprises, and significant investment in cloud-based services. The U.S. and Canada are pivotal in driving North American market dynamics, with a strong focus on reducing capital expenditure and enhancing operational efficiencies.
Europe holds a critical position in the HaaS landscape, driven by stringent regulatory frameworks mandating data security and an increasing inclination towards sustainable technology solutions. Western European countries, particularly Germany, the UK, and France, are at the forefront, leveraging HaaS to navigate digital transformation in the manufacturing and healthcare sectors.
The Asia Pacific region is witnessing the fastest growth in the HaaS market, fueled by rapid urbanization, digitalization initiatives, and the expansion of small and medium-sized enterprises (SMEs) in countries like China, India, and Japan. The region's market expansion is also supported by improvements in IT infrastructure and increased technology penetration in the business sector.
The Middle East & Africa (MEA) and Latin America are emerging as potential growth areas for HaaS. These regions benefit from the gradual shift to cloud computing and the growing demand for cost-effective IT management solutions. In particular, countries such as Brazil, South Africa, and the UAE are increasingly adopting HaaS models to optimize resource utilization and cost efficiencies.
Key Regions and Countries
North America
- The US
- Canada
- Rest of North America
Europe
- Germany
- France
- The UK
- Spain
- Netherlands
- Russia
- Italy
- Rest of Europe
Asia-Pacific
- China
- Japan
- Singapore
- Thailand
- South Korea
- Vietnam
- India
- New Zealand
- Rest of Asia Pacific
Latin America
- Mexico
- Brazil
- Rest of Latin America
Middle East & Africa
- Saudi Arabia
- South Africa
- UAE
- Rest of Middle East & Africa
Key Players Analysis
In 2023, the global Hardware as a Service (HaaS) market features a diverse array of key players, each contributing uniquely to the industry's growth and evolution. Among them, companies such as Dell Inc., Microsoft Corporation, and Amazon.com stand out due to their extensive technological infrastructure and broad market reach.
Dell Inc. continues to leverage its robust supply chain and wide-ranging technology solutions to offer comprehensive HaaS offerings. Microsoft Corporation and Amazon.com, leading the cloud services sector, integrate their cloud capabilities with HaaS offerings to provide scalable and efficient solutions to businesses of all sizes.
Mid-sized companies such as Phoenix NAP and Design Data Systems, Inc. demonstrate significant agility in adapting to market needs, focusing on specialized services and customized solutions that cater to niche markets. Their ability to deliver personalized customer service enhances their competitive edge in a crowded marketplace.
Emerging players like ZNet Technologies Pvt. Ltd. and Navitas Lease Corp. are pivotal in introducing innovative financial models and technological integrations, facilitating easier adoption of HaaS solutions in less penetrated markets.
Furthermore, companies such as Fujitsu Ltd and Lenovo Group are expanding their HaaS services globally, capitalizing on their established presence in hardware manufacturing to offer integrated solutions that are appealing to a global clientele.
The diversity and specialization of these key players enrich the HaaS market, making it both competitive and dynamic. Each company's strategy not only defines its individual growth trajectory but also shapes the broader market trends, influencing how hardware solutions are consumed and managed across different regions and industries.
Market Key Players
- Custard group
- Phoenix NAP
- Dell Inc.
- Design Data Systems, Inc.
- FUSE3 Communications
- Ingram Micro
- ITque, Inc.
- Amazon.com
- MasterIT, LLC
- Managed IT Solutions
- Microsoft Corporation
- Navitas Lease Corp.
- ZNet Technologies Pvt. Ltd.
- Fujitsu Ltd
- Lenovo Group
- Machado Consulting
Recent Development
- In March 2024, Arrow Electronics, Avnet, and CDW remain prominent VARs, adapting to evolving tech landscapes by offering customized IT solutions and embracing cloud and hybrid cloud services to ensure relevance and resilience.
- In February 2024, Telefónica, Lenovo, NearbyComputing, Fogsphere, and Nemergent showcase a multi-cloud environment enabling instant, life-saving responses with edge technology in telco networks, heralding a new era in telecommunications.
- In February 2024, Ericsson unveils 12 new solutions for high-performing, sustainable, and open networks, including the energy-efficient AIR 3255 Massive MIMO radio, advancing 5G performance and sustainability goals.
Report Scope
Report Features Description Market Value (2023) USD 90.3 Billion Forecast Revenue (2033) USD 972.1 Billion CAGR (2024-2032) 27.6% Base Year for Estimation 2023 Historic Period 2016-2023 Forecast Period 2024-2033 Report Coverage Revenue Forecast, Market Dynamics, COVID-19 Impact, Competitive Landscape, Recent Developments Segments Covered By Hardware Model(Desktop as a Service,Device as a Service,Infrastructure as a Service ,Platform as a Service), By Enterprise Size(Large Enterprises, Small and Medium Enterprises), By Deployment Model(Cloud, On-premise), By End User(IT and Telecommunication, BFSI, Healthcare) Regional Analysis North America - The US, Canada, Rest of North America, Europe - Germany, France, The UK, Spain, Italy, Russia, Netherlands, Rest of Europe, Asia-Pacific - China, Japan, South Korea, India, New Zealand, Singapore, Thailand, Vietnam, Rest of Asia Pacific, Latin America - Brazil, Mexico, Rest of Latin America, Middle East & Africa - South Africa, Saudi Arabia, UAE, Rest of Middle East & Africa Competitive Landscape Custard group, Phoenix NAP, Dell Inc., Design Data Systems, Inc., FUSE3 Communications, Ingram Micro, ITque, Inc., Amazon.com, MasterIT, LLC, Managed IT Solutions, Navitas Lease Corp., ZNet Technologies Pvt. Ltd., Fujitsu Ltd, Lenovo Group, Machado Consulting Customization Scope Customization for segments, region/country-level will be provided. Moreover, additional customization can be done based on the requirements. Purchase Options We have three licenses to opt for Single User License, Multi-User License (Up to 5 Users), Corporate Use License (Unlimited User and Printable PDF) -
- 1. Executive Summary
- 1.1. Definition
- 1.2. Taxonomy
- 1.3. Research Scope
- 1.4. Key Analysis
- 1.5. Key Findings by Major Segments
- 1.6. Top strategies by Major Players
- 2. Global Hardware As A Service Market Overview
- 2.1. Hardware As A Service Market Dynamics
- 2.1.1. Drivers
- 2.1.2. Opportunities
- 2.1.3. Restraints
- 2.1.4. Challenges
- 2.2. Macro-economic Factors
- 2.3. Regulatory Framework
- 2.4. Market Investment Feasibility Index
- 2.5. PEST Analysis
- 2.6. PORTER’S Five Force Analysis
- 2.7. Drivers & Restraints Impact Analysis
- 2.8. Industry Chain Analysis
- 2.9. Cost Structure Analysis
- 2.10. Marketing Strategy
- 2.11. Russia-Ukraine War Impact Analysis
- 2.12. Opportunity Map Analysis
- 2.13. Market Competition Scenario Analysis
- 2.14. Product Life Cycle Analysis
- 2.15. Opportunity Orbits
- 2.16. Manufacturer Intensity Map
- 2.17. Major Companies sales by Value & Volume
- 2.1. Hardware As A Service Market Dynamics
- 3. Global Hardware As A Service Market Analysis, Opportunity and Forecast, 2016-2032
- 3.1. Global Hardware As A Service Market Analysis, 2016-2021
- 3.2. Global Hardware As A Service Market Opportunity and Forecast, 2023-2032
- 3.3. Global Hardware As A Service Market Analysis, Opportunity and Forecast, By By Hardware Model, 2016-2032
- 3.3.1. Global Hardware As A Service Market Analysis by By Hardware Model: Introduction
- 3.3.2. Market Size Absolute $ Opportunity Analysis and Forecast, By By Hardware Model, 2016-2032
- 3.3.3. Desktop as a Service
- 3.3.4. Device as a Service
- 3.3.5. Infrastructure as a Service
- 3.3.6. Platform as a Service
- 3.4. Global Hardware As A Service Market Analysis, Opportunity and Forecast, By By Enterprise Size, 2016-2032
- 3.4.1. Global Hardware As A Service Market Analysis by By Enterprise Size: Introduction
- 3.4.2. Market Size Absolute $ Opportunity Analysis and Forecast, By By Enterprise Size, 2016-2032
- 3.4.3. Large Enterprises
- 3.4.4. Small and Medium Enterprises
- 3.5. Global Hardware As A Service Market Analysis, Opportunity and Forecast, By By Deployment Model, 2016-2032
- 3.5.1. Global Hardware As A Service Market Analysis by By Deployment Model: Introduction
- 3.5.2. Market Size Absolute $ Opportunity Analysis and Forecast, By By Deployment Model, 2016-2032
- 3.5.3. Cloud
- 3.5.4. On-premise
- 3.6. Global Hardware As A Service Market Analysis, Opportunity and Forecast, By By End User, 2016-2032
- 3.6.1. Global Hardware As A Service Market Analysis by By End User: Introduction
- 3.6.2. Market Size Absolute $ Opportunity Analysis and Forecast, By By End User, 2016-2032
- 3.6.3. IT and Telecommunication
- 3.6.4. BFSI
- 3.6.5. Healthcare
- 4. North America Hardware As A Service Market Analysis, Opportunity and Forecast, 2016-2032
- 4.1. North America Hardware As A Service Market Analysis, 2016-2021
- 4.2. North America Hardware As A Service Market Opportunity and Forecast, 2023-2032
- 4.3. North America Hardware As A Service Market Analysis, Opportunity and Forecast, By By Hardware Model, 2016-2032
- 4.3.1. North America Hardware As A Service Market Analysis by By Hardware Model: Introduction
- 4.3.2. Market Size Absolute $ Opportunity Analysis and Forecast, By By Hardware Model, 2016-2032
- 4.3.3. Desktop as a Service
- 4.3.4. Device as a Service
- 4.3.5. Infrastructure as a Service
- 4.3.6. Platform as a Service
- 4.4. North America Hardware As A Service Market Analysis, Opportunity and Forecast, By By Enterprise Size, 2016-2032
- 4.4.1. North America Hardware As A Service Market Analysis by By Enterprise Size: Introduction
- 4.4.2. Market Size Absolute $ Opportunity Analysis and Forecast, By By Enterprise Size, 2016-2032
- 4.4.3. Large Enterprises
- 4.4.4. Small and Medium Enterprises
- 4.5. North America Hardware As A Service Market Analysis, Opportunity and Forecast, By By Deployment Model, 2016-2032
- 4.5.1. North America Hardware As A Service Market Analysis by By Deployment Model: Introduction
- 4.5.2. Market Size Absolute $ Opportunity Analysis and Forecast, By By Deployment Model, 2016-2032
- 4.5.3. Cloud
- 4.5.4. On-premise
- 4.6. North America Hardware As A Service Market Analysis, Opportunity and Forecast, By By End User, 2016-2032
- 4.6.1. North America Hardware As A Service Market Analysis by By End User: Introduction
- 4.6.2. Market Size Absolute $ Opportunity Analysis and Forecast, By By End User, 2016-2032
- 4.6.3. IT and Telecommunication
- 4.6.4. BFSI
- 4.6.5. Healthcare
- 4.7. North America Hardware As A Service Market Analysis, Opportunity and Forecast, By Country , 2016-2032
- 4.7.1. North America Hardware As A Service Market Analysis by Country : Introduction
- 4.7.2. Market Size Absolute $ Opportunity Analysis and Forecast, Country , 2016-2032
- 4.7.2.1. The US
- 4.7.2.2. Canada
- 4.7.2.3. Mexico
- 5. Western Europe Hardware As A Service Market Analysis, Opportunity and Forecast, 2016-2032
- 5.1. Western Europe Hardware As A Service Market Analysis, 2016-2021
- 5.2. Western Europe Hardware As A Service Market Opportunity and Forecast, 2023-2032
- 5.3. Western Europe Hardware As A Service Market Analysis, Opportunity and Forecast, By By Hardware Model, 2016-2032
- 5.3.1. Western Europe Hardware As A Service Market Analysis by By Hardware Model: Introduction
- 5.3.2. Market Size Absolute $ Opportunity Analysis and Forecast, By By Hardware Model, 2016-2032
- 5.3.3. Desktop as a Service
- 5.3.4. Device as a Service
- 5.3.5. Infrastructure as a Service
- 5.3.6. Platform as a Service
- 5.4. Western Europe Hardware As A Service Market Analysis, Opportunity and Forecast, By By Enterprise Size, 2016-2032
- 5.4.1. Western Europe Hardware As A Service Market Analysis by By Enterprise Size: Introduction
- 5.4.2. Market Size Absolute $ Opportunity Analysis and Forecast, By By Enterprise Size, 2016-2032
- 5.4.3. Large Enterprises
- 5.4.4. Small and Medium Enterprises
- 5.5. Western Europe Hardware As A Service Market Analysis, Opportunity and Forecast, By By Deployment Model, 2016-2032
- 5.5.1. Western Europe Hardware As A Service Market Analysis by By Deployment Model: Introduction
- 5.5.2. Market Size Absolute $ Opportunity Analysis and Forecast, By By Deployment Model, 2016-2032
- 5.5.3. Cloud
- 5.5.4. On-premise
- 5.6. Western Europe Hardware As A Service Market Analysis, Opportunity and Forecast, By By End User, 2016-2032
- 5.6.1. Western Europe Hardware As A Service Market Analysis by By End User: Introduction
- 5.6.2. Market Size Absolute $ Opportunity Analysis and Forecast, By By End User, 2016-2032
- 5.6.3. IT and Telecommunication
- 5.6.4. BFSI
- 5.6.5. Healthcare
- 5.7. Western Europe Hardware As A Service Market Analysis, Opportunity and Forecast, By Country , 2016-2032
- 5.7.1. Western Europe Hardware As A Service Market Analysis by Country : Introduction
- 5.7.2. Market Size Absolute $ Opportunity Analysis and Forecast, Country , 2016-2032
- 5.7.2.1. Germany
- 5.7.2.2. France
- 5.7.2.3. The UK
- 5.7.2.4. Spain
- 5.7.2.5. Italy
- 5.7.2.6. Portugal
- 5.7.2.7. Ireland
- 5.7.2.8. Austria
- 5.7.2.9. Switzerland
- 5.7.2.10. Benelux
- 5.7.2.11. Nordic
- 5.7.2.12. Rest of Western Europe
- 6. Eastern Europe Hardware As A Service Market Analysis, Opportunity and Forecast, 2016-2032
- 6.1. Eastern Europe Hardware As A Service Market Analysis, 2016-2021
- 6.2. Eastern Europe Hardware As A Service Market Opportunity and Forecast, 2023-2032
- 6.3. Eastern Europe Hardware As A Service Market Analysis, Opportunity and Forecast, By By Hardware Model, 2016-2032
- 6.3.1. Eastern Europe Hardware As A Service Market Analysis by By Hardware Model: Introduction
- 6.3.2. Market Size Absolute $ Opportunity Analysis and Forecast, By By Hardware Model, 2016-2032
- 6.3.3. Desktop as a Service
- 6.3.4. Device as a Service
- 6.3.5. Infrastructure as a Service
- 6.3.6. Platform as a Service
- 6.4. Eastern Europe Hardware As A Service Market Analysis, Opportunity and Forecast, By By Enterprise Size, 2016-2032
- 6.4.1. Eastern Europe Hardware As A Service Market Analysis by By Enterprise Size: Introduction
- 6.4.2. Market Size Absolute $ Opportunity Analysis and Forecast, By By Enterprise Size, 2016-2032
- 6.4.3. Large Enterprises
- 6.4.4. Small and Medium Enterprises
- 6.5. Eastern Europe Hardware As A Service Market Analysis, Opportunity and Forecast, By By Deployment Model, 2016-2032
- 6.5.1. Eastern Europe Hardware As A Service Market Analysis by By Deployment Model: Introduction
- 6.5.2. Market Size Absolute $ Opportunity Analysis and Forecast, By By Deployment Model, 2016-2032
- 6.5.3. Cloud
- 6.5.4. On-premise
- 6.6. Eastern Europe Hardware As A Service Market Analysis, Opportunity and Forecast, By By End User, 2016-2032
- 6.6.1. Eastern Europe Hardware As A Service Market Analysis by By End User: Introduction
- 6.6.2. Market Size Absolute $ Opportunity Analysis and Forecast, By By End User, 2016-2032
- 6.6.3. IT and Telecommunication
- 6.6.4. BFSI
- 6.6.5. Healthcare
- 6.7. Eastern Europe Hardware As A Service Market Analysis, Opportunity and Forecast, By Country , 2016-2032
- 6.7.1. Eastern Europe Hardware As A Service Market Analysis by Country : Introduction
- 6.7.2. Market Size Absolute $ Opportunity Analysis and Forecast, Country , 2016-2032
- 6.7.2.1. Russia
- 6.7.2.2. Poland
- 6.7.2.3. The Czech Republic
- 6.7.2.4. Greece
- 6.7.2.5. Rest of Eastern Europe
- 7. APAC Hardware As A Service Market Analysis, Opportunity and Forecast, 2016-2032
- 7.1. APAC Hardware As A Service Market Analysis, 2016-2021
- 7.2. APAC Hardware As A Service Market Opportunity and Forecast, 2023-2032
- 7.3. APAC Hardware As A Service Market Analysis, Opportunity and Forecast, By By Hardware Model, 2016-2032
- 7.3.1. APAC Hardware As A Service Market Analysis by By Hardware Model: Introduction
- 7.3.2. Market Size Absolute $ Opportunity Analysis and Forecast, By By Hardware Model, 2016-2032
- 7.3.3. Desktop as a Service
- 7.3.4. Device as a Service
- 7.3.5. Infrastructure as a Service
- 7.3.6. Platform as a Service
- 7.4. APAC Hardware As A Service Market Analysis, Opportunity and Forecast, By By Enterprise Size, 2016-2032
- 7.4.1. APAC Hardware As A Service Market Analysis by By Enterprise Size: Introduction
- 7.4.2. Market Size Absolute $ Opportunity Analysis and Forecast, By By Enterprise Size, 2016-2032
- 7.4.3. Large Enterprises
- 7.4.4. Small and Medium Enterprises
- 7.5. APAC Hardware As A Service Market Analysis, Opportunity and Forecast, By By Deployment Model, 2016-2032
- 7.5.1. APAC Hardware As A Service Market Analysis by By Deployment Model: Introduction
- 7.5.2. Market Size Absolute $ Opportunity Analysis and Forecast, By By Deployment Model, 2016-2032
- 7.5.3. Cloud
- 7.5.4. On-premise
- 7.6. APAC Hardware As A Service Market Analysis, Opportunity and Forecast, By By End User, 2016-2032
- 7.6.1. APAC Hardware As A Service Market Analysis by By End User: Introduction
- 7.6.2. Market Size Absolute $ Opportunity Analysis and Forecast, By By End User, 2016-2032
- 7.6.3. IT and Telecommunication
- 7.6.4. BFSI
- 7.6.5. Healthcare
- 7.7. APAC Hardware As A Service Market Analysis, Opportunity and Forecast, By Country , 2016-2032
- 7.7.1. APAC Hardware As A Service Market Analysis by Country : Introduction
- 7.7.2. Market Size Absolute $ Opportunity Analysis and Forecast, Country , 2016-2032
- 7.7.2.1. China
- 7.7.2.2. Japan
- 7.7.2.3. South Korea
- 7.7.2.4. India
- 7.7.2.5. Australia & New Zeland
- 7.7.2.6. Indonesia
- 7.7.2.7. Malaysia
- 7.7.2.8. Philippines
- 7.7.2.9. Singapore
- 7.7.2.10. Thailand
- 7.7.2.11. Vietnam
- 7.7.2.12. Rest of APAC
- 8. Latin America Hardware As A Service Market Analysis, Opportunity and Forecast, 2016-2032
- 8.1. Latin America Hardware As A Service Market Analysis, 2016-2021
- 8.2. Latin America Hardware As A Service Market Opportunity and Forecast, 2023-2032
- 8.3. Latin America Hardware As A Service Market Analysis, Opportunity and Forecast, By By Hardware Model, 2016-2032
- 8.3.1. Latin America Hardware As A Service Market Analysis by By Hardware Model: Introduction
- 8.3.2. Market Size Absolute $ Opportunity Analysis and Forecast, By By Hardware Model, 2016-2032
- 8.3.3. Desktop as a Service
- 8.3.4. Device as a Service
- 8.3.5. Infrastructure as a Service
- 8.3.6. Platform as a Service
- 8.4. Latin America Hardware As A Service Market Analysis, Opportunity and Forecast, By By Enterprise Size, 2016-2032
- 8.4.1. Latin America Hardware As A Service Market Analysis by By Enterprise Size: Introduction
- 8.4.2. Market Size Absolute $ Opportunity Analysis and Forecast, By By Enterprise Size, 2016-2032
- 8.4.3. Large Enterprises
- 8.4.4. Small and Medium Enterprises
- 8.5. Latin America Hardware As A Service Market Analysis, Opportunity and Forecast, By By Deployment Model, 2016-2032
- 8.5.1. Latin America Hardware As A Service Market Analysis by By Deployment Model: Introduction
- 8.5.2. Market Size Absolute $ Opportunity Analysis and Forecast, By By Deployment Model, 2016-2032
- 8.5.3. Cloud
- 8.5.4. On-premise
- 8.6. Latin America Hardware As A Service Market Analysis, Opportunity and Forecast, By By End User, 2016-2032
- 8.6.1. Latin America Hardware As A Service Market Analysis by By End User: Introduction
- 8.6.2. Market Size Absolute $ Opportunity Analysis and Forecast, By By End User, 2016-2032
- 8.6.3. IT and Telecommunication
- 8.6.4. BFSI
- 8.6.5. Healthcare
- 8.7. Latin America Hardware As A Service Market Analysis, Opportunity and Forecast, By Country , 2016-2032
- 8.7.1. Latin America Hardware As A Service Market Analysis by Country : Introduction
- 8.7.2. Market Size Absolute $ Opportunity Analysis and Forecast, Country , 2016-2032
- 8.7.2.1. Brazil
- 8.7.2.2. Colombia
- 8.7.2.3. Chile
- 8.7.2.4. Argentina
- 8.7.2.5. Costa Rica
- 8.7.2.6. Rest of Latin America
- 9. Middle East & Africa Hardware As A Service Market Analysis, Opportunity and Forecast, 2016-2032
- 9.1. Middle East & Africa Hardware As A Service Market Analysis, 2016-2021
- 9.2. Middle East & Africa Hardware As A Service Market Opportunity and Forecast, 2023-2032
- 9.3. Middle East & Africa Hardware As A Service Market Analysis, Opportunity and Forecast, By By Hardware Model, 2016-2032
- 9.3.1. Middle East & Africa Hardware As A Service Market Analysis by By Hardware Model: Introduction
- 9.3.2. Market Size Absolute $ Opportunity Analysis and Forecast, By By Hardware Model, 2016-2032
- 9.3.3. Desktop as a Service
- 9.3.4. Device as a Service
- 9.3.5. Infrastructure as a Service
- 9.3.6. Platform as a Service
- 9.4. Middle East & Africa Hardware As A Service Market Analysis, Opportunity and Forecast, By By Enterprise Size, 2016-2032
- 9.4.1. Middle East & Africa Hardware As A Service Market Analysis by By Enterprise Size: Introduction
- 9.4.2. Market Size Absolute $ Opportunity Analysis and Forecast, By By Enterprise Size, 2016-2032
- 9.4.3. Large Enterprises
- 9.4.4. Small and Medium Enterprises
- 9.5. Middle East & Africa Hardware As A Service Market Analysis, Opportunity and Forecast, By By Deployment Model, 2016-2032
- 9.5.1. Middle East & Africa Hardware As A Service Market Analysis by By Deployment Model: Introduction
- 9.5.2. Market Size Absolute $ Opportunity Analysis and Forecast, By By Deployment Model, 2016-2032
- 9.5.3. Cloud
- 9.5.4. On-premise
- 9.6. Middle East & Africa Hardware As A Service Market Analysis, Opportunity and Forecast, By By End User, 2016-2032
- 9.6.1. Middle East & Africa Hardware As A Service Market Analysis by By End User: Introduction
- 9.6.2. Market Size Absolute $ Opportunity Analysis and Forecast, By By End User, 2016-2032
- 9.6.3. IT and Telecommunication
- 9.6.4. BFSI
- 9.6.5. Healthcare
- 9.7. Middle East & Africa Hardware As A Service Market Analysis, Opportunity and Forecast, By Country , 2016-2032
- 9.7.1. Middle East & Africa Hardware As A Service Market Analysis by Country : Introduction
- 9.7.2. Market Size Absolute $ Opportunity Analysis and Forecast, Country , 2016-2032
- 9.7.2.1. Algeria
- 9.7.2.2. Egypt
- 9.7.2.3. Israel
- 9.7.2.4. Kuwait
- 9.7.2.5. Nigeria
- 9.7.2.6. Saudi Arabia
- 9.7.2.7. South Africa
- 9.7.2.8. Turkey
- 9.7.2.9. The UAE
- 9.7.2.10. Rest of MEA
- 10. Global Hardware As A Service Market Analysis, Opportunity and Forecast, By Region , 2016-2032
- 10.1. Global Hardware As A Service Market Analysis by Region : Introduction
- 10.2. Market Size Absolute $ Opportunity Analysis and Forecast, By Region , 2016-2032
- 10.2.1. North America
- 10.2.2. Western Europe
- 10.2.3. Eastern Europe
- 10.2.4. APAC
- 10.2.5. Latin America
- 10.2.6. Middle East & Africa
- 11. Global Hardware As A Service Market Competitive Landscape, Market Share Analysis, and Company Profiles
- 11.1. Market Share Analysis
- 11.2. Company Profiles
- 11.3. Custard group
- 11.3.1. Company Overview
- 11.3.2. Financial Highlights
- 11.3.3. Product Portfolio
- 11.3.4. SWOT Analysis
- 11.3.5. Key Strategies and Developments
- 11.4. Phoenix NAP
- 11.4.1. Company Overview
- 11.4.2. Financial Highlights
- 11.4.3. Product Portfolio
- 11.4.4. SWOT Analysis
- 11.4.5. Key Strategies and Developments
- 11.5. Dell Inc.
- 11.5.1. Company Overview
- 11.5.2. Financial Highlights
- 11.5.3. Product Portfolio
- 11.5.4. SWOT Analysis
- 11.5.5. Key Strategies and Developments
- 11.6. Design Data Systems, Inc.
- 11.6.1. Company Overview
- 11.6.2. Financial Highlights
- 11.6.3. Product Portfolio
- 11.6.4. SWOT Analysis
- 11.6.5. Key Strategies and Developments
- 11.7. FUSE3 Communications
- 11.7.1. Company Overview
- 11.7.2. Financial Highlights
- 11.7.3. Product Portfolio
- 11.7.4. SWOT Analysis
- 11.7.5. Key Strategies and Developments
- 11.8. Ingram Micro
- 11.8.1. Company Overview
- 11.8.2. Financial Highlights
- 11.8.3. Product Portfolio
- 11.8.4. SWOT Analysis
- 11.8.5. Key Strategies and Developments
- 11.9. ITque, Inc.
- 11.9.1. Company Overview
- 11.9.2. Financial Highlights
- 11.9.3. Product Portfolio
- 11.9.4. SWOT Analysis
- 11.9.5. Key Strategies and Developments
- 11.10. Amazon.com
- 11.10.1. Company Overview
- 11.10.2. Financial Highlights
- 11.10.3. Product Portfolio
- 11.10.4. SWOT Analysis
- 11.10.5. Key Strategies and Developments
- 11.11. MasterIT, LLC
- 11.11.1. Company Overview
- 11.11.2. Financial Highlights
- 11.11.3. Product Portfolio
- 11.11.4. SWOT Analysis
- 11.11.5. Key Strategies and Developments
- 11.12. Managed IT Solutions
- 11.12.1. Company Overview
- 11.12.2. Financial Highlights
- 11.12.3. Product Portfolio
- 11.12.4. SWOT Analysis
- 11.12.5. Key Strategies and Developments
- 11.13.1. Company Overview
- 11.13.2. Financial Highlights
- 11.13.3. Product Portfolio
- 11.13.4. SWOT Analysis
- 11.13.5. Key Strategies and Developments
- 11.14. Microsoft Corporation
- 11.14.1. Company Overview
- 11.14.2. Financial Highlights
- 11.14.3. Product Portfolio
- 11.14.4. SWOT Analysis
- 11.14.5. Key Strategies and Developments
- 11.15. ZNet Technologies Pvt. Ltd.
- 11.15.1. Company Overview
- 11.15.2. Financial Highlights
- 11.15.3. Product Portfolio
- 11.15.4. SWOT Analysis
- 11.15.5. Key Strategies and Developments
- 11.16. Fujitsu Ltd
- 11.16.1. Company Overview
- 11.16.2. Financial Highlights
- 11.16.3. Product Portfolio
- 11.16.4. SWOT Analysis
- 11.16.5. Key Strategies and Developments
- 11.17. Lenovo Group
- 11.17.1. Company Overview
- 11.17.2. Financial Highlights
- 11.17.3. Product Portfolio
- 11.17.4. SWOT Analysis
- 11.17.5. Key Strategies and Developments
- 11.18. Machado Consulting
- 11.18.1. Company Overview
- 11.18.2. Financial Highlights
- 11.18.3. Product Portfolio
- 11.18.4. SWOT Analysis
- 11.18.5. Key Strategies and Developments
- 12. Assumptions and Acronyms
- 13. Research Methodology
- 14. Contact
"
- List of Figures
- "
- Figure 1: Global Hardware As A Service Market Revenue (US$ Mn) Market Share by By Hardware Model in 2022
- Figure 2: Global Hardware As A Service Market Market Attractiveness Analysis by By Hardware Model, 2016-2032
- Figure 3: Global Hardware As A Service Market Revenue (US$ Mn) Market Share by By Enterprise Sizein 2022
- Figure 4: Global Hardware As A Service Market Market Attractiveness Analysis by By Enterprise Size, 2016-2032
- Figure 5: Global Hardware As A Service Market Revenue (US$ Mn) Market Share by By Deployment Modelin 2022
- Figure 6: Global Hardware As A Service Market Market Attractiveness Analysis by By Deployment Model, 2016-2032
- Figure 7: Global Hardware As A Service Market Revenue (US$ Mn) Market Share by By End Userin 2022
- Figure 8: Global Hardware As A Service Market Market Attractiveness Analysis by By End User, 2016-2032
- Figure 9: Global Hardware As A Service Market Revenue (US$ Mn) Market Share by Region in 2022
- Figure 10: Global Hardware As A Service Market Market Attractiveness Analysis by Region, 2016-2032
- Figure 11: Global Hardware As A Service Market Market Revenue (US$ Mn) (2016-2032)
- Figure 12: Global Hardware As A Service Market Market Revenue (US$ Mn) Comparison by Region (2016-2032)
- Figure 13: Global Hardware As A Service Market Market Revenue (US$ Mn) Comparison by By Hardware Model (2016-2032)
- Figure 14: Global Hardware As A Service Market Market Revenue (US$ Mn) Comparison by By Enterprise Size (2016-2032)
- Figure 15: Global Hardware As A Service Market Market Revenue (US$ Mn) Comparison by By Deployment Model (2016-2032)
- Figure 16: Global Hardware As A Service Market Market Revenue (US$ Mn) Comparison by By End User (2016-2032)
- Figure 17: Global Hardware As A Service Market Market Y-o-Y Growth Rate Comparison by Region (2016-2032)
- Figure 18: Global Hardware As A Service Market Market Y-o-Y Growth Rate Comparison by By Hardware Model (2016-2032)
- Figure 19: Global Hardware As A Service Market Market Y-o-Y Growth Rate Comparison by By Enterprise Size (2016-2032)
- Figure 20: Global Hardware As A Service Market Market Y-o-Y Growth Rate Comparison by By Deployment Model (2016-2032)
- Figure 21: Global Hardware As A Service Market Market Y-o-Y Growth Rate Comparison by By End User (2016-2032)
- Figure 22: Global Hardware As A Service Market Market Share Comparison by Region (2016-2032)
- Figure 23: Global Hardware As A Service Market Market Share Comparison by By Hardware Model (2016-2032)
- Figure 24: Global Hardware As A Service Market Market Share Comparison by By Enterprise Size (2016-2032)
- Figure 25: Global Hardware As A Service Market Market Share Comparison by By Deployment Model (2016-2032)
- Figure 26: Global Hardware As A Service Market Market Share Comparison by By End User (2016-2032)
- Figure 27: North America Hardware As A Service Market Revenue (US$ Mn) Market Share by By Hardware Modelin 2022
- Figure 28: North America Hardware As A Service Market Market Attractiveness Analysis by By Hardware Model, 2016-2032
- Figure 29: North America Hardware As A Service Market Revenue (US$ Mn) Market Share by By Enterprise Sizein 2022
- Figure 30: North America Hardware As A Service Market Market Attractiveness Analysis by By Enterprise Size, 2016-2032
- Figure 31: North America Hardware As A Service Market Revenue (US$ Mn) Market Share by By Deployment Modelin 2022
- Figure 32: North America Hardware As A Service Market Market Attractiveness Analysis by By Deployment Model, 2016-2032
- Figure 33: North America Hardware As A Service Market Revenue (US$ Mn) Market Share by By End Userin 2022
- Figure 34: North America Hardware As A Service Market Market Attractiveness Analysis by By End User, 2016-2032
- Figure 35: North America Hardware As A Service Market Revenue (US$ Mn) Market Share by Country in 2022
- Figure 36: North America Hardware As A Service Market Market Attractiveness Analysis by Country, 2016-2032
- Figure 37: North America Hardware As A Service Market Market Revenue (US$ Mn) (2016-2032)
- Figure 38: North America Hardware As A Service Market Market Revenue (US$ Mn) Comparison by Country (2016-2032)
- Figure 39: North America Hardware As A Service Market Market Revenue (US$ Mn) Comparison by By Hardware Model (2016-2032)
- Figure 40: North America Hardware As A Service Market Market Revenue (US$ Mn) Comparison by By Enterprise Size (2016-2032)
- Figure 41: North America Hardware As A Service Market Market Revenue (US$ Mn) Comparison by By Deployment Model (2016-2032)
- Figure 42: North America Hardware As A Service Market Market Revenue (US$ Mn) Comparison by By End User (2016-2032)
- Figure 43: North America Hardware As A Service Market Market Y-o-Y Growth Rate Comparison by Country (2016-2032)
- Figure 44: North America Hardware As A Service Market Market Y-o-Y Growth Rate Comparison by By Hardware Model (2016-2032)
- Figure 45: North America Hardware As A Service Market Market Y-o-Y Growth Rate Comparison by By Enterprise Size (2016-2032)
- Figure 46: North America Hardware As A Service Market Market Y-o-Y Growth Rate Comparison by By Deployment Model (2016-2032)
- Figure 47: North America Hardware As A Service Market Market Y-o-Y Growth Rate Comparison by By End User (2016-2032)
- Figure 48: North America Hardware As A Service Market Market Share Comparison by Country (2016-2032)
- Figure 49: North America Hardware As A Service Market Market Share Comparison by By Hardware Model (2016-2032)
- Figure 50: North America Hardware As A Service Market Market Share Comparison by By Enterprise Size (2016-2032)
- Figure 51: North America Hardware As A Service Market Market Share Comparison by By Deployment Model (2016-2032)
- Figure 52: North America Hardware As A Service Market Market Share Comparison by By End User (2016-2032)
- Figure 53: Western Europe Hardware As A Service Market Revenue (US$ Mn) Market Share by By Hardware Modelin 2022
- Figure 54: Western Europe Hardware As A Service Market Market Attractiveness Analysis by By Hardware Model, 2016-2032
- Figure 55: Western Europe Hardware As A Service Market Revenue (US$ Mn) Market Share by By Enterprise Sizein 2022
- Figure 56: Western Europe Hardware As A Service Market Market Attractiveness Analysis by By Enterprise Size, 2016-2032
- Figure 57: Western Europe Hardware As A Service Market Revenue (US$ Mn) Market Share by By Deployment Modelin 2022
- Figure 58: Western Europe Hardware As A Service Market Market Attractiveness Analysis by By Deployment Model, 2016-2032
- Figure 59: Western Europe Hardware As A Service Market Revenue (US$ Mn) Market Share by By End Userin 2022
- Figure 60: Western Europe Hardware As A Service Market Market Attractiveness Analysis by By End User, 2016-2032
- Figure 61: Western Europe Hardware As A Service Market Revenue (US$ Mn) Market Share by Country in 2022
- Figure 62: Western Europe Hardware As A Service Market Market Attractiveness Analysis by Country, 2016-2032
- Figure 63: Western Europe Hardware As A Service Market Market Revenue (US$ Mn) (2016-2032)
- Figure 64: Western Europe Hardware As A Service Market Market Revenue (US$ Mn) Comparison by Country (2016-2032)
- Figure 65: Western Europe Hardware As A Service Market Market Revenue (US$ Mn) Comparison by By Hardware Model (2016-2032)
- Figure 66: Western Europe Hardware As A Service Market Market Revenue (US$ Mn) Comparison by By Enterprise Size (2016-2032)
- Figure 67: Western Europe Hardware As A Service Market Market Revenue (US$ Mn) Comparison by By Deployment Model (2016-2032)
- Figure 68: Western Europe Hardware As A Service Market Market Revenue (US$ Mn) Comparison by By End User (2016-2032)
- Figure 69: Western Europe Hardware As A Service Market Market Y-o-Y Growth Rate Comparison by Country (2016-2032)
- Figure 70: Western Europe Hardware As A Service Market Market Y-o-Y Growth Rate Comparison by By Hardware Model (2016-2032)
- Figure 71: Western Europe Hardware As A Service Market Market Y-o-Y Growth Rate Comparison by By Enterprise Size (2016-2032)
- Figure 72: Western Europe Hardware As A Service Market Market Y-o-Y Growth Rate Comparison by By Deployment Model (2016-2032)
- Figure 73: Western Europe Hardware As A Service Market Market Y-o-Y Growth Rate Comparison by By End User (2016-2032)
- Figure 74: Western Europe Hardware As A Service Market Market Share Comparison by Country (2016-2032)
- Figure 75: Western Europe Hardware As A Service Market Market Share Comparison by By Hardware Model (2016-2032)
- Figure 76: Western Europe Hardware As A Service Market Market Share Comparison by By Enterprise Size (2016-2032)
- Figure 77: Western Europe Hardware As A Service Market Market Share Comparison by By Deployment Model (2016-2032)
- Figure 78: Western Europe Hardware As A Service Market Market Share Comparison by By End User (2016-2032)
- Figure 79: Eastern Europe Hardware As A Service Market Revenue (US$ Mn) Market Share by By Hardware Modelin 2022
- Figure 80: Eastern Europe Hardware As A Service Market Market Attractiveness Analysis by By Hardware Model, 2016-2032
- Figure 81: Eastern Europe Hardware As A Service Market Revenue (US$ Mn) Market Share by By Enterprise Sizein 2022
- Figure 82: Eastern Europe Hardware As A Service Market Market Attractiveness Analysis by By Enterprise Size, 2016-2032
- Figure 83: Eastern Europe Hardware As A Service Market Revenue (US$ Mn) Market Share by By Deployment Modelin 2022
- Figure 84: Eastern Europe Hardware As A Service Market Market Attractiveness Analysis by By Deployment Model, 2016-2032
- Figure 85: Eastern Europe Hardware As A Service Market Revenue (US$ Mn) Market Share by By End Userin 2022
- Figure 86: Eastern Europe Hardware As A Service Market Market Attractiveness Analysis by By End User, 2016-2032
- Figure 87: Eastern Europe Hardware As A Service Market Revenue (US$ Mn) Market Share by Country in 2022
- Figure 88: Eastern Europe Hardware As A Service Market Market Attractiveness Analysis by Country, 2016-2032
- Figure 89: Eastern Europe Hardware As A Service Market Market Revenue (US$ Mn) (2016-2032)
- Figure 90: Eastern Europe Hardware As A Service Market Market Revenue (US$ Mn) Comparison by Country (2016-2032)
- Figure 91: Eastern Europe Hardware As A Service Market Market Revenue (US$ Mn) Comparison by By Hardware Model (2016-2032)
- Figure 92: Eastern Europe Hardware As A Service Market Market Revenue (US$ Mn) Comparison by By Enterprise Size (2016-2032)
- Figure 93: Eastern Europe Hardware As A Service Market Market Revenue (US$ Mn) Comparison by By Deployment Model (2016-2032)
- Figure 94: Eastern Europe Hardware As A Service Market Market Revenue (US$ Mn) Comparison by By End User (2016-2032)
- Figure 95: Eastern Europe Hardware As A Service Market Market Y-o-Y Growth Rate Comparison by Country (2016-2032)
- Figure 96: Eastern Europe Hardware As A Service Market Market Y-o-Y Growth Rate Comparison by By Hardware Model (2016-2032)
- Figure 97: Eastern Europe Hardware As A Service Market Market Y-o-Y Growth Rate Comparison by By Enterprise Size (2016-2032)
- Figure 98: Eastern Europe Hardware As A Service Market Market Y-o-Y Growth Rate Comparison by By Deployment Model (2016-2032)
- Figure 99: Eastern Europe Hardware As A Service Market Market Y-o-Y Growth Rate Comparison by By End User (2016-2032)
- Figure 100: Eastern Europe Hardware As A Service Market Market Share Comparison by Country (2016-2032)
- Figure 101: Eastern Europe Hardware As A Service Market Market Share Comparison by By Hardware Model (2016-2032)
- Figure 102: Eastern Europe Hardware As A Service Market Market Share Comparison by By Enterprise Size (2016-2032)
- Figure 103: Eastern Europe Hardware As A Service Market Market Share Comparison by By Deployment Model (2016-2032)
- Figure 104: Eastern Europe Hardware As A Service Market Market Share Comparison by By End User (2016-2032)
- Figure 105: APAC Hardware As A Service Market Revenue (US$ Mn) Market Share by By Hardware Modelin 2022
- Figure 106: APAC Hardware As A Service Market Market Attractiveness Analysis by By Hardware Model, 2016-2032
- Figure 107: APAC Hardware As A Service Market Revenue (US$ Mn) Market Share by By Enterprise Sizein 2022
- Figure 108: APAC Hardware As A Service Market Market Attractiveness Analysis by By Enterprise Size, 2016-2032
- Figure 109: APAC Hardware As A Service Market Revenue (US$ Mn) Market Share by By Deployment Modelin 2022
- Figure 110: APAC Hardware As A Service Market Market Attractiveness Analysis by By Deployment Model, 2016-2032
- Figure 111: APAC Hardware As A Service Market Revenue (US$ Mn) Market Share by By End Userin 2022
- Figure 112: APAC Hardware As A Service Market Market Attractiveness Analysis by By End User, 2016-2032
- Figure 113: APAC Hardware As A Service Market Revenue (US$ Mn) Market Share by Country in 2022
- Figure 114: APAC Hardware As A Service Market Market Attractiveness Analysis by Country, 2016-2032
- Figure 115: APAC Hardware As A Service Market Market Revenue (US$ Mn) (2016-2032)
- Figure 116: APAC Hardware As A Service Market Market Revenue (US$ Mn) Comparison by Country (2016-2032)
- Figure 117: APAC Hardware As A Service Market Market Revenue (US$ Mn) Comparison by By Hardware Model (2016-2032)
- Figure 118: APAC Hardware As A Service Market Market Revenue (US$ Mn) Comparison by By Enterprise Size (2016-2032)
- Figure 119: APAC Hardware As A Service Market Market Revenue (US$ Mn) Comparison by By Deployment Model (2016-2032)
- Figure 120: APAC Hardware As A Service Market Market Revenue (US$ Mn) Comparison by By End User (2016-2032)
- Figure 121: APAC Hardware As A Service Market Market Y-o-Y Growth Rate Comparison by Country (2016-2032)
- Figure 122: APAC Hardware As A Service Market Market Y-o-Y Growth Rate Comparison by By Hardware Model (2016-2032)
- Figure 123: APAC Hardware As A Service Market Market Y-o-Y Growth Rate Comparison by By Enterprise Size (2016-2032)
- Figure 124: APAC Hardware As A Service Market Market Y-o-Y Growth Rate Comparison by By Deployment Model (2016-2032)
- Figure 125: APAC Hardware As A Service Market Market Y-o-Y Growth Rate Comparison by By End User (2016-2032)
- Figure 126: APAC Hardware As A Service Market Market Share Comparison by Country (2016-2032)
- Figure 127: APAC Hardware As A Service Market Market Share Comparison by By Hardware Model (2016-2032)
- Figure 128: APAC Hardware As A Service Market Market Share Comparison by By Enterprise Size (2016-2032)
- Figure 129: APAC Hardware As A Service Market Market Share Comparison by By Deployment Model (2016-2032)
- Figure 130: APAC Hardware As A Service Market Market Share Comparison by By End User (2016-2032)
- Figure 131: Latin America Hardware As A Service Market Revenue (US$ Mn) Market Share by By Hardware Modelin 2022
- Figure 132: Latin America Hardware As A Service Market Market Attractiveness Analysis by By Hardware Model, 2016-2032
- Figure 133: Latin America Hardware As A Service Market Revenue (US$ Mn) Market Share by By Enterprise Sizein 2022
- Figure 134: Latin America Hardware As A Service Market Market Attractiveness Analysis by By Enterprise Size, 2016-2032
- Figure 135: Latin America Hardware As A Service Market Revenue (US$ Mn) Market Share by By Deployment Modelin 2022
- Figure 136: Latin America Hardware As A Service Market Market Attractiveness Analysis by By Deployment Model, 2016-2032
- Figure 137: Latin America Hardware As A Service Market Revenue (US$ Mn) Market Share by By End Userin 2022
- Figure 138: Latin America Hardware As A Service Market Market Attractiveness Analysis by By End User, 2016-2032
- Figure 139: Latin America Hardware As A Service Market Revenue (US$ Mn) Market Share by Country in 2022
- Figure 140: Latin America Hardware As A Service Market Market Attractiveness Analysis by Country, 2016-2032
- Figure 141: Latin America Hardware As A Service Market Market Revenue (US$ Mn) (2016-2032)
- Figure 142: Latin America Hardware As A Service Market Market Revenue (US$ Mn) Comparison by Country (2016-2032)
- Figure 143: Latin America Hardware As A Service Market Market Revenue (US$ Mn) Comparison by By Hardware Model (2016-2032)
- Figure 144: Latin America Hardware As A Service Market Market Revenue (US$ Mn) Comparison by By Enterprise Size (2016-2032)
- Figure 145: Latin America Hardware As A Service Market Market Revenue (US$ Mn) Comparison by By Deployment Model (2016-2032)
- Figure 146: Latin America Hardware As A Service Market Market Revenue (US$ Mn) Comparison by By End User (2016-2032)
- Figure 147: Latin America Hardware As A Service Market Market Y-o-Y Growth Rate Comparison by Country (2016-2032)
- Figure 148: Latin America Hardware As A Service Market Market Y-o-Y Growth Rate Comparison by By Hardware Model (2016-2032)
- Figure 149: Latin America Hardware As A Service Market Market Y-o-Y Growth Rate Comparison by By Enterprise Size (2016-2032)
- Figure 150: Latin America Hardware As A Service Market Market Y-o-Y Growth Rate Comparison by By Deployment Model (2016-2032)
- Figure 151: Latin America Hardware As A Service Market Market Y-o-Y Growth Rate Comparison by By End User (2016-2032)
- Figure 152: Latin America Hardware As A Service Market Market Share Comparison by Country (2016-2032)
- Figure 153: Latin America Hardware As A Service Market Market Share Comparison by By Hardware Model (2016-2032)
- Figure 154: Latin America Hardware As A Service Market Market Share Comparison by By Enterprise Size (2016-2032)
- Figure 155: Latin America Hardware As A Service Market Market Share Comparison by By Deployment Model (2016-2032)
- Figure 156: Latin America Hardware As A Service Market Market Share Comparison by By End User (2016-2032)
- Figure 157: Middle East & Africa Hardware As A Service Market Revenue (US$ Mn) Market Share by By Hardware Modelin 2022
- Figure 158: Middle East & Africa Hardware As A Service Market Market Attractiveness Analysis by By Hardware Model, 2016-2032
- Figure 159: Middle East & Africa Hardware As A Service Market Revenue (US$ Mn) Market Share by By Enterprise Sizein 2022
- Figure 160: Middle East & Africa Hardware As A Service Market Market Attractiveness Analysis by By Enterprise Size, 2016-2032
- Figure 161: Middle East & Africa Hardware As A Service Market Revenue (US$ Mn) Market Share by By Deployment Modelin 2022
- Figure 162: Middle East & Africa Hardware As A Service Market Market Attractiveness Analysis by By Deployment Model, 2016-2032
- Figure 163: Middle East & Africa Hardware As A Service Market Revenue (US$ Mn) Market Share by By End Userin 2022
- Figure 164: Middle East & Africa Hardware As A Service Market Market Attractiveness Analysis by By End User, 2016-2032
- Figure 165: Middle East & Africa Hardware As A Service Market Revenue (US$ Mn) Market Share by Country in 2022
- Figure 166: Middle East & Africa Hardware As A Service Market Market Attractiveness Analysis by Country, 2016-2032
- Figure 167: Middle East & Africa Hardware As A Service Market Market Revenue (US$ Mn) (2016-2032)
- Figure 168: Middle East & Africa Hardware As A Service Market Market Revenue (US$ Mn) Comparison by Country (2016-2032)
- Figure 169: Middle East & Africa Hardware As A Service Market Market Revenue (US$ Mn) Comparison by By Hardware Model (2016-2032)
- Figure 170: Middle East & Africa Hardware As A Service Market Market Revenue (US$ Mn) Comparison by By Enterprise Size (2016-2032)
- Figure 171: Middle East & Africa Hardware As A Service Market Market Revenue (US$ Mn) Comparison by By Deployment Model (2016-2032)
- Figure 172: Middle East & Africa Hardware As A Service Market Market Revenue (US$ Mn) Comparison by By End User (2016-2032)
- Figure 173: Middle East & Africa Hardware As A Service Market Market Y-o-Y Growth Rate Comparison by Country (2016-2032)
- Figure 174: Middle East & Africa Hardware As A Service Market Market Y-o-Y Growth Rate Comparison by By Hardware Model (2016-2032)
- Figure 175: Middle East & Africa Hardware As A Service Market Market Y-o-Y Growth Rate Comparison by By Enterprise Size (2016-2032)
- Figure 176: Middle East & Africa Hardware As A Service Market Market Y-o-Y Growth Rate Comparison by By Deployment Model (2016-2032)
- Figure 177: Middle East & Africa Hardware As A Service Market Market Y-o-Y Growth Rate Comparison by By End User (2016-2032)
- Figure 178: Middle East & Africa Hardware As A Service Market Market Share Comparison by Country (2016-2032)
- Figure 179: Middle East & Africa Hardware As A Service Market Market Share Comparison by By Hardware Model (2016-2032)
- Figure 180: Middle East & Africa Hardware As A Service Market Market Share Comparison by By Enterprise Size (2016-2032)
- Figure 181: Middle East & Africa Hardware As A Service Market Market Share Comparison by By Deployment Model (2016-2032)
- Figure 182: Middle East & Africa Hardware As A Service Market Market Share Comparison by By End User (2016-2032)
"
- List of Tables
- "
- Table 1: Global Hardware As A Service Market Market Comparison by By Hardware Model (2016-2032)
- Table 2: Global Hardware As A Service Market Market Comparison by By Enterprise Size (2016-2032)
- Table 3: Global Hardware As A Service Market Market Comparison by By Deployment Model (2016-2032)
- Table 4: Global Hardware As A Service Market Market Comparison by By End User (2016-2032)
- Table 5: Global Hardware As A Service Market Revenue (US$ Mn) Comparison by Region (2016-2032)
- Table 6: Global Hardware As A Service Market Market Revenue (US$ Mn) (2016-2032)
- Table 7: Global Hardware As A Service Market Market Revenue (US$ Mn) Comparison by Region (2016-2032)
- Table 8: Global Hardware As A Service Market Market Revenue (US$ Mn) Comparison by By Hardware Model (2016-2032)
- Table 9: Global Hardware As A Service Market Market Revenue (US$ Mn) Comparison by By Enterprise Size (2016-2032)
- Table 10: Global Hardware As A Service Market Market Revenue (US$ Mn) Comparison by By Deployment Model (2016-2032)
- Table 11: Global Hardware As A Service Market Market Revenue (US$ Mn) Comparison by By End User (2016-2032)
- Table 12: Global Hardware As A Service Market Market Y-o-Y Growth Rate Comparison by Region (2016-2032)
- Table 13: Global Hardware As A Service Market Market Y-o-Y Growth Rate Comparison by By Hardware Model (2016-2032)
- Table 14: Global Hardware As A Service Market Market Y-o-Y Growth Rate Comparison by By Enterprise Size (2016-2032)
- Table 15: Global Hardware As A Service Market Market Y-o-Y Growth Rate Comparison by By Deployment Model (2016-2032)
- Table 16: Global Hardware As A Service Market Market Y-o-Y Growth Rate Comparison by By End User (2016-2032)
- Table 17: Global Hardware As A Service Market Market Share Comparison by Region (2016-2032)
- Table 18: Global Hardware As A Service Market Market Share Comparison by By Hardware Model (2016-2032)
- Table 19: Global Hardware As A Service Market Market Share Comparison by By Enterprise Size (2016-2032)
- Table 20: Global Hardware As A Service Market Market Share Comparison by By Deployment Model (2016-2032)
- Table 21: Global Hardware As A Service Market Market Share Comparison by By End User (2016-2032)
- Table 22: North America Hardware As A Service Market Market Comparison by By Enterprise Size (2016-2032)
- Table 23: North America Hardware As A Service Market Market Comparison by By Deployment Model (2016-2032)
- Table 24: North America Hardware As A Service Market Market Comparison by By End User (2016-2032)
- Table 25: North America Hardware As A Service Market Revenue (US$ Mn) Comparison by Country (2016-2032)
- Table 26: North America Hardware As A Service Market Market Revenue (US$ Mn) (2016-2032)
- Table 27: North America Hardware As A Service Market Market Revenue (US$ Mn) Comparison by Country (2016-2032)
- Table 28: North America Hardware As A Service Market Market Revenue (US$ Mn) Comparison by By Hardware Model (2016-2032)
- Table 29: North America Hardware As A Service Market Market Revenue (US$ Mn) Comparison by By Enterprise Size (2016-2032)
- Table 30: North America Hardware As A Service Market Market Revenue (US$ Mn) Comparison by By Deployment Model (2016-2032)
- Table 31: North America Hardware As A Service Market Market Revenue (US$ Mn) Comparison by By End User (2016-2032)
- Table 32: North America Hardware As A Service Market Market Y-o-Y Growth Rate Comparison by Country (2016-2032)
- Table 33: North America Hardware As A Service Market Market Y-o-Y Growth Rate Comparison by By Hardware Model (2016-2032)
- Table 34: North America Hardware As A Service Market Market Y-o-Y Growth Rate Comparison by By Enterprise Size (2016-2032)
- Table 35: North America Hardware As A Service Market Market Y-o-Y Growth Rate Comparison by By Deployment Model (2016-2032)
- Table 36: North America Hardware As A Service Market Market Y-o-Y Growth Rate Comparison by By End User (2016-2032)
- Table 37: North America Hardware As A Service Market Market Share Comparison by Country (2016-2032)
- Table 38: North America Hardware As A Service Market Market Share Comparison by By Hardware Model (2016-2032)
- Table 39: North America Hardware As A Service Market Market Share Comparison by By Enterprise Size (2016-2032)
- Table 40: North America Hardware As A Service Market Market Share Comparison by By Deployment Model (2016-2032)
- Table 41: North America Hardware As A Service Market Market Share Comparison by By End User (2016-2032)
- Table 42: Western Europe Hardware As A Service Market Market Comparison by By Hardware Model (2016-2032)
- Table 43: Western Europe Hardware As A Service Market Market Comparison by By Enterprise Size (2016-2032)
- Table 44: Western Europe Hardware As A Service Market Market Comparison by By Deployment Model (2016-2032)
- Table 45: Western Europe Hardware As A Service Market Market Comparison by By End User (2016-2032)
- Table 46: Western Europe Hardware As A Service Market Revenue (US$ Mn) Comparison by Country (2016-2032)
- Table 47: Western Europe Hardware As A Service Market Market Revenue (US$ Mn) (2016-2032)
- Table 48: Western Europe Hardware As A Service Market Market Revenue (US$ Mn) Comparison by Country (2016-2032)
- Table 49: Western Europe Hardware As A Service Market Market Revenue (US$ Mn) Comparison by By Hardware Model (2016-2032)
- Table 50: Western Europe Hardware As A Service Market Market Revenue (US$ Mn) Comparison by By Enterprise Size (2016-2032)
- Table 51: Western Europe Hardware As A Service Market Market Revenue (US$ Mn) Comparison by By Deployment Model (2016-2032)
- Table 52: Western Europe Hardware As A Service Market Market Revenue (US$ Mn) Comparison by By End User (2016-2032)
- Table 53: Western Europe Hardware As A Service Market Market Y-o-Y Growth Rate Comparison by Country (2016-2032)
- Table 54: Western Europe Hardware As A Service Market Market Y-o-Y Growth Rate Comparison by By Hardware Model (2016-2032)
- Table 55: Western Europe Hardware As A Service Market Market Y-o-Y Growth Rate Comparison by By Enterprise Size (2016-2032)
- Table 56: Western Europe Hardware As A Service Market Market Y-o-Y Growth Rate Comparison by By Deployment Model (2016-2032)
- Table 57: Western Europe Hardware As A Service Market Market Y-o-Y Growth Rate Comparison by By End User (2016-2032)
- Table 58: Western Europe Hardware As A Service Market Market Share Comparison by Country (2016-2032)
- Table 59: Western Europe Hardware As A Service Market Market Share Comparison by By Hardware Model (2016-2032)
- Table 60: Western Europe Hardware As A Service Market Market Share Comparison by By Enterprise Size (2016-2032)
- Table 61: Western Europe Hardware As A Service Market Market Share Comparison by By Deployment Model (2016-2032)
- Table 62: Western Europe Hardware As A Service Market Market Share Comparison by By End User (2016-2032)
- Table 63: Eastern Europe Hardware As A Service Market Market Comparison by By Hardware Model (2016-2032)
- Table 64: Eastern Europe Hardware As A Service Market Market Comparison by By Enterprise Size (2016-2032)
- Table 65: Eastern Europe Hardware As A Service Market Market Comparison by By Deployment Model (2016-2032)
- Table 66: Eastern Europe Hardware As A Service Market Market Comparison by By End User (2016-2032)
- Table 67: Eastern Europe Hardware As A Service Market Revenue (US$ Mn) Comparison by Country (2016-2032)
- Table 68: Eastern Europe Hardware As A Service Market Market Revenue (US$ Mn) (2016-2032)
- Table 69: Eastern Europe Hardware As A Service Market Market Revenue (US$ Mn) Comparison by Country (2016-2032)
- Table 70: Eastern Europe Hardware As A Service Market Market Revenue (US$ Mn) Comparison by By Hardware Model (2016-2032)
- Table 71: Eastern Europe Hardware As A Service Market Market Revenue (US$ Mn) Comparison by By Enterprise Size (2016-2032)
- Table 72: Eastern Europe Hardware As A Service Market Market Revenue (US$ Mn) Comparison by By Deployment Model (2016-2032)
- Table 73: Eastern Europe Hardware As A Service Market Market Revenue (US$ Mn) Comparison by By End User (2016-2032)
- Table 74: Eastern Europe Hardware As A Service Market Market Y-o-Y Growth Rate Comparison by Country (2016-2032)
- Table 75: Eastern Europe Hardware As A Service Market Market Y-o-Y Growth Rate Comparison by By Hardware Model (2016-2032)
- Table 76: Eastern Europe Hardware As A Service Market Market Y-o-Y Growth Rate Comparison by By Enterprise Size (2016-2032)
- Table 77: Eastern Europe Hardware As A Service Market Market Y-o-Y Growth Rate Comparison by By Deployment Model (2016-2032)
- Table 78: Eastern Europe Hardware As A Service Market Market Y-o-Y Growth Rate Comparison by By End User (2016-2032)
- Table 79: Eastern Europe Hardware As A Service Market Market Share Comparison by Country (2016-2032)
- Table 80: Eastern Europe Hardware As A Service Market Market Share Comparison by By Hardware Model (2016-2032)
- Table 81: Eastern Europe Hardware As A Service Market Market Share Comparison by By Enterprise Size (2016-2032)
- Table 82: Eastern Europe Hardware As A Service Market Market Share Comparison by By Deployment Model (2016-2032)
- Table 83: Eastern Europe Hardware As A Service Market Market Share Comparison by By End User (2016-2032)
- Table 84: APAC Hardware As A Service Market Market Comparison by By Hardware Model (2016-2032)
- Table 85: APAC Hardware As A Service Market Market Comparison by By Enterprise Size (2016-2032)
- Table 86: APAC Hardware As A Service Market Market Comparison by By Deployment Model (2016-2032)
- Table 87: APAC Hardware As A Service Market Market Comparison by By End User (2016-2032)
- Table 88: APAC Hardware As A Service Market Revenue (US$ Mn) Comparison by Country (2016-2032)
- Table 89: APAC Hardware As A Service Market Market Revenue (US$ Mn) (2016-2032)
- Table 90: APAC Hardware As A Service Market Market Revenue (US$ Mn) Comparison by Country (2016-2032)
- Table 91: APAC Hardware As A Service Market Market Revenue (US$ Mn) Comparison by By Hardware Model (2016-2032)
- Table 92: APAC Hardware As A Service Market Market Revenue (US$ Mn) Comparison by By Enterprise Size (2016-2032)
- Table 93: APAC Hardware As A Service Market Market Revenue (US$ Mn) Comparison by By Deployment Model (2016-2032)
- Table 94: APAC Hardware As A Service Market Market Revenue (US$ Mn) Comparison by By End User (2016-2032)
- Table 95: APAC Hardware As A Service Market Market Y-o-Y Growth Rate Comparison by Country (2016-2032)
- Table 96: APAC Hardware As A Service Market Market Y-o-Y Growth Rate Comparison by By Hardware Model (2016-2032)
- Table 97: APAC Hardware As A Service Market Market Y-o-Y Growth Rate Comparison by By Enterprise Size (2016-2032)
- Table 98: APAC Hardware As A Service Market Market Y-o-Y Growth Rate Comparison by By Deployment Model (2016-2032)
- Table 99: APAC Hardware As A Service Market Market Y-o-Y Growth Rate Comparison by By End User (2016-2032)
- Table 100: APAC Hardware As A Service Market Market Share Comparison by Country (2016-2032)
- Table 101: APAC Hardware As A Service Market Market Share Comparison by By Hardware Model (2016-2032)
- Table 102: APAC Hardware As A Service Market Market Share Comparison by By Enterprise Size (2016-2032)
- Table 103: APAC Hardware As A Service Market Market Share Comparison by By Deployment Model (2016-2032)
- Table 104: APAC Hardware As A Service Market Market Share Comparison by By End User (2016-2032)
- Table 105: Latin America Hardware As A Service Market Market Comparison by By Hardware Model (2016-2032)
- Table 106: Latin America Hardware As A Service Market Market Comparison by By Enterprise Size (2016-2032)
- Table 107: Latin America Hardware As A Service Market Market Comparison by By Deployment Model (2016-2032)
- Table 108: Latin America Hardware As A Service Market Market Comparison by By End User (2016-2032)
- Table 109: Latin America Hardware As A Service Market Revenue (US$ Mn) Comparison by Country (2016-2032)
- Table 110: Latin America Hardware As A Service Market Market Revenue (US$ Mn) (2016-2032)
- Table 111: Latin America Hardware As A Service Market Market Revenue (US$ Mn) Comparison by Country (2016-2032)
- Table 112: Latin America Hardware As A Service Market Market Revenue (US$ Mn) Comparison by By Hardware Model (2016-2032)
- Table 113: Latin America Hardware As A Service Market Market Revenue (US$ Mn) Comparison by By Enterprise Size (2016-2032)
- Table 114: Latin America Hardware As A Service Market Market Revenue (US$ Mn) Comparison by By Deployment Model (2016-2032)
- Table 115: Latin America Hardware As A Service Market Market Revenue (US$ Mn) Comparison by By End User (2016-2032)
- Table 116: Latin America Hardware As A Service Market Market Y-o-Y Growth Rate Comparison by Country (2016-2032)
- Table 117: Latin America Hardware As A Service Market Market Y-o-Y Growth Rate Comparison by By Hardware Model (2016-2032)
- Table 118: Latin America Hardware As A Service Market Market Y-o-Y Growth Rate Comparison by By Enterprise Size (2016-2032)
- Table 119: Latin America Hardware As A Service Market Market Y-o-Y Growth Rate Comparison by By Deployment Model (2016-2032)
- Table 120: Latin America Hardware As A Service Market Market Y-o-Y Growth Rate Comparison by By End User (2016-2032)
- Table 121: Latin America Hardware As A Service Market Market Share Comparison by Country (2016-2032)
- Table 122: Latin America Hardware As A Service Market Market Share Comparison by By Hardware Model (2016-2032)
- Table 123: Latin America Hardware As A Service Market Market Share Comparison by By Enterprise Size (2016-2032)
- Table 124: Latin America Hardware As A Service Market Market Share Comparison by By Deployment Model (2016-2032)
- Table 125: Latin America Hardware As A Service Market Market Share Comparison by By End User (2016-2032)
- Table 126: Middle East & Africa Hardware As A Service Market Market Comparison by By Hardware Model (2016-2032)
- Table 127: Middle East & Africa Hardware As A Service Market Market Comparison by By Enterprise Size (2016-2032)
- Table 128: Middle East & Africa Hardware As A Service Market Market Comparison by By Deployment Model (2016-2032)
- Table 129: Middle East & Africa Hardware As A Service Market Market Comparison by By End User (2016-2032)
- Table 130: Middle East & Africa Hardware As A Service Market Revenue (US$ Mn) Comparison by Country (2016-2032)
- Table 131: Middle East & Africa Hardware As A Service Market Market Revenue (US$ Mn) (2016-2032)
- Table 132: Middle East & Africa Hardware As A Service Market Market Revenue (US$ Mn) Comparison by Country (2016-2032)
- Table 133: Middle East & Africa Hardware As A Service Market Market Revenue (US$ Mn) Comparison by By Hardware Model (2016-2032)
- Table 134: Middle East & Africa Hardware As A Service Market Market Revenue (US$ Mn) Comparison by By Enterprise Size (2016-2032)
- Table 135: Middle East & Africa Hardware As A Service Market Market Revenue (US$ Mn) Comparison by By Deployment Model (2016-2032)
- Table 136: Middle East & Africa Hardware As A Service Market Market Revenue (US$ Mn) Comparison by By End User (2016-2032)
- Table 137: Middle East & Africa Hardware As A Service Market Market Y-o-Y Growth Rate Comparison by Country (2016-2032)
- Table 138: Middle East & Africa Hardware As A Service Market Market Y-o-Y Growth Rate Comparison by By Hardware Model (2016-2032)
- Table 139: Middle East & Africa Hardware As A Service Market Market Y-o-Y Growth Rate Comparison by By Enterprise Size (2016-2032)
- Table 140: Middle East & Africa Hardware As A Service Market Market Y-o-Y Growth Rate Comparison by By Deployment Model (2016-2032)
- Table 141: Middle East & Africa Hardware As A Service Market Market Y-o-Y Growth Rate Comparison by By End User (2016-2032)
- Table 142: Middle East & Africa Hardware As A Service Market Market Share Comparison by Country (2016-2032)
- Table 143: Middle East & Africa Hardware As A Service Market Market Share Comparison by By Hardware Model (2016-2032)
- Table 144: Middle East & Africa Hardware As A Service Market Market Share Comparison by By Enterprise Size (2016-2032)
- Table 145: Middle East & Africa Hardware As A Service Market Market Share Comparison by By Deployment Model (2016-2032)
- Table 146: Middle East & Africa Hardware As A Service Market Market Share Comparison by By End User (2016-2032)
- 1. Executive Summary
-
- Custard group
- Phoenix NAP
- Dell Inc.
- Design Data Systems, Inc.
- FUSE3 Communications
- Ingram Micro
- ITque, Inc.
- Amazon.com
- MasterIT, LLC
- Managed IT Solutions
- Microsoft Corporation
- Navitas Lease Corp.
- ZNet Technologies Pvt. Ltd.
- Fujitsu Ltd
- Lenovo Group
- Machado Consulting
Our Clients


View Our Licence Options
