
Green Finance Market Report By Type (Green Bonds, Green Loans, Green Investment Funds, Sustainability-Linked Financial Instruments), By Industry Vertical (Renewable Energy, Sustainable Agriculture, Green Real Estate, Environmental Technology), By End-User (Commercial Banks, Investment Banks, Asset Management Firms, Insurance Companies), By Region and Companies - Industry Segment Outlook, Market Assessment, Competition Scenario, Trends and Forecast 2024-2033
-
44705
-
April 2024
-
280
-


-
This report was compiled by Research Team Research team of over 50 passionate professionals leverages advanced research methodologies and analytical expertise to deliver insightful, data-driven market intelligence that empowers businesses across diverse industries to make strategic, well-informed Correspondence Research Team Linkedin | Detailed Market research Methodology Our methodology involves a mix of primary research, including interviews with leading mental health experts, and secondary research from reputable medical journals and databases. View Detailed Methodology Page
-
Quick Navigation
Report Overview
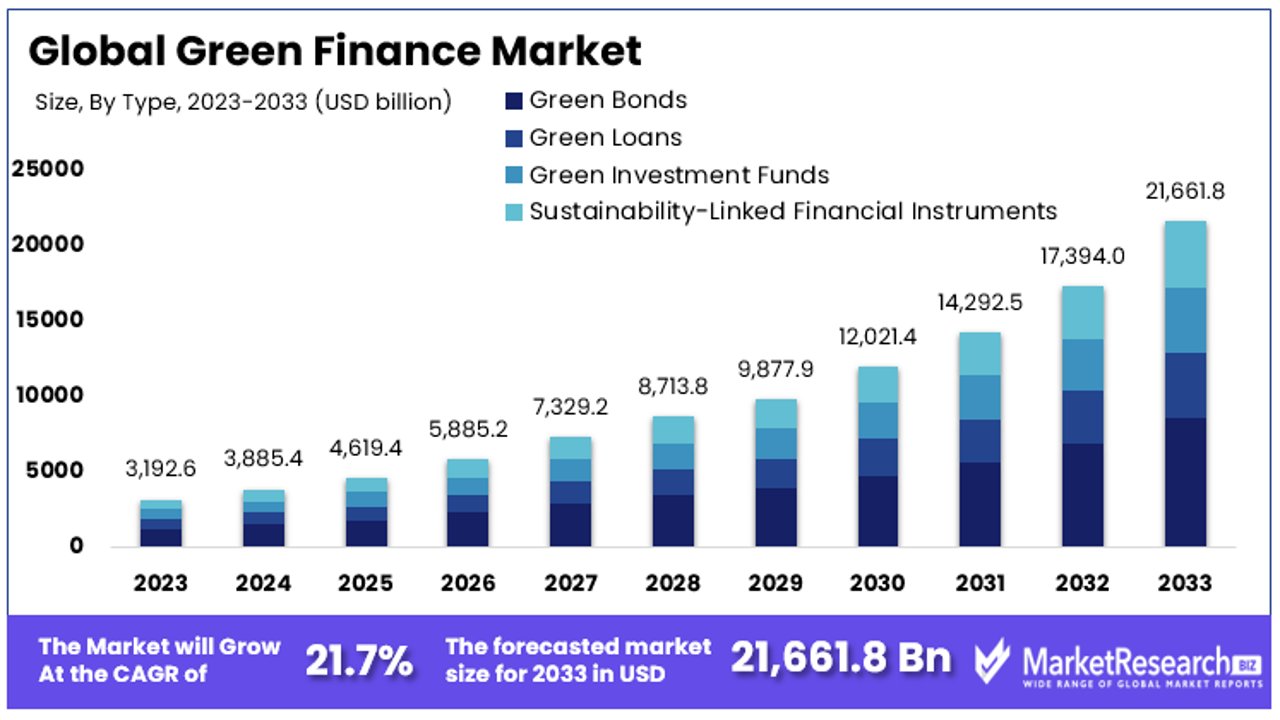
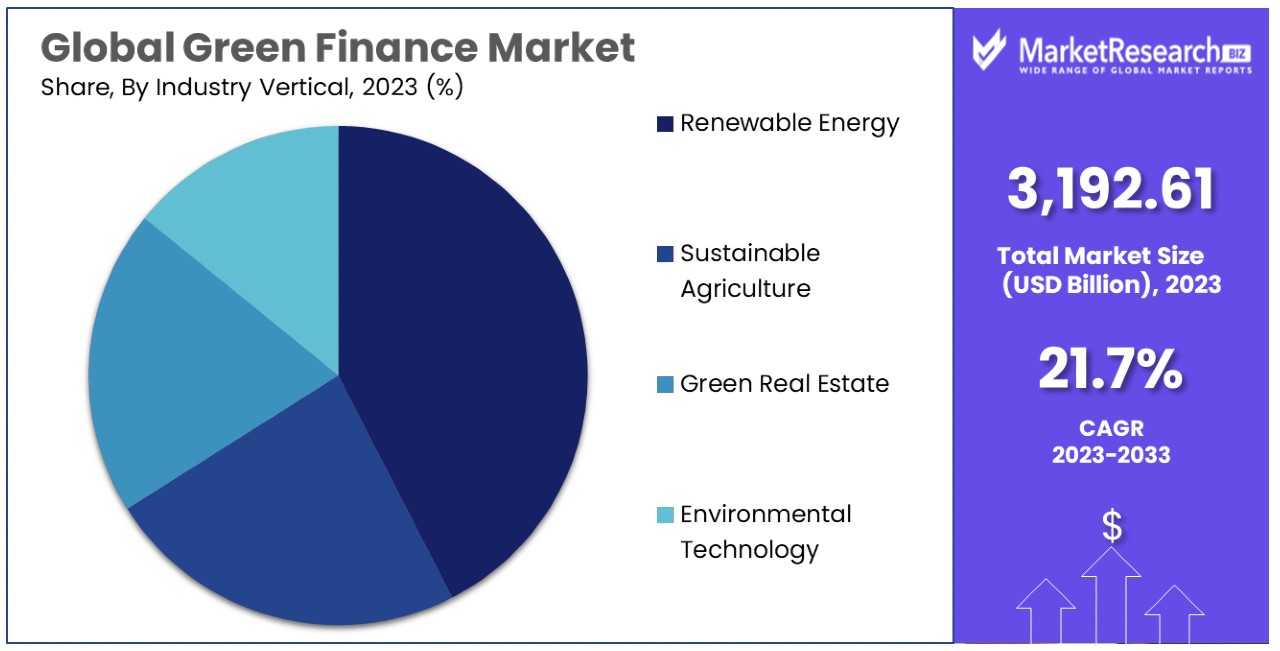
The Global Green Finance Market size is expected to be worth around USD 21,661.8 Billion by 2033, from USD 3,192.61 Billion in 2023, growing at a CAGR of 21.70% during the forecast period from 2024 to 2033.
Green finance refers to the financial investments flowing into sustainable development projects and initiatives that support environmental and climate-related objectives. This market prioritizes investments in renewable energy, energy efficiency, water management, and clean transportation sectors, among others.
Geen finance represents an opportunity to drive growth through sustainable practices, enhance brand reputation, and comply with global environmental standards. By allocating resources to green finance, companies can achieve competitive advantages, mitigate risks associated with climate change, and capitalize on the increasing demand for environmentally responsible operations.
The Green Finance Market is experiencing unprecedented growth, driven significantly by heightened global awareness and policy responses to environmental challenges. Since the Paris Agreement, the commitment to climate-conscious investments has accelerated, exemplified by a 317% increase in green financial measures.
This surge is underpinned by robust policy frameworks, with the Green Finance Platform's Green Finance Measures Database reporting 100 new policy and regulatory measures in 2022 alone. The cumulative impact of these 784 national and sub-national measures underscores a shifting paradigm in financial markets, towards prioritizing sustainable economic practices.
This dynamic expansion offers substantial opportunities for market participants. Financial institutions, investors, and corporations are increasingly aligning their strategies with green finance principles to capitalize on the growing demand for sustainable investment options.
This alignment not only mitigates risks associated with climate change but also enhances brand reputation and opens new avenues for growth. The implementation of regulatory measures further supports this trend by providing a more structured and secure investment environment, encouraging more stakeholders to commit to green finance initiatives.
The Green Finance Market is poised for robust growth. The ongoing development and enforcement of supportive policies are likely to foster more innovative financial products and services that cater to environmental sustainability. For executives, understanding these trends is crucial for strategizing investments and operations to leverage the advantages that green finance offers. The market's growth potential, backed by a strong regulatory framework, presents a compelling case for increased engagement in green finance initiatives.
Key Takeaways
- Market Value Projection: The Global Green Finance Market is anticipated to reach USD 21,661.8 Billion by 2033, exhibiting a remarkable growth trajectory from USD 3,192.61 Billion in 2023, with a CAGR of 21.70% during 2024-2033.
- Dominant Market Segments:
- Green Bonds command a significant 40% market share, facilitating capital raising for projects with environmental benefits.
- Renewable Energy stands as the leading industry vertical, holding a 45% market share, vital for global sustainability efforts.
- Commercial Banks dominate end-user engagement, occupying a 38% market share, leveraging their significant role in providing capital for green projects.
- Regional Dynamics:
- Europe leads with a 35% market share, driven by stringent environmental policies and extensive regulatory frameworks.
- North America witnesses an increasing focus on sustainable investments, while Asia-Pacific experiences rapid growth propelled by policy support and rising environmental awareness.
- Key Players and Analyst Viewpoint:
- Major players like JP Morgan Chase & Co., Bank of America Corporation, and CitiGroup Inc. shape investment strategies and fund eco-friendly projects.
- Analysts emphasize the substantial opportunities arising from climate risk quantification, mainstreaming ESG investing, and government policies, urging market participants to align strategies accordingly.
- Growth Opportunities:
- Developing methodologies for climate risk measurement presents growth potential, fostering informed green financing decisions.
- Mainstreaming ESG investing drives capital influx into green assets and companies, fueling market expansion and innovation.
- Recent Developments: Initiatives like the ADB-BII partnership in Asia and the Pacific and the Tesco-NatWest scheme in the UK underscore the increasing momentum towards green finance globally.
Driving Factors
Climate Awareness Drives Market Growth
Consumers, corporations, and investors are increasingly cognizant of the financial and societal repercussions climate change poses. With global greenhouse gas emissions still on the rise, as evidenced by a marginal increase in the second quarter of 2023, the urgency for effective solutions is evident.
A study by CDP highlights this urgency, revealing that 215 of the world's largest companies face nearly $1 trillion in climate-related risks, affecting everything from food supplies to economic productivity. This awareness fuels the demand for green finance products that support sustainability initiatives. The understanding of these risks is becoming more widespread, driving innovation and investment in sustainable projects and products.
Policy Incentives Fuel Market Expansion
Numerous governments are implementing regulations, subsidies, and incentives to foster sustainable finance and investments, with strategies ranging from carbon pricing schemes to renewable energy targets.
A pivotal move by the U.S. Securities and Exchange Commission (SEC) to require publicly traded companies to disclose climate change-related financial risks exemplifies the trend towards transparency and accountability. These regulatory measures not only promote the adoption of green financial practices but also ensure that investors and consumers are well-informed about the environmental and financial implications of their decisions.
Innovative Financial Products Spur Market Growth
Institutions like Equinix are at the forefront, issuing $1.2 billion in green bonds and engaging in significant renewable energy commitments through Power Purchase Agreements (PPAs). These efforts, resulting in substantial CO2e reductions, exemplify the market's shift towards sustainability. Additionally, the emergence of Sustainability-linked Loans (SLLs) and climate risk insurance addresses the urgent need for financial mechanisms that support environmental objectives.
These innovative products not only meet the increasing demand for green finance but also encourage other institutions to develop similar offerings. As the market continues to evolve, these products will likely become more prevalent, further driving growth and encouraging a shift towards a more sustainable and resilient financial system.
Restraining Factors
Perceived Higher Costs Deter Investment in Green Finance Market
Perceived higher costs are a significant factor restraining the growth of the Green Finance Market. Many sustainable projects and assets, such as renewable energy installations, initially require more capital than their conventional counterparts. Even as the cost of green technologies decreases, the perception of high expense persists, especially in emerging markets where financial resources are scarcer.
For instance, while renewable energy is becoming more cost-competitive, it often still relies on subsidies or incentives, making it less attractive to investors seeking immediate, high returns without long-term commitment, thus deterring substantial investment in green projects.
Limited Track Record Creates Uncertainty in Green Finance Market
Unlike conventional assets with a long history of performance data, green investments like green bonds or sustainable funds lack extensive records. This absence makes it challenging to assess their risk and return profiles accurately, leading to valuation difficulties and investment uncertainty.
For example, projecting future cash flows and understanding the long-term benefits of investing in a new category like green bonds can be daunting for investors accustomed to the predictable patterns of traditional markets, making them hesitant to allocate significant capital to green finance.
Type Analysis
Green Bonds Lead Green Finance Market with 40% Share, Driven by Sustainable Project Funding
Green Bonds are the dominant segment in the Green Finance Market, holding a 40% market share. The popularity of Green Bonds stems from their role in raising capital for projects with environmental benefits. These bonds have become pivotal in funding sustainable initiatives, particularly in sectors like renewable energy, green buildings, and sustainable transport.
An example of this trend is Societe Generale’s issuance of its first digital green bond in November 2023. This bond, registered on the Ethereum blockchain by SG-FORGE, exemplifies the innovative approach to enhancing transparency and traceability in green financing. The use of blockchain technology in this context marks a significant step towards more accountable and transparent environmental, social, and governance (ESG) investments and green bonds.
Other segments like Green Loans, Green Investment Funds, and Sustainability-Linked Financial Instruments also contribute to green finance, but Green Bonds lead the way in channeling large-scale investments into sustainable development projects.
Industry Vertical Analysis
Renewable Energy Sector Commands 45% Market Share in Green Finance, Driving Global Sustainability Efforts
In the Green Finance Market, the Renewable Energy sector is the leading industry vertical, commanding a 45% market share. The sector’s dominance is driven by the global shift towards sustainable energy sources to combat climate change and reduce greenhouse gas emissions. Green finance plays a crucial role in funding renewable energy projects, including solar, wind, hydroelectric, and biomass energy. These investments are essential for developing new renewable energy technologies and expanding existing capacity to meet rising global energy demand sustainably.
Other important sectors include Sustainable Agriculture, Green Real Estate, and Environmental Technology. Each of these sectors leverages green finance to implement sustainable practices and technologies, but Renewable Energy stands out due to its critical role in the global transition to a low-carbon economy and its substantial capital requirements for development and expansion.
End-User Analysis
Commercial Banks Dominate Green Finance Market with 38% Share, Fueling Sustainable Development Initiatives
Commercial Banks are the predominant end-user in the Green Finance Market, holding a 38% market share. Their dominant position is attributed to their significant role in providing capital for green projects through various financial instruments, including green bonds and loans. Commercial banks are increasingly committing to sustainable financing, recognizing both the environmental necessity and the business opportunity it presents. This commitment is evident in their growing portfolio of green finance products aimed at supporting sustainable development initiatives.
Investment Banks, Asset Management Firms, and Insurance Companies are also key players in the green finance landscape. Investment banks facilitate the issuance of green bonds and other sustainable investments, asset management firms incorporate ESG criteria into their investment strategies, and insurance companies invest in and underwrite green projects. However, commercial banks’ extensive networks and capital resources position them as the leading facilitators of green finance.
Key Market Segments
By Type
- Green Bonds
- Green Loans
- Green Investment Funds
- Sustainability-Linked Financial Instruments
By Industry Vertical
- Renewable Energy
- Sustainable Agriculture
- Green Real Estate
- Environmental Technology
By End-User
- Commercial Banks
- Investment Banks
- Asset Management Firms
- Insurance Companies
Growth Opportunities
Climate Risk Quantification Catalyzes Green Finance Growth
The development of new methodologies to measure climate and carbon risks presents a significant growth opportunity in the Green Finance Market. As the financial sector recognizes the need to understand and mitigate climate-related risks, there's an increasing demand for robust, data-driven approaches to quantifying these risks.
This demand spurs investments in climate mitigation and adaptation projects. The current pain point is the lack of comprehensive data and advanced modeling capabilities. However, as these tools evolve and become more sophisticated, they will enable more informed, risk-adjusted green financing decisions, driving growth in the market.
Mainstreaming ESG Investing Fuels Expansion in Green Finance
The surging demand for ESG (Environmental, Social, and Governance) investment strategies is mainstreaming capital into green assets and companies, offering a substantial growth opportunity for the Green Finance Market. Investors are increasingly seeking opportunities that align with sustainability and social responsibility values.
For instance, ABN AMRO Corporate Investments' strategic investment in SET Fund IV in January 2024 exemplifies how mainstream financial institutions are directing funds towards initiatives that drive the energy transition to a zero-carbon society. This trend of mainstreaming ESG investing not only channels more capital into green projects but also promotes a broader shift in the market towards sustainable and ethical investment practices.
Trending Factors
Government Policies and Regulations Are Trending Factors
Government initiatives are foundational to the expansion of the Green Finance Market. These policies not only incentivize but also mandate the adoption of sustainable practices. For example, the European Union’s Green Deal, targeting carbon neutrality by 2050, has catalyzed an uptick in green investments across Europe. Financial incentives like tax breaks and subsidized loan terms are pivotal, making green projects more appealing and financially viable.
As a result, there is a discernible increase in the issuance of green bonds and investments in renewable projects. The ongoing refinement of these policies is anticipated to perpetually drive the market's growth, as governments remain steadfast in their commitment to environmental sustainability.
Corporate Sustainability Initiatives Are Trending Factors
Corporate commitment to sustainability is increasingly becoming a market differentiator in the Green Finance Market. Corporations like Apple, which have utilized green bonds to fund substantial renewable energy initiatives, exemplify this trend. Such actions not only reduce the carbon footprint but also bolster corporate reputations among environmentally conscious consumers and investors.
The rise in sustainability-linked financial products evidences this shift; these instruments allow companies to capitalize financially on their commitment to sustainability. As public and investor demand for environmentally responsible conduct escalates, more companies are likely to engage in green finance, propelling market expansion and innovation in green technologies and sustainable business practices.
Regional Analysis
Europe Dominates with 35% Market Share in Green Finance Market
Europe's substantial 35% share of the Green Finance Market is driven by its strong commitment to sustainability and climate goals. The European Investment Bank's significant issuance of EUR 19.9 billion in Climate and Sustainability Awareness Bonds in 2022, and the increase of its climate and sustainability funding portion from 21% in 2021 to 45% in 2022, highlight the region's aggressive approach towards financing green initiatives.
The region's stringent environmental policies, along with the high level of stakeholder awareness regarding climate change, drive the demand for green finance. Additionally, Europe's leadership in renewable energy and sustainable infrastructure projects necessitates substantial green financing.
The market dynamics in Europe are influenced by the region's comprehensive regulatory framework supporting green investments, including the EU Green Deal and various national strategies aimed at achieving carbon neutrality. The growing emphasis on Environmental, Social, and Governance (ESG) criteria in investment decisions and the active participation of private and public sectors in green financing are pivotal in driving the market.
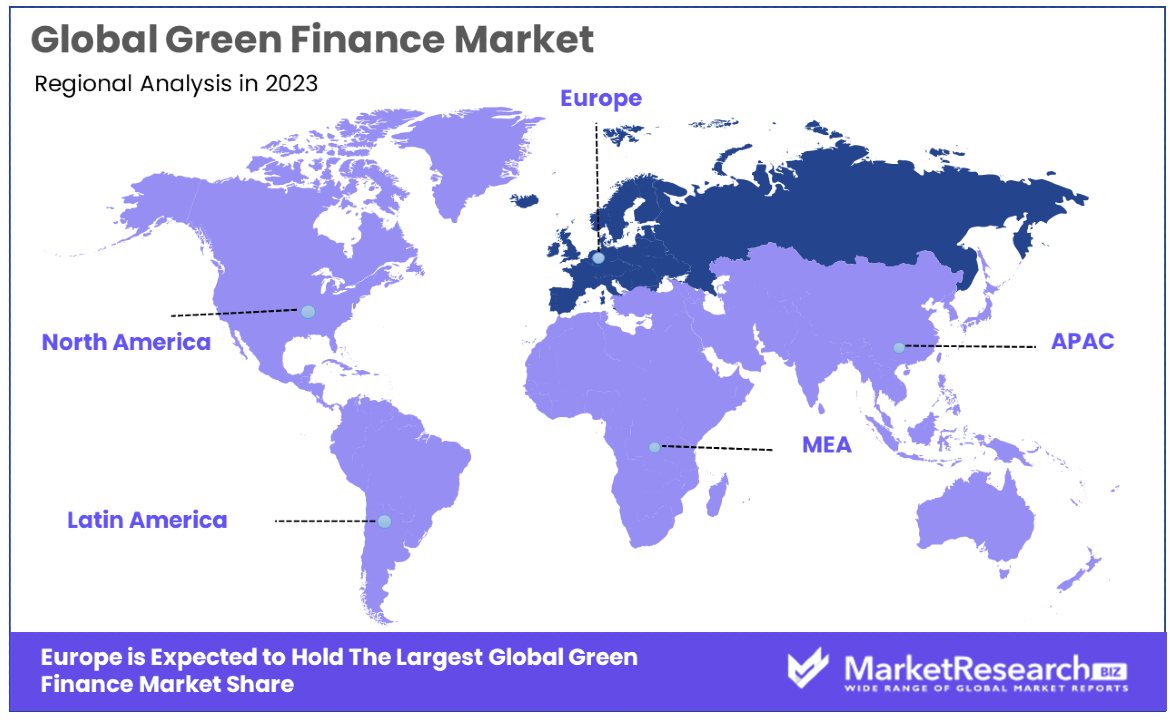
North America: Increasing Focus on Sustainable Investments
North America's Green Finance Market is driven by an increasing focus on sustainable investments and a growing recognition of climate-related financial risks. The United States and Canada are seeing a rise in green bonds issuance and sustainable asset funds, reflecting a shift towards environmentally responsible investing. The region's technological advancements and the private sector's commitment to reducing carbon footprints contribute to the growth of green finance.
Asia-Pacific: Rapid Growth and Policy SupportIn Asia-Pacific, the Green Finance Market is experiencing rapid growth due to strong policy support and increasing environmental awareness. Countries like China, Japan, and India are actively promoting green projects through various government initiatives and incentives. The rising urbanization and the need for sustainable infrastructure drive the demand for green financing. As the region continues to focus on economic development while addressing environmental concerns, Asia-Pacific is expected to witness substantial growth in the Green Finance Market.
Key Regions and Countries
- North America
- The US
- Canada
- Mexico
- Western Europe
- Germany
- France
- The UK
- Spain
- Italy
- Portugal
- Ireland
- Austria
- Switzerland
- Benelux
- Nordic
- Rest of Western Europe
- Eastern Europe
- Russia
- Poland
- The Czech Republic
- Greece
- Rest of Eastern Europe
- APAC
- China
- Japan
- South Korea
- India
- Australia & New Zealand
- Indonesia
- Malaysia
- Philippines
- Singapore
- Thailand
- Vietnam
- Rest of APAC
- Latin America
- Brazil
- Colombia
- Chile
- Argentina
- Costa Rica
- Rest of Latin America
- Middle East & Africa
- Algeria
- Egypt
- Israel
- Kuwait
- Nigeria
- Saudi Arabia
- South Africa
- Turkey
- United Arab Emirates
- Rest of MEA
Key Players Analysis
In the Green Finance Market, a critical sector for driving sustainable economic growth and environmental initiatives, the companies listed are instrumental in shaping investment strategies and funding eco-friendly projects. JP Morgan Chase & Co. and Bank of America Corporation are industry leaders, known for their significant commitments to financing renewable energy and sustainability projects. Their strategic positioning emphasizes corporate responsibility and innovative financial products, significantly influencing the flow of capital towards green initiatives.
CitiGroup Inc. and HSBC Holdings plc are key players with a strong focus on green bonds and sustainable investment portfolios, reflecting the industry's shift towards more environmentally and socially responsible banking practices. BlackRock, Inc. and UBS Group AG contribute with their extensive asset management services, offering green funds and strategies that cater to a growing demand for sustainable investment options.
BNP Paribas and Credit Agricole Group, recognized for their leadership in European green finance, play crucial roles in advancing sustainable finance on a global scale, showcasing the market's potential for comprehensive and integrated eco-financial solutions. Morgan Stanley and Goldman Sachs Group, Inc., with their robust advisory and investment services, demonstrate the industry's adaptability and commitment to funding renewable energy and clean technologies.
Market Key Players
- JP Morgan Chase & Co.
- Bank of America Corporation
- CitiGroup Inc.
- UBS Group AG
- BlackRock, Inc.
- BNP Paribas
- Morgan Stanley
- ING Group
- Credit Agricole Group
- HSBC Holdings plc
- Goldman Sachs Group, Inc.
- State Street Corporation
- Other Key Players
Recent Developments
- On January 18, 2024, the Asian Development Bank (ADB) and British International Investment (BII) initiated a new trade finance partnership to promote green trade in Asia and the Pacific. Managed by ADB’s Trade and Supply Chain Finance Program (TSCFP), this collaboration focuses on renewable energy, energy efficiency, and climate-smart agriculture to reduce reliance on fossil fuels.
- On February 21, 2024, CAF, FinDev Canada, and IDB Invest announced their commitment to strengthen climate action in Latin America and the Caribbean by supporting the region's first private credit climate finance fund. This collaboration, involving FinDev Canada, IDB Invest, and CAF, aims to mobilize both development finance and private institutional capital to support the provision of long-term financing.
- On March 28, 2024, Tesco and NatWest launched a discounted climate and sustainable finance scheme for 1,500 of Tesco's farmers, including the 600+ farmers in the UK. This partnership aims to provide discounted green finance options for farmers who wish to transition to more sustainable practices.
Report Scope
Report Features Description Market Value (2023) USD 3,192.61 Billion Forecast Revenue (2033) USD 21,661.8 Billion CAGR (2024-2033) 21.70% Base Year for Estimation 2023 Historic Period 2018-2023 Forecast Period 2024-2033 Report Coverage Revenue Forecast, Market Dynamics, Competitive Landscape, Recent Developments Segments Covered By Type (Green Bonds, Green Loans, Green Investment Funds, Sustainability-Linked Financial Instruments), By Industry Vertical (Renewable Energy, Sustainable Agriculture, Green Real Estate, Environmental Technology), By End-User (Commercial Banks, Investment Banks, Asset Management Firms, Insurance Companies) Regional Analysis North America - The US, Canada, & Mexico; Western Europe - Germany, France, The UK, Spain, Italy, Portugal, Ireland, Austria, Switzerland, Benelux, Nordic, & Rest of Western Europe; Eastern Europe - Russia, Poland, The Czech Republic, Greece, & Rest of Eastern Europe; APAC - China, Japan, South Korea, India, Australia & New Zealand, Indonesia, Malaysia, Philippines, Singapore, Thailand, Vietnam, & Rest of APAC; Latin America - Brazil, Colombia, Chile, Argentina, Costa Rica, & Rest of Latin America; Middle East & Africa - Algeria, Egypt, Israel, Kuwait, Nigeria, Saudi Arabia, South Africa, Turkey, United Arab Emirates, & Rest of MEA Competitive Landscape JP Morgan Chase & Co., Bank of America Corporation, CitiGroup Inc., UBS Group AG, BlackRock, Inc., BNP Paribas, Morgan Stanley, ING Group, Credit Agricole Group, HSBC Holdings plc, Goldman Sachs Group, Inc., State Street Corporation, Other Key Players Customization Scope Customization for segments, region/country-level will be provided. Moreover, additional customization can be done based on the requirements. Purchase Options We have three licenses to opt for: Single User License, Multi-User License (Up to 5 Users), Corporate Use License (Unlimited User and Printable PDF) -
- 1. Executive Summary
- 1.1. Definition
- 1.2. Taxonomy
- 1.3. Research Scope
- 1.4. Key Analysis
- 1.5. Key Findings by Major Segments
- 1.6. Top strategies by Major Players
- 2. Global Green Finance Market
Overview- 2.1. Green Finance Market
Dynamics- 2.1.1. Drivers
- 2.1.2. Opportunities
- 2.1.3. Restraints
- 2.1.4. Challenges
- 2.2. Macro-economic Factors
- 2.3. Regulatory Framework
- 2.4. Market Investment Feasibility Index
- 2.5. PEST Analysis
- 2.6. PORTER’S Five Force Analysis
- 2.7. Drivers & Restraints Impact Analysis
- 2.8. Industry Chain Analysis
- 2.9. Cost Structure Analysis
- 2.10. Marketing Strategy
- 2.11. Russia-Ukraine War Impact Analysis
- 2.12. Opportunity Map Analysis
- 2.13. Market Competition Scenario Analysis
- 2.14. Product Life Cycle Analysis
- 2.15. Opportunity Orbits
- 2.16. Manufacturer Intensity Map
- 2.17. Major Companies sales by Value & Volume
- 2.1. Green Finance Market
- 3. Global Green Finance Market
Analysis, Opportunity and Forecast, 2016-2032- 3.1. Global Green Finance Market
Analysis, 2016-2021 - 3.2. Global Green Finance Market
Opportunity and Forecast, 2023-2032 - 3.3. Global Green Finance Market
Analysis, Opportunity and Forecast, By Type, 2016-2032- 3.3.1. Global Green Finance Market
Analysis by Type: Introduction - 3.3.2. Market Size Absolute $ Opportunity Analysis and Forecast, By Type, 2016-2032
- 3.3.3. Green Bonds
- 3.3.4. Green Loans
- 3.3.5. Green Investment Funds
- 3.3.6. Sustainability-Linked Financial Instruments
- 3.3.1. Global Green Finance Market
- 3.4. Global Green Finance Market
Analysis, Opportunity and Forecast, By Industry Vertical, 2016-2032- 3.4.1. Global Green Finance Market
Analysis by Industry Vertical: Introduction - 3.4.2. Market Size Absolute $ Opportunity Analysis and Forecast, By Industry Vertical, 2016-2032
- 3.4.3. Renewable Energy
- 3.4.4. Sustainable Agriculture
- 3.4.5. Green Real Estate
- 3.4.6. Environmental Technology
- 3.4.1. Global Green Finance Market
- 3.5. Global Green Finance Market
Analysis, Opportunity and Forecast, By End-User, 2016-2032- 3.5.1. Global Green Finance Market
Analysis by End-User: Introduction - 3.5.2. Market Size Absolute $ Opportunity Analysis and Forecast, By End-User, 2016-2032
- 3.5.3. Commercial Banks
- 3.5.4. Investment Banks
- 3.5.5. Asset Management Firms
- 3.5.6. Insurance Companies
- 3.5.7. Green Finance Market
- 3.5.1. Global Green Finance Market
- 3.1. Global Green Finance Market
- 4. North America Green Finance Market
Analysis, Opportunity and Forecast, 2016-2032- 4.1. North America Green Finance Market
Analysis, 2016-2021 - 4.2. North America Green Finance Market
Opportunity and Forecast, 2023-2032 - 4.3. North America Green Finance Market
Analysis, Opportunity and Forecast, By Type, 2016-2032- 4.3.1. North America Green Finance Market
Analysis by Type: Introduction - 4.3.2. Market Size Absolute $ Opportunity Analysis and Forecast, By Type, 2016-2032
- 4.3.3. Green Bonds
- 4.3.4. Green Loans
- 4.3.5. Green Investment Funds
- 4.3.6. Sustainability-Linked Financial Instruments
- 4.3.1. North America Green Finance Market
- 4.4. North America Green Finance Market
Analysis, Opportunity and Forecast, By Industry Vertical, 2016-2032- 4.4.1. North America Green Finance Market
Analysis by Industry Vertical: Introduction - 4.4.2. Market Size Absolute $ Opportunity Analysis and Forecast, By Industry Vertical, 2016-2032
- 4.4.3. Renewable Energy
- 4.4.4. Sustainable Agriculture
- 4.4.5. Green Real Estate
- 4.4.6. Environmental Technology
- 4.4.1. North America Green Finance Market
- 4.5. North America Green Finance Market
Analysis, Opportunity and Forecast, By End-User, 2016-2032- 4.5.1. North America Green Finance Market
Analysis by End-User: Introduction - 4.5.2. Market Size Absolute $ Opportunity Analysis and Forecast, By End-User, 2016-2032
- 4.5.3. Commercial Banks
- 4.5.4. Investment Banks
- 4.5.5. Asset Management Firms
- 4.5.6. Insurance Companies
- 4.5.7. Green Finance Market
- 4.5.1. North America Green Finance Market
- 4.6. North America Green Finance Market
Analysis, Opportunity and Forecast, By Country , 2016-2032- 4.6.1. North America Green Finance Market
Analysis by Country : Introduction - 4.6.2. Market Size Absolute $ Opportunity Analysis and Forecast, Country , 2016-2032
- 4.6.2.1. The US
- 4.6.2.2. Canada
- 4.6.2.3. Mexico
- 4.6.1. North America Green Finance Market
- 4.1. North America Green Finance Market
- 5. Western Europe Green Finance Market
Analysis, Opportunity and Forecast, 2016-2032- 5.1. Western Europe Green Finance Market
Analysis, 2016-2021 - 5.2. Western Europe Green Finance Market
Opportunity and Forecast, 2023-2032 - 5.3. Western Europe Green Finance Market
Analysis, Opportunity and Forecast, By Type, 2016-2032- 5.3.1. Western Europe Green Finance Market
Analysis by Type: Introduction - 5.3.2. Market Size Absolute $ Opportunity Analysis and Forecast, By Type, 2016-2032
- 5.3.3. Green Bonds
- 5.3.4. Green Loans
- 5.3.5. Green Investment Funds
- 5.3.6. Sustainability-Linked Financial Instruments
- 5.3.1. Western Europe Green Finance Market
- 5.4. Western Europe Green Finance Market
Analysis, Opportunity and Forecast, By Industry Vertical, 2016-2032- 5.4.1. Western Europe Green Finance Market
Analysis by Industry Vertical: Introduction - 5.4.2. Market Size Absolute $ Opportunity Analysis and Forecast, By Industry Vertical, 2016-2032
- 5.4.3. Renewable Energy
- 5.4.4. Sustainable Agriculture
- 5.4.5. Green Real Estate
- 5.4.6. Environmental Technology
- 5.4.1. Western Europe Green Finance Market
- 5.5. Western Europe Green Finance Market
Analysis, Opportunity and Forecast, By End-User, 2016-2032- 5.5.1. Western Europe Green Finance Market
Analysis by End-User: Introduction - 5.5.2. Market Size Absolute $ Opportunity Analysis and Forecast, By End-User, 2016-2032
- 5.5.3. Commercial Banks
- 5.5.4. Investment Banks
- 5.5.5. Asset Management Firms
- 5.5.6. Insurance Companies
- 5.5.7. Green Finance Market
- 5.5.1. Western Europe Green Finance Market
- 5.6. Western Europe Green Finance Market
Analysis, Opportunity and Forecast, By Country , 2016-2032- 5.6.1. Western Europe Green Finance Market
Analysis by Country : Introduction - 5.6.2. Market Size Absolute $ Opportunity Analysis and Forecast, Country , 2016-2032
- 5.6.2.1. Germany
- 5.6.2.2. France
- 5.6.2.3. The UK
- 5.6.2.4. Spain
- 5.6.2.5. Italy
- 5.6.2.6. Portugal
- 5.6.2.7. Ireland
- 5.6.2.8. Austria
- 5.6.2.9. Switzerland
- 5.6.2.10. Benelux
- 5.6.2.11. Nordic
- 5.6.2.12. Rest of Western Europe
- 5.6.1. Western Europe Green Finance Market
- 5.1. Western Europe Green Finance Market
- 6. Eastern Europe Green Finance Market
Analysis, Opportunity and Forecast, 2016-2032- 6.1. Eastern Europe Green Finance Market
Analysis, 2016-2021 - 6.2. Eastern Europe Green Finance Market
Opportunity and Forecast, 2023-2032 - 6.3. Eastern Europe Green Finance Market
Analysis, Opportunity and Forecast, By Type, 2016-2032- 6.3.1. Eastern Europe Green Finance Market
Analysis by Type: Introduction - 6.3.2. Market Size Absolute $ Opportunity Analysis and Forecast, By Type, 2016-2032
- 6.3.3. Green Bonds
- 6.3.4. Green Loans
- 6.3.5. Green Investment Funds
- 6.3.6. Sustainability-Linked Financial Instruments
- 6.3.1. Eastern Europe Green Finance Market
- 6.4. Eastern Europe Green Finance Market
Analysis, Opportunity and Forecast, By Industry Vertical, 2016-2032- 6.4.1. Eastern Europe Green Finance Market
Analysis by Industry Vertical: Introduction - 6.4.2. Market Size Absolute $ Opportunity Analysis and Forecast, By Industry Vertical, 2016-2032
- 6.4.3. Renewable Energy
- 6.4.4. Sustainable Agriculture
- 6.4.5. Green Real Estate
- 6.4.6. Environmental Technology
- 6.4.1. Eastern Europe Green Finance Market
- 6.5. Eastern Europe Green Finance Market
Analysis, Opportunity and Forecast, By End-User, 2016-2032- 6.5.1. Eastern Europe Green Finance Market
Analysis by End-User: Introduction - 6.5.2. Market Size Absolute $ Opportunity Analysis and Forecast, By End-User, 2016-2032
- 6.5.3. Commercial Banks
- 6.5.4. Investment Banks
- 6.5.5. Asset Management Firms
- 6.5.6. Insurance Companies
- 6.5.7. Green Finance Market
- 6.5.1. Eastern Europe Green Finance Market
- 6.6. Eastern Europe Green Finance Market
Analysis, Opportunity and Forecast, By Country , 2016-2032- 6.6.1. Eastern Europe Green Finance Market
Analysis by Country : Introduction - 6.6.2. Market Size Absolute $ Opportunity Analysis and Forecast, Country , 2016-2032
- 6.6.2.1. Russia
- 6.6.2.2. Poland
- 6.6.2.3. The Czech Republic
- 6.6.2.4. Greece
- 6.6.2.5. Rest of Eastern Europe
- 6.6.1. Eastern Europe Green Finance Market
- 6.1. Eastern Europe Green Finance Market
- 7. APAC Green Finance Market
Analysis, Opportunity and Forecast, 2016-2032- 7.1. APAC Green Finance Market
Analysis, 2016-2021 - 7.2. APAC Green Finance Market
Opportunity and Forecast, 2023-2032 - 7.3. APAC Green Finance Market
Analysis, Opportunity and Forecast, By Type, 2016-2032- 7.3.1. APAC Green Finance Market
Analysis by Type: Introduction - 7.3.2. Market Size Absolute $ Opportunity Analysis and Forecast, By Type, 2016-2032
- 7.3.3. Green Bonds
- 7.3.4. Green Loans
- 7.3.5. Green Investment Funds
- 7.3.6. Sustainability-Linked Financial Instruments
- 7.3.1. APAC Green Finance Market
- 7.4. APAC Green Finance Market
Analysis, Opportunity and Forecast, By Industry Vertical, 2016-2032- 7.4.1. APAC Green Finance Market
Analysis by Industry Vertical: Introduction - 7.4.2. Market Size Absolute $ Opportunity Analysis and Forecast, By Industry Vertical, 2016-2032
- 7.4.3. Renewable Energy
- 7.4.4. Sustainable Agriculture
- 7.4.5. Green Real Estate
- 7.4.6. Environmental Technology
- 7.4.1. APAC Green Finance Market
- 7.5. APAC Green Finance Market
Analysis, Opportunity and Forecast, By End-User, 2016-2032- 7.5.1. APAC Green Finance Market
Analysis by End-User: Introduction - 7.5.2. Market Size Absolute $ Opportunity Analysis and Forecast, By End-User, 2016-2032
- 7.5.3. Commercial Banks
- 7.5.4. Investment Banks
- 7.5.5. Asset Management Firms
- 7.5.6. Insurance Companies
- 7.5.7. Green Finance Market
- 7.5.1. APAC Green Finance Market
- 7.6. APAC Green Finance Market
Analysis, Opportunity and Forecast, By Country , 2016-2032- 7.6.1. APAC Green Finance Market
Analysis by Country : Introduction - 7.6.2. Market Size Absolute $ Opportunity Analysis and Forecast, Country , 2016-2032
- 7.6.2.1. China
- 7.6.2.2. Japan
- 7.6.2.3. South Korea
- 7.6.2.4. India
- 7.6.2.5. Australia & New Zeland
- 7.6.2.6. Indonesia
- 7.6.2.7. Malaysia
- 7.6.2.8. Philippines
- 7.6.2.9. Singapore
- 7.6.2.10. Thailand
- 7.6.2.11. Vietnam
- 7.6.2.12. Rest of APAC
- 7.6.1. APAC Green Finance Market
- 7.1. APAC Green Finance Market
- 8. Latin America Green Finance Market
Analysis, Opportunity and Forecast, 2016-2032- 8.1. Latin America Green Finance Market
Analysis, 2016-2021 - 8.2. Latin America Green Finance Market
Opportunity and Forecast, 2023-2032 - 8.3. Latin America Green Finance Market
Analysis, Opportunity and Forecast, By Type, 2016-2032- 8.3.1. Latin America Green Finance Market
Analysis by Type: Introduction - 8.3.2. Market Size Absolute $ Opportunity Analysis and Forecast, By Type, 2016-2032
- 8.3.3. Green Bonds
- 8.3.4. Green Loans
- 8.3.5. Green Investment Funds
- 8.3.6. Sustainability-Linked Financial Instruments
- 8.3.1. Latin America Green Finance Market
- 8.4. Latin America Green Finance Market
Analysis, Opportunity and Forecast, By Industry Vertical, 2016-2032- 8.4.1. Latin America Green Finance Market
Analysis by Industry Vertical: Introduction - 8.4.2. Market Size Absolute $ Opportunity Analysis and Forecast, By Industry Vertical, 2016-2032
- 8.4.3. Renewable Energy
- 8.4.4. Sustainable Agriculture
- 8.4.5. Green Real Estate
- 8.4.6. Environmental Technology
- 8.4.1. Latin America Green Finance Market
- 8.5. Latin America Green Finance Market
Analysis, Opportunity and Forecast, By End-User, 2016-2032- 8.5.1. Latin America Green Finance Market
Analysis by End-User: Introduction - 8.5.2. Market Size Absolute $ Opportunity Analysis and Forecast, By End-User, 2016-2032
- 8.5.3. Commercial Banks
- 8.5.4. Investment Banks
- 8.5.5. Asset Management Firms
- 8.5.6. Insurance Companies
- 8.5.7. Green Finance Market
- 8.5.1. Latin America Green Finance Market
- 8.6. Latin America Green Finance Market
Analysis, Opportunity and Forecast, By Country , 2016-2032- 8.6.1. Latin America Green Finance Market
Analysis by Country : Introduction - 8.6.2. Market Size Absolute $ Opportunity Analysis and Forecast, Country , 2016-2032
- 8.6.2.1. Brazil
- 8.6.2.2. Colombia
- 8.6.2.3. Chile
- 8.6.2.4. Argentina
- 8.6.2.5. Costa Rica
- 8.6.2.6. Rest of Latin America
- 8.6.1. Latin America Green Finance Market
- 8.1. Latin America Green Finance Market
- 9. Middle East & Africa Green Finance Market
Analysis, Opportunity and Forecast, 2016-2032- 9.1. Middle East & Africa Green Finance Market
Analysis, 2016-2021 - 9.2. Middle East & Africa Green Finance Market
Opportunity and Forecast, 2023-2032 - 9.3. Middle East & Africa Green Finance Market
Analysis, Opportunity and Forecast, By Type, 2016-2032- 9.3.1. Middle East & Africa Green Finance Market
Analysis by Type: Introduction - 9.3.2. Market Size Absolute $ Opportunity Analysis and Forecast, By Type, 2016-2032
- 9.3.3. Green Bonds
- 9.3.4. Green Loans
- 9.3.5. Green Investment Funds
- 9.3.6. Sustainability-Linked Financial Instruments
- 9.3.1. Middle East & Africa Green Finance Market
- 9.4. Middle East & Africa Green Finance Market
Analysis, Opportunity and Forecast, By Industry Vertical, 2016-2032- 9.4.1. Middle East & Africa Green Finance Market
Analysis by Industry Vertical: Introduction - 9.4.2. Market Size Absolute $ Opportunity Analysis and Forecast, By Industry Vertical, 2016-2032
- 9.4.3. Renewable Energy
- 9.4.4. Sustainable Agriculture
- 9.4.5. Green Real Estate
- 9.4.6. Environmental Technology
- 9.4.1. Middle East & Africa Green Finance Market
- 9.5. Middle East & Africa Green Finance Market
Analysis, Opportunity and Forecast, By End-User, 2016-2032- 9.5.1. Middle East & Africa Green Finance Market
Analysis by End-User: Introduction - 9.5.2. Market Size Absolute $ Opportunity Analysis and Forecast, By End-User, 2016-2032
- 9.5.3. Commercial Banks
- 9.5.4. Investment Banks
- 9.5.5. Asset Management Firms
- 9.5.6. Insurance Companies
- 9.5.7. Green Finance Market
- 9.5.1. Middle East & Africa Green Finance Market
- 9.6. Middle East & Africa Green Finance Market
Analysis, Opportunity and Forecast, By Country , 2016-2032- 9.6.1. Middle East & Africa Green Finance Market
Analysis by Country : Introduction - 9.6.2. Market Size Absolute $ Opportunity Analysis and Forecast, Country , 2016-2032
- 9.6.2.1. Algeria
- 9.6.2.2. Egypt
- 9.6.2.3. Israel
- 9.6.2.4. Kuwait
- 9.6.2.5. Nigeria
- 9.6.2.6. Saudi Arabia
- 9.6.2.7. South Africa
- 9.6.2.8. Turkey
- 9.6.2.9. The UAE
- 9.6.2.10. Rest of MEA
- 9.6.1. Middle East & Africa Green Finance Market
- 9.1. Middle East & Africa Green Finance Market
- 10. Global Green Finance Market
Analysis, Opportunity and Forecast, By Region , 2016-2032- 10.1. Global Green Finance Market
Analysis by Region : Introduction - 10.2. Market Size Absolute $ Opportunity Analysis and Forecast, By Region , 2016-2032
- 10.2.1. North America
- 10.2.2. Western Europe
- 10.2.3. Eastern Europe
- 10.2.4. APAC
- 10.2.5. Latin America
- 10.2.6. Middle East & Africa
- 10.1. Global Green Finance Market
- 11. Global Green Finance Market
Competitive Landscape, Market Share Analysis, and Company Profiles- 11.1. Market Share Analysis
- 11.2. Company Profiles
- 11.3. JP Morgan Chase & Co.
- 11.3.1. Company Overview
- 11.3.2. Financial Highlights
- 11.3.3. Product Portfolio
- 11.3.4. SWOT Analysis
- 11.3.5. Key Strategies and Developments
- 11.4. Bank of America Corporation
- 11.4.1. Company Overview
- 11.4.2. Financial Highlights
- 11.4.3. Product Portfolio
- 11.4.4. SWOT Analysis
- 11.4.5. Key Strategies and Developments
- 11.5. CitiGroup Inc.
- 11.5.1. Company Overview
- 11.5.2. Financial Highlights
- 11.5.3. Product Portfolio
- 11.5.4. SWOT Analysis
- 11.5.5. Key Strategies and Developments
- 11.6. UBS Group AG
- 11.6.1. Company Overview
- 11.6.2. Financial Highlights
- 11.6.3. Product Portfolio
- 11.6.4. SWOT Analysis
- 11.6.5. Key Strategies and Developments
- 11.7. BlackRock, Inc.
- 11.7.1. Company Overview
- 11.7.2. Financial Highlights
- 11.7.3. Product Portfolio
- 11.7.4. SWOT Analysis
- 11.7.5. Key Strategies and Developments
- 11.8. BNP Paribas
- 11.8.1. Company Overview
- 11.8.2. Financial Highlights
- 11.8.3. Product Portfolio
- 11.8.4. SWOT Analysis
- 11.8.5. Key Strategies and Developments
- 11.9. Morgan Stanley
- 11.9.1. Company Overview
- 11.9.2. Financial Highlights
- 11.9.3. Product Portfolio
- 11.9.4. SWOT Analysis
- 11.9.5. Key Strategies and Developments
- 11.10. ING Group
- 11.10.1. Company Overview
- 11.10.2. Financial Highlights
- 11.10.3. Product Portfolio
- 11.10.4. SWOT Analysis
- 11.10.5. Key Strategies and Developments
- 11.11. Credit Agricole Group
- 11.11.1. Company Overview
- 11.11.2. Financial Highlights
- 11.11.3. Product Portfolio
- 11.11.4. SWOT Analysis
- 11.11.5. Key Strategies and Developments
- 11.12. HSBC Holdings plc
- 11.12.1. Company Overview
- 11.12.2. Financial Highlights
- 11.12.3. Product Portfolio
- 11.12.4. SWOT Analysis
- 11.12.5. Key Strategies and Developments
- 11.13.1. Company Overview
- 11.13.2. Financial Highlights
- 11.13.3. Product Portfolio
- 11.13.4. SWOT Analysis
- 11.13.5. Key Strategies and Developments
- 11.14. Goldman Sachs Group, Inc.
- 11.14.1. Company Overview
- 11.14.2. Financial Highlights
- 11.14.3. Product Portfolio
- 11.14.4. SWOT Analysis
- 11.14.5. Key Strategies and Developments
- 11.15. Other Key Players
- 11.15.1. Company Overview
- 11.15.2. Financial Highlights
- 11.15.3. Product Portfolio
- 11.15.4. SWOT Analysis
- 11.15.5. Key Strategies and Developments
- 12. Assumptions and Acronyms
- 13. Research Methodology
- 14. Contact
- List of Figures
- Figure 1: Global Green Finance Market
Revenue (US$ Mn) Market Share by Type in 2022 - Figure 2: Global Green Finance Market
Attractiveness Analysis by Type, 2016-2032 - Figure 3: Global Green Finance Market
Revenue (US$ Mn) Market Share by Industry Verticalin 2022 - Figure 4: Global Green Finance Market
Attractiveness Analysis by Industry Vertical, 2016-2032 - Figure 5: Global Green Finance Market
Revenue (US$ Mn) Market Share by End-Userin 2022 - Figure 6: Global Green Finance Market
Attractiveness Analysis by End-User, 2016-2032 - Figure 7: Global Green Finance Market
Revenue (US$ Mn) Market Share by Region in 2022 - Figure 8: Global Green Finance Market
Attractiveness Analysis by Region, 2016-2032 - Figure 9: Global Green Finance Market
Revenue (US$ Mn) (2016-2032) - Figure 10: Global Green Finance Market
Revenue (US$ Mn) Comparison by Region (2016-2032) - Figure 11: Global Green Finance Market
Revenue (US$ Mn) Comparison by Type (2016-2032) - Figure 12: Global Green Finance Market
Revenue (US$ Mn) Comparison by Industry Vertical (2016-2032) - Figure 13: Global Green Finance Market
Revenue (US$ Mn) Comparison by End-User (2016-2032) - Figure 14: Global Green Finance Market
Y-o-Y Growth Rate Comparison by Region (2016-2032) - Figure 15: Global Green Finance Market
Y-o-Y Growth Rate Comparison by Type (2016-2032) - Figure 16: Global Green Finance Market
Y-o-Y Growth Rate Comparison by Industry Vertical (2016-2032) - Figure 17: Global Green Finance Market
Y-o-Y Growth Rate Comparison by End-User (2016-2032) - Figure 18: Global Green Finance Market
Share Comparison by Region (2016-2032) - Figure 19: Global Green Finance Market
Share Comparison by Type (2016-2032) - Figure 20: Global Green Finance Market
Share Comparison by Industry Vertical (2016-2032) - Figure 21: Global Green Finance Market
Share Comparison by End-User (2016-2032) - Figure 22: North America Green Finance Market
Revenue (US$ Mn) Market Share by Typein 2022 - Figure 23: North America Green Finance Market
Attractiveness Analysis by Type, 2016-2032 - Figure 24: North America Green Finance Market
Revenue (US$ Mn) Market Share by Industry Verticalin 2022 - Figure 25: North America Green Finance Market
Attractiveness Analysis by Industry Vertical, 2016-2032 - Figure 26: North America Green Finance Market
Revenue (US$ Mn) Market Share by End-Userin 2022 - Figure 27: North America Green Finance Market
Attractiveness Analysis by End-User, 2016-2032 - Figure 28: North America Green Finance Market
Revenue (US$ Mn) Market Share by Country in 2022 - Figure 29: North America Green Finance Market
Attractiveness Analysis by Country, 2016-2032 - Figure 30: North America Green Finance Market
Revenue (US$ Mn) (2016-2032) - Figure 31: North America Green Finance Market
Revenue (US$ Mn) Comparison by Country (2016-2032) - Figure 32: North America Green Finance Market
Revenue (US$ Mn) Comparison by Type (2016-2032) - Figure 33: North America Green Finance Market
Revenue (US$ Mn) Comparison by Industry Vertical (2016-2032) - Figure 34: North America Green Finance Market
Revenue (US$ Mn) Comparison by End-User (2016-2032) - Figure 35: North America Green Finance Market
Y-o-Y Growth Rate Comparison by Country (2016-2032) - Figure 36: North America Green Finance Market
Y-o-Y Growth Rate Comparison by Type (2016-2032) - Figure 37: North America Green Finance Market
Y-o-Y Growth Rate Comparison by Industry Vertical (2016-2032) - Figure 38: North America Green Finance Market
Y-o-Y Growth Rate Comparison by End-User (2016-2032) - Figure 39: North America Green Finance Market
Share Comparison by Country (2016-2032) - Figure 40: North America Green Finance Market
Share Comparison by Type (2016-2032) - Figure 41: North America Green Finance Market
Share Comparison by Industry Vertical (2016-2032) - Figure 42: North America Green Finance Market
Share Comparison by End-User (2016-2032) - Figure 43: Western Europe Green Finance Market
Revenue (US$ Mn) Market Share by Typein 2022 - Figure 44: Western Europe Green Finance Market
Attractiveness Analysis by Type, 2016-2032 - Figure 45: Western Europe Green Finance Market
Revenue (US$ Mn) Market Share by Industry Verticalin 2022 - Figure 46: Western Europe Green Finance Market
Attractiveness Analysis by Industry Vertical, 2016-2032 - Figure 47: Western Europe Green Finance Market
Revenue (US$ Mn) Market Share by End-Userin 2022 - Figure 48: Western Europe Green Finance Market
Attractiveness Analysis by End-User, 2016-2032 - Figure 49: Western Europe Green Finance Market
Revenue (US$ Mn) Market Share by Country in 2022 - Figure 50: Western Europe Green Finance Market
Attractiveness Analysis by Country, 2016-2032 - Figure 51: Western Europe Green Finance Market
Revenue (US$ Mn) (2016-2032) - Figure 52: Western Europe Green Finance Market
Revenue (US$ Mn) Comparison by Country (2016-2032) - Figure 53: Western Europe Green Finance Market
Revenue (US$ Mn) Comparison by Type (2016-2032) - Figure 54: Western Europe Green Finance Market
Revenue (US$ Mn) Comparison by Industry Vertical (2016-2032) - Figure 55: Western Europe Green Finance Market
Revenue (US$ Mn) Comparison by End-User (2016-2032) - Figure 56: Western Europe Green Finance Market
Y-o-Y Growth Rate Comparison by Country (2016-2032) - Figure 57: Western Europe Green Finance Market
Y-o-Y Growth Rate Comparison by Type (2016-2032) - Figure 58: Western Europe Green Finance Market
Y-o-Y Growth Rate Comparison by Industry Vertical (2016-2032) - Figure 59: Western Europe Green Finance Market
Y-o-Y Growth Rate Comparison by End-User (2016-2032) - Figure 60: Western Europe Green Finance Market
Share Comparison by Country (2016-2032) - Figure 61: Western Europe Green Finance Market
Share Comparison by Type (2016-2032) - Figure 62: Western Europe Green Finance Market
Share Comparison by Industry Vertical (2016-2032) - Figure 63: Western Europe Green Finance Market
Share Comparison by End-User (2016-2032) - Figure 64: Eastern Europe Green Finance Market
Revenue (US$ Mn) Market Share by Typein 2022 - Figure 65: Eastern Europe Green Finance Market
Attractiveness Analysis by Type, 2016-2032 - Figure 66: Eastern Europe Green Finance Market
Revenue (US$ Mn) Market Share by Industry Verticalin 2022 - Figure 67: Eastern Europe Green Finance Market
Attractiveness Analysis by Industry Vertical, 2016-2032 - Figure 68: Eastern Europe Green Finance Market
Revenue (US$ Mn) Market Share by End-Userin 2022 - Figure 69: Eastern Europe Green Finance Market
Attractiveness Analysis by End-User, 2016-2032 - Figure 70: Eastern Europe Green Finance Market
Revenue (US$ Mn) Market Share by Country in 2022 - Figure 71: Eastern Europe Green Finance Market
Attractiveness Analysis by Country, 2016-2032 - Figure 72: Eastern Europe Green Finance Market
Revenue (US$ Mn) (2016-2032) - Figure 73: Eastern Europe Green Finance Market
Revenue (US$ Mn) Comparison by Country (2016-2032) - Figure 74: Eastern Europe Green Finance Market
Revenue (US$ Mn) Comparison by Type (2016-2032) - Figure 75: Eastern Europe Green Finance Market
Revenue (US$ Mn) Comparison by Industry Vertical (2016-2032) - Figure 76: Eastern Europe Green Finance Market
Revenue (US$ Mn) Comparison by End-User (2016-2032) - Figure 77: Eastern Europe Green Finance Market
Y-o-Y Growth Rate Comparison by Country (2016-2032) - Figure 78: Eastern Europe Green Finance Market
Y-o-Y Growth Rate Comparison by Type (2016-2032) - Figure 79: Eastern Europe Green Finance Market
Y-o-Y Growth Rate Comparison by Industry Vertical (2016-2032) - Figure 80: Eastern Europe Green Finance Market
Y-o-Y Growth Rate Comparison by End-User (2016-2032) - Figure 81: Eastern Europe Green Finance Market
Share Comparison by Country (2016-2032) - Figure 82: Eastern Europe Green Finance Market
Share Comparison by Type (2016-2032) - Figure 83: Eastern Europe Green Finance Market
Share Comparison by Industry Vertical (2016-2032) - Figure 84: Eastern Europe Green Finance Market
Share Comparison by End-User (2016-2032) - Figure 85: APAC Green Finance Market
Revenue (US$ Mn) Market Share by Typein 2022 - Figure 86: APAC Green Finance Market
Attractiveness Analysis by Type, 2016-2032 - Figure 87: APAC Green Finance Market
Revenue (US$ Mn) Market Share by Industry Verticalin 2022 - Figure 88: APAC Green Finance Market
Attractiveness Analysis by Industry Vertical, 2016-2032 - Figure 89: APAC Green Finance Market
Revenue (US$ Mn) Market Share by End-Userin 2022 - Figure 90: APAC Green Finance Market
Attractiveness Analysis by End-User, 2016-2032 - Figure 91: APAC Green Finance Market
Revenue (US$ Mn) Market Share by Country in 2022 - Figure 92: APAC Green Finance Market
Attractiveness Analysis by Country, 2016-2032 - Figure 93: APAC Green Finance Market
Revenue (US$ Mn) (2016-2032) - Figure 94: APAC Green Finance Market
Revenue (US$ Mn) Comparison by Country (2016-2032) - Figure 95: APAC Green Finance Market
Revenue (US$ Mn) Comparison by Type (2016-2032) - Figure 96: APAC Green Finance Market
Revenue (US$ Mn) Comparison by Industry Vertical (2016-2032) - Figure 97: APAC Green Finance Market
Revenue (US$ Mn) Comparison by End-User (2016-2032) - Figure 98: APAC Green Finance Market
Y-o-Y Growth Rate Comparison by Country (2016-2032) - Figure 99: APAC Green Finance Market
Y-o-Y Growth Rate Comparison by Type (2016-2032) - Figure 100: APAC Green Finance Market
Y-o-Y Growth Rate Comparison by Industry Vertical (2016-2032) - Figure 101: APAC Green Finance Market
Y-o-Y Growth Rate Comparison by End-User (2016-2032) - Figure 102: APAC Green Finance Market
Share Comparison by Country (2016-2032) - Figure 103: APAC Green Finance Market
Share Comparison by Type (2016-2032) - Figure 104: APAC Green Finance Market
Share Comparison by Industry Vertical (2016-2032) - Figure 105: APAC Green Finance Market
Share Comparison by End-User (2016-2032) - Figure 106: Latin America Green Finance Market
Revenue (US$ Mn) Market Share by Typein 2022 - Figure 107: Latin America Green Finance Market
Attractiveness Analysis by Type, 2016-2032 - Figure 108: Latin America Green Finance Market
Revenue (US$ Mn) Market Share by Industry Verticalin 2022 - Figure 109: Latin America Green Finance Market
Attractiveness Analysis by Industry Vertical, 2016-2032 - Figure 110: Latin America Green Finance Market
Revenue (US$ Mn) Market Share by End-Userin 2022 - Figure 111: Latin America Green Finance Market
Attractiveness Analysis by End-User, 2016-2032 - Figure 112: Latin America Green Finance Market
Revenue (US$ Mn) Market Share by Country in 2022 - Figure 113: Latin America Green Finance Market
Attractiveness Analysis by Country, 2016-2032 - Figure 114: Latin America Green Finance Market
Revenue (US$ Mn) (2016-2032) - Figure 115: Latin America Green Finance Market
Revenue (US$ Mn) Comparison by Country (2016-2032) - Figure 116: Latin America Green Finance Market
Revenue (US$ Mn) Comparison by Type (2016-2032) - Figure 117: Latin America Green Finance Market
Revenue (US$ Mn) Comparison by Industry Vertical (2016-2032) - Figure 118: Latin America Green Finance Market
Revenue (US$ Mn) Comparison by End-User (2016-2032) - Figure 119: Latin America Green Finance Market
Y-o-Y Growth Rate Comparison by Country (2016-2032) - Figure 120: Latin America Green Finance Market
Y-o-Y Growth Rate Comparison by Type (2016-2032) - Figure 121: Latin America Green Finance Market
Y-o-Y Growth Rate Comparison by Industry Vertical (2016-2032) - Figure 122: Latin America Green Finance Market
Y-o-Y Growth Rate Comparison by End-User (2016-2032) - Figure 123: Latin America Green Finance Market
Share Comparison by Country (2016-2032) - Figure 124: Latin America Green Finance Market
Share Comparison by Type (2016-2032) - Figure 125: Latin America Green Finance Market
Share Comparison by Industry Vertical (2016-2032) - Figure 126: Latin America Green Finance Market
Share Comparison by End-User (2016-2032) - Figure 127: Middle East & Africa Green Finance Market
Revenue (US$ Mn) Market Share by Typein 2022 - Figure 128: Middle East & Africa Green Finance Market
Attractiveness Analysis by Type, 2016-2032 - Figure 129: Middle East & Africa Green Finance Market
Revenue (US$ Mn) Market Share by Industry Verticalin 2022 - Figure 130: Middle East & Africa Green Finance Market
Attractiveness Analysis by Industry Vertical, 2016-2032 - Figure 131: Middle East & Africa Green Finance Market
Revenue (US$ Mn) Market Share by End-Userin 2022 - Figure 132: Middle East & Africa Green Finance Market
Attractiveness Analysis by End-User, 2016-2032 - Figure 133: Middle East & Africa Green Finance Market
Revenue (US$ Mn) Market Share by Country in 2022 - Figure 134: Middle East & Africa Green Finance Market
Attractiveness Analysis by Country, 2016-2032 - Figure 135: Middle East & Africa Green Finance Market
Revenue (US$ Mn) (2016-2032) - Figure 136: Middle East & Africa Green Finance Market
Revenue (US$ Mn) Comparison by Country (2016-2032) - Figure 137: Middle East & Africa Green Finance Market
Revenue (US$ Mn) Comparison by Type (2016-2032) - Figure 138: Middle East & Africa Green Finance Market
Revenue (US$ Mn) Comparison by Industry Vertical (2016-2032) - Figure 139: Middle East & Africa Green Finance Market
Revenue (US$ Mn) Comparison by End-User (2016-2032) - Figure 140: Middle East & Africa Green Finance Market
Y-o-Y Growth Rate Comparison by Country (2016-2032) - Figure 141: Middle East & Africa Green Finance Market
Y-o-Y Growth Rate Comparison by Type (2016-2032) - Figure 142: Middle East & Africa Green Finance Market
Y-o-Y Growth Rate Comparison by Industry Vertical (2016-2032) - Figure 143: Middle East & Africa Green Finance Market
Y-o-Y Growth Rate Comparison by End-User (2016-2032) - Figure 144: Middle East & Africa Green Finance Market
Share Comparison by Country (2016-2032) - Figure 145: Middle East & Africa Green Finance Market
Share Comparison by Type (2016-2032) - Figure 146: Middle East & Africa Green Finance Market
Share Comparison by Industry Vertical (2016-2032) - Figure 147: Middle East & Africa Green Finance Market
Share Comparison by End-User (2016-2032)
- Figure 1: Global Green Finance Market
- List of Tables
- Table 1: Global Green Finance Market
Comparison by Type (2016-2032) - Table 2: Global Green Finance Market
Comparison by Industry Vertical (2016-2032) - Table 3: Global Green Finance Market
Comparison by End-User (2016-2032) - Table 4: Global Green Finance Market
Revenue (US$ Mn) Comparison by Region (2016-2032) - Table 5: Global Green Finance Market
Revenue (US$ Mn) (2016-2032) - Table 6: Global Green Finance Market
Revenue (US$ Mn) Comparison by Region (2016-2032) - Table 7: Global Green Finance Market
Revenue (US$ Mn) Comparison by Type (2016-2032) - Table 8: Global Green Finance Market
Revenue (US$ Mn) Comparison by Industry Vertical (2016-2032) - Table 9: Global Green Finance Market
Revenue (US$ Mn) Comparison by End-User (2016-2032) - Table 10: Global Green Finance Market
Y-o-Y Growth Rate Comparison by Region (2016-2032) - Table 11: Global Green Finance Market
Y-o-Y Growth Rate Comparison by Type (2016-2032) - Table 12: Global Green Finance Market
Y-o-Y Growth Rate Comparison by Industry Vertical (2016-2032) - Table 13: Global Green Finance Market
Y-o-Y Growth Rate Comparison by End-User (2016-2032) - Table 14: Global Green Finance Market
Share Comparison by Region (2016-2032) - Table 15: Global Green Finance Market
Share Comparison by Type (2016-2032) - Table 16: Global Green Finance Market
Share Comparison by Industry Vertical (2016-2032) - Table 17: Global Green Finance Market
Share Comparison by End-User (2016-2032) - Table 18: North America Green Finance Market
Comparison by Industry Vertical (2016-2032) - Table 19: North America Green Finance Market
Comparison by End-User (2016-2032) - Table 20: North America Green Finance Market
Revenue (US$ Mn) Comparison by Country (2016-2032) - Table 21: North America Green Finance Market
Revenue (US$ Mn) (2016-2032) - Table 22: North America Green Finance Market
Revenue (US$ Mn) Comparison by Country (2016-2032) - Table 23: North America Green Finance Market
Revenue (US$ Mn) Comparison by Type (2016-2032) - Table 24: North America Green Finance Market
Revenue (US$ Mn) Comparison by Industry Vertical (2016-2032) - Table 25: North America Green Finance Market
Revenue (US$ Mn) Comparison by End-User (2016-2032) - Table 26: North America Green Finance Market
Y-o-Y Growth Rate Comparison by Country (2016-2032) - Table 27: North America Green Finance Market
Y-o-Y Growth Rate Comparison by Type (2016-2032) - Table 28: North America Green Finance Market
Y-o-Y Growth Rate Comparison by Industry Vertical (2016-2032) - Table 29: North America Green Finance Market
Y-o-Y Growth Rate Comparison by End-User (2016-2032) - Table 30: North America Green Finance Market
Share Comparison by Country (2016-2032) - Table 31: North America Green Finance Market
Share Comparison by Type (2016-2032) - Table 32: North America Green Finance Market
Share Comparison by Industry Vertical (2016-2032) - Table 33: North America Green Finance Market
Share Comparison by End-User (2016-2032) - Table 34: Western Europe Green Finance Market
Comparison by Type (2016-2032) - Table 35: Western Europe Green Finance Market
Comparison by Industry Vertical (2016-2032) - Table 36: Western Europe Green Finance Market
Comparison by End-User (2016-2032) - Table 37: Western Europe Green Finance Market
Revenue (US$ Mn) Comparison by Country (2016-2032) - Table 38: Western Europe Green Finance Market
Revenue (US$ Mn) (2016-2032) - Table 39: Western Europe Green Finance Market
Revenue (US$ Mn) Comparison by Country (2016-2032) - Table 40: Western Europe Green Finance Market
Revenue (US$ Mn) Comparison by Type (2016-2032) - Table 41: Western Europe Green Finance Market
Revenue (US$ Mn) Comparison by Industry Vertical (2016-2032) - Table 42: Western Europe Green Finance Market
Revenue (US$ Mn) Comparison by End-User (2016-2032) - Table 43: Western Europe Green Finance Market
Y-o-Y Growth Rate Comparison by Country (2016-2032) - Table 44: Western Europe Green Finance Market
Y-o-Y Growth Rate Comparison by Type (2016-2032) - Table 45: Western Europe Green Finance Market
Y-o-Y Growth Rate Comparison by Industry Vertical (2016-2032) - Table 46: Western Europe Green Finance Market
Y-o-Y Growth Rate Comparison by End-User (2016-2032) - Table 47: Western Europe Green Finance Market
Share Comparison by Country (2016-2032) - Table 48: Western Europe Green Finance Market
Share Comparison by Type (2016-2032) - Table 49: Western Europe Green Finance Market
Share Comparison by Industry Vertical (2016-2032) - Table 50: Western Europe Green Finance Market
Share Comparison by End-User (2016-2032) - Table 51: Eastern Europe Green Finance Market
Comparison by Type (2016-2032) - Table 52: Eastern Europe Green Finance Market
Comparison by Industry Vertical (2016-2032) - Table 53: Eastern Europe Green Finance Market
Comparison by End-User (2016-2032) - Table 54: Eastern Europe Green Finance Market
Revenue (US$ Mn) Comparison by Country (2016-2032) - Table 55: Eastern Europe Green Finance Market
Revenue (US$ Mn) (2016-2032) - Table 56: Eastern Europe Green Finance Market
Revenue (US$ Mn) Comparison by Country (2016-2032) - Table 57: Eastern Europe Green Finance Market
Revenue (US$ Mn) Comparison by Type (2016-2032) - Table 58: Eastern Europe Green Finance Market
Revenue (US$ Mn) Comparison by Industry Vertical (2016-2032) - Table 59: Eastern Europe Green Finance Market
Revenue (US$ Mn) Comparison by End-User (2016-2032) - Table 60: Eastern Europe Green Finance Market
Y-o-Y Growth Rate Comparison by Country (2016-2032) - Table 61: Eastern Europe Green Finance Market
Y-o-Y Growth Rate Comparison by Type (2016-2032) - Table 62: Eastern Europe Green Finance Market
Y-o-Y Growth Rate Comparison by Industry Vertical (2016-2032) - Table 63: Eastern Europe Green Finance Market
Y-o-Y Growth Rate Comparison by End-User (2016-2032) - Table 64: Eastern Europe Green Finance Market
Share Comparison by Country (2016-2032) - Table 65: Eastern Europe Green Finance Market
Share Comparison by Type (2016-2032) - Table 66: Eastern Europe Green Finance Market
Share Comparison by Industry Vertical (2016-2032) - Table 67: Eastern Europe Green Finance Market
Share Comparison by End-User (2016-2032) - Table 68: APAC Green Finance Market
Comparison by Type (2016-2032) - Table 69: APAC Green Finance Market
Comparison by Industry Vertical (2016-2032) - Table 70: APAC Green Finance Market
Comparison by End-User (2016-2032) - Table 71: APAC Green Finance Market
Revenue (US$ Mn) Comparison by Country (2016-2032) - Table 72: APAC Green Finance Market
Revenue (US$ Mn) (2016-2032) - Table 73: APAC Green Finance Market
Revenue (US$ Mn) Comparison by Country (2016-2032) - Table 74: APAC Green Finance Market
Revenue (US$ Mn) Comparison by Type (2016-2032) - Table 75: APAC Green Finance Market
Revenue (US$ Mn) Comparison by Industry Vertical (2016-2032) - Table 76: APAC Green Finance Market
Revenue (US$ Mn) Comparison by End-User (2016-2032) - Table 77: APAC Green Finance Market
Y-o-Y Growth Rate Comparison by Country (2016-2032) - Table 78: APAC Green Finance Market
Y-o-Y Growth Rate Comparison by Type (2016-2032) - Table 79: APAC Green Finance Market
Y-o-Y Growth Rate Comparison by Industry Vertical (2016-2032) - Table 80: APAC Green Finance Market
Y-o-Y Growth Rate Comparison by End-User (2016-2032) - Table 81: APAC Green Finance Market
Share Comparison by Country (2016-2032) - Table 82: APAC Green Finance Market
Share Comparison by Type (2016-2032) - Table 83: APAC Green Finance Market
Share Comparison by Industry Vertical (2016-2032) - Table 84: APAC Green Finance Market
Share Comparison by End-User (2016-2032) - Table 85: Latin America Green Finance Market
Comparison by Type (2016-2032) - Table 86: Latin America Green Finance Market
Comparison by Industry Vertical (2016-2032) - Table 87: Latin America Green Finance Market
Comparison by End-User (2016-2032) - Table 88: Latin America Green Finance Market
Revenue (US$ Mn) Comparison by Country (2016-2032) - Table 89: Latin America Green Finance Market
Revenue (US$ Mn) (2016-2032) - Table 90: Latin America Green Finance Market
Revenue (US$ Mn) Comparison by Country (2016-2032) - Table 91: Latin America Green Finance Market
Revenue (US$ Mn) Comparison by Type (2016-2032) - Table 92: Latin America Green Finance Market
Revenue (US$ Mn) Comparison by Industry Vertical (2016-2032) - Table 93: Latin America Green Finance Market
Revenue (US$ Mn) Comparison by End-User (2016-2032) - Table 94: Latin America Green Finance Market
Y-o-Y Growth Rate Comparison by Country (2016-2032) - Table 95: Latin America Green Finance Market
Y-o-Y Growth Rate Comparison by Type (2016-2032) - Table 96: Latin America Green Finance Market
Y-o-Y Growth Rate Comparison by Industry Vertical (2016-2032) - Table 97: Latin America Green Finance Market
Y-o-Y Growth Rate Comparison by End-User (2016-2032) - Table 98: Latin America Green Finance Market
Share Comparison by Country (2016-2032) - Table 99: Latin America Green Finance Market
Share Comparison by Type (2016-2032) - Table 100: Latin America Green Finance Market
Share Comparison by Industry Vertical (2016-2032) - Table 101: Latin America Green Finance Market
Share Comparison by End-User (2016-2032) - Table 102: Middle East & Africa Green Finance Market
Comparison by Type (2016-2032) - Table 103: Middle East & Africa Green Finance Market
Comparison by Industry Vertical (2016-2032) - Table 104: Middle East & Africa Green Finance Market
Comparison by End-User (2016-2032) - Table 105: Middle East & Africa Green Finance Market
Revenue (US$ Mn) Comparison by Country (2016-2032) - Table 106: Middle East & Africa Green Finance Market
Revenue (US$ Mn) (2016-2032) - Table 107: Middle East & Africa Green Finance Market
Revenue (US$ Mn) Comparison by Country (2016-2032) - Table 108: Middle East & Africa Green Finance Market
Revenue (US$ Mn) Comparison by Type (2016-2032) - Table 109: Middle East & Africa Green Finance Market
Revenue (US$ Mn) Comparison by Industry Vertical (2016-2032) - Table 110: Middle East & Africa Green Finance Market
Revenue (US$ Mn) Comparison by End-User (2016-2032) - Table 111: Middle East & Africa Green Finance Market
Y-o-Y Growth Rate Comparison by Country (2016-2032) - Table 112: Middle East & Africa Green Finance Market
Y-o-Y Growth Rate Comparison by Type (2016-2032) - Table 113: Middle East & Africa Green Finance Market
Y-o-Y Growth Rate Comparison by Industry Vertical (2016-2032) - Table 114: Middle East & Africa Green Finance Market
Y-o-Y Growth Rate Comparison by End-User (2016-2032) - Table 115: Middle East & Africa Green Finance Market
Share Comparison by Country (2016-2032) - Table 116: Middle East & Africa Green Finance Market
Market Share Comparison by Type (2016-2032) - Table 117: Middle East & Africa Green Finance Market
Market Share Comparison by Industry Vertical (2016-2032) - Table 118: Middle East & Africa Green Finance Market
Market Share Comparison by End-User (2016-2032)
- Table 1: Global Green Finance Market
- 1. Executive Summary
-
- JP Morgan Chase & Co.
- Bank of America Corporation
- CitiGroup Inc.
- UBS Group AG
- BlackRock, Inc.
- BNP Paribas
- Morgan Stanley
- ING Group
- Credit Agricole Group
- HSBC Holdings plc
- Goldman Sachs Group, Inc.
- State Street Corporation
- Other Key Players
Our Clients


View Our Licence Options
