
Surfactants Market By Type(Anionic Surfactants, Non-ionic Surfactants, Cationic Surfactants, Others), By Origin(Synthetic Surfactants, Bio-based Surfactants), By Application(Home Care, Personal Care, Oilfield Chemicals, Food & Beverage, Agrochemicals, Textiles), By Region And Companies - Industry Segment Outlook, Market Assessment, Competition Scenario, Trends, And Forecast 2024-2033
-
43032
-
Jan 2024
-
179
-


-
This report was compiled by Shreyas Rokade Shreyas Rokade is a seasoned Research Analyst with CMFE, bringing extensive expertise in market research and consulting, with a strong background in Chemical Engineering. Correspondence Team Lead-CMFE Linkedin | Detailed Market research Methodology Our methodology involves a mix of primary research, including interviews with leading mental health experts, and secondary research from reputable medical journals and databases. View Detailed Methodology Page
-
Quick Navigation
- Surfactants Market Size, Share, Trends Analysis
- Surfactants Market Dynamics
- Surfactants Market Segmentation Analysis
- Surfactants Industry Segments
- Surfactants Market Growth Opportunity
- Surfactants Market Regional Analysis
- Surfactants Industry By Region
- Surfactants Market Share Analysis
- Surfactants Industry Key Players
- Surfactants Market Recent Development
- Report Scope
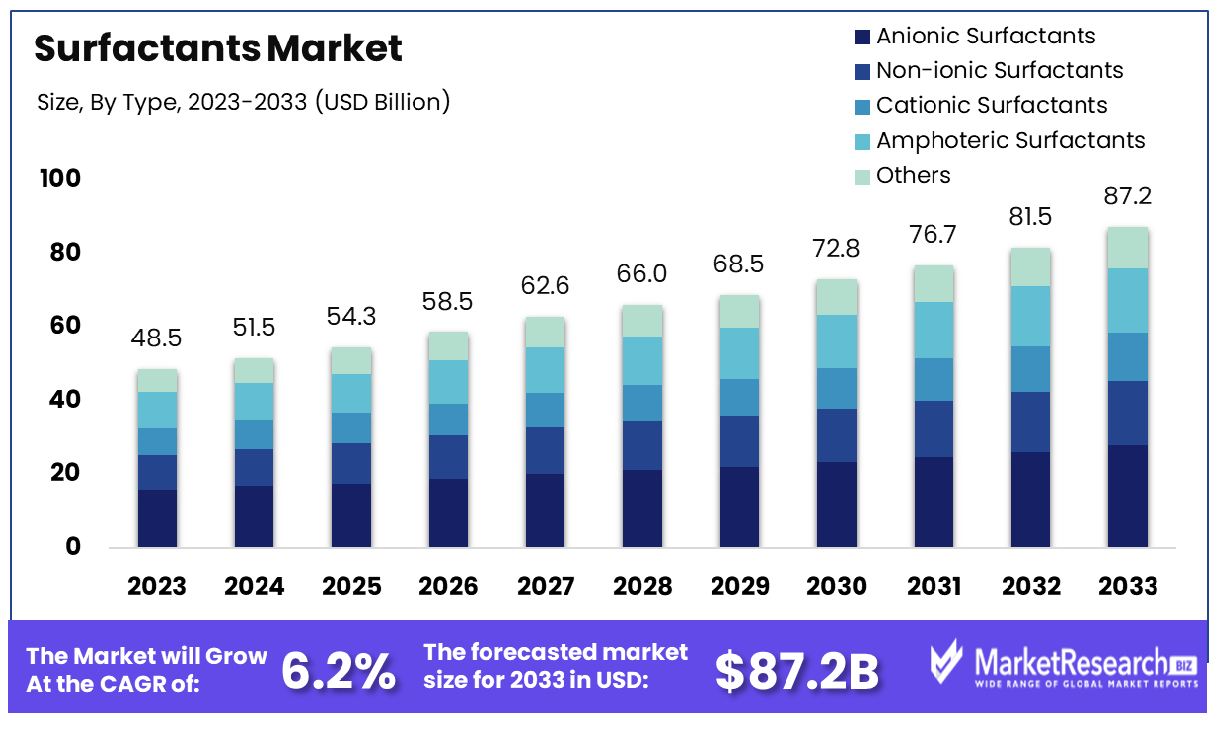
The surfactants market was valued at USD 48.5 billion in 2023. It is expected to reach USD 87.2 billion by 2033, with a CAGR of 6.2% during the forecast period from 2024 to 2033.
The surge in demand for household cleaning activities and the rise in the food and beverage industries are some of the main driving key factors for the surfactant market. Surfactants are generally compounds that decrease the surface tension of a liquid by making it more active and operative at pervading surfaces and eliminating dirt and other substances. These are also used in different types of cleaning products comprise laundry detergents and other cleaning purposes.
Surfactants are the main ingredients in cleaning products. They are generally combined with solvents and inhibitors to reinforce their efficacy in eliminating grime, fuel oils, and grease. Many eco-friendly surfactants are used to decrease the environmental impact of the products by separating them at a faster pace than their normal counterparts. Manufacturers are focusing on the importance of surfactants, as they are very essential for cleaning purposes.
Due to its capability of decreasing the surface tension of water, which permits the water to spread more easily in wet areas, this makes the procedure of removing dirt and other harmful contaminants from the surface areas much more tranquil, as the water can go into the pores where the dirt is trapped inside. Surfactants are also beneficial for cleaning purposes as they help to dissolve and slacken contamination, as well as dangling dirt and other elements in the water solution so that it can be washed away easily.
Plant-based surfactants are extracted from natural sources like plants, which provide a more environmentally friendly and sustainable substitute for synthetic surfactants, which are made from non-renewable resources such as petroleum. By implementing plant-based surfactants, many consumers and industries can contribute to a clean and green future. Surfactants are not only used for cleaning purposes; they are also used in various applications, such as food processing, oil production, and personal care products such as toothpaste, shampoo, lotions, and body washes.
There are several benefits to using plant-based surfactants, such as that they are environmentally friendly and less toxic, and they can be used for many other purposes. These are biodegradable. Many industrial giants manufacture plant-based eco-friendly surfactants comprising Seventh Generation, Ecover, Methods, and others. These organizations provide a wide range of plant-based surfactants that cover all cleaning purposes. The demand for surfactants will rise because of plant-based surfactants that are environmentally friendly, and the businesses involved in this sector will also help to expand the market in the forecast period.
Surfactants Market Dynamics
Personal and Home Care Industries Boost Surfactant Market
The surfactant market is witnessing robust growth fueled by escalating demand from the personal and home care sectors. Surfactants' integral role in products like shampoos, body washes, toothpaste, detergents, and surface cleaners, coupled with the rising middle-class population and growing disposable incomes, particularly in emerging economies, is propelling this surge. This trend reflects a broader shift towards enhanced hygiene and cleanliness standards globally, significantly driving the market forward.
Manufacturing Innovations Expand the Surfactant Market
Advancements in manufacturing technologies are revolutionizing the surfactant market. The development of bio-based surfactants from natural sources, such as corn and coconut, is not only cost-effective but also environmentally friendly. Innovations like Galseer Tresscon, a solid surfactant system for shampoo bars, exemplify the industry's shift toward sustainability. This technology could dramatically reduce plastic waste, indicating a future where eco-friendly and efficient surfactants become the norm.
Agricultural Sector's Surfactant Adoption Spurs Growth
In the agricultural realm, surfactants are becoming increasingly pivotal. They enhance the efficacy of agrochemicals like pesticides and insecticides, meeting the global imperative to boost agricultural productivity. Innovations like Bionema Group's Soil-Jet® BSP100, with its biodegradable and plant-nurturing properties, demonstrate the market's potential for rapid growth. Field trials showing a 20-30% increase in efficiency over existing products indicate a significant market expansion, driven by the need for more effective agricultural practices.
Raw Material Price Volatility Restricts Surfactants Market Growth
The surfactants market is significantly impacted by the instability of raw material costs, predominantly due to their derivation from petroleum feedstocks. Fluctuating crude oil prices directly influence the cost of these raw materials, leading to erratic surfactant prices and unpredictability in profit margins for manufacturers. For instance, the volatility in crude oil prices affects the economic feasibility of surfactant production. This uncertainty complicates budgeting and pricing strategies for surfactant producers, posing a substantial challenge to the market's stability and substantial growth.
Environmental Regulations Constrain Surfactant Industry Expansion
The shift towards stringent environmental regulations governing the use of non-biodegradable and toxic surfactants, such as Linear Alkylbenzene Sulfonates (LAS) and Alkylbenzene Sulfonates (ABS), is compelling the industry to pivot towards eco-friendly variants. This transition necessitates increased investment in research and development, elevating product development costs.
Notably, the European Union's ban on nonylphenol ethoxylates exemplifies these tightening regulations. As of January 2024, various regulatory frameworks, like the US Safer Choice Program and the EU's proposal for a regulation on detergents and surfactants, introduced in April 2023, aim to standardize industry practices. These regulations enhance environmental safety but also impose additional costs and complexities on surfactant producers, potentially hindering market steady growth.
Surfactants Market Segmentation Analysis
By Type Analysis
Anionic Surfactants dominate the surfactants market. This dominance is primarily due to their wide range of applications in detergents and personal care products. Anionic surfactants, known for their excellent cleaning and emulsifying properties, are key ingredients in products like shampoos, soaps, and laundry detergents. They work effectively in removing dirt and oils, making them the preferred choice in household and industrial cleaning applications.
Non-ionic, Cationic, Amphoteric, and other types of surfactants also hold significant shares in the market. Non-ionic surfactants are valued for their mildness and versatility, while cationic surfactants are used for their antimicrobial properties. Amphoteric surfactants, known for their compatibility with both anionic and cationic surfactants, are used in personal care industry products. However, the broad applicability and established presence of anionic surfactants in various consumer products underscore their market dominance.
By Origin Analysis
The surfactants market is segmented into Synthetic and Bio-based Surfactants. Synthetic surfactants, derived from petrochemical sources, have traditionally dominated the market due to their cost-effectiveness and wide range of functionalities.
However, there's a growing shift towards bio-based surfactants, driven by environmental concerns and sustainability initiatives. Bio-based surfactants are derived from renewable resources and are gaining popularity due to their eco-friendly profile and biodegradability. The trend towards green chemistry and sustainable products is expected to increase the demand for bio-based surfactants.
By Application Analysis
Home Care is the dominant application segment in the surfactant market. This segment includes a wide range of cleaning products such as laundry detergents, dishwashing liquids, and household cleaners. The effectiveness of surfactants in removing stains, soils, and greases makes them indispensable in home care products. The large consumer base and regular demand for home care products contribute significantly to the segment's dominance.
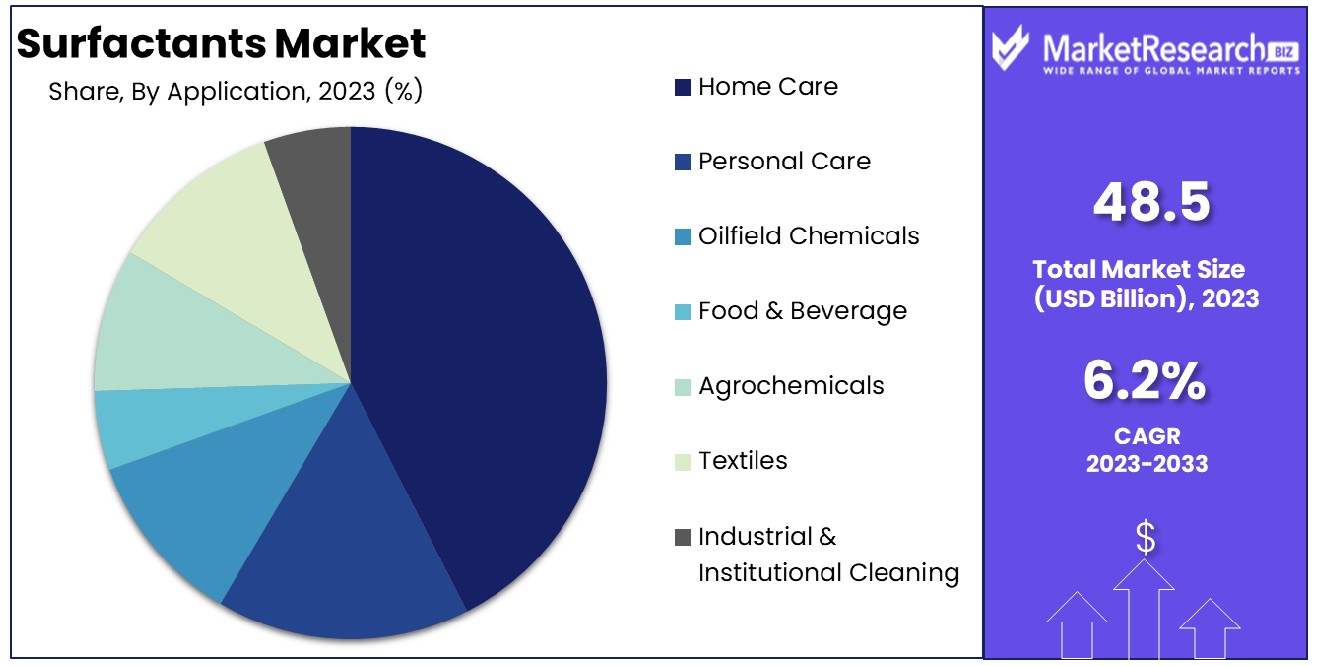
Other application areas like Personal Care, Oilfield Chemicals, Food & Beverage, Agrochemicals, Textiles, Plastics, and Industrial & Institutional Cleaning also utilize surfactants extensively. In personal care, surfactants are used for their foaming and cleansing properties. In industrial applications, they serve as emulsifiers, wetting agents, and dispersants. Despite this, the sheer volume and consistent demand in the home care sector solidify its position as the leading application segment in the surfactants market.
Surfactants Industry Segments
By Type
- Anionic Surfactants
- Non-ionic Surfactants
- Cationic Surfactants
- Amphoteric Surfactants
- Others
By Origin
- Synthetic Surfactants
- Bio-based Surfactants
By Application
- Home Care
- Personal Care
- Oilfield Chemicals
- Food & Beverage
- Agrochemicals
- Textiles
- Industrial & Institutional Cleaning
Surfactants Market Growth Opportunity
Multifunctional Surfactants: A New Era of Versatility and Efficiency
The increasing market for surfactants that can be multifunctional offers an opportunity for significant growth and innovation within the market for surfactants. Consumers and industries are increasingly seeking surfactants that can perform various functions such as emulsification, dispersion, wetting, and foaming, all within a single product.
This trend opens up avenues for research and development in creating versatile, hybrid surfactants that can meet these multifaceted requirements. The development of such products would not only satisfy customer demands for efficiency and functionality but also potentially streamline manufacturing processes and reduce costs, thus driving growth potential in the surfactant market.
Embracing Green Chemistry: A Sustainable Future for Surfactants
The incorporation of green chemistry principles into the manufacturing of surfactants presents significant growth of surfactant opportunities within the market. As environmental concerns become more prominent, there is a rising demand for sustainable and eco-friendly products.
By adopting green chemistry, manufacturers can make surfactant production processes more environmentally friendly, reducing the ecological footprint and addressing consumer concerns about sustainability. This approach can lead to the development of new, greener surfactants that resonate with environmentally conscious consumers and industries, thereby expanding the market reach and appealing to a broader, more sustainability-focused audience.
Surfactants Market Regional Analysis
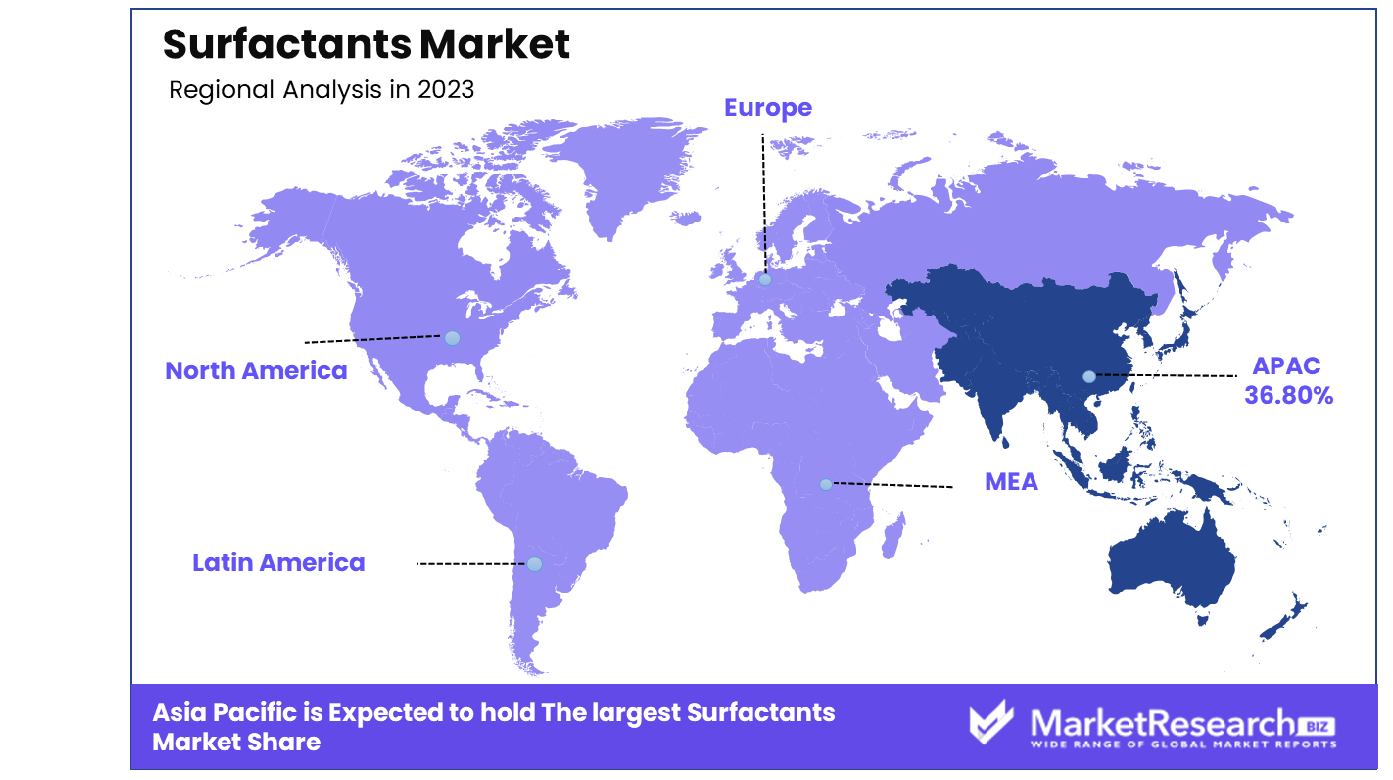
Asia Pacific Dominates with 36.80% Market Share in Surfactants Market
Asia Pacific’s leading position in the surfactants market, with a 36.80% share, is primarily driven by the region's expansive manufacturing sector and rapid industrialization. Countries like China, India, and Japan are major contributors, with their vast consumer base and growing demand for personal care and household products. The supply of raw materials as well as the presence of regional players have a major impact. Additionally, Asia Pacific’s burgeoning construction industry, which heavily utilizes surfactants in cement and concrete applications, plays a vital role in driving market growth.
The surfactants market in Asia Pacific is characterized by diverse applications across various industries, including detergents, personal care, textiles, and construction. The region's economic growth, coupled with rising consumer awareness about hygiene and personal care, has led to increased demand for surfactant-based products. Innovation and R&D in bio-based surfactants are also gaining traction in the region, driven by environmental concerns and regulatory policies promoting sustainable products. The competitive pricing and large-scale production capabilities further enhance the market dynamics in the Asia Pacific.
Europe: Focus on Sustainable and Bio-based Surfactants
Europe’s surfactants market is driven by a strong focus on environmental sustainability and the development of bio-based surfactants. Countries like Germany, France, and the UK are at the forefront, with regulations promoting eco-friendly products. The increasing consumer preference for green and natural products supports market growth in this region.
North America: Advanced Technology and High Consumer Demand
In North America, the surfactants market benefits from advanced technological developments and high consumer demand, especially in the personal care and household sectors. The United States leads the market with its innovative product offerings and robust manufacturing sector. The region's focus on bio-based and environmentally friendly surfactants also contributes to market expansion.
Surfactants Industry By Region
North America
- The US
- Canada
- Rest of North America
Europe
- Germany
- France
- The UK
- Spain
- Italy
- Russia
- Netherlands
- Rest of Europe
Asia-Pacific
- China
- Japan
- South Korea
- India
- New Zealand
- Singapore
- Thailand
- Vietnam
- Rest of Asia Pacific
Latin America
- Brazil
- Mexico
- Rest of Latin America
Middle East & Africa
- South Africa
- Saudi Arabia
- UAE
- Rest of Middle East & Africa
Within the Surfactants Market, a crucial sector of chemical manufacturing, the companies mentioned can be found in the shaping of global production, innovation, and application variety. BASF SE and Dow Inc. are industry leaders, known for their extensive range of surfactants used in various applications from detergents to personal care products. Their strategic positioning emphasizes technological innovation and sustainable production, significantly influencing global market trends.
Evonik Industries AG and Stepan Company stand out for their specialized surfactant solutions, catering to specific industrial needs. Their focus on tailored products underscores the market's move towards meeting diverse consumer demands.
Surfactants Industry Key Players
- BASF SE
- Stepan Company
- Evonik Industries AG
- Dow Inc.
- Nouryon
- Solvay S.A.
- Arkema
- Ashland
- Bayer AG
- Clariant
- Croda International PLC
- DETEN Quimica SA
- Cepsa
- Galaxy Surfactants
- Huntsman International LLC
- Kao Corporation
- Lonza
- Sanyo Chemical Industries Ltd
- Sasol
- Godrej Industries Limited
- Innospec
- Procter & Gamble
- Henkel Corporation
- Mitsui Chemicals America, Inc.
Surfactants Market Recent Development
- In January 2024, Galaxy Surfactants announces participation in the 13th HPCI India, showcasing innovations in home and personal care ingredients. Introducing three emollient additions, including two patented products, emphasizing sustainability and quality.
- In January 2024, Osaka University researchers develop a green and sustainable method for alkylamine synthesis using a platinum-molybdenum catalyst. The process operates under mild conditions, producing water as the sole byproduct, enhancing environmental sustainability in chemical syntheses.
- In January 2023, Siltech focused on improving the sustainability of its silicones, introducing PEG-dimethicone surfactants and alkyl dimethicone emulsifiers with high biobased carbon content, derived from feedstocks sourced from biobased materials.
- In September 2023, University of Birmingham researchers found surfactants in aerosols, like those from cooking and cleaning, form 3D structures, protecting hazardous chemicals and extending their atmospheric lifespan. The study highlights potential health risks and emphasizes ventilation during indoor activities.
Report Scope
Report Features Description Market Value (2023) USD 48.5 Billion Forecast Revenue (2033) USD 87.2 Billion CAGR (2024-2032) 6.2% Base Year for Estimation 2023 Historic Period 2016-2023 Forecast Period 2024-2033 Report Coverage Revenue Forecast, Market Dynamics, COVID-19 Impact, Competitive Landscape, Recent Developments Segments Covered By Type(Anionic Surfactants, Non-ionic Surfactants, Cationic Surfactants, Amphoteric Surfactants, Others), By Origin(Synthetic Surfactants, Bio-based Surfactants), By Application(Home Care, Personal Care, Oilfield Chemicals, Food & Beverage, Agrochemicals, Textiles, Industrial & Institutional Cleaning) Regional Analysis North America - The US, Canada, Rest of North America, Europe - Germany, France, The UK, Spain, Italy, Russia, Netherlands, Rest of Europe, Asia-Pacific - China, Japan, South Korea, India, New Zealand, Singapore, Thailand, Vietnam, Rest of Asia Pacific, Latin America - Brazil, Mexico, Rest of Latin America, Middle East & Africa - South Africa, Saudi Arabia, UAE, Rest of Middle East & Africa Competitive Landscape BASF SE, Stepan Company, Evonik Industries AG, Dow Inc., Nouryon, Solvay S.A., Arkema, Ashland, Bayer AG, Clariant, Croda International PLC, DETEN Quimica SA, Cepsa, Galaxy Surfactants, Huntsman International LLC, Kao Corporation, Lonza, Sanyo Chemical Industries Ltd, Sasol, Godrej Industries Limited, Innospec, Procter & Gamble, Henkel Corporation, Mitsui Chemicals America, Inc. Customization Scope Customization for segments, region/country-level will be provided. Moreover, additional customization can be done based on the requirements. Purchase Options We have three licenses to opt for Single User License, Multi-User License (Up to 5 Users), Corporate Use License (Unlimited User and Printable PDF) -
- 1. Executive Summary
- 1.1. Definition
- 1.2. Taxonomy
- 1.3. Research Scope
- 1.4. Key Analysis
- 1.5. Key Findings by Major Segments
- 1.6. Top strategies by Major Players
- 2. Global Surfactants Market Overview
- 2.1. Surfactants Market Dynamics
- 2.1.1. Drivers
- 2.1.2. Opportunities
- 2.1.3. Restraints
- 2.1.4. Challenges
- 2.2. Macro-economic Factors
- 2.3. Regulatory Framework
- 2.4. Market Investment Feasibility Index
- 2.5. PEST Analysis
- 2.6. PORTER’S Five Force Analysis
- 2.7. Drivers & Restraints Impact Analysis
- 2.8. Industry Chain Analysis
- 2.9. Cost Structure Analysis
- 2.10. Marketing Strategy
- 2.11. Russia-Ukraine War Impact Analysis
- 2.12. Opportunity Map Analysis
- 2.13. Market Competition Scenario Analysis
- 2.14. Product Life Cycle Analysis
- 2.15. Opportunity Orbits
- 2.16. Manufacturer Intensity Map
- 2.17. Major Companies sales by Value & Volume
- 2.1. Surfactants Market Dynamics
- 3. Global Surfactants Market Analysis, Opportunity and Forecast, 2016-2032
- 3.1. Global Surfactants Market Analysis, 2016-2021
- 3.2. Global Surfactants Market Opportunity and Forecast, 2023-2032
- 3.3. Global Surfactants Market Analysis, Opportunity and Forecast, By By Type, 2016-2032
- 3.3.1. Global Surfactants Market Analysis by By Type: Introduction
- 3.3.2. Market Size Absolute $ Opportunity Analysis and Forecast, By By Type, 2016-2032
- 3.3.3. Anionic Surfactants
- 3.3.4. Non-ionic Surfactants
- 3.3.5. Cationic Surfactants
- 3.3.6. Amphoteric Surfactants
- 3.3.7. Others
- 3.4. Global Surfactants Market Analysis, Opportunity and Forecast, By By Origin, 2016-2032
- 3.4.1. Global Surfactants Market Analysis by By Origin: Introduction
- 3.4.2. Market Size Absolute $ Opportunity Analysis and Forecast, By By Origin, 2016-2032
- 3.4.3. Synthetic Surfactants
- 3.4.4. Bio-based Surfactants
- 3.5. Global Surfactants Market Analysis, Opportunity and Forecast, By By Application, 2016-2032
- 3.5.1. Global Surfactants Market Analysis by By Application: Introduction
- 3.5.2. Market Size Absolute $ Opportunity Analysis and Forecast, By By Application, 2016-2032
- 3.5.3. Home Care
- 3.5.4. Personal Care
- 3.5.5. Oilfield Chemicals
- 3.5.6. Food & Beverage
- 3.5.7. Agrochemicals
- 3.5.8. Textiles
- 3.5.9. Plastics
- 3.5.10. Industrial & Institutional Cleaning
- 4. North America Surfactants Market Analysis, Opportunity and Forecast, 2016-2032
- 4.1. North America Surfactants Market Analysis, 2016-2021
- 4.2. North America Surfactants Market Opportunity and Forecast, 2023-2032
- 4.3. North America Surfactants Market Analysis, Opportunity and Forecast, By By Type, 2016-2032
- 4.3.1. North America Surfactants Market Analysis by By Type: Introduction
- 4.3.2. Market Size Absolute $ Opportunity Analysis and Forecast, By By Type, 2016-2032
- 4.3.3. Anionic Surfactants
- 4.3.4. Non-ionic Surfactants
- 4.3.5. Cationic Surfactants
- 4.3.6. Amphoteric Surfactants
- 4.3.7. Others
- 4.4. North America Surfactants Market Analysis, Opportunity and Forecast, By By Origin, 2016-2032
- 4.4.1. North America Surfactants Market Analysis by By Origin: Introduction
- 4.4.2. Market Size Absolute $ Opportunity Analysis and Forecast, By By Origin, 2016-2032
- 4.4.3. Synthetic Surfactants
- 4.4.4. Bio-based Surfactants
- 4.5. North America Surfactants Market Analysis, Opportunity and Forecast, By By Application, 2016-2032
- 4.5.1. North America Surfactants Market Analysis by By Application: Introduction
- 4.5.2. Market Size Absolute $ Opportunity Analysis and Forecast, By By Application, 2016-2032
- 4.5.3. Home Care
- 4.5.4. Personal Care
- 4.5.5. Oilfield Chemicals
- 4.5.6. Food & Beverage
- 4.5.7. Agrochemicals
- 4.5.8. Textiles
- 4.5.9. Plastics
- 4.5.10. Industrial & Institutional Cleaning
- 4.6. North America Surfactants Market Analysis, Opportunity and Forecast, By Country , 2016-2032
- 4.6.1. North America Surfactants Market Analysis by Country : Introduction
- 4.6.2. Market Size Absolute $ Opportunity Analysis and Forecast, Country , 2016-2032
- 4.6.2.1. The US
- 4.6.2.2. Canada
- 4.6.2.3. Mexico
- 5. Western Europe Surfactants Market Analysis, Opportunity and Forecast, 2016-2032
- 5.1. Western Europe Surfactants Market Analysis, 2016-2021
- 5.2. Western Europe Surfactants Market Opportunity and Forecast, 2023-2032
- 5.3. Western Europe Surfactants Market Analysis, Opportunity and Forecast, By By Type, 2016-2032
- 5.3.1. Western Europe Surfactants Market Analysis by By Type: Introduction
- 5.3.2. Market Size Absolute $ Opportunity Analysis and Forecast, By By Type, 2016-2032
- 5.3.3. Anionic Surfactants
- 5.3.4. Non-ionic Surfactants
- 5.3.5. Cationic Surfactants
- 5.3.6. Amphoteric Surfactants
- 5.3.7. Others
- 5.4. Western Europe Surfactants Market Analysis, Opportunity and Forecast, By By Origin, 2016-2032
- 5.4.1. Western Europe Surfactants Market Analysis by By Origin: Introduction
- 5.4.2. Market Size Absolute $ Opportunity Analysis and Forecast, By By Origin, 2016-2032
- 5.4.3. Synthetic Surfactants
- 5.4.4. Bio-based Surfactants
- 5.5. Western Europe Surfactants Market Analysis, Opportunity and Forecast, By By Application, 2016-2032
- 5.5.1. Western Europe Surfactants Market Analysis by By Application: Introduction
- 5.5.2. Market Size Absolute $ Opportunity Analysis and Forecast, By By Application, 2016-2032
- 5.5.3. Home Care
- 5.5.4. Personal Care
- 5.5.5. Oilfield Chemicals
- 5.5.6. Food & Beverage
- 5.5.7. Agrochemicals
- 5.5.8. Textiles
- 5.5.9. Plastics
- 5.5.10. Industrial & Institutional Cleaning
- 5.6. Western Europe Surfactants Market Analysis, Opportunity and Forecast, By Country , 2016-2032
- 5.6.1. Western Europe Surfactants Market Analysis by Country : Introduction
- 5.6.2. Market Size Absolute $ Opportunity Analysis and Forecast, Country , 2016-2032
- 5.6.2.1. Germany
- 5.6.2.2. France
- 5.6.2.3. The UK
- 5.6.2.4. Spain
- 5.6.2.5. Italy
- 5.6.2.6. Portugal
- 5.6.2.7. Ireland
- 5.6.2.8. Austria
- 5.6.2.9. Switzerland
- 5.6.2.10. Benelux
- 5.6.2.11. Nordic
- 5.6.2.12. Rest of Western Europe
- 6. Eastern Europe Surfactants Market Analysis, Opportunity and Forecast, 2016-2032
- 6.1. Eastern Europe Surfactants Market Analysis, 2016-2021
- 6.2. Eastern Europe Surfactants Market Opportunity and Forecast, 2023-2032
- 6.3. Eastern Europe Surfactants Market Analysis, Opportunity and Forecast, By By Type, 2016-2032
- 6.3.1. Eastern Europe Surfactants Market Analysis by By Type: Introduction
- 6.3.2. Market Size Absolute $ Opportunity Analysis and Forecast, By By Type, 2016-2032
- 6.3.3. Anionic Surfactants
- 6.3.4. Non-ionic Surfactants
- 6.3.5. Cationic Surfactants
- 6.3.6. Amphoteric Surfactants
- 6.3.7. Others
- 6.4. Eastern Europe Surfactants Market Analysis, Opportunity and Forecast, By By Origin, 2016-2032
- 6.4.1. Eastern Europe Surfactants Market Analysis by By Origin: Introduction
- 6.4.2. Market Size Absolute $ Opportunity Analysis and Forecast, By By Origin, 2016-2032
- 6.4.3. Synthetic Surfactants
- 6.4.4. Bio-based Surfactants
- 6.5. Eastern Europe Surfactants Market Analysis, Opportunity and Forecast, By By Application, 2016-2032
- 6.5.1. Eastern Europe Surfactants Market Analysis by By Application: Introduction
- 6.5.2. Market Size Absolute $ Opportunity Analysis and Forecast, By By Application, 2016-2032
- 6.5.3. Home Care
- 6.5.4. Personal Care
- 6.5.5. Oilfield Chemicals
- 6.5.6. Food & Beverage
- 6.5.7. Agrochemicals
- 6.5.8. Textiles
- 6.5.9. Plastics
- 6.5.10. Industrial & Institutional Cleaning
- 6.6. Eastern Europe Surfactants Market Analysis, Opportunity and Forecast, By Country , 2016-2032
- 6.6.1. Eastern Europe Surfactants Market Analysis by Country : Introduction
- 6.6.2. Market Size Absolute $ Opportunity Analysis and Forecast, Country , 2016-2032
- 6.6.2.1. Russia
- 6.6.2.2. Poland
- 6.6.2.3. The Czech Republic
- 6.6.2.4. Greece
- 6.6.2.5. Rest of Eastern Europe
- 7. APAC Surfactants Market Analysis, Opportunity and Forecast, 2016-2032
- 7.1. APAC Surfactants Market Analysis, 2016-2021
- 7.2. APAC Surfactants Market Opportunity and Forecast, 2023-2032
- 7.3. APAC Surfactants Market Analysis, Opportunity and Forecast, By By Type, 2016-2032
- 7.3.1. APAC Surfactants Market Analysis by By Type: Introduction
- 7.3.2. Market Size Absolute $ Opportunity Analysis and Forecast, By By Type, 2016-2032
- 7.3.3. Anionic Surfactants
- 7.3.4. Non-ionic Surfactants
- 7.3.5. Cationic Surfactants
- 7.3.6. Amphoteric Surfactants
- 7.3.7. Others
- 7.4. APAC Surfactants Market Analysis, Opportunity and Forecast, By By Origin, 2016-2032
- 7.4.1. APAC Surfactants Market Analysis by By Origin: Introduction
- 7.4.2. Market Size Absolute $ Opportunity Analysis and Forecast, By By Origin, 2016-2032
- 7.4.3. Synthetic Surfactants
- 7.4.4. Bio-based Surfactants
- 7.5. APAC Surfactants Market Analysis, Opportunity and Forecast, By By Application, 2016-2032
- 7.5.1. APAC Surfactants Market Analysis by By Application: Introduction
- 7.5.2. Market Size Absolute $ Opportunity Analysis and Forecast, By By Application, 2016-2032
- 7.5.3. Home Care
- 7.5.4. Personal Care
- 7.5.5. Oilfield Chemicals
- 7.5.6. Food & Beverage
- 7.5.7. Agrochemicals
- 7.5.8. Textiles
- 7.5.9. Plastics
- 7.5.10. Industrial & Institutional Cleaning
- 7.6. APAC Surfactants Market Analysis, Opportunity and Forecast, By Country , 2016-2032
- 7.6.1. APAC Surfactants Market Analysis by Country : Introduction
- 7.6.2. Market Size Absolute $ Opportunity Analysis and Forecast, Country , 2016-2032
- 7.6.2.1. China
- 7.6.2.2. Japan
- 7.6.2.3. South Korea
- 7.6.2.4. India
- 7.6.2.5. Australia & New Zeland
- 7.6.2.6. Indonesia
- 7.6.2.7. Malaysia
- 7.6.2.8. Philippines
- 7.6.2.9. Singapore
- 7.6.2.10. Thailand
- 7.6.2.11. Vietnam
- 7.6.2.12. Rest of APAC
- 8. Latin America Surfactants Market Analysis, Opportunity and Forecast, 2016-2032
- 8.1. Latin America Surfactants Market Analysis, 2016-2021
- 8.2. Latin America Surfactants Market Opportunity and Forecast, 2023-2032
- 8.3. Latin America Surfactants Market Analysis, Opportunity and Forecast, By By Type, 2016-2032
- 8.3.1. Latin America Surfactants Market Analysis by By Type: Introduction
- 8.3.2. Market Size Absolute $ Opportunity Analysis and Forecast, By By Type, 2016-2032
- 8.3.3. Anionic Surfactants
- 8.3.4. Non-ionic Surfactants
- 8.3.5. Cationic Surfactants
- 8.3.6. Amphoteric Surfactants
- 8.3.7. Others
- 8.4. Latin America Surfactants Market Analysis, Opportunity and Forecast, By By Origin, 2016-2032
- 8.4.1. Latin America Surfactants Market Analysis by By Origin: Introduction
- 8.4.2. Market Size Absolute $ Opportunity Analysis and Forecast, By By Origin, 2016-2032
- 8.4.3. Synthetic Surfactants
- 8.4.4. Bio-based Surfactants
- 8.5. Latin America Surfactants Market Analysis, Opportunity and Forecast, By By Application, 2016-2032
- 8.5.1. Latin America Surfactants Market Analysis by By Application: Introduction
- 8.5.2. Market Size Absolute $ Opportunity Analysis and Forecast, By By Application, 2016-2032
- 8.5.3. Home Care
- 8.5.4. Personal Care
- 8.5.5. Oilfield Chemicals
- 8.5.6. Food & Beverage
- 8.5.7. Agrochemicals
- 8.5.8. Textiles
- 8.5.9. Plastics
- 8.5.10. Industrial & Institutional Cleaning
- 8.6. Latin America Surfactants Market Analysis, Opportunity and Forecast, By Country , 2016-2032
- 8.6.1. Latin America Surfactants Market Analysis by Country : Introduction
- 8.6.2. Market Size Absolute $ Opportunity Analysis and Forecast, Country , 2016-2032
- 8.6.2.1. Brazil
- 8.6.2.2. Colombia
- 8.6.2.3. Chile
- 8.6.2.4. Argentina
- 8.6.2.5. Costa Rica
- 8.6.2.6. Rest of Latin America
- 9. Middle East & Africa Surfactants Market Analysis, Opportunity and Forecast, 2016-2032
- 9.1. Middle East & Africa Surfactants Market Analysis, 2016-2021
- 9.2. Middle East & Africa Surfactants Market Opportunity and Forecast, 2023-2032
- 9.3. Middle East & Africa Surfactants Market Analysis, Opportunity and Forecast, By By Type, 2016-2032
- 9.3.1. Middle East & Africa Surfactants Market Analysis by By Type: Introduction
- 9.3.2. Market Size Absolute $ Opportunity Analysis and Forecast, By By Type, 2016-2032
- 9.3.3. Anionic Surfactants
- 9.3.4. Non-ionic Surfactants
- 9.3.5. Cationic Surfactants
- 9.3.6. Amphoteric Surfactants
- 9.3.7. Others
- 9.4. Middle East & Africa Surfactants Market Analysis, Opportunity and Forecast, By By Origin, 2016-2032
- 9.4.1. Middle East & Africa Surfactants Market Analysis by By Origin: Introduction
- 9.4.2. Market Size Absolute $ Opportunity Analysis and Forecast, By By Origin, 2016-2032
- 9.4.3. Synthetic Surfactants
- 9.4.4. Bio-based Surfactants
- 9.5. Middle East & Africa Surfactants Market Analysis, Opportunity and Forecast, By By Application, 2016-2032
- 9.5.1. Middle East & Africa Surfactants Market Analysis by By Application: Introduction
- 9.5.2. Market Size Absolute $ Opportunity Analysis and Forecast, By By Application, 2016-2032
- 9.5.3. Home Care
- 9.5.4. Personal Care
- 9.5.5. Oilfield Chemicals
- 9.5.6. Food & Beverage
- 9.5.7. Agrochemicals
- 9.5.8. Textiles
- 9.5.9. Plastics
- 9.5.10. Industrial & Institutional Cleaning
- 9.6. Middle East & Africa Surfactants Market Analysis, Opportunity and Forecast, By Country , 2016-2032
- 9.6.1. Middle East & Africa Surfactants Market Analysis by Country : Introduction
- 9.6.2. Market Size Absolute $ Opportunity Analysis and Forecast, Country , 2016-2032
- 9.6.2.1. Algeria
- 9.6.2.2. Egypt
- 9.6.2.3. Israel
- 9.6.2.4. Kuwait
- 9.6.2.5. Nigeria
- 9.6.2.6. Saudi Arabia
- 9.6.2.7. South Africa
- 9.6.2.8. Turkey
- 9.6.2.9. The UAE
- 9.6.2.10. Rest of MEA
- 10. Global Surfactants Market Analysis, Opportunity and Forecast, By Region , 2016-2032
- 10.1. Global Surfactants Market Analysis by Region : Introduction
- 10.2. Market Size Absolute $ Opportunity Analysis and Forecast, By Region , 2016-2032
- 10.2.1. North America
- 10.2.2. Western Europe
- 10.2.3. Eastern Europe
- 10.2.4. APAC
- 10.2.5. Latin America
- 10.2.6. Middle East & Africa
- 11. Global Surfactants Market Competitive Landscape, Market Share Analysis, and Company Profiles
- 11.1. Market Share Analysis
- 11.2. Company Profiles
- 11.3. BASF SE
- 11.3.1. Company Overview
- 11.3.2. Financial Highlights
- 11.3.3. Product Portfolio
- 11.3.4. SWOT Analysis
- 11.3.5. Key Strategies and Developments
- 11.4. Stepan Company
- 11.4.1. Company Overview
- 11.4.2. Financial Highlights
- 11.4.3. Product Portfolio
- 11.4.4. SWOT Analysis
- 11.4.5. Key Strategies and Developments
- 11.5. Evonik Industries AG
- 11.5.1. Company Overview
- 11.5.2. Financial Highlights
- 11.5.3. Product Portfolio
- 11.5.4. SWOT Analysis
- 11.5.5. Key Strategies and Developments
- 11.6. Dow Inc.
- 11.6.1. Company Overview
- 11.6.2. Financial Highlights
- 11.6.3. Product Portfolio
- 11.6.4. SWOT Analysis
- 11.6.5. Key Strategies and Developments
- 11.7. Nouryon
- 11.7.1. Company Overview
- 11.7.2. Financial Highlights
- 11.7.3. Product Portfolio
- 11.7.4. SWOT Analysis
- 11.7.5. Key Strategies and Developments
- 11.8. Solvay S.A.
- 11.8.1. Company Overview
- 11.8.2. Financial Highlights
- 11.8.3. Product Portfolio
- 11.8.4. SWOT Analysis
- 11.8.5. Key Strategies and Developments
- 11.9. Arkema
- 11.9.1. Company Overview
- 11.9.2. Financial Highlights
- 11.9.3. Product Portfolio
- 11.9.4. SWOT Analysis
- 11.9.5. Key Strategies and Developments
- 11.10. Ashland
- 11.10.1. Company Overview
- 11.10.2. Financial Highlights
- 11.10.3. Product Portfolio
- 11.10.4. SWOT Analysis
- 11.10.5. Key Strategies and Developments
- 11.11. Bayer AG
- 11.11.1. Company Overview
- 11.11.2. Financial Highlights
- 11.11.3. Product Portfolio
- 11.11.4. SWOT Analysis
- 11.11.5. Key Strategies and Developments
- 11.12. Clariant
- 11.12.1. Company Overview
- 11.12.2. Financial Highlights
- 11.12.3. Product Portfolio
- 11.12.4. SWOT Analysis
- 11.12.5. Key Strategies and Developments
- 11.13.1. Company Overview
- 11.13.2. Financial Highlights
- 11.13.3. Product Portfolio
- 11.13.4. SWOT Analysis
- 11.13.5. Key Strategies and Developments
- 11.14. Croda International PLC
- 11.14.1. Company Overview
- 11.14.2. Financial Highlights
- 11.14.3. Product Portfolio
- 11.14.4. SWOT Analysis
- 11.14.5. Key Strategies and Developments
- 11.15. Cepsa
- 11.15.1. Company Overview
- 11.15.2. Financial Highlights
- 11.15.3. Product Portfolio
- 11.15.4. SWOT Analysis
- 11.15.5. Key Strategies and Developments
- 11.16. Galaxy Surfactants
- 11.16.1. Company Overview
- 11.16.2. Financial Highlights
- 11.16.3. Product Portfolio
- 11.16.4. SWOT Analysis
- 11.16.5. Key Strategies and Developments
- 11.17. Huntsman International LLC
- 11.17.1. Company Overview
- 11.17.2. Financial Highlights
- 11.17.3. Product Portfolio
- 11.17.4. SWOT Analysis
- 11.17.5. Key Strategies and Developments
- 11.18. Kao Corporation
- 11.18.1. Company Overview
- 11.18.2. Financial Highlights
- 11.18.3. Product Portfolio
- 11.18.4. SWOT Analysis
- 11.18.5. Key Strategies and Developments
- 11.19. Lonza
- 11.19.1. Company Overview
- 11.19.2. Financial Highlights
- 11.19.3. Product Portfolio
- 11.19.4. SWOT Analysis
- 11.19.5. Key Strategies and Developments
- 11.20. Sanyo Chemical Industries Ltd
- 11.20.1. Company Overview
- 11.20.2. Financial Highlights
- 11.20.3. Product Portfolio
- 11.20.4. SWOT Analysis
- 11.20.5. Key Strategies and Developments
- 11.21. Sasol
- 11.21.1. Company Overview
- 11.21.2. Financial Highlights
- 11.21.3. Product Portfolio
- 11.21.4. SWOT Analysis
- 11.21.5. Key Strategies and Developments
- 11.22. Godrej Industries Limited
- 11.22.1. Company Overview
- 11.22.2. Financial Highlights
- 11.22.3. Product Portfolio
- 11.22.4. SWOT Analysis
- 11.22.5. Key Strategies and Developments
- 12. Assumptions and Acronyms
- 13. Research Methodology
- 14. Contact
"
- List of Figures
- "
- Figure 1: Global Surfactants Market Revenue (US$ Mn) Market Share by By Type in 2022
- Figure 2: Global Surfactants Market Market Attractiveness Analysis by By Type, 2016-2032
- Figure 3: Global Surfactants Market Revenue (US$ Mn) Market Share by By Originin 2022
- Figure 4: Global Surfactants Market Market Attractiveness Analysis by By Origin, 2016-2032
- Figure 5: Global Surfactants Market Revenue (US$ Mn) Market Share by By Applicationin 2022
- Figure 6: Global Surfactants Market Market Attractiveness Analysis by By Application, 2016-2032
- Figure 7: Global Surfactants Market Revenue (US$ Mn) Market Share by Region in 2022
- Figure 8: Global Surfactants Market Market Attractiveness Analysis by Region, 2016-2032
- Figure 9: Global Surfactants Market Market Revenue (US$ Mn) (2016-2032)
- Figure 10: Global Surfactants Market Market Revenue (US$ Mn) Comparison by Region (2016-2032)
- Figure 11: Global Surfactants Market Market Revenue (US$ Mn) Comparison by By Type (2016-2032)
- Figure 12: Global Surfactants Market Market Revenue (US$ Mn) Comparison by By Origin (2016-2032)
- Figure 13: Global Surfactants Market Market Revenue (US$ Mn) Comparison by By Application (2016-2032)
- Figure 14: Global Surfactants Market Market Y-o-Y Growth Rate Comparison by Region (2016-2032)
- Figure 15: Global Surfactants Market Market Y-o-Y Growth Rate Comparison by By Type (2016-2032)
- Figure 16: Global Surfactants Market Market Y-o-Y Growth Rate Comparison by By Origin (2016-2032)
- Figure 17: Global Surfactants Market Market Y-o-Y Growth Rate Comparison by By Application (2016-2032)
- Figure 18: Global Surfactants Market Market Share Comparison by Region (2016-2032)
- Figure 19: Global Surfactants Market Market Share Comparison by By Type (2016-2032)
- Figure 20: Global Surfactants Market Market Share Comparison by By Origin (2016-2032)
- Figure 21: Global Surfactants Market Market Share Comparison by By Application (2016-2032)
- Figure 22: North America Surfactants Market Revenue (US$ Mn) Market Share by By Typein 2022
- Figure 23: North America Surfactants Market Market Attractiveness Analysis by By Type, 2016-2032
- Figure 24: North America Surfactants Market Revenue (US$ Mn) Market Share by By Originin 2022
- Figure 25: North America Surfactants Market Market Attractiveness Analysis by By Origin, 2016-2032
- Figure 26: North America Surfactants Market Revenue (US$ Mn) Market Share by By Applicationin 2022
- Figure 27: North America Surfactants Market Market Attractiveness Analysis by By Application, 2016-2032
- Figure 28: North America Surfactants Market Revenue (US$ Mn) Market Share by Country in 2022
- Figure 29: North America Surfactants Market Market Attractiveness Analysis by Country, 2016-2032
- Figure 30: North America Surfactants Market Market Revenue (US$ Mn) (2016-2032)
- Figure 31: North America Surfactants Market Market Revenue (US$ Mn) Comparison by Country (2016-2032)
- Figure 32: North America Surfactants Market Market Revenue (US$ Mn) Comparison by By Type (2016-2032)
- Figure 33: North America Surfactants Market Market Revenue (US$ Mn) Comparison by By Origin (2016-2032)
- Figure 34: North America Surfactants Market Market Revenue (US$ Mn) Comparison by By Application (2016-2032)
- Figure 35: North America Surfactants Market Market Y-o-Y Growth Rate Comparison by Country (2016-2032)
- Figure 36: North America Surfactants Market Market Y-o-Y Growth Rate Comparison by By Type (2016-2032)
- Figure 37: North America Surfactants Market Market Y-o-Y Growth Rate Comparison by By Origin (2016-2032)
- Figure 38: North America Surfactants Market Market Y-o-Y Growth Rate Comparison by By Application (2016-2032)
- Figure 39: North America Surfactants Market Market Share Comparison by Country (2016-2032)
- Figure 40: North America Surfactants Market Market Share Comparison by By Type (2016-2032)
- Figure 41: North America Surfactants Market Market Share Comparison by By Origin (2016-2032)
- Figure 42: North America Surfactants Market Market Share Comparison by By Application (2016-2032)
- Figure 43: Western Europe Surfactants Market Revenue (US$ Mn) Market Share by By Typein 2022
- Figure 44: Western Europe Surfactants Market Market Attractiveness Analysis by By Type, 2016-2032
- Figure 45: Western Europe Surfactants Market Revenue (US$ Mn) Market Share by By Originin 2022
- Figure 46: Western Europe Surfactants Market Market Attractiveness Analysis by By Origin, 2016-2032
- Figure 47: Western Europe Surfactants Market Revenue (US$ Mn) Market Share by By Applicationin 2022
- Figure 48: Western Europe Surfactants Market Market Attractiveness Analysis by By Application, 2016-2032
- Figure 49: Western Europe Surfactants Market Revenue (US$ Mn) Market Share by Country in 2022
- Figure 50: Western Europe Surfactants Market Market Attractiveness Analysis by Country, 2016-2032
- Figure 51: Western Europe Surfactants Market Market Revenue (US$ Mn) (2016-2032)
- Figure 52: Western Europe Surfactants Market Market Revenue (US$ Mn) Comparison by Country (2016-2032)
- Figure 53: Western Europe Surfactants Market Market Revenue (US$ Mn) Comparison by By Type (2016-2032)
- Figure 54: Western Europe Surfactants Market Market Revenue (US$ Mn) Comparison by By Origin (2016-2032)
- Figure 55: Western Europe Surfactants Market Market Revenue (US$ Mn) Comparison by By Application (2016-2032)
- Figure 56: Western Europe Surfactants Market Market Y-o-Y Growth Rate Comparison by Country (2016-2032)
- Figure 57: Western Europe Surfactants Market Market Y-o-Y Growth Rate Comparison by By Type (2016-2032)
- Figure 58: Western Europe Surfactants Market Market Y-o-Y Growth Rate Comparison by By Origin (2016-2032)
- Figure 59: Western Europe Surfactants Market Market Y-o-Y Growth Rate Comparison by By Application (2016-2032)
- Figure 60: Western Europe Surfactants Market Market Share Comparison by Country (2016-2032)
- Figure 61: Western Europe Surfactants Market Market Share Comparison by By Type (2016-2032)
- Figure 62: Western Europe Surfactants Market Market Share Comparison by By Origin (2016-2032)
- Figure 63: Western Europe Surfactants Market Market Share Comparison by By Application (2016-2032)
- Figure 64: Eastern Europe Surfactants Market Revenue (US$ Mn) Market Share by By Typein 2022
- Figure 65: Eastern Europe Surfactants Market Market Attractiveness Analysis by By Type, 2016-2032
- Figure 66: Eastern Europe Surfactants Market Revenue (US$ Mn) Market Share by By Originin 2022
- Figure 67: Eastern Europe Surfactants Market Market Attractiveness Analysis by By Origin, 2016-2032
- Figure 68: Eastern Europe Surfactants Market Revenue (US$ Mn) Market Share by By Applicationin 2022
- Figure 69: Eastern Europe Surfactants Market Market Attractiveness Analysis by By Application, 2016-2032
- Figure 70: Eastern Europe Surfactants Market Revenue (US$ Mn) Market Share by Country in 2022
- Figure 71: Eastern Europe Surfactants Market Market Attractiveness Analysis by Country, 2016-2032
- Figure 72: Eastern Europe Surfactants Market Market Revenue (US$ Mn) (2016-2032)
- Figure 73: Eastern Europe Surfactants Market Market Revenue (US$ Mn) Comparison by Country (2016-2032)
- Figure 74: Eastern Europe Surfactants Market Market Revenue (US$ Mn) Comparison by By Type (2016-2032)
- Figure 75: Eastern Europe Surfactants Market Market Revenue (US$ Mn) Comparison by By Origin (2016-2032)
- Figure 76: Eastern Europe Surfactants Market Market Revenue (US$ Mn) Comparison by By Application (2016-2032)
- Figure 77: Eastern Europe Surfactants Market Market Y-o-Y Growth Rate Comparison by Country (2016-2032)
- Figure 78: Eastern Europe Surfactants Market Market Y-o-Y Growth Rate Comparison by By Type (2016-2032)
- Figure 79: Eastern Europe Surfactants Market Market Y-o-Y Growth Rate Comparison by By Origin (2016-2032)
- Figure 80: Eastern Europe Surfactants Market Market Y-o-Y Growth Rate Comparison by By Application (2016-2032)
- Figure 81: Eastern Europe Surfactants Market Market Share Comparison by Country (2016-2032)
- Figure 82: Eastern Europe Surfactants Market Market Share Comparison by By Type (2016-2032)
- Figure 83: Eastern Europe Surfactants Market Market Share Comparison by By Origin (2016-2032)
- Figure 84: Eastern Europe Surfactants Market Market Share Comparison by By Application (2016-2032)
- Figure 85: APAC Surfactants Market Revenue (US$ Mn) Market Share by By Typein 2022
- Figure 86: APAC Surfactants Market Market Attractiveness Analysis by By Type, 2016-2032
- Figure 87: APAC Surfactants Market Revenue (US$ Mn) Market Share by By Originin 2022
- Figure 88: APAC Surfactants Market Market Attractiveness Analysis by By Origin, 2016-2032
- Figure 89: APAC Surfactants Market Revenue (US$ Mn) Market Share by By Applicationin 2022
- Figure 90: APAC Surfactants Market Market Attractiveness Analysis by By Application, 2016-2032
- Figure 91: APAC Surfactants Market Revenue (US$ Mn) Market Share by Country in 2022
- Figure 92: APAC Surfactants Market Market Attractiveness Analysis by Country, 2016-2032
- Figure 93: APAC Surfactants Market Market Revenue (US$ Mn) (2016-2032)
- Figure 94: APAC Surfactants Market Market Revenue (US$ Mn) Comparison by Country (2016-2032)
- Figure 95: APAC Surfactants Market Market Revenue (US$ Mn) Comparison by By Type (2016-2032)
- Figure 96: APAC Surfactants Market Market Revenue (US$ Mn) Comparison by By Origin (2016-2032)
- Figure 97: APAC Surfactants Market Market Revenue (US$ Mn) Comparison by By Application (2016-2032)
- Figure 98: APAC Surfactants Market Market Y-o-Y Growth Rate Comparison by Country (2016-2032)
- Figure 99: APAC Surfactants Market Market Y-o-Y Growth Rate Comparison by By Type (2016-2032)
- Figure 100: APAC Surfactants Market Market Y-o-Y Growth Rate Comparison by By Origin (2016-2032)
- Figure 101: APAC Surfactants Market Market Y-o-Y Growth Rate Comparison by By Application (2016-2032)
- Figure 102: APAC Surfactants Market Market Share Comparison by Country (2016-2032)
- Figure 103: APAC Surfactants Market Market Share Comparison by By Type (2016-2032)
- Figure 104: APAC Surfactants Market Market Share Comparison by By Origin (2016-2032)
- Figure 105: APAC Surfactants Market Market Share Comparison by By Application (2016-2032)
- Figure 106: Latin America Surfactants Market Revenue (US$ Mn) Market Share by By Typein 2022
- Figure 107: Latin America Surfactants Market Market Attractiveness Analysis by By Type, 2016-2032
- Figure 108: Latin America Surfactants Market Revenue (US$ Mn) Market Share by By Originin 2022
- Figure 109: Latin America Surfactants Market Market Attractiveness Analysis by By Origin, 2016-2032
- Figure 110: Latin America Surfactants Market Revenue (US$ Mn) Market Share by By Applicationin 2022
- Figure 111: Latin America Surfactants Market Market Attractiveness Analysis by By Application, 2016-2032
- Figure 112: Latin America Surfactants Market Revenue (US$ Mn) Market Share by Country in 2022
- Figure 113: Latin America Surfactants Market Market Attractiveness Analysis by Country, 2016-2032
- Figure 114: Latin America Surfactants Market Market Revenue (US$ Mn) (2016-2032)
- Figure 115: Latin America Surfactants Market Market Revenue (US$ Mn) Comparison by Country (2016-2032)
- Figure 116: Latin America Surfactants Market Market Revenue (US$ Mn) Comparison by By Type (2016-2032)
- Figure 117: Latin America Surfactants Market Market Revenue (US$ Mn) Comparison by By Origin (2016-2032)
- Figure 118: Latin America Surfactants Market Market Revenue (US$ Mn) Comparison by By Application (2016-2032)
- Figure 119: Latin America Surfactants Market Market Y-o-Y Growth Rate Comparison by Country (2016-2032)
- Figure 120: Latin America Surfactants Market Market Y-o-Y Growth Rate Comparison by By Type (2016-2032)
- Figure 121: Latin America Surfactants Market Market Y-o-Y Growth Rate Comparison by By Origin (2016-2032)
- Figure 122: Latin America Surfactants Market Market Y-o-Y Growth Rate Comparison by By Application (2016-2032)
- Figure 123: Latin America Surfactants Market Market Share Comparison by Country (2016-2032)
- Figure 124: Latin America Surfactants Market Market Share Comparison by By Type (2016-2032)
- Figure 125: Latin America Surfactants Market Market Share Comparison by By Origin (2016-2032)
- Figure 126: Latin America Surfactants Market Market Share Comparison by By Application (2016-2032)
- Figure 127: Middle East & Africa Surfactants Market Revenue (US$ Mn) Market Share by By Typein 2022
- Figure 128: Middle East & Africa Surfactants Market Market Attractiveness Analysis by By Type, 2016-2032
- Figure 129: Middle East & Africa Surfactants Market Revenue (US$ Mn) Market Share by By Originin 2022
- Figure 130: Middle East & Africa Surfactants Market Market Attractiveness Analysis by By Origin, 2016-2032
- Figure 131: Middle East & Africa Surfactants Market Revenue (US$ Mn) Market Share by By Applicationin 2022
- Figure 132: Middle East & Africa Surfactants Market Market Attractiveness Analysis by By Application, 2016-2032
- Figure 133: Middle East & Africa Surfactants Market Revenue (US$ Mn) Market Share by Country in 2022
- Figure 134: Middle East & Africa Surfactants Market Market Attractiveness Analysis by Country, 2016-2032
- Figure 135: Middle East & Africa Surfactants Market Market Revenue (US$ Mn) (2016-2032)
- Figure 136: Middle East & Africa Surfactants Market Market Revenue (US$ Mn) Comparison by Country (2016-2032)
- Figure 137: Middle East & Africa Surfactants Market Market Revenue (US$ Mn) Comparison by By Type (2016-2032)
- Figure 138: Middle East & Africa Surfactants Market Market Revenue (US$ Mn) Comparison by By Origin (2016-2032)
- Figure 139: Middle East & Africa Surfactants Market Market Revenue (US$ Mn) Comparison by By Application (2016-2032)
- Figure 140: Middle East & Africa Surfactants Market Market Y-o-Y Growth Rate Comparison by Country (2016-2032)
- Figure 141: Middle East & Africa Surfactants Market Market Y-o-Y Growth Rate Comparison by By Type (2016-2032)
- Figure 142: Middle East & Africa Surfactants Market Market Y-o-Y Growth Rate Comparison by By Origin (2016-2032)
- Figure 143: Middle East & Africa Surfactants Market Market Y-o-Y Growth Rate Comparison by By Application (2016-2032)
- Figure 144: Middle East & Africa Surfactants Market Market Share Comparison by Country (2016-2032)
- Figure 145: Middle East & Africa Surfactants Market Market Share Comparison by By Type (2016-2032)
- Figure 146: Middle East & Africa Surfactants Market Market Share Comparison by By Origin (2016-2032)
- Figure 147: Middle East & Africa Surfactants Market Market Share Comparison by By Application (2016-2032)
"
- List of Tables
- "
- Table 1: Global Surfactants Market Market Comparison by By Type (2016-2032)
- Table 2: Global Surfactants Market Market Comparison by By Origin (2016-2032)
- Table 3: Global Surfactants Market Market Comparison by By Application (2016-2032)
- Table 4: Global Surfactants Market Revenue (US$ Mn) Comparison by Region (2016-2032)
- Table 5: Global Surfactants Market Market Revenue (US$ Mn) (2016-2032)
- Table 6: Global Surfactants Market Market Revenue (US$ Mn) Comparison by Region (2016-2032)
- Table 7: Global Surfactants Market Market Revenue (US$ Mn) Comparison by By Type (2016-2032)
- Table 8: Global Surfactants Market Market Revenue (US$ Mn) Comparison by By Origin (2016-2032)
- Table 9: Global Surfactants Market Market Revenue (US$ Mn) Comparison by By Application (2016-2032)
- Table 10: Global Surfactants Market Market Y-o-Y Growth Rate Comparison by Region (2016-2032)
- Table 11: Global Surfactants Market Market Y-o-Y Growth Rate Comparison by By Type (2016-2032)
- Table 12: Global Surfactants Market Market Y-o-Y Growth Rate Comparison by By Origin (2016-2032)
- Table 13: Global Surfactants Market Market Y-o-Y Growth Rate Comparison by By Application (2016-2032)
- Table 14: Global Surfactants Market Market Share Comparison by Region (2016-2032)
- Table 15: Global Surfactants Market Market Share Comparison by By Type (2016-2032)
- Table 16: Global Surfactants Market Market Share Comparison by By Origin (2016-2032)
- Table 17: Global Surfactants Market Market Share Comparison by By Application (2016-2032)
- Table 18: North America Surfactants Market Market Comparison by By Origin (2016-2032)
- Table 19: North America Surfactants Market Market Comparison by By Application (2016-2032)
- Table 20: North America Surfactants Market Revenue (US$ Mn) Comparison by Country (2016-2032)
- Table 21: North America Surfactants Market Market Revenue (US$ Mn) (2016-2032)
- Table 22: North America Surfactants Market Market Revenue (US$ Mn) Comparison by Country (2016-2032)
- Table 23: North America Surfactants Market Market Revenue (US$ Mn) Comparison by By Type (2016-2032)
- Table 24: North America Surfactants Market Market Revenue (US$ Mn) Comparison by By Origin (2016-2032)
- Table 25: North America Surfactants Market Market Revenue (US$ Mn) Comparison by By Application (2016-2032)
- Table 26: North America Surfactants Market Market Y-o-Y Growth Rate Comparison by Country (2016-2032)
- Table 27: North America Surfactants Market Market Y-o-Y Growth Rate Comparison by By Type (2016-2032)
- Table 28: North America Surfactants Market Market Y-o-Y Growth Rate Comparison by By Origin (2016-2032)
- Table 29: North America Surfactants Market Market Y-o-Y Growth Rate Comparison by By Application (2016-2032)
- Table 30: North America Surfactants Market Market Share Comparison by Country (2016-2032)
- Table 31: North America Surfactants Market Market Share Comparison by By Type (2016-2032)
- Table 32: North America Surfactants Market Market Share Comparison by By Origin (2016-2032)
- Table 33: North America Surfactants Market Market Share Comparison by By Application (2016-2032)
- Table 34: Western Europe Surfactants Market Market Comparison by By Type (2016-2032)
- Table 35: Western Europe Surfactants Market Market Comparison by By Origin (2016-2032)
- Table 36: Western Europe Surfactants Market Market Comparison by By Application (2016-2032)
- Table 37: Western Europe Surfactants Market Revenue (US$ Mn) Comparison by Country (2016-2032)
- Table 38: Western Europe Surfactants Market Market Revenue (US$ Mn) (2016-2032)
- Table 39: Western Europe Surfactants Market Market Revenue (US$ Mn) Comparison by Country (2016-2032)
- Table 40: Western Europe Surfactants Market Market Revenue (US$ Mn) Comparison by By Type (2016-2032)
- Table 41: Western Europe Surfactants Market Market Revenue (US$ Mn) Comparison by By Origin (2016-2032)
- Table 42: Western Europe Surfactants Market Market Revenue (US$ Mn) Comparison by By Application (2016-2032)
- Table 43: Western Europe Surfactants Market Market Y-o-Y Growth Rate Comparison by Country (2016-2032)
- Table 44: Western Europe Surfactants Market Market Y-o-Y Growth Rate Comparison by By Type (2016-2032)
- Table 45: Western Europe Surfactants Market Market Y-o-Y Growth Rate Comparison by By Origin (2016-2032)
- Table 46: Western Europe Surfactants Market Market Y-o-Y Growth Rate Comparison by By Application (2016-2032)
- Table 47: Western Europe Surfactants Market Market Share Comparison by Country (2016-2032)
- Table 48: Western Europe Surfactants Market Market Share Comparison by By Type (2016-2032)
- Table 49: Western Europe Surfactants Market Market Share Comparison by By Origin (2016-2032)
- Table 50: Western Europe Surfactants Market Market Share Comparison by By Application (2016-2032)
- Table 51: Eastern Europe Surfactants Market Market Comparison by By Type (2016-2032)
- Table 52: Eastern Europe Surfactants Market Market Comparison by By Origin (2016-2032)
- Table 53: Eastern Europe Surfactants Market Market Comparison by By Application (2016-2032)
- Table 54: Eastern Europe Surfactants Market Revenue (US$ Mn) Comparison by Country (2016-2032)
- Table 55: Eastern Europe Surfactants Market Market Revenue (US$ Mn) (2016-2032)
- Table 56: Eastern Europe Surfactants Market Market Revenue (US$ Mn) Comparison by Country (2016-2032)
- Table 57: Eastern Europe Surfactants Market Market Revenue (US$ Mn) Comparison by By Type (2016-2032)
- Table 58: Eastern Europe Surfactants Market Market Revenue (US$ Mn) Comparison by By Origin (2016-2032)
- Table 59: Eastern Europe Surfactants Market Market Revenue (US$ Mn) Comparison by By Application (2016-2032)
- Table 60: Eastern Europe Surfactants Market Market Y-o-Y Growth Rate Comparison by Country (2016-2032)
- Table 61: Eastern Europe Surfactants Market Market Y-o-Y Growth Rate Comparison by By Type (2016-2032)
- Table 62: Eastern Europe Surfactants Market Market Y-o-Y Growth Rate Comparison by By Origin (2016-2032)
- Table 63: Eastern Europe Surfactants Market Market Y-o-Y Growth Rate Comparison by By Application (2016-2032)
- Table 64: Eastern Europe Surfactants Market Market Share Comparison by Country (2016-2032)
- Table 65: Eastern Europe Surfactants Market Market Share Comparison by By Type (2016-2032)
- Table 66: Eastern Europe Surfactants Market Market Share Comparison by By Origin (2016-2032)
- Table 67: Eastern Europe Surfactants Market Market Share Comparison by By Application (2016-2032)
- Table 68: APAC Surfactants Market Market Comparison by By Type (2016-2032)
- Table 69: APAC Surfactants Market Market Comparison by By Origin (2016-2032)
- Table 70: APAC Surfactants Market Market Comparison by By Application (2016-2032)
- Table 71: APAC Surfactants Market Revenue (US$ Mn) Comparison by Country (2016-2032)
- Table 72: APAC Surfactants Market Market Revenue (US$ Mn) (2016-2032)
- Table 73: APAC Surfactants Market Market Revenue (US$ Mn) Comparison by Country (2016-2032)
- Table 74: APAC Surfactants Market Market Revenue (US$ Mn) Comparison by By Type (2016-2032)
- Table 75: APAC Surfactants Market Market Revenue (US$ Mn) Comparison by By Origin (2016-2032)
- Table 76: APAC Surfactants Market Market Revenue (US$ Mn) Comparison by By Application (2016-2032)
- Table 77: APAC Surfactants Market Market Y-o-Y Growth Rate Comparison by Country (2016-2032)
- Table 78: APAC Surfactants Market Market Y-o-Y Growth Rate Comparison by By Type (2016-2032)
- Table 79: APAC Surfactants Market Market Y-o-Y Growth Rate Comparison by By Origin (2016-2032)
- Table 80: APAC Surfactants Market Market Y-o-Y Growth Rate Comparison by By Application (2016-2032)
- Table 81: APAC Surfactants Market Market Share Comparison by Country (2016-2032)
- Table 82: APAC Surfactants Market Market Share Comparison by By Type (2016-2032)
- Table 83: APAC Surfactants Market Market Share Comparison by By Origin (2016-2032)
- Table 84: APAC Surfactants Market Market Share Comparison by By Application (2016-2032)
- Table 85: Latin America Surfactants Market Market Comparison by By Type (2016-2032)
- Table 86: Latin America Surfactants Market Market Comparison by By Origin (2016-2032)
- Table 87: Latin America Surfactants Market Market Comparison by By Application (2016-2032)
- Table 88: Latin America Surfactants Market Revenue (US$ Mn) Comparison by Country (2016-2032)
- Table 89: Latin America Surfactants Market Market Revenue (US$ Mn) (2016-2032)
- Table 90: Latin America Surfactants Market Market Revenue (US$ Mn) Comparison by Country (2016-2032)
- Table 91: Latin America Surfactants Market Market Revenue (US$ Mn) Comparison by By Type (2016-2032)
- Table 92: Latin America Surfactants Market Market Revenue (US$ Mn) Comparison by By Origin (2016-2032)
- Table 93: Latin America Surfactants Market Market Revenue (US$ Mn) Comparison by By Application (2016-2032)
- Table 94: Latin America Surfactants Market Market Y-o-Y Growth Rate Comparison by Country (2016-2032)
- Table 95: Latin America Surfactants Market Market Y-o-Y Growth Rate Comparison by By Type (2016-2032)
- Table 96: Latin America Surfactants Market Market Y-o-Y Growth Rate Comparison by By Origin (2016-2032)
- Table 97: Latin America Surfactants Market Market Y-o-Y Growth Rate Comparison by By Application (2016-2032)
- Table 98: Latin America Surfactants Market Market Share Comparison by Country (2016-2032)
- Table 99: Latin America Surfactants Market Market Share Comparison by By Type (2016-2032)
- Table 100: Latin America Surfactants Market Market Share Comparison by By Origin (2016-2032)
- Table 101: Latin America Surfactants Market Market Share Comparison by By Application (2016-2032)
- Table 102: Middle East & Africa Surfactants Market Market Comparison by By Type (2016-2032)
- Table 103: Middle East & Africa Surfactants Market Market Comparison by By Origin (2016-2032)
- Table 104: Middle East & Africa Surfactants Market Market Comparison by By Application (2016-2032)
- Table 105: Middle East & Africa Surfactants Market Revenue (US$ Mn) Comparison by Country (2016-2032)
- Table 106: Middle East & Africa Surfactants Market Market Revenue (US$ Mn) (2016-2032)
- Table 107: Middle East & Africa Surfactants Market Market Revenue (US$ Mn) Comparison by Country (2016-2032)
- Table 108: Middle East & Africa Surfactants Market Market Revenue (US$ Mn) Comparison by By Type (2016-2032)
- Table 109: Middle East & Africa Surfactants Market Market Revenue (US$ Mn) Comparison by By Origin (2016-2032)
- Table 110: Middle East & Africa Surfactants Market Market Revenue (US$ Mn) Comparison by By Application (2016-2032)
- Table 111: Middle East & Africa Surfactants Market Market Y-o-Y Growth Rate Comparison by Country (2016-2032)
- Table 112: Middle East & Africa Surfactants Market Market Y-o-Y Growth Rate Comparison by By Type (2016-2032)
- Table 113: Middle East & Africa Surfactants Market Market Y-o-Y Growth Rate Comparison by By Origin (2016-2032)
- Table 114: Middle East & Africa Surfactants Market Market Y-o-Y Growth Rate Comparison by By Application (2016-2032)
- Table 115: Middle East & Africa Surfactants Market Market Share Comparison by Country (2016-2032)
- Table 116: Middle East & Africa Surfactants Market Market Share Comparison by By Type (2016-2032)
- Table 117: Middle East & Africa Surfactants Market Market Share Comparison by By Origin (2016-2032)
- Table 118: Middle East & Africa Surfactants Market Market Share Comparison by By Application (2016-2032)
- 1. Executive Summary
-
- BASF SE
- Stepan Company
- Evonik Industries AG
- Dow Inc.
- Nouryon
- Solvay S.A.
- Arkema
- Ashland
- Bayer AG
- Clariant
- Croda International PLC
- DETEN Quimica SA
- Cepsa
- Galaxy Surfactants
- Huntsman International LLC
- Kao Corporation
- Lonza
- Sanyo Chemical Industries Ltd
- Sasol
- Godrej Industries Limited
- Innospec
- Procter & Gamble
- Henkel Corporation
- Mitsui Chemicals America, Inc.
Our Clients


View Our Licence Options
