Geochemical Services Market By Component (Solution and Service), By Application (Network Security, Network Optimization, Customer Analytics , Virtual Assistance, Self-Diagnostics and Others), By Technology (Machine Learning, Natural Language Processing (NLP), Data Analytics and Others), By Region And Companies - Industry Segment Outlook, Market Assessment, Competition Scenario, Trends, And Forecast 2024-2033
-
25370
-
May 2024
-
300
-


-
This report was compiled by Shreyas Rokade Shreyas Rokade is a seasoned Research Analyst with CMFE, bringing extensive expertise in market research and consulting, with a strong background in Chemical Engineering. Correspondence Team Lead-CMFE Linkedin | Detailed Market research Methodology Our methodology involves a mix of primary research, including interviews with leading mental health experts, and secondary research from reputable medical journals and databases. View Detailed Methodology Page
-
Quick Navigation
Report Overview
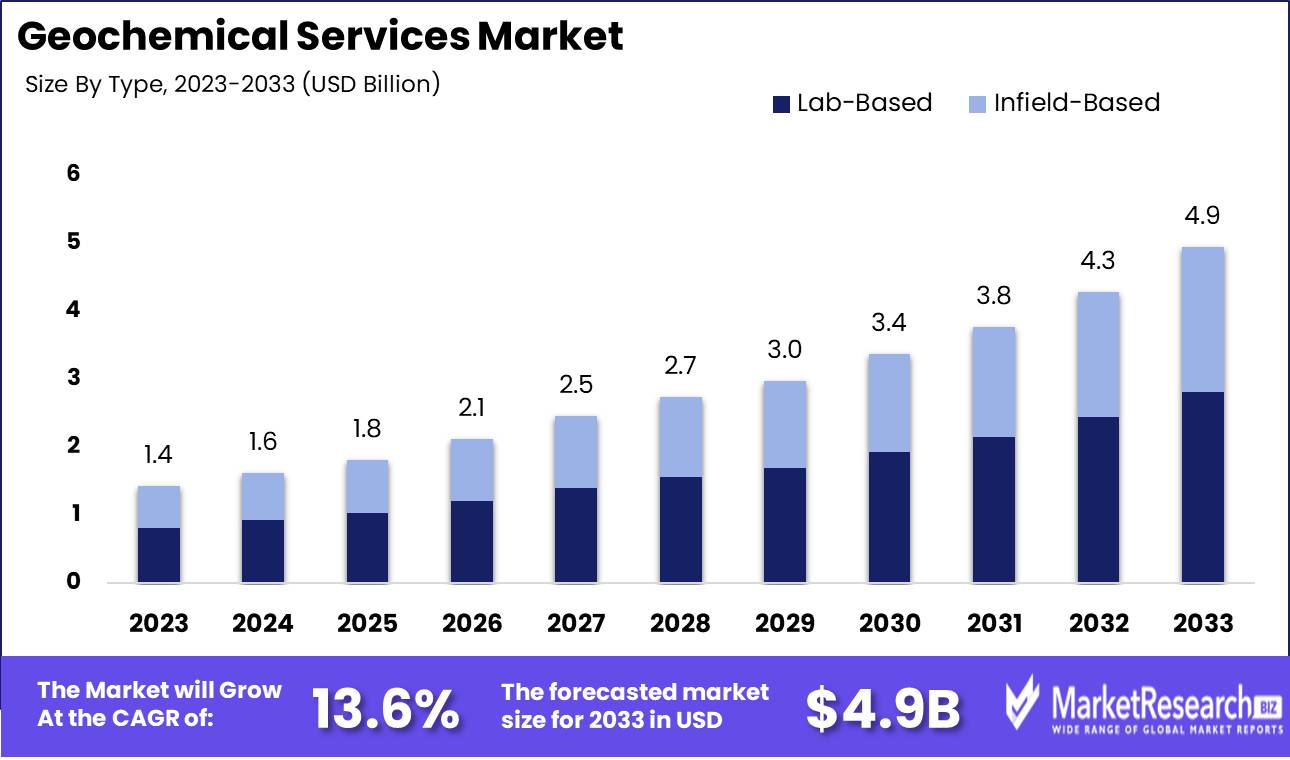
The Geochemical Services Market size was valued at USD 1.43 billion in 2023 and is expected to reach USD 4.9 billion by 2033, with a CAGR of 13.6% during the forecast period from 2024 to 2033.
The surge in demand in the mining and metal sector, and advanced research and developments are some of the main driving factors for the geochemical service market expansion. Geochemical services are the study of the source, development, and supply of different chemical components that are present in rock-forming minerals. It offers a wide range of testing that is meant to evaluate the geographical features of respective areas.
The geochemical services are technology-based and need detailed equipment along with a highly skilled human team. It also helps in analyzing the geographical elements like rock, soil, water, etc. The upsurge in demand for mining work for commercial and industrial purposes will also help in market expansion over the forecast period. The advanced technologies boost the geochemical service market to control the geochemical labs in different areas, this will also help in the market growth of the geochemical services.
Geochemical services require geochemical data to understand potential future discoveries. Most of the geochemical data points are precious and each of the points represents funding of time, money, and other resources. Précised data description and curation are needed to enhance RoI, ensure long-term use, and assist translucent and reproducible scientific R&D. Prevention of data is important where ephemeral samples are obtained again in the future like gas or water samples. Geochemical services often use geochemical data to diversify their character.
The value of the geochemical data is amplified if the information and metadata are consistently organized to be easily accessible and convenient for machine readability and wholly interoperable for computational and statistical procedures. Interoperability permits the data that has been in curated databases and helps others to combine into large global datasets that can cover the whole earth's history. The demand for geochemical services will increase due to their requirement in the mineral industry which will help in market expansion in the coming years.
Key Takeaways
- Market Growth: The Geochemical Services Market size was valued at USD 1.43 billion in 2023 and is expected to reach USD 4.9 billion by 2033, with a CAGR of 13.6% during the forecast period from 2024 to 2033.
- By Type: Lab-Based dominates with precision, and Infield-Based grows with real-time technology.
- By Application: X-ray fluorescence (XRF) dominates the Geochemical Services Market, crucial for mineral analysis.
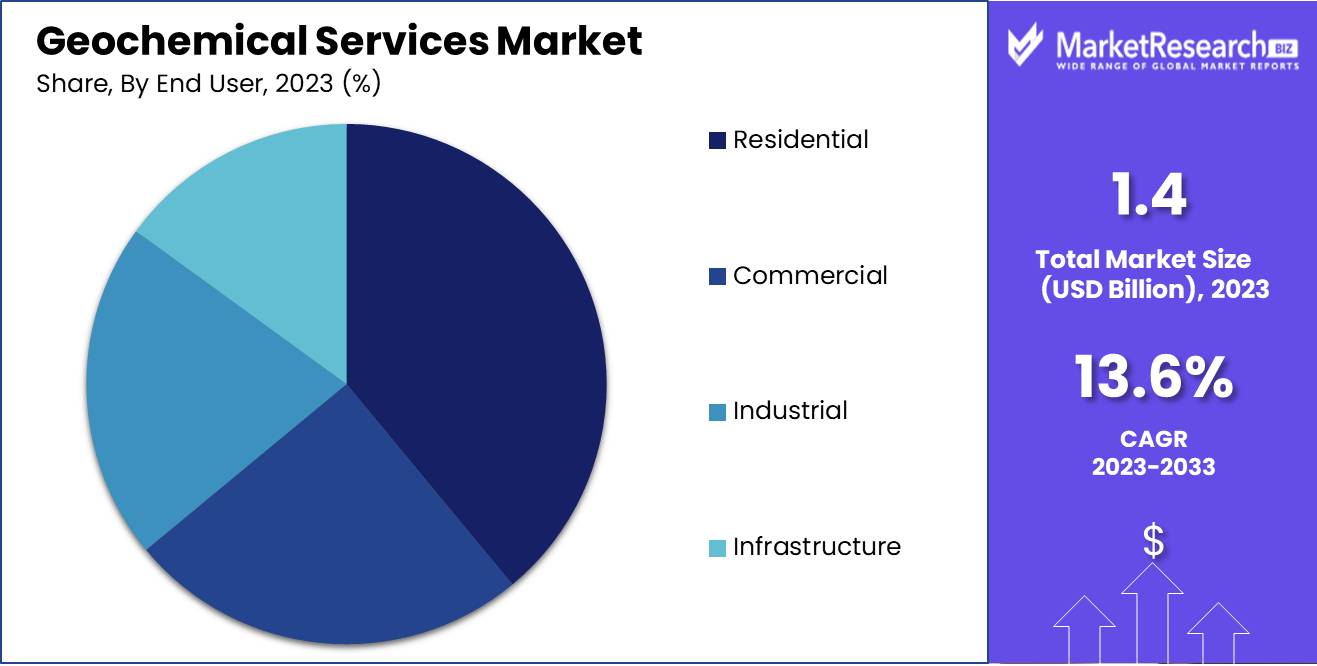
- By End User: Residential dominance driven by sustainable construction and advanced technology.
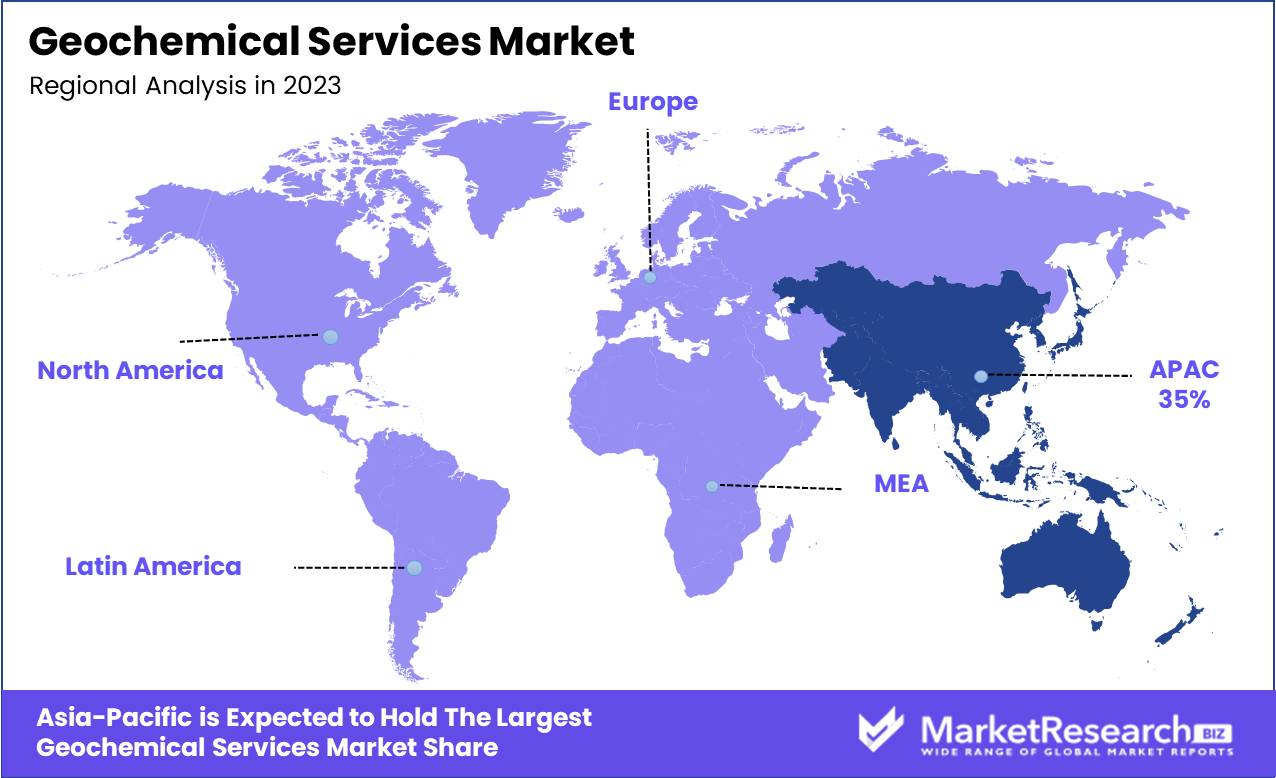
- Regional Dominance: Asia Pacific dominates the geochemical services market with over 35% share.
- Growth Opportunity: The global geochemical services market is set to expand, driven by construction growth and economic diversification.
Driving factors
Increase in Demand for Metals and Minerals: Fueling the Expansion of Geochemical Services
The geochemical services market is intricately tied to the demand for metals and minerals. As global economies grow and technologies advance, the need for various metals and samples of minerals escalates. This surge is primarily driven by industries such as electronics, automotive, and renewable energy, which require significant quantities of metals like lithium, cobalt, and rare earth elements. The increasing focus on sustainable energy further amplifies this demand, as materials are needed for solar panels, wind turbines, and batteries for electric vehicles.
This rising demand necessitates extensive mining operations and, consequently, the geochemical detailed analysis to ensure efficient and environmentally responsible mineral extraction. Geochemical services play a critical role by providing essential data that guides mining processes, enhances ore discovery rates, and optimizes the overall management of mineral resources. The ability to accurately assess and manage geological data directly influences the profitability and sustainability of mining projects, thus driving the demand for advanced geochemical services.
Technological Progress: Enhancing Capabilities and Efficiency
Technological advancements are a pivotal factor bolstering the geochemical services market. Modern technologies, including portable X-ray fluorescence (XRF) analyzers and advanced geographic information systems (GIS), have revolutionized how geochemical data is collected, analyzed, and interpreted. These technologies enable quicker, more accurate analyses which are critical for making informed decisions during mineral exploration and extraction.
Innovation in data analytics and machine learning further refines the capability of geochemical services. These technologies can predict mineral locations with greater accuracy, assess mineral quality, and even forecast potential mining impacts on the environment. As these technological tools evolve, they enhance the efficiency and effectiveness of geochemical services, making them indispensable in the modern mining industry. This symbiosis between technological progress and increased demand for precise, real-time data underpins the growth and diversification of the geochemical services market.
Geochemistry's Significance in the Mining Industry: A Cornerstone of Market Growth
Geochemistry is fundamental to the mining industry. It provides the scientific basis for mineral exploration, extraction, and environmental management. The significance of geochemistry lies in its ability to identify ore deposits, determine their composition, and assess the environmental impact of mining activities. As environmental standards tighten and the stakes for resource management increase, the role of geochemistry becomes more critical.
The integration of geochemical services into mining operations ensures that these activities are economically viable, environmentally sustainable, and socially responsible. Mining companies rely on geochemical analysis to navigate complex regulatory environments and to fulfill corporate social responsibility commitments by minimizing adverse environmental impacts.
Restraining Factors
Higher Cost of Geochemical Services: A Barrier to Market Penetration and Expansion
The geochemical services market, pivotal for industries such as mining, oil and gas, and environmental sciences, faces significant restraint due to the higher costs associated with these services. Geochemical analysis often requires sophisticated equipment, highly skilled personnel, and complex logistical arrangements, especially in remote or environmentally sensitive areas. These factors contribute to the elevated cost structure, impacting the affordability and accessibility of these services for smaller entities or projects with constrained budgets.
From a market growth perspective, the high cost can deter potential new entrants and limit the frequency of service utilization by existing customers. For industries like mining, where cost efficiency is continually under scrutiny, especially in periods of lower commodity prices, the demand for geochemical services may fluctuate significantly, leading to a direct impact on market stability and growth.
Complexity of Structures: Impeding Accessibility and Technological Adaptation
The complexity of structures in geochemical services not only refers to the physical complexities encountered in varied geological formations but also to the technical and operational complexities involved in executing these services effectively. These structures require tailored approaches for different projects, which can include varied sampling methods, analytical techniques, and data interpretation strategies.
This complexity necessitates a higher level of expertise and more sophisticated technology, which can act as a barrier to entry for new companies and can slow down the adoption of new technologies within existing companies. For instance, the need for specialized knowledge to interpret complex geochemical data can limit the pool of available expertise, further driving up costs and potentially delaying project timelines.
By Type Analysis
Lab-Based dominates with precision, and Infield-Based grows with real-time technology.
In 2023, Lab-Based services held a dominant market position in the By Type segment of the Geochemical Services Market. This predominance stems from the sector's capacity to deliver precise and detailed comprehensive analysis critical for making informed decisions in industries such as mining, oil and gas, and environmental science. Lab-based geochemical services provide a controlled environment where sophisticated analytical techniques, such as mass spectrometry and X-ray fluorescence, can be applied to assess the composition and quality of soil and rock samples. These precise measurements are crucial for companies aiming to assess potential resource deposits or monitor environmental contamination, thereby driving demand for lab-based services.
Conversely, the Infield-Based segment, while smaller, plays a vital role in situations where real-time data is crucial, such as during the exploratory phases of mining or oil drilling operations. Infield services offer the advantage of rapid results, enabling immediate decision-making that can significantly reduce costs and optimize operational strategies. The integration of portable technologies and real-time data quantitative analysis tools has begun to close the gap with lab-based services, suggesting potential growth in this segment as technology advances.
By Application Analysis
X-ray fluorescence (XRF) dominates the Geochemical Services Market, crucial for mineral analysis.
In 2023, X-ray fluorescence (XRF) held a dominant market position in the "By Application" segment of the Geochemical Services Market, particularly highlighted by its critical role in diverse analytical processes essential for the extraction and characterization of minerals. This technology is prized for its non-destructive nature and the rapid, accurate type of analysis it provides, which are indispensable for decision-making in mining and environmental studies.
The Geochemical Services Market is segmented into various applications, each serving unique purposes within the industry. Sample Preparation is the foundational stage where samples are made ready for market analysis of samples, a crucial step for ensuring accuracy across subsequent procedures. Mixed Acid Digest and Aqua Regia Digest both involve the breakdown of complex materials to simpler forms, facilitating the detection of trace elements and minerals. Hydro Geochemistry focuses on analyzing the chemical properties of water to assess environmental impacts and natural processes. Fire Assay, a traditional yet powerful method, remains relevant for the quantification of precious metals, providing high precision. These segments collectively underscore the market’s adaptation to evolving technological needs and environmental standards, positioning XRF and other methods as central to modern geochemical services.
By End User Analysis
Residential dominance is driven by sustainable construction and advanced technology.
In 2023, the Residential sector held a dominant market position in the "By End User" segment of the Geochemical Services Market. This sector's prominence is driven by a surge in housing developments and a growing emphasis on sustainable and eco-friendly construction practices. Geochemical services in this sector are crucial for ensuring the environmental integrity and safety of residential projects. They provide essential data that helps in the assessment of soil quality, the detection of hazardous substances, and the overall environmental impact assessment, which are critical for gaining construction permits and ensuring public safety.
Furthermore, the integration of advanced technologies such as GIS mapping and remote sensing has enhanced the efficiency and accuracy of geochemical analyses in residential projects. As urban areas expand and the demand for residential space increases, the reliance on geochemical services is anticipated to grow. This trend underscores the sector's potential for sustained dominance in the market, as these services are integral to meeting regulatory standards and supporting the development of safe and sustainable residential environments.
Key Market Segments
By Type
- Lab-Based
- Infield-Based
By Application
- Sample Preparation
- Mixed Acid Digest
- Hydro Geochemistry
- Aqua Regia Digest
- X-Ray Fluorescence
- Fire Assay
- Others
By End User
- Commercial
- Industrial
- Infrastructure
- Residential
Growth Opportunity
Robust Construction Industry Expansion
The global geochemical services market is poised to benefit significantly from the robust growth anticipated in the construction sector in 2024. As infrastructure developments surge, particularly in emerging economies, the demand for geochemical services that facilitate the exploration and chemical analysis of natural resources is expected to rise. These services are crucial for ensuring the viability and sustainability of construction projects, from skyscrapers to transportation networks. With urbanization and industrialization driving construction activities, geochemical service providers can expect an increase in engagements for soil testing, analysis of raw materials, and environmental impact assessments. This trend underscores the critical role geochemical insights play in optimizing resource use and mitigating environmental impacts in construction projects.
Economic Diversification Initiatives
Another significant opportunity for the geochemical services market arises from the diversification of economies, especially in regions reliant on oil and gas. Countries like Saudi Arabia and the UAE are investing in sectors such as mining, renewable energy, and tourism, which necessitates extensive geochemical data to support sustainable development practices. Geochemical services are integral to exploring new mineral resources and assessing renewable energy potential markets, aligning with broader economic goals of reducing dependency on traditional energy sectors. This strategic shift not only broadens the market for geochemical services but also enhances its role in supporting ecological and economic sustainability.
Latest Trends
Market Penetration Insights: Navigating the Expanding Global Reach of Geochemical Services
The geochemical services market is witnessing significant expansion across various industries, including mining, oil and gas, and environmental monitoring. This growth is driven by an increased emphasis on sustainable resource extraction and environmental compliance. Companies are leveraging geochemical analyses to optimize resource extraction processes, thereby enhancing efficiency and minimizing environmental impact. As emerging economies focus more on resource-based development, the demand for geochemical services is expected to surge, aiding in the precise mapping of natural resources. This penetration is not just expanding geographically but also deepening within sectors through integrated services that offer comprehensive insights from exploration to remediation.
Technological Advancements: Elevating Geochemical Services Through Innovation and Integration
Technological innovations are revolutionizing the geochemical services market, with advancements in analytical techniques and data processing tools leading the charge. Enhanced spectrometry and chromatography methods are allowing for more accurate and faster analyses at lower costs. Furthermore, the integration of AI and machine learning in geochemical studies is transforming data interpretation, enabling more predictive and insightful models that can forecast geological formations and mineral deposits with higher precision.
The adoption of blockchain for data integrity and the use of drones for sample collection are also noteworthy trends that enhance the reliability and efficiency of geochemical services. These technological strides not only improve service delivery but also open new avenues for environmental monitoring and sustainability practices within the industry.
Regional Analysis
Asia Pacific dominates the geochemical services market with over 35% share.
The geochemical services market exhibits diverse characteristics across regions, shaped by varying environmental regulations, exploration activities, and technological advancements. In North America, the market is propelled by robust oil and gas exploration and stringent environmental regulations, driving demand for geochemical testing to ensure compliance and optimize recovery. Europe, while showing moderate growth, focuses on sustainable practices and renewable energy explorations, augmenting the need for geochemical services in environmental assessments and mining operations.
Asia Pacific, the dominating region with over 35% market share, leads due to intense mining activities and rapid industrialization, especially in China and Australia. This region benefits from government initiatives to boost mining sectors and enhance environmental protections, necessitating advanced geochemical services. Latin America and the Middle East & Africa, though smaller in comparison, are witnessing growth due to increasing exploration investments and infrastructural development, particularly in countries like Brazil and Saudi Arabia, where resource-based industries are pivotal for economic expansion.
Key Regions and Countries
North America
- The US
- Canada
- Rest of North America
Europe
- Germany
- France
- The UK
- Spain
- Netherlands
- Russia
- Italy
- Rest of Europe
Asia-Pacific
- China
- Japan
- Singapore
- Thailand
- South Korea
- Vietnam
- India
- New Zealand
- Rest of Asia Pacific
Latin America
- Mexico
- Brazil
- Rest of Latin America
Middle East & Africa
- Saudi Arabia
- South Africa
- UAE
- The rest of the Middle East & Africa
Key Players Analysis
In the global geochemical services market, key players such as Activation Laboratories, Bureau Veritas, and ALS Limited are pivotal in shaping industry dynamics in 2024. Activation Laboratories stands out for its specialized services in mineral testing, which are crucial for the mining industry's exploration activities. Their commitment to technological innovation enables them to offer precise and efficient testing solutions.
Bureau Veritas, with its broad global footprint, is a leader in providing comprehensive quality assurance and testing services across various industries, including oil and gas, mining, and environmental sectors. Their strategic focus on sustainability and compliance helps clients navigate complex regulatory landscapes, which is particularly valuable in today’s environmentally conscious market.
ALS Limited’s robust global network and extensive expertise in geochemical analysis and metallurgical services allow it to cater to a diverse client base. The company’s emphasis on digital solutions and data analytics is enhancing its service delivery, making it a go-to provider for clients requiring detailed and actionable insights.
Companies like Intertek Group and SGS Canada continue to be integral to the market by offering tailored and specialized services that meet the evolving needs of resource extraction industries. Their ability to adapt to changing market conditions and client requirements positions them strongly in the competitive landscape.
Market Key Players
- Activation Laboratories
- Bureau Veritas
- Nexus Gold
- Shiva Analyticals
- Intertek Group
- SGS Canada
- ALS Limited
- ACZ Laboratories
- Geochemic Ltd.
- Alex Stewart International.
Recent Development
- In January 2024, FN Media Group LLC reported, that industry experts anticipate a bullish trend for uranium stocks in 2024 due to projections indicating that base demand for uranium will surpass existing production capacities through 2040.
- In May 2024, Collective Metals Inc. presents a comprehensive review of the Trojan-Condor target area on its Princeton Copper Project in British Columbia, based on results from the 2023 soil sampling program and previous geological assessments.
- In March 2023, Global Battery Metals (TSXV: GBML) announced positive geochemical survey results and plans for expanded drilling at the Leinster Lithium Project in Ireland.
Report Scope
Report Features Description Market Value (2023) USD 1.43 Billion Forecast Revenue (2033) USD 4.9 Billion CAGR (2024-2032) 13.6% Base Year for Estimation 2023 Historic Period 2016-2023 Forecast Period 2024-2033 Report Coverage Revenue Forecast, Market Dynamics, COVID-19 Impact, Competitive Landscape, Recent Developments Segments Covered By Component (Solution and Service), By Application (Network Security, Network Optimization, Customer Analytics, Virtual Assistance, Self-Diagnostics and Others), By Technology (Machine Learning, Natural Language Processing (NLP), Data Analytics and Others) Regional Analysis North America - The US, Canada, Rest of North America, Europe - Germany, France, The UK, Spain, Italy, Russia, Netherlands, Rest of Europe, Asia-Pacific - China, Japan, South Korea, India, New Zealand, Singapore, Thailand, Vietnam, Rest of Asia Pacific, Latin America - Brazil, Mexico, Rest of Latin America, Middle East & Africa - South Africa, Saudi Arabia, UAE, Rest of Middle East & Africa Competitive Landscape Activation Laboratories, Bureau Veritas, Nexus Gold, Shiva Analyticals, Intertek Group, SGS Canada, ALS Limited, ACZ Laboratories, Geochemic Ltd., Alex Stewart International. Customization Scope Customization for segments, region/country-level will be provided. Moreover, additional customization can be done based on the requirements. Purchase Options We have three licenses to opt for Single User License, Multi-User License (Up to 5 Users), Corporate Use License (Unlimited User and Printable PDF) -
- 1. Executive Summary
- 1.1. Definition
- 1.2. Taxonomy
- 1.3. Research Scope
- 1.4. Key Analysis
- 1.5. Key Findings by Major Segments
- 1.6. Top strategies by Major Players
- 2. Global Geochemical Services Market Overview
- 2.1. Geochemical Services Market Dynamics
- 2.1.1. Drivers
- 2.1.2. Opportunities
- 2.1.3. Restraints
- 2.1.4. Challenges
- 2.2. Macro-economic Factors
- 2.3. Regulatory Framework
- 2.4. Market Investment Feasibility Index
- 2.5. PEST Analysis
- 2.6. PORTER’S Five Force Analysis
- 2.7. Drivers & Restraints Impact Analysis
- 2.8. Industry Chain Analysis
- 2.9. Cost Structure Analysis
- 2.10. Marketing Strategy
- 2.11. Russia-Ukraine War Impact Analysis
- 2.12. Opportunity Map Analysis
- 2.13. Market Competition Scenario Analysis
- 2.14. Product Life Cycle Analysis
- 2.15. Opportunity Orbits
- 2.16. Manufacturer Intensity Map
- 2.17. Major Companies sales by Value & Volume
- 2.1. Geochemical Services Market Dynamics
- 3. Global Geochemical Services Market Analysis, Opportunity and Forecast, 2016-2032
- 3.1. Global Geochemical Services Market Analysis, 2016-2021
- 3.2. Global Geochemical Services Market Opportunity and Forecast, 2023-2032
- 3.3. Global Geochemical Services Market Analysis, Opportunity and Forecast, By Type, 2016-2032
- 3.3.1. Global Geochemical Services Market Analysis by Type: Introduction
- 3.3.2. Market Size Absolute $ Opportunity Analysis and Forecast, By Type, 2016-2032
- 3.3.3. Lab-Based
- 3.3.4. Infield-Based
- 3.4. Global Geochemical Services Market Analysis, Opportunity and Forecast, By Application, 2016-2032
- 3.4.1. Global Geochemical Services Market Analysis by Application: Introduction
- 3.4.2. Market Size Absolute $ Opportunity Analysis and Forecast, By Application, 2016-2032
- 3.4.3. Sample Preparation
- 3.4.4. Mixed Acid Digest
- 3.4.5. Hydro Geochemistry
- 3.4.6. Aqua Regia Digest
- 3.4.7. X-Ray Fluorescence
- 3.4.8. Fire Assay
- 3.4.9. Others
- 3.5. Global Geochemical Services Market Analysis, Opportunity and Forecast, By End User, 2016-2032
- 3.5.1. Global Geochemical Services Market Analysis by End User: Introduction
- 3.5.2. Market Size Absolute $ Opportunity Analysis and Forecast, By End User, 2016-2032
- 3.5.3. Commercial
- 3.5.4. Industrial
- 3.5.5. Infrastructure
- 3.5.6. Residential
- 4. North America Geochemical Services Market Analysis, Opportunity and Forecast, 2016-2032
- 4.1. North America Geochemical Services Market Analysis, 2016-2021
- 4.2. North America Geochemical Services Market Opportunity and Forecast, 2023-2032
- 4.3. North America Geochemical Services Market Analysis, Opportunity and Forecast, By Type, 2016-2032
- 4.3.1. North America Geochemical Services Market Analysis by Type: Introduction
- 4.3.2. Market Size Absolute $ Opportunity Analysis and Forecast, By Type, 2016-2032
- 4.3.3. Lab-Based
- 4.3.4. Infield-Based
- 4.4. North America Geochemical Services Market Analysis, Opportunity and Forecast, By Application, 2016-2032
- 4.4.1. North America Geochemical Services Market Analysis by Application: Introduction
- 4.4.2. Market Size Absolute $ Opportunity Analysis and Forecast, By Application, 2016-2032
- 4.4.3. Sample Preparation
- 4.4.4. Mixed Acid Digest
- 4.4.5. Hydro Geochemistry
- 4.4.6. Aqua Regia Digest
- 4.4.7. X-Ray Fluorescence
- 4.4.8. Fire Assay
- 4.4.9. Others
- 4.5. North America Geochemical Services Market Analysis, Opportunity and Forecast, By End User, 2016-2032
- 4.5.1. North America Geochemical Services Market Analysis by End User: Introduction
- 4.5.2. Market Size Absolute $ Opportunity Analysis and Forecast, By End User, 2016-2032
- 4.5.3. Commercial
- 4.5.4. Industrial
- 4.5.5. Infrastructure
- 4.5.6. Residential
- 4.6. North America Geochemical Services Market Analysis, Opportunity and Forecast, By Country , 2016-2032
- 4.6.1. North America Geochemical Services Market Analysis by Country : Introduction
- 4.6.2. Market Size Absolute $ Opportunity Analysis and Forecast, Country , 2016-2032
- 4.6.2.1. The US
- 4.6.2.2. Canada
- 4.6.2.3. Mexico
- 5. Western Europe Geochemical Services Market Analysis, Opportunity and Forecast, 2016-2032
- 5.1. Western Europe Geochemical Services Market Analysis, 2016-2021
- 5.2. Western Europe Geochemical Services Market Opportunity and Forecast, 2023-2032
- 5.3. Western Europe Geochemical Services Market Analysis, Opportunity and Forecast, By Type, 2016-2032
- 5.3.1. Western Europe Geochemical Services Market Analysis by Type: Introduction
- 5.3.2. Market Size Absolute $ Opportunity Analysis and Forecast, By Type, 2016-2032
- 5.3.3. Lab-Based
- 5.3.4. Infield-Based
- 5.4. Western Europe Geochemical Services Market Analysis, Opportunity and Forecast, By Application, 2016-2032
- 5.4.1. Western Europe Geochemical Services Market Analysis by Application: Introduction
- 5.4.2. Market Size Absolute $ Opportunity Analysis and Forecast, By Application, 2016-2032
- 5.4.3. Sample Preparation
- 5.4.4. Mixed Acid Digest
- 5.4.5. Hydro Geochemistry
- 5.4.6. Aqua Regia Digest
- 5.4.7. X-Ray Fluorescence
- 5.4.8. Fire Assay
- 5.4.9. Others
- 5.5. Western Europe Geochemical Services Market Analysis, Opportunity and Forecast, By End User, 2016-2032
- 5.5.1. Western Europe Geochemical Services Market Analysis by End User: Introduction
- 5.5.2. Market Size Absolute $ Opportunity Analysis and Forecast, By End User, 2016-2032
- 5.5.3. Commercial
- 5.5.4. Industrial
- 5.5.5. Infrastructure
- 5.5.6. Residential
- 5.6. Western Europe Geochemical Services Market Analysis, Opportunity and Forecast, By Country , 2016-2032
- 5.6.1. Western Europe Geochemical Services Market Analysis by Country : Introduction
- 5.6.2. Market Size Absolute $ Opportunity Analysis and Forecast, Country , 2016-2032
- 5.6.2.1. Germany
- 5.6.2.2. France
- 5.6.2.3. The UK
- 5.6.2.4. Spain
- 5.6.2.5. Italy
- 5.6.2.6. Portugal
- 5.6.2.7. Ireland
- 5.6.2.8. Austria
- 5.6.2.9. Switzerland
- 5.6.2.10. Benelux
- 5.6.2.11. Nordic
- 5.6.2.12. Rest of Western Europe
- 6. Eastern Europe Geochemical Services Market Analysis, Opportunity and Forecast, 2016-2032
- 6.1. Eastern Europe Geochemical Services Market Analysis, 2016-2021
- 6.2. Eastern Europe Geochemical Services Market Opportunity and Forecast, 2023-2032
- 6.3. Eastern Europe Geochemical Services Market Analysis, Opportunity and Forecast, By Type, 2016-2032
- 6.3.1. Eastern Europe Geochemical Services Market Analysis by Type: Introduction
- 6.3.2. Market Size Absolute $ Opportunity Analysis and Forecast, By Type, 2016-2032
- 6.3.3. Lab-Based
- 6.3.4. Infield-Based
- 6.4. Eastern Europe Geochemical Services Market Analysis, Opportunity and Forecast, By Application, 2016-2032
- 6.4.1. Eastern Europe Geochemical Services Market Analysis by Application: Introduction
- 6.4.2. Market Size Absolute $ Opportunity Analysis and Forecast, By Application, 2016-2032
- 6.4.3. Sample Preparation
- 6.4.4. Mixed Acid Digest
- 6.4.5. Hydro Geochemistry
- 6.4.6. Aqua Regia Digest
- 6.4.7. X-Ray Fluorescence
- 6.4.8. Fire Assay
- 6.4.9. Others
- 6.5. Eastern Europe Geochemical Services Market Analysis, Opportunity and Forecast, By End User, 2016-2032
- 6.5.1. Eastern Europe Geochemical Services Market Analysis by End User: Introduction
- 6.5.2. Market Size Absolute $ Opportunity Analysis and Forecast, By End User, 2016-2032
- 6.5.3. Commercial
- 6.5.4. Industrial
- 6.5.5. Infrastructure
- 6.5.6. Residential
- 6.6. Eastern Europe Geochemical Services Market Analysis, Opportunity and Forecast, By Country , 2016-2032
- 6.6.1. Eastern Europe Geochemical Services Market Analysis by Country : Introduction
- 6.6.2. Market Size Absolute $ Opportunity Analysis and Forecast, Country , 2016-2032
- 6.6.2.1. Russia
- 6.6.2.2. Poland
- 6.6.2.3. The Czech Republic
- 6.6.2.4. Greece
- 6.6.2.5. Rest of Eastern Europe
- 7. APAC Geochemical Services Market Analysis, Opportunity and Forecast, 2016-2032
- 7.1. APAC Geochemical Services Market Analysis, 2016-2021
- 7.2. APAC Geochemical Services Market Opportunity and Forecast, 2023-2032
- 7.3. APAC Geochemical Services Market Analysis, Opportunity and Forecast, By Type, 2016-2032
- 7.3.1. APAC Geochemical Services Market Analysis by Type: Introduction
- 7.3.2. Market Size Absolute $ Opportunity Analysis and Forecast, By Type, 2016-2032
- 7.3.3. Lab-Based
- 7.3.4. Infield-Based
- 7.4. APAC Geochemical Services Market Analysis, Opportunity and Forecast, By Application, 2016-2032
- 7.4.1. APAC Geochemical Services Market Analysis by Application: Introduction
- 7.4.2. Market Size Absolute $ Opportunity Analysis and Forecast, By Application, 2016-2032
- 7.4.3. Sample Preparation
- 7.4.4. Mixed Acid Digest
- 7.4.5. Hydro Geochemistry
- 7.4.6. Aqua Regia Digest
- 7.4.7. X-Ray Fluorescence
- 7.4.8. Fire Assay
- 7.4.9. Others
- 7.5. APAC Geochemical Services Market Analysis, Opportunity and Forecast, By End User, 2016-2032
- 7.5.1. APAC Geochemical Services Market Analysis by End User: Introduction
- 7.5.2. Market Size Absolute $ Opportunity Analysis and Forecast, By End User, 2016-2032
- 7.5.3. Commercial
- 7.5.4. Industrial
- 7.5.5. Infrastructure
- 7.5.6. Residential
- 7.6. APAC Geochemical Services Market Analysis, Opportunity and Forecast, By Country , 2016-2032
- 7.6.1. APAC Geochemical Services Market Analysis by Country : Introduction
- 7.6.2. Market Size Absolute $ Opportunity Analysis and Forecast, Country , 2016-2032
- 7.6.2.1. China
- 7.6.2.2. Japan
- 7.6.2.3. South Korea
- 7.6.2.4. India
- 7.6.2.5. Australia & New Zeland
- 7.6.2.6. Indonesia
- 7.6.2.7. Malaysia
- 7.6.2.8. Philippines
- 7.6.2.9. Singapore
- 7.6.2.10. Thailand
- 7.6.2.11. Vietnam
- 7.6.2.12. Rest of APAC
- 8. Latin America Geochemical Services Market Analysis, Opportunity and Forecast, 2016-2032
- 8.1. Latin America Geochemical Services Market Analysis, 2016-2021
- 8.2. Latin America Geochemical Services Market Opportunity and Forecast, 2023-2032
- 8.3. Latin America Geochemical Services Market Analysis, Opportunity and Forecast, By Type, 2016-2032
- 8.3.1. Latin America Geochemical Services Market Analysis by Type: Introduction
- 8.3.2. Market Size Absolute $ Opportunity Analysis and Forecast, By Type, 2016-2032
- 8.3.3. Lab-Based
- 8.3.4. Infield-Based
- 8.4. Latin America Geochemical Services Market Analysis, Opportunity and Forecast, By Application, 2016-2032
- 8.4.1. Latin America Geochemical Services Market Analysis by Application: Introduction
- 8.4.2. Market Size Absolute $ Opportunity Analysis and Forecast, By Application, 2016-2032
- 8.4.3. Sample Preparation
- 8.4.4. Mixed Acid Digest
- 8.4.5. Hydro Geochemistry
- 8.4.6. Aqua Regia Digest
- 8.4.7. X-Ray Fluorescence
- 8.4.8. Fire Assay
- 8.4.9. Others
- 8.5. Latin America Geochemical Services Market Analysis, Opportunity and Forecast, By End User, 2016-2032
- 8.5.1. Latin America Geochemical Services Market Analysis by End User: Introduction
- 8.5.2. Market Size Absolute $ Opportunity Analysis and Forecast, By End User, 2016-2032
- 8.5.3. Commercial
- 8.5.4. Industrial
- 8.5.5. Infrastructure
- 8.5.6. Residential
- 8.6. Latin America Geochemical Services Market Analysis, Opportunity and Forecast, By Country , 2016-2032
- 8.6.1. Latin America Geochemical Services Market Analysis by Country : Introduction
- 8.6.2. Market Size Absolute $ Opportunity Analysis and Forecast, Country , 2016-2032
- 8.6.2.1. Brazil
- 8.6.2.2. Colombia
- 8.6.2.3. Chile
- 8.6.2.4. Argentina
- 8.6.2.5. Costa Rica
- 8.6.2.6. Rest of Latin America
- 9. Middle East & Africa Geochemical Services Market Analysis, Opportunity and Forecast, 2016-2032
- 9.1. Middle East & Africa Geochemical Services Market Analysis, 2016-2021
- 9.2. Middle East & Africa Geochemical Services Market Opportunity and Forecast, 2023-2032
- 9.3. Middle East & Africa Geochemical Services Market Analysis, Opportunity and Forecast, By Type, 2016-2032
- 9.3.1. Middle East & Africa Geochemical Services Market Analysis by Type: Introduction
- 9.3.2. Market Size Absolute $ Opportunity Analysis and Forecast, By Type, 2016-2032
- 9.3.3. Lab-Based
- 9.3.4. Infield-Based
- 9.4. Middle East & Africa Geochemical Services Market Analysis, Opportunity and Forecast, By Application, 2016-2032
- 9.4.1. Middle East & Africa Geochemical Services Market Analysis by Application: Introduction
- 9.4.2. Market Size Absolute $ Opportunity Analysis and Forecast, By Application, 2016-2032
- 9.4.3. Sample Preparation
- 9.4.4. Mixed Acid Digest
- 9.4.5. Hydro Geochemistry
- 9.4.6. Aqua Regia Digest
- 9.4.7. X-Ray Fluorescence
- 9.4.8. Fire Assay
- 9.4.9. Others
- 9.5. Middle East & Africa Geochemical Services Market Analysis, Opportunity and Forecast, By End User, 2016-2032
- 9.5.1. Middle East & Africa Geochemical Services Market Analysis by End User: Introduction
- 9.5.2. Market Size Absolute $ Opportunity Analysis and Forecast, By End User, 2016-2032
- 9.5.3. Commercial
- 9.5.4. Industrial
- 9.5.5. Infrastructure
- 9.5.6. Residential
- 9.6. Middle East & Africa Geochemical Services Market Analysis, Opportunity and Forecast, By Country , 2016-2032
- 9.6.1. Middle East & Africa Geochemical Services Market Analysis by Country : Introduction
- 9.6.2. Market Size Absolute $ Opportunity Analysis and Forecast, Country , 2016-2032
- 9.6.2.1. Algeria
- 9.6.2.2. Egypt
- 9.6.2.3. Israel
- 9.6.2.4. Kuwait
- 9.6.2.5. Nigeria
- 9.6.2.6. Saudi Arabia
- 9.6.2.7. South Africa
- 9.6.2.8. Turkey
- 9.6.2.9. The UAE
- 9.6.2.10. Rest of MEA
- 10. Global Geochemical Services Market Analysis, Opportunity and Forecast, By Region , 2016-2032
- 10.1. Global Geochemical Services Market Analysis by Region : Introduction
- 10.2. Market Size Absolute $ Opportunity Analysis and Forecast, By Region , 2016-2032
- 10.2.1. North America
- 10.2.2. Western Europe
- 10.2.3. Eastern Europe
- 10.2.4. APAC
- 10.2.5. Latin America
- 10.2.6. Middle East & Africa
- 11. Global Geochemical Services Market Competitive Landscape, Market Share Analysis, and Company Profiles
- 11.1. Market Share Analysis
- 11.2. Company Profiles
- 11.3. Activation Laboratories
- 11.3.1. Company Overview
- 11.3.2. Financial Highlights
- 11.3.3. Product Portfolio
- 11.3.4. SWOT Analysis
- 11.3.5. Key Strategies and Developments
- 11.4. Bureau Veritas
- 11.4.1. Company Overview
- 11.4.2. Financial Highlights
- 11.4.3. Product Portfolio
- 11.4.4. SWOT Analysis
- 11.4.5. Key Strategies and Developments
- 11.5. Nexus Gold
- 11.5.1. Company Overview
- 11.5.2. Financial Highlights
- 11.5.3. Product Portfolio
- 11.5.4. SWOT Analysis
- 11.5.5. Key Strategies and Developments
- 11.6. Shiva Analyticals
- 11.6.1. Company Overview
- 11.6.2. Financial Highlights
- 11.6.3. Product Portfolio
- 11.6.4. SWOT Analysis
- 11.6.5. Key Strategies and Developments
- 11.7. Intertek Group
- 11.7.1. Company Overview
- 11.7.2. Financial Highlights
- 11.7.3. Product Portfolio
- 11.7.4. SWOT Analysis
- 11.7.5. Key Strategies and Developments
- 11.8. SGS Canada
- 11.8.1. Company Overview
- 11.8.2. Financial Highlights
- 11.8.3. Product Portfolio
- 11.8.4. SWOT Analysis
- 11.8.5. Key Strategies and Developments
- 11.9. ALS Limited
- 11.9.1. Company Overview
- 11.9.2. Financial Highlights
- 11.9.3. Product Portfolio
- 11.9.4. SWOT Analysis
- 11.9.5. Key Strategies and Developments
- 11.10. ACZ Laboratories
- 11.10.1. Company Overview
- 11.10.2. Financial Highlights
- 11.10.3. Product Portfolio
- 11.10.4. SWOT Analysis
- 11.10.5. Key Strategies and Developments
- 11.11. Geochemic Ltd.
- 11.11.1. Company Overview
- 11.11.2. Financial Highlights
- 11.11.3. Product Portfolio
- 11.11.4. SWOT Analysis
- 11.11.5. Key Strategies and Developments
- 11.12. Alex Stewart International.
- 11.12.1. Company Overview
- 11.12.2. Financial Highlights
- 11.12.3. Product Portfolio
- 11.12.4. SWOT Analysis
- 11.12.5. Key Strategies and Developments
- 11.13.1. Company Overview
- 11.13.2. Financial Highlights
- 11.13.3. Product Portfolio
- 11.13.4. SWOT Analysis
- 11.13.5. Key Strategies and Developments
- 12. Assumptions and Acronyms
- 13. Research Methodology
- 14. Contact
"
- List of Figures
- "
- Figure 1: Global Geochemical Services Market Revenue (US$ Mn) Market Share by Type in 2022
- Figure 2: Global Geochemical Services Market Market Attractiveness Analysis by Type, 2016-2032
- Figure 3: Global Geochemical Services Market Revenue (US$ Mn) Market Share by Applicationin 2022
- Figure 4: Global Geochemical Services Market Market Attractiveness Analysis by Application, 2016-2032
- Figure 5: Global Geochemical Services Market Revenue (US$ Mn) Market Share by End Userin 2022
- Figure 6: Global Geochemical Services Market Market Attractiveness Analysis by End User, 2016-2032
- Figure 7: Global Geochemical Services Market Revenue (US$ Mn) Market Share by Region in 2022
- Figure 8: Global Geochemical Services Market Market Attractiveness Analysis by Region, 2016-2032
- Figure 9: Global Geochemical Services Market Market Revenue (US$ Mn) (2016-2032)
- Figure 10: Global Geochemical Services Market Market Revenue (US$ Mn) Comparison by Region (2016-2032)
- Figure 11: Global Geochemical Services Market Market Revenue (US$ Mn) Comparison by Type (2016-2032)
- Figure 12: Global Geochemical Services Market Market Revenue (US$ Mn) Comparison by Application (2016-2032)
- Figure 13: Global Geochemical Services Market Market Revenue (US$ Mn) Comparison by End User (2016-2032)
- Figure 14: Global Geochemical Services Market Market Y-o-Y Growth Rate Comparison by Region (2016-2032)
- Figure 15: Global Geochemical Services Market Market Y-o-Y Growth Rate Comparison by Type (2016-2032)
- Figure 16: Global Geochemical Services Market Market Y-o-Y Growth Rate Comparison by Application (2016-2032)
- Figure 17: Global Geochemical Services Market Market Y-o-Y Growth Rate Comparison by End User (2016-2032)
- Figure 18: Global Geochemical Services Market Market Share Comparison by Region (2016-2032)
- Figure 19: Global Geochemical Services Market Market Share Comparison by Type (2016-2032)
- Figure 20: Global Geochemical Services Market Market Share Comparison by Application (2016-2032)
- Figure 21: Global Geochemical Services Market Market Share Comparison by End User (2016-2032)
- Figure 22: North America Geochemical Services Market Revenue (US$ Mn) Market Share by Typein 2022
- Figure 23: North America Geochemical Services Market Market Attractiveness Analysis by Type, 2016-2032
- Figure 24: North America Geochemical Services Market Revenue (US$ Mn) Market Share by Applicationin 2022
- Figure 25: North America Geochemical Services Market Market Attractiveness Analysis by Application, 2016-2032
- Figure 26: North America Geochemical Services Market Revenue (US$ Mn) Market Share by End Userin 2022
- Figure 27: North America Geochemical Services Market Market Attractiveness Analysis by End User, 2016-2032
- Figure 28: North America Geochemical Services Market Revenue (US$ Mn) Market Share by Country in 2022
- Figure 29: North America Geochemical Services Market Market Attractiveness Analysis by Country, 2016-2032
- Figure 30: North America Geochemical Services Market Market Revenue (US$ Mn) (2016-2032)
- Figure 31: North America Geochemical Services Market Market Revenue (US$ Mn) Comparison by Country (2016-2032)
- Figure 32: North America Geochemical Services Market Market Revenue (US$ Mn) Comparison by Type (2016-2032)
- Figure 33: North America Geochemical Services Market Market Revenue (US$ Mn) Comparison by Application (2016-2032)
- Figure 34: North America Geochemical Services Market Market Revenue (US$ Mn) Comparison by End User (2016-2032)
- Figure 35: North America Geochemical Services Market Market Y-o-Y Growth Rate Comparison by Country (2016-2032)
- Figure 36: North America Geochemical Services Market Market Y-o-Y Growth Rate Comparison by Type (2016-2032)
- Figure 37: North America Geochemical Services Market Market Y-o-Y Growth Rate Comparison by Application (2016-2032)
- Figure 38: North America Geochemical Services Market Market Y-o-Y Growth Rate Comparison by End User (2016-2032)
- Figure 39: North America Geochemical Services Market Market Share Comparison by Country (2016-2032)
- Figure 40: North America Geochemical Services Market Market Share Comparison by Type (2016-2032)
- Figure 41: North America Geochemical Services Market Market Share Comparison by Application (2016-2032)
- Figure 42: North America Geochemical Services Market Market Share Comparison by End User (2016-2032)
- Figure 43: Western Europe Geochemical Services Market Revenue (US$ Mn) Market Share by Typein 2022
- Figure 44: Western Europe Geochemical Services Market Market Attractiveness Analysis by Type, 2016-2032
- Figure 45: Western Europe Geochemical Services Market Revenue (US$ Mn) Market Share by Applicationin 2022
- Figure 46: Western Europe Geochemical Services Market Market Attractiveness Analysis by Application, 2016-2032
- Figure 47: Western Europe Geochemical Services Market Revenue (US$ Mn) Market Share by End Userin 2022
- Figure 48: Western Europe Geochemical Services Market Market Attractiveness Analysis by End User, 2016-2032
- Figure 49: Western Europe Geochemical Services Market Revenue (US$ Mn) Market Share by Country in 2022
- Figure 50: Western Europe Geochemical Services Market Market Attractiveness Analysis by Country, 2016-2032
- Figure 51: Western Europe Geochemical Services Market Market Revenue (US$ Mn) (2016-2032)
- Figure 52: Western Europe Geochemical Services Market Market Revenue (US$ Mn) Comparison by Country (2016-2032)
- Figure 53: Western Europe Geochemical Services Market Market Revenue (US$ Mn) Comparison by Type (2016-2032)
- Figure 54: Western Europe Geochemical Services Market Market Revenue (US$ Mn) Comparison by Application (2016-2032)
- Figure 55: Western Europe Geochemical Services Market Market Revenue (US$ Mn) Comparison by End User (2016-2032)
- Figure 56: Western Europe Geochemical Services Market Market Y-o-Y Growth Rate Comparison by Country (2016-2032)
- Figure 57: Western Europe Geochemical Services Market Market Y-o-Y Growth Rate Comparison by Type (2016-2032)
- Figure 58: Western Europe Geochemical Services Market Market Y-o-Y Growth Rate Comparison by Application (2016-2032)
- Figure 59: Western Europe Geochemical Services Market Market Y-o-Y Growth Rate Comparison by End User (2016-2032)
- Figure 60: Western Europe Geochemical Services Market Market Share Comparison by Country (2016-2032)
- Figure 61: Western Europe Geochemical Services Market Market Share Comparison by Type (2016-2032)
- Figure 62: Western Europe Geochemical Services Market Market Share Comparison by Application (2016-2032)
- Figure 63: Western Europe Geochemical Services Market Market Share Comparison by End User (2016-2032)
- Figure 64: Eastern Europe Geochemical Services Market Revenue (US$ Mn) Market Share by Typein 2022
- Figure 65: Eastern Europe Geochemical Services Market Market Attractiveness Analysis by Type, 2016-2032
- Figure 66: Eastern Europe Geochemical Services Market Revenue (US$ Mn) Market Share by Applicationin 2022
- Figure 67: Eastern Europe Geochemical Services Market Market Attractiveness Analysis by Application, 2016-2032
- Figure 68: Eastern Europe Geochemical Services Market Revenue (US$ Mn) Market Share by End Userin 2022
- Figure 69: Eastern Europe Geochemical Services Market Market Attractiveness Analysis by End User, 2016-2032
- Figure 70: Eastern Europe Geochemical Services Market Revenue (US$ Mn) Market Share by Country in 2022
- Figure 71: Eastern Europe Geochemical Services Market Market Attractiveness Analysis by Country, 2016-2032
- Figure 72: Eastern Europe Geochemical Services Market Market Revenue (US$ Mn) (2016-2032)
- Figure 73: Eastern Europe Geochemical Services Market Market Revenue (US$ Mn) Comparison by Country (2016-2032)
- Figure 74: Eastern Europe Geochemical Services Market Market Revenue (US$ Mn) Comparison by Type (2016-2032)
- Figure 75: Eastern Europe Geochemical Services Market Market Revenue (US$ Mn) Comparison by Application (2016-2032)
- Figure 76: Eastern Europe Geochemical Services Market Market Revenue (US$ Mn) Comparison by End User (2016-2032)
- Figure 77: Eastern Europe Geochemical Services Market Market Y-o-Y Growth Rate Comparison by Country (2016-2032)
- Figure 78: Eastern Europe Geochemical Services Market Market Y-o-Y Growth Rate Comparison by Type (2016-2032)
- Figure 79: Eastern Europe Geochemical Services Market Market Y-o-Y Growth Rate Comparison by Application (2016-2032)
- Figure 80: Eastern Europe Geochemical Services Market Market Y-o-Y Growth Rate Comparison by End User (2016-2032)
- Figure 81: Eastern Europe Geochemical Services Market Market Share Comparison by Country (2016-2032)
- Figure 82: Eastern Europe Geochemical Services Market Market Share Comparison by Type (2016-2032)
- Figure 83: Eastern Europe Geochemical Services Market Market Share Comparison by Application (2016-2032)
- Figure 84: Eastern Europe Geochemical Services Market Market Share Comparison by End User (2016-2032)
- Figure 85: APAC Geochemical Services Market Revenue (US$ Mn) Market Share by Typein 2022
- Figure 86: APAC Geochemical Services Market Market Attractiveness Analysis by Type, 2016-2032
- Figure 87: APAC Geochemical Services Market Revenue (US$ Mn) Market Share by Applicationin 2022
- Figure 88: APAC Geochemical Services Market Market Attractiveness Analysis by Application, 2016-2032
- Figure 89: APAC Geochemical Services Market Revenue (US$ Mn) Market Share by End Userin 2022
- Figure 90: APAC Geochemical Services Market Market Attractiveness Analysis by End User, 2016-2032
- Figure 91: APAC Geochemical Services Market Revenue (US$ Mn) Market Share by Country in 2022
- Figure 92: APAC Geochemical Services Market Market Attractiveness Analysis by Country, 2016-2032
- Figure 93: APAC Geochemical Services Market Market Revenue (US$ Mn) (2016-2032)
- Figure 94: APAC Geochemical Services Market Market Revenue (US$ Mn) Comparison by Country (2016-2032)
- Figure 95: APAC Geochemical Services Market Market Revenue (US$ Mn) Comparison by Type (2016-2032)
- Figure 96: APAC Geochemical Services Market Market Revenue (US$ Mn) Comparison by Application (2016-2032)
- Figure 97: APAC Geochemical Services Market Market Revenue (US$ Mn) Comparison by End User (2016-2032)
- Figure 98: APAC Geochemical Services Market Market Y-o-Y Growth Rate Comparison by Country (2016-2032)
- Figure 99: APAC Geochemical Services Market Market Y-o-Y Growth Rate Comparison by Type (2016-2032)
- Figure 100: APAC Geochemical Services Market Market Y-o-Y Growth Rate Comparison by Application (2016-2032)
- Figure 101: APAC Geochemical Services Market Market Y-o-Y Growth Rate Comparison by End User (2016-2032)
- Figure 102: APAC Geochemical Services Market Market Share Comparison by Country (2016-2032)
- Figure 103: APAC Geochemical Services Market Market Share Comparison by Type (2016-2032)
- Figure 104: APAC Geochemical Services Market Market Share Comparison by Application (2016-2032)
- Figure 105: APAC Geochemical Services Market Market Share Comparison by End User (2016-2032)
- Figure 106: Latin America Geochemical Services Market Revenue (US$ Mn) Market Share by Typein 2022
- Figure 107: Latin America Geochemical Services Market Market Attractiveness Analysis by Type, 2016-2032
- Figure 108: Latin America Geochemical Services Market Revenue (US$ Mn) Market Share by Applicationin 2022
- Figure 109: Latin America Geochemical Services Market Market Attractiveness Analysis by Application, 2016-2032
- Figure 110: Latin America Geochemical Services Market Revenue (US$ Mn) Market Share by End Userin 2022
- Figure 111: Latin America Geochemical Services Market Market Attractiveness Analysis by End User, 2016-2032
- Figure 112: Latin America Geochemical Services Market Revenue (US$ Mn) Market Share by Country in 2022
- Figure 113: Latin America Geochemical Services Market Market Attractiveness Analysis by Country, 2016-2032
- Figure 114: Latin America Geochemical Services Market Market Revenue (US$ Mn) (2016-2032)
- Figure 115: Latin America Geochemical Services Market Market Revenue (US$ Mn) Comparison by Country (2016-2032)
- Figure 116: Latin America Geochemical Services Market Market Revenue (US$ Mn) Comparison by Type (2016-2032)
- Figure 117: Latin America Geochemical Services Market Market Revenue (US$ Mn) Comparison by Application (2016-2032)
- Figure 118: Latin America Geochemical Services Market Market Revenue (US$ Mn) Comparison by End User (2016-2032)
- Figure 119: Latin America Geochemical Services Market Market Y-o-Y Growth Rate Comparison by Country (2016-2032)
- Figure 120: Latin America Geochemical Services Market Market Y-o-Y Growth Rate Comparison by Type (2016-2032)
- Figure 121: Latin America Geochemical Services Market Market Y-o-Y Growth Rate Comparison by Application (2016-2032)
- Figure 122: Latin America Geochemical Services Market Market Y-o-Y Growth Rate Comparison by End User (2016-2032)
- Figure 123: Latin America Geochemical Services Market Market Share Comparison by Country (2016-2032)
- Figure 124: Latin America Geochemical Services Market Market Share Comparison by Type (2016-2032)
- Figure 125: Latin America Geochemical Services Market Market Share Comparison by Application (2016-2032)
- Figure 126: Latin America Geochemical Services Market Market Share Comparison by End User (2016-2032)
- Figure 127: Middle East & Africa Geochemical Services Market Revenue (US$ Mn) Market Share by Typein 2022
- Figure 128: Middle East & Africa Geochemical Services Market Market Attractiveness Analysis by Type, 2016-2032
- Figure 129: Middle East & Africa Geochemical Services Market Revenue (US$ Mn) Market Share by Applicationin 2022
- Figure 130: Middle East & Africa Geochemical Services Market Market Attractiveness Analysis by Application, 2016-2032
- Figure 131: Middle East & Africa Geochemical Services Market Revenue (US$ Mn) Market Share by End Userin 2022
- Figure 132: Middle East & Africa Geochemical Services Market Market Attractiveness Analysis by End User, 2016-2032
- Figure 133: Middle East & Africa Geochemical Services Market Revenue (US$ Mn) Market Share by Country in 2022
- Figure 134: Middle East & Africa Geochemical Services Market Market Attractiveness Analysis by Country, 2016-2032
- Figure 135: Middle East & Africa Geochemical Services Market Market Revenue (US$ Mn) (2016-2032)
- Figure 136: Middle East & Africa Geochemical Services Market Market Revenue (US$ Mn) Comparison by Country (2016-2032)
- Figure 137: Middle East & Africa Geochemical Services Market Market Revenue (US$ Mn) Comparison by Type (2016-2032)
- Figure 138: Middle East & Africa Geochemical Services Market Market Revenue (US$ Mn) Comparison by Application (2016-2032)
- Figure 139: Middle East & Africa Geochemical Services Market Market Revenue (US$ Mn) Comparison by End User (2016-2032)
- Figure 140: Middle East & Africa Geochemical Services Market Market Y-o-Y Growth Rate Comparison by Country (2016-2032)
- Figure 141: Middle East & Africa Geochemical Services Market Market Y-o-Y Growth Rate Comparison by Type (2016-2032)
- Figure 142: Middle East & Africa Geochemical Services Market Market Y-o-Y Growth Rate Comparison by Application (2016-2032)
- Figure 143: Middle East & Africa Geochemical Services Market Market Y-o-Y Growth Rate Comparison by End User (2016-2032)
- Figure 144: Middle East & Africa Geochemical Services Market Market Share Comparison by Country (2016-2032)
- Figure 145: Middle East & Africa Geochemical Services Market Market Share Comparison by Type (2016-2032)
- Figure 146: Middle East & Africa Geochemical Services Market Market Share Comparison by Application (2016-2032)
- Figure 147: Middle East & Africa Geochemical Services Market Market Share Comparison by End User (2016-2032)
"
- List of Tables
- "
- Table 1: Global Geochemical Services Market Market Comparison by Type (2016-2032)
- Table 2: Global Geochemical Services Market Market Comparison by Application (2016-2032)
- Table 3: Global Geochemical Services Market Market Comparison by End User (2016-2032)
- Table 4: Global Geochemical Services Market Revenue (US$ Mn) Comparison by Region (2016-2032)
- Table 5: Global Geochemical Services Market Market Revenue (US$ Mn) (2016-2032)
- Table 6: Global Geochemical Services Market Market Revenue (US$ Mn) Comparison by Region (2016-2032)
- Table 7: Global Geochemical Services Market Market Revenue (US$ Mn) Comparison by Type (2016-2032)
- Table 8: Global Geochemical Services Market Market Revenue (US$ Mn) Comparison by Application (2016-2032)
- Table 9: Global Geochemical Services Market Market Revenue (US$ Mn) Comparison by End User (2016-2032)
- Table 10: Global Geochemical Services Market Market Y-o-Y Growth Rate Comparison by Region (2016-2032)
- Table 11: Global Geochemical Services Market Market Y-o-Y Growth Rate Comparison by Type (2016-2032)
- Table 12: Global Geochemical Services Market Market Y-o-Y Growth Rate Comparison by Application (2016-2032)
- Table 13: Global Geochemical Services Market Market Y-o-Y Growth Rate Comparison by End User (2016-2032)
- Table 14: Global Geochemical Services Market Market Share Comparison by Region (2016-2032)
- Table 15: Global Geochemical Services Market Market Share Comparison by Type (2016-2032)
- Table 16: Global Geochemical Services Market Market Share Comparison by Application (2016-2032)
- Table 17: Global Geochemical Services Market Market Share Comparison by End User (2016-2032)
- Table 18: North America Geochemical Services Market Market Comparison by Application (2016-2032)
- Table 19: North America Geochemical Services Market Market Comparison by End User (2016-2032)
- Table 20: North America Geochemical Services Market Revenue (US$ Mn) Comparison by Country (2016-2032)
- Table 21: North America Geochemical Services Market Market Revenue (US$ Mn) (2016-2032)
- Table 22: North America Geochemical Services Market Market Revenue (US$ Mn) Comparison by Country (2016-2032)
- Table 23: North America Geochemical Services Market Market Revenue (US$ Mn) Comparison by Type (2016-2032)
- Table 24: North America Geochemical Services Market Market Revenue (US$ Mn) Comparison by Application (2016-2032)
- Table 25: North America Geochemical Services Market Market Revenue (US$ Mn) Comparison by End User (2016-2032)
- Table 26: North America Geochemical Services Market Market Y-o-Y Growth Rate Comparison by Country (2016-2032)
- Table 27: North America Geochemical Services Market Market Y-o-Y Growth Rate Comparison by Type (2016-2032)
- Table 28: North America Geochemical Services Market Market Y-o-Y Growth Rate Comparison by Application (2016-2032)
- Table 29: North America Geochemical Services Market Market Y-o-Y Growth Rate Comparison by End User (2016-2032)
- Table 30: North America Geochemical Services Market Market Share Comparison by Country (2016-2032)
- Table 31: North America Geochemical Services Market Market Share Comparison by Type (2016-2032)
- Table 32: North America Geochemical Services Market Market Share Comparison by Application (2016-2032)
- Table 33: North America Geochemical Services Market Market Share Comparison by End User (2016-2032)
- Table 34: Western Europe Geochemical Services Market Market Comparison by Type (2016-2032)
- Table 35: Western Europe Geochemical Services Market Market Comparison by Application (2016-2032)
- Table 36: Western Europe Geochemical Services Market Market Comparison by End User (2016-2032)
- Table 37: Western Europe Geochemical Services Market Revenue (US$ Mn) Comparison by Country (2016-2032)
- Table 38: Western Europe Geochemical Services Market Market Revenue (US$ Mn) (2016-2032)
- Table 39: Western Europe Geochemical Services Market Market Revenue (US$ Mn) Comparison by Country (2016-2032)
- Table 40: Western Europe Geochemical Services Market Market Revenue (US$ Mn) Comparison by Type (2016-2032)
- Table 41: Western Europe Geochemical Services Market Market Revenue (US$ Mn) Comparison by Application (2016-2032)
- Table 42: Western Europe Geochemical Services Market Market Revenue (US$ Mn) Comparison by End User (2016-2032)
- Table 43: Western Europe Geochemical Services Market Market Y-o-Y Growth Rate Comparison by Country (2016-2032)
- Table 44: Western Europe Geochemical Services Market Market Y-o-Y Growth Rate Comparison by Type (2016-2032)
- Table 45: Western Europe Geochemical Services Market Market Y-o-Y Growth Rate Comparison by Application (2016-2032)
- Table 46: Western Europe Geochemical Services Market Market Y-o-Y Growth Rate Comparison by End User (2016-2032)
- Table 47: Western Europe Geochemical Services Market Market Share Comparison by Country (2016-2032)
- Table 48: Western Europe Geochemical Services Market Market Share Comparison by Type (2016-2032)
- Table 49: Western Europe Geochemical Services Market Market Share Comparison by Application (2016-2032)
- Table 50: Western Europe Geochemical Services Market Market Share Comparison by End User (2016-2032)
- Table 51: Eastern Europe Geochemical Services Market Market Comparison by Type (2016-2032)
- Table 52: Eastern Europe Geochemical Services Market Market Comparison by Application (2016-2032)
- Table 53: Eastern Europe Geochemical Services Market Market Comparison by End User (2016-2032)
- Table 54: Eastern Europe Geochemical Services Market Revenue (US$ Mn) Comparison by Country (2016-2032)
- Table 55: Eastern Europe Geochemical Services Market Market Revenue (US$ Mn) (2016-2032)
- Table 56: Eastern Europe Geochemical Services Market Market Revenue (US$ Mn) Comparison by Country (2016-2032)
- Table 57: Eastern Europe Geochemical Services Market Market Revenue (US$ Mn) Comparison by Type (2016-2032)
- Table 58: Eastern Europe Geochemical Services Market Market Revenue (US$ Mn) Comparison by Application (2016-2032)
- Table 59: Eastern Europe Geochemical Services Market Market Revenue (US$ Mn) Comparison by End User (2016-2032)
- Table 60: Eastern Europe Geochemical Services Market Market Y-o-Y Growth Rate Comparison by Country (2016-2032)
- Table 61: Eastern Europe Geochemical Services Market Market Y-o-Y Growth Rate Comparison by Type (2016-2032)
- Table 62: Eastern Europe Geochemical Services Market Market Y-o-Y Growth Rate Comparison by Application (2016-2032)
- Table 63: Eastern Europe Geochemical Services Market Market Y-o-Y Growth Rate Comparison by End User (2016-2032)
- Table 64: Eastern Europe Geochemical Services Market Market Share Comparison by Country (2016-2032)
- Table 65: Eastern Europe Geochemical Services Market Market Share Comparison by Type (2016-2032)
- Table 66: Eastern Europe Geochemical Services Market Market Share Comparison by Application (2016-2032)
- Table 67: Eastern Europe Geochemical Services Market Market Share Comparison by End User (2016-2032)
- Table 68: APAC Geochemical Services Market Market Comparison by Type (2016-2032)
- Table 69: APAC Geochemical Services Market Market Comparison by Application (2016-2032)
- Table 70: APAC Geochemical Services Market Market Comparison by End User (2016-2032)
- Table 71: APAC Geochemical Services Market Revenue (US$ Mn) Comparison by Country (2016-2032)
- Table 72: APAC Geochemical Services Market Market Revenue (US$ Mn) (2016-2032)
- Table 73: APAC Geochemical Services Market Market Revenue (US$ Mn) Comparison by Country (2016-2032)
- Table 74: APAC Geochemical Services Market Market Revenue (US$ Mn) Comparison by Type (2016-2032)
- Table 75: APAC Geochemical Services Market Market Revenue (US$ Mn) Comparison by Application (2016-2032)
- Table 76: APAC Geochemical Services Market Market Revenue (US$ Mn) Comparison by End User (2016-2032)
- Table 77: APAC Geochemical Services Market Market Y-o-Y Growth Rate Comparison by Country (2016-2032)
- Table 78: APAC Geochemical Services Market Market Y-o-Y Growth Rate Comparison by Type (2016-2032)
- Table 79: APAC Geochemical Services Market Market Y-o-Y Growth Rate Comparison by Application (2016-2032)
- Table 80: APAC Geochemical Services Market Market Y-o-Y Growth Rate Comparison by End User (2016-2032)
- Table 81: APAC Geochemical Services Market Market Share Comparison by Country (2016-2032)
- Table 82: APAC Geochemical Services Market Market Share Comparison by Type (2016-2032)
- Table 83: APAC Geochemical Services Market Market Share Comparison by Application (2016-2032)
- Table 84: APAC Geochemical Services Market Market Share Comparison by End User (2016-2032)
- Table 85: Latin America Geochemical Services Market Market Comparison by Type (2016-2032)
- Table 86: Latin America Geochemical Services Market Market Comparison by Application (2016-2032)
- Table 87: Latin America Geochemical Services Market Market Comparison by End User (2016-2032)
- Table 88: Latin America Geochemical Services Market Revenue (US$ Mn) Comparison by Country (2016-2032)
- Table 89: Latin America Geochemical Services Market Market Revenue (US$ Mn) (2016-2032)
- Table 90: Latin America Geochemical Services Market Market Revenue (US$ Mn) Comparison by Country (2016-2032)
- Table 91: Latin America Geochemical Services Market Market Revenue (US$ Mn) Comparison by Type (2016-2032)
- Table 92: Latin America Geochemical Services Market Market Revenue (US$ Mn) Comparison by Application (2016-2032)
- Table 93: Latin America Geochemical Services Market Market Revenue (US$ Mn) Comparison by End User (2016-2032)
- Table 94: Latin America Geochemical Services Market Market Y-o-Y Growth Rate Comparison by Country (2016-2032)
- Table 95: Latin America Geochemical Services Market Market Y-o-Y Growth Rate Comparison by Type (2016-2032)
- Table 96: Latin America Geochemical Services Market Market Y-o-Y Growth Rate Comparison by Application (2016-2032)
- Table 97: Latin America Geochemical Services Market Market Y-o-Y Growth Rate Comparison by End User (2016-2032)
- Table 98: Latin America Geochemical Services Market Market Share Comparison by Country (2016-2032)
- Table 99: Latin America Geochemical Services Market Market Share Comparison by Type (2016-2032)
- Table 100: Latin America Geochemical Services Market Market Share Comparison by Application (2016-2032)
- Table 101: Latin America Geochemical Services Market Market Share Comparison by End User (2016-2032)
- Table 102: Middle East & Africa Geochemical Services Market Market Comparison by Type (2016-2032)
- Table 103: Middle East & Africa Geochemical Services Market Market Comparison by Application (2016-2032)
- Table 104: Middle East & Africa Geochemical Services Market Market Comparison by End User (2016-2032)
- Table 105: Middle East & Africa Geochemical Services Market Revenue (US$ Mn) Comparison by Country (2016-2032)
- Table 106: Middle East & Africa Geochemical Services Market Market Revenue (US$ Mn) (2016-2032)
- Table 107: Middle East & Africa Geochemical Services Market Market Revenue (US$ Mn) Comparison by Country (2016-2032)
- Table 108: Middle East & Africa Geochemical Services Market Market Revenue (US$ Mn) Comparison by Type (2016-2032)
- Table 109: Middle East & Africa Geochemical Services Market Market Revenue (US$ Mn) Comparison by Application (2016-2032)
- Table 110: Middle East & Africa Geochemical Services Market Market Revenue (US$ Mn) Comparison by End User (2016-2032)
- Table 111: Middle East & Africa Geochemical Services Market Market Y-o-Y Growth Rate Comparison by Country (2016-2032)
- Table 112: Middle East & Africa Geochemical Services Market Market Y-o-Y Growth Rate Comparison by Type (2016-2032)
- Table 113: Middle East & Africa Geochemical Services Market Market Y-o-Y Growth Rate Comparison by Application (2016-2032)
- Table 114: Middle East & Africa Geochemical Services Market Market Y-o-Y Growth Rate Comparison by End User (2016-2032)
- Table 115: Middle East & Africa Geochemical Services Market Market Share Comparison by Country (2016-2032)
- Table 116: Middle East & Africa Geochemical Services Market Market Share Comparison by Type (2016-2032)
- Table 117: Middle East & Africa Geochemical Services Market Market Share Comparison by Application (2016-2032)
- Table 118: Middle East & Africa Geochemical Services Market Market Share Comparison by End User (2016-2032)
- 1. Executive Summary
-
- Activation Laboratories
- Bureau Veritas
- Nexus Gold
- Shiva Analyticals
- Intertek Group
- SGS Canada
- ALS Limited
- ACZ Laboratories
- Geochemic Ltd.
- Alex Stewart International.
Our Clients


View Our Licence Options
