
Generative Ai In Investing Market By Deployment Mode (Cloud-Based, On-Premises), By Application (Portfolio Generation, Risk Assessment and Management, Market Analysis and Prediction, Algorithmic Trading, Fraud Detection and Compliance, Others), By End-Users (Institutional Investors, Retail Investors, Investment Banks and Financial Institutions, Others), By Region and Companies - Industry Segment Outlook, Market Assessment, Competition Scenario, Trends and Forecast 2024-2033
-
39209
-
July 2024
-
162
-


-
This report was compiled by Vishwa Gaul Vishwa is an experienced market research and consulting professional with over 8 years of expertise in the ICT industry, contributing to over 700 reports across telecommunications, software, hardware, and digital solutions. Correspondence Team Lead- ICT Linkedin | Detailed Market research Methodology Our methodology involves a mix of primary research, including interviews with leading mental health experts, and secondary research from reputable medical journals and databases. View Detailed Methodology Page
-
Quick Navigation
Report Overview
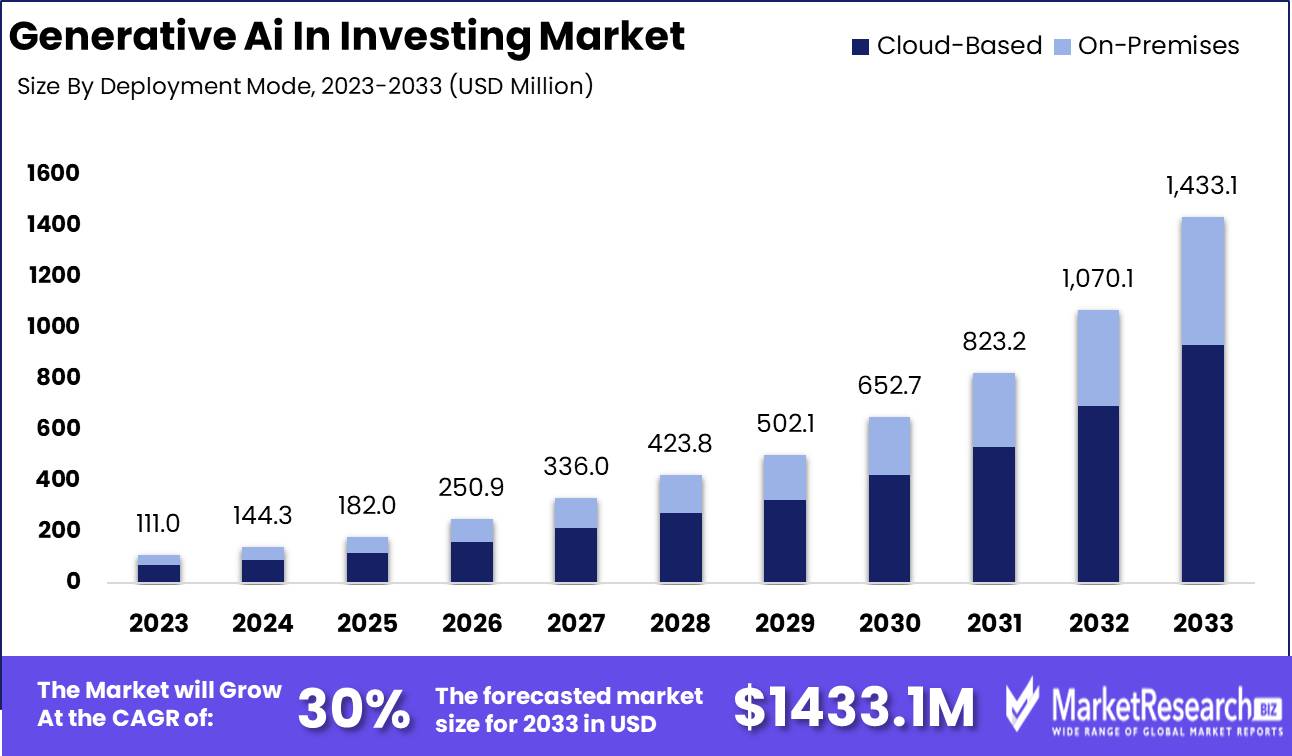
The Global Generative Ai In Investing Market was valued at USD 111.0 Mn in 2023. It is expected to reach USD 1433.1 Mn by 2033, with a CAGR of 30% during the forecast period from 2024 to 2033.
The generative AI in investing market involves the development and application of advanced AI algorithms to enhance investment strategies and decision-making processes. These AI systems leverage machine learning, natural language processing, and data analytics to generate predictive models, optimize portfolios, and identify market trends. This market is driven by the increasing demand for data-driven insights, the need for improved investment performance, and the potential to reduce human biases. Innovations in AI technology are enabling more accurate and efficient analysis, transforming traditional investment approaches and offering competitive advantages in financial markets.
The generative AI in investing market is set to revolutionize the financial sector, offering transformative potential through advanced AI-driven strategies and decision-making tools. These sophisticated algorithms enable more precise predictive modeling, portfolio optimization, and market trend identification, thereby enhancing investment performance. The integration of generative AI is expected to significantly boost productivity in banking, with projections indicating a potential revenue increase of 2.8%-4.7% for the industry. This substantial impact highlights the value of AI in driving efficiency and growth.
The performance of generative AI stocks is often benchmarked against established AI or tech indices like the NASDAQ-100. This comparison is crucial for investors, particularly when evaluating the potential of emerging AI startups. Such benchmarking allows for a clearer assessment of generative AI’s performance relative to broader market trends, ensuring informed investment decisions.
The market is characterized by its ability to mitigate human biases in investment decisions, leading to more objective and data-driven outcomes. Continuous advancements in machine learning and natural language processing are further enhancing the capabilities of generative AI, making it an indispensable tool for modern investment strategies.
Key Takeaways
- Market Value: The Global Generative Ai In Investing Market was valued at USD 111 Mn in 2023. It is expected to reach USD 1433.1 Mn by 2033, with a CAGR of 30% during the forecast period from 2024 to 2033.
- By Deployment Mode: Cloud-based deployment comprises 65% of the gas chromatography market by deployment mode.
- By Application: Algorithmic Trading applications account for 30% of the gas chromatography market by application.
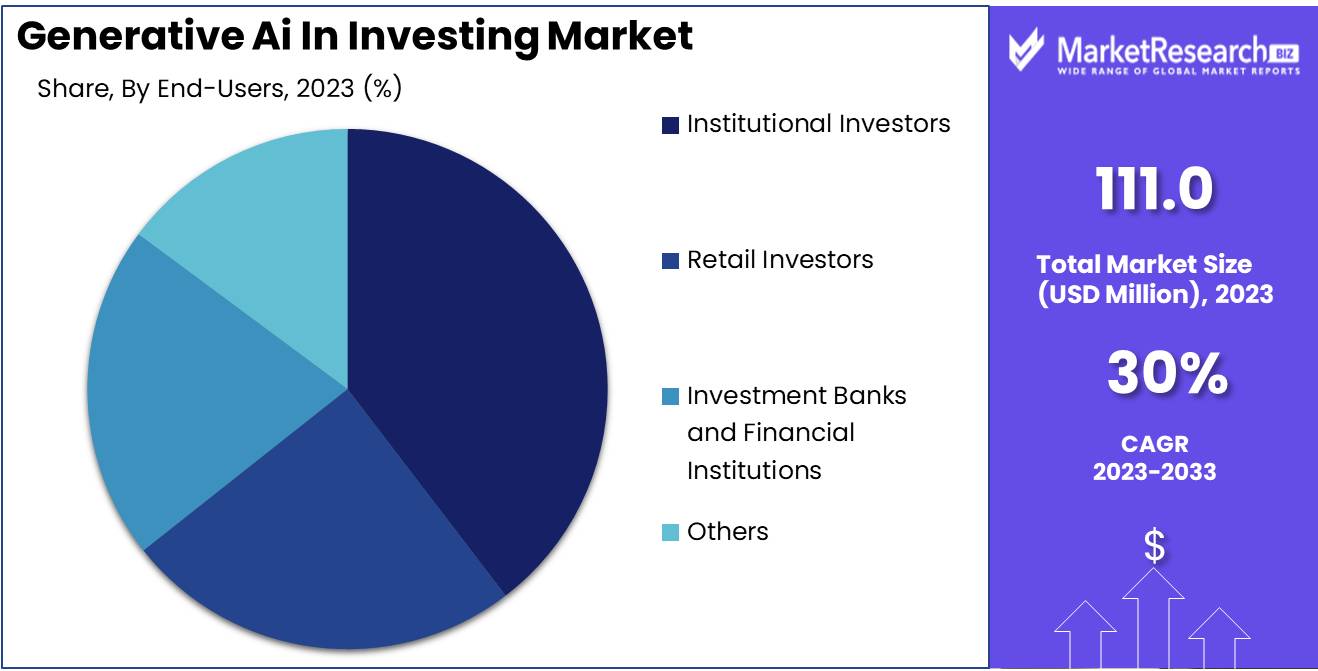
- By End-Users: Institutional investors represent 40% of the gas chromatography market by end-users.
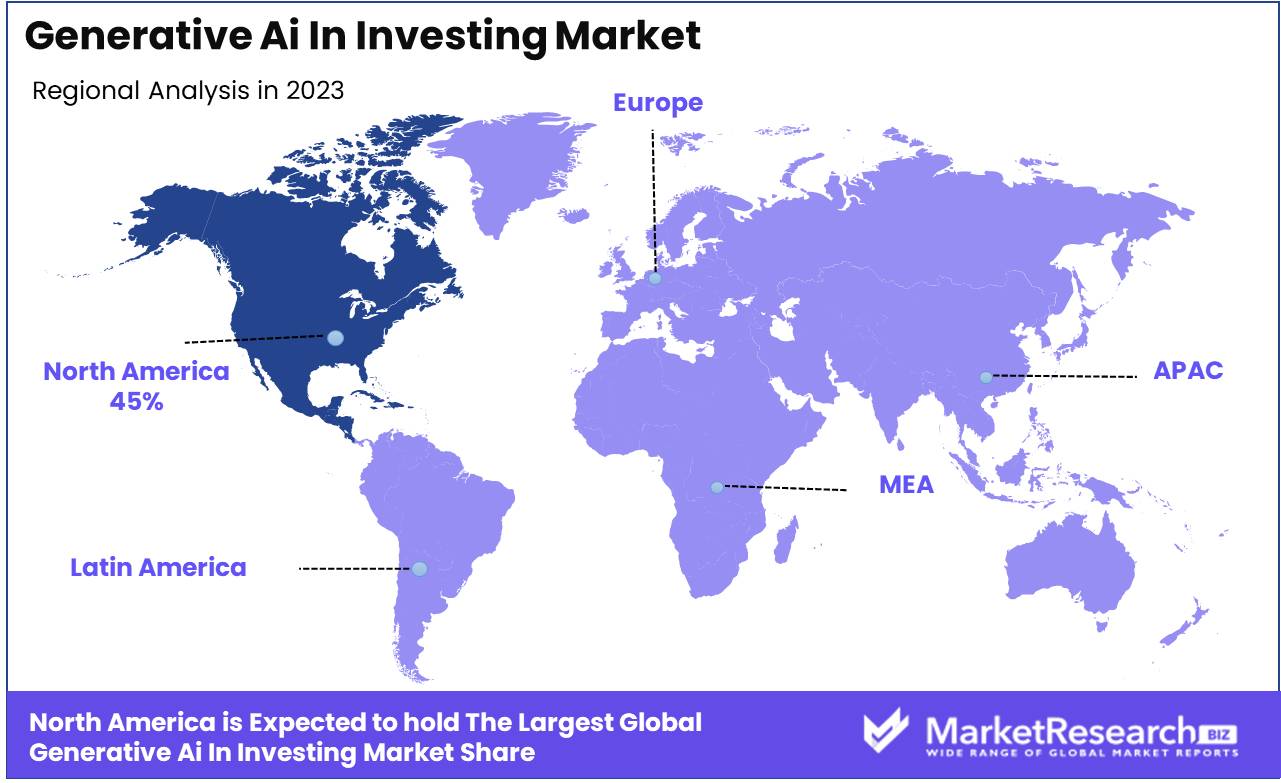
- Regional Dominance: North America dominates with 45% of the market share, propelled by the advanced financial sector and significant investments in AI technologies.
- Growth Opportunity: The rising interest in AI-driven decision-making tools for predictive analytics and risk management is creating substantial growth prospects for generative AI applications in the investing sector.
Driving factors
Data Analysis and Insights
Generative AI in investing is revolutionizing the field of data analysis and insights, driving significant growth in the market. The ability of generative AI to process vast amounts of financial data quickly and accurately enables investors to gain deeper insights into market trends, company performance, and economic indicators. This enhanced data analysis capability allows for more informed investment strategies, as AI can identify patterns and correlations that may not be evident through traditional analysis methods. By leveraging machine learning algorithms and natural language processing, generative AI can analyze unstructured data from diverse sources, such as news articles, social media, and financial reports, providing a comprehensive view of the market.
The proliferation of data sources and the increasing complexity of financial markets necessitate advanced analytical tools. Generative AI meets this need by offering real-time data processing and predictive analytics, enabling investors to respond swiftly to market changes. This capability is particularly valuable in high-frequency trading and risk management, where timely and accurate data is crucial for making profitable decisions. The integration of generative AI in data analysis is a key driver of growth in the investing market, facilitating more robust and dynamic investment strategies.
Enhanced Investment Decision-Making
Enhanced investment decision-making is another primary factor contributing to the growth of the generative AI in investing market. Generative AI enhances decision-making by providing investors with sophisticated tools that go beyond traditional financial models. These AI-driven tools can simulate various market scenarios, optimize portfolio allocations, and assess potential risks with a high degree of accuracy. By incorporating AI into the decision-making process, investors can achieve a more nuanced understanding of market dynamics and improve their investment outcomes.
AI-driven decision-making tools utilize complex algorithms to evaluate vast datasets, generating actionable insights that can guide investment strategies. Generative AI can forecast stock price movements, identify undervalued assets, and predict market volatility, helping investors to make more informed and strategic decisions. This level of analysis allows for the development of personalized investment strategies tailored to individual risk profiles and financial goals.
Restraining Factors
Challenges in Data Privacy and Cybersecurity
Data privacy and cybersecurity present significant challenges in the growth of the generative AI in investing market. The vast amounts of data processed by AI systems include sensitive financial information, personal identifiers, and proprietary business data, making it a prime target for cyberattacks. Ensuring the security and privacy of this data is critical to maintaining investor trust and complying with regulatory requirements.
AI systems are also susceptible to sophisticated cyber threats, such as data breaches, ransomware, and hacking attempts. These incidents can lead to substantial financial losses, reputational damage, and legal repercussions. Therefore, robust cybersecurity measures are essential to protect AI infrastructure and data integrity. This includes employing advanced encryption methods, multi-factor authentication, and continuous monitoring for potential vulnerabilities.
Ethical Considerations and Regulatory Challenges
The deployment of generative AI in investing also raises ethical considerations and regulatory challenges that impact market growth. AI systems must be designed and used in ways that are transparent, fair, and unbiased. However, the opacity of AI decision-making processes, often referred to as the "black box" problem, makes it difficult to ensure accountability and explainability. Investors and regulators are increasingly concerned about the potential for biased or discriminatory outcomes, which could arise from inherent biases in training data or algorithm design.
Regulatory bodies are focusing on creating frameworks to govern the ethical use of AI in financial markets. These frameworks aim to ensure that AI technologies do not compromise market integrity, fairness, and investor protection. The rapid pace of AI innovation often outstrips the development of corresponding regulations, leading to a regulatory lag. This lag creates uncertainty for companies developing and deploying generative AI solutions, as they must navigate an evolving and sometimes ambiguous regulatory environment.
By Deployment Mode Analysis
Cloud-based solutions dominated, holding 65% of the market share.
In 2023, Cloud-Based solutions held a dominant market position in the generative AI in investing market, capturing more than a 65% share. The adoption of cloud-based deployment is driven by its scalability, flexibility, and cost-effectiveness. Financial institutions and investment firms are increasingly leveraging cloud-based AI platforms to access advanced computational resources, streamline data management, and deploy AI models efficiently. The ability to integrate with other cloud services and the ease of scaling operations in response to growing data volumes further enhance the attractiveness of cloud-based solutions.
On-Premises deployment, while holding a smaller market share, remains significant for firms that prioritize control, security, and customization of their AI infrastructure. On-premises solutions offer the advantage of enhanced data privacy and compliance with stringent regulatory requirements, making them suitable for organizations with sensitive data and specific operational needs. However, the higher upfront costs and maintenance requirements of on-premises deployments can be a limiting factor for some firms.
By Application Analysis
Algorithmic trading applications made up 30% of the market.
In 2023, Algorithmic Trading held a dominant market position in the generative AI in investing market, capturing more than a 30% share. Algorithmic trading leverages generative AI to develop sophisticated trading strategies that execute orders at optimal prices and speeds, significantly enhancing trading efficiency and profitability. The ability of AI to analyze vast datasets in real-time and identify market patterns and anomalies drives its substantial adoption in this application. The increasing demand for high-frequency trading and the need for precision and speed in executing trades further support the growth of AI-driven algorithmic trading.
Portfolio Generation is another significant application, where generative AI aids in constructing and optimizing investment portfolios. By analyzing historical data, market trends, and individual risk profiles, AI can generate diversified portfolios tailored to specific investment goals. The growing complexity of financial markets and the need for personalized investment strategies drive the adoption of AI in portfolio generation.
Risk Assessment and Management benefits from generative AI's ability to predict and mitigate potential risks. AI models can evaluate various risk factors, simulate market scenarios, and provide actionable insights to minimize losses and enhance risk-adjusted returns. The increasing regulatory requirements and the need for robust risk management frameworks underpin the demand for AI in this application.
Market Analysis and Prediction involves using generative AI to forecast market trends, price movements, and economic indicators. AI's predictive capabilities enable investors to make informed decisions, enhancing their competitive edge. The continuous advancements in AI algorithms and the growing availability of financial data drive the adoption of AI in market analysis.
Fraud Detection and Compliance is critical for maintaining market integrity and adhering to regulatory standards. Generative AI can identify suspicious activities, flag potential compliance issues, and ensure adherence to legal requirements. The rising incidences of financial fraud and the stringent regulatory landscape necessitate the use of AI for enhanced surveillance and compliance.
Others include various niche applications of generative AI in investing, such as customer sentiment analysis and automated advisory services. These applications contribute to the overall diversification and growth of the AI in the investing market.
By End-Users Analysis
Institutional investors were the largest users, with a 40% share.
In 2023, Institutional Investors held a dominant market position in the generative AI in investing market, capturing more than a 40% share. Institutional investors, including pension funds, mutual funds, and insurance companies, leverage generative AI to optimize portfolio management, enhance trading strategies, and improve risk assessment. The large-scale operations of institutional investors and their substantial financial resources enable significant investments in advanced AI technologies, driving their dominant market share. The focus on achieving higher returns and maintaining competitive advantages in dynamic markets further supports their substantial adoption of generative AI.
Retail Investors are also increasingly adopting generative AI tools for personalized investment strategies and market insights. AI-driven platforms provide retail investors with sophisticated analytical tools that were traditionally accessible only to institutional investors. The democratization of AI technology, coupled with the growing awareness of its benefits in investment decision-making, drives the increasing adoption among retail investors.
Investment Banks and Financial Institutions utilize generative AI for various applications, including algorithmic trading, market analysis, and compliance monitoring. The ability of AI to process large volumes of data and generate actionable insights in real-time is crucial for maintaining competitive edge and regulatory compliance. The significant investments in AI infrastructure by these institutions underline their substantial role in the market.
Others include hedge funds, private equity firms, and asset management companies that employ generative AI to enhance investment strategies and operational efficiency. The versatility and precision offered by AI technologies make them valuable across diverse investment entities.'
Key Market Segments
By Deployment Mode
- Cloud-Based
- On-Premises
By Application
- Portfolio Generation
- Risk Assessment and Management
- Market Analysis and Prediction
- Algorithmic Trading
- Fraud Detection and Compliance
- Others
By End-Users
- Institutional Investors
- Retail Investors
- Investment Banks and Financial Institutions
- Others
Growth Opportunity
Advanced Investment Strategies
The generative AI in investing market is poised for significant growth in 2024, driven by the development and implementation of advanced investment strategies. Generative AI's ability to analyze vast datasets, identify hidden patterns, and generate predictive models is transforming investment strategies. By leveraging machine learning algorithms and deep learning techniques, AI can create sophisticated models that optimize portfolio management, risk assessment, and asset allocation.
These advanced strategies enable investors to achieve superior performance by identifying profitable opportunities that traditional methods might overlook. AI-driven investment strategies can adapt to real-time market changes, providing dynamic and responsive approaches to investing. This adaptability is crucial in volatile markets, where timely and accurate decision-making can significantly impact returns.
Personalized Investment Services
Another key growth opportunity in 2024 for the generative AI in investing market is the rise of personalized investment services. AI technologies can tailor investment advice and strategies to individual investor profiles, considering factors such as risk tolerance, investment goals, and financial history. Personalized services enhance client engagement by providing bespoke investment solutions that align with individual needs and preferences.
Generative AI can analyze a client's financial data and market trends to offer customized investment recommendations, improving client satisfaction and loyalty. This level of personalization is particularly appealing to younger, tech-savvy investors who demand more control and transparency over their investment decisions. By offering tailored investment services, financial institutions can attract and retain a broader client base, driving market growth.
Latest Trends
Rise of Deep Reinforcement Learning
In 2024, the rise of deep reinforcement learning (DRL) is set to be a pivotal trend in the generative AI in investing market. DRL combines deep learning with reinforcement learning, enabling AI systems to learn from complex environments and make decisions that maximize long-term returns. This technology is particularly effective in dynamic and uncertain financial markets, where traditional models may fall short.
By continuously learning and adapting to market conditions, DRL algorithms can optimize trading strategies, enhance portfolio management, and improve risk assessment. The ability of DRL to handle vast amounts of data and complex decision-making processes makes it a powerful tool for investors seeking to gain a competitive edge.
Focus on Explainable AI
As generative AI becomes more integrated into investment strategies, the focus on explainable AI (XAI) is gaining prominence. Explainable AI aims to make AI decision-making processes transparent and understandable to humans. This trend addresses the "black box" issue of traditional AI models, which often lack transparency in how they arrive at decisions.
By providing clear explanations for investment recommendations and actions, XAI helps build trust and confidence among investors and regulatory bodies. This transparency is crucial for compliance with financial regulations and for reassuring clients that their investments are being managed responsibly and ethically.
Regional Analysis
North America holds the largest market share at 45%.
North America dominates the generative AI in investing market with a substantial 45% market share. This leadership is driven by the region's advanced technological ecosystem and a robust financial sector. The United States, in particular, spearheads this growth, benefiting from significant investments in AI research and development, and a high concentration of fintech companies. Financial institutions in North America are increasingly leveraging generative AI to enhance decision-making processes, optimize portfolios, and develop sophisticated trading algorithms.
Europe follows as a key market for generative AI in investing, with strong contributions from the UK, Germany, and France. The region benefits from a well-established financial services industry and supportive regulatory environments that encourage innovation in fintech.
Asia Pacific is poised for rapid growth in the generative AI in investing market, propelled by burgeoning fintech sectors in countries like China, Japan, and India. The region's growth is supported by significant technological advancements and increasing investments in AI-driven financial solutions.
Middle East & Africa shows emerging potential in the generative AI in investing market, primarily driven by the financial hubs in the Gulf Cooperation Council (GCC) countries. The region is gradually adopting advanced AI technologies to enhance financial services and investment strategies. Initiatives to diversify economies and reduce dependence on oil revenues are leading to increased investments in fintech and AI solutions, fostering growth in the generative AI market.
Latin America presents moderate growth prospects, with Brazil and Mexico being the primary contributors. The region's financial institutions are increasingly exploring generative AI applications to streamline operations, improve customer engagement, and develop innovative investment products.
Key Regions and Countries
North America
- US
- Canada
- Mexico
Western Europe
- Germany
- France
- The UK
- Spain
- Italy
- Portugal
- Ireland
- Austria
- Switzerland
- Benelux
- Nordic
- Rest of Western Europe
Eastern Europe
- Russia
- Poland
- The Czech Republic
- Greece
- Rest of Eastern Europe
APAC
- China
- Japan
- South Korea
- India
- Australia & New Zealand
- Indonesia
- Malaysia
- Philippines
- Singapore
- Thailand
- Vietnam
- Rest of APAC
Latin America
- Brazil
- Colombia
- Chile
- Argentina
- Costa Rica
- Rest of Latin America
Middle East & Africa
- Algeria
- Egypt
- Israel
- Kuwait
- Nigeria
- Saudi Arabia
- South Africa
- Turkey
- United Arab Emirates
- Rest of MEA
Key Players Analysis
The global generative AI in investing market is anticipated to experience transformative growth in 2024, driven by advancements in AI technologies, increasing adoption of algorithmic trading, and the need for data-driven investment strategies. Key players are leveraging cutting-edge AI to revolutionize investment decision-making processes.
OpenAI is at the forefront, leveraging its advanced generative AI models to provide powerful analytical tools and insights. OpenAI’s capabilities in natural language processing and deep learning enable sophisticated analysis of market trends and sentiment, enhancing predictive accuracy for investors.
IBM continues to be a dominant player, integrating its Watson AI platform into financial services. IBM's extensive expertise in AI and machine learning, coupled with its robust data analytics infrastructure, positions it well to offer comprehensive solutions for investment management and risk assessment.
QuantConnect stands out with its open-source algorithmic trading platform, empowering developers to build, backtest, and deploy investment strategies. QuantConnect's community-driven approach and extensive data library provide a versatile environment for developing generative AI models in finance.
Numerai leverages a decentralized network of data scientists to build predictive models, utilizing AI to optimize investment strategies. Numerai’s innovative approach, combining crowdsourced intelligence with AI, offers a unique edge in hedge fund management.
Sentient Technologies focuses on evolutionary computation and AI to create highly adaptive trading algorithms. Their emphasis on AI-driven trading strategies helps investors navigate volatile markets with enhanced precision and agility.
Kavout employs AI and machine learning to analyze large datasets, providing actionable insights for investment decisions. Kavout's proprietary Kai Score ranks stocks based on AI predictions, simplifying decision-making for investors.
Kensho Technologies, a subsidiary of S&P Global, utilizes AI to process vast amounts of unstructured data, delivering real-time analytics and insights. Kensho’s AI-driven solutions support investors in identifying market opportunities and risks with greater accuracy.
Market Key Players
- OpenAI
- IBM
- QuantConnect
- Numerai
- Sentient Technologies
- Kavout
- Kensho Technologies
Recent Development
- In February 2024, S&P Global launched a generative AI search tool to enhance data exploration and user experience on their Marketplace.
- In June 2023, Salesforce introduced Commerce GPT and Marketing GPT to innovate audience segmentation and personalized marketing strategies using real-time data .
Report Scope
Report Features Description Market Value (2023) USD 111.0 Mn Forecast Revenue (2033) USD 1433.1 Mn CAGR (2024-2033) 30% Base Year for Estimation 2023 Historic Period 2018-2023 Forecast Period 2024-2033 Report Coverage Revenue Forecast, Market Dynamics, Competitive Landscape, Recent Developments Segments Covered By Deployment Mode (Cloud-Based, On-Premises), By Application (Portfolio Generation, Risk Assessment and Management, Market Analysis and Prediction, Algorithmic Trading, Fraud Detection and Compliance, Others), By End-Users (Institutional Investors, Retail Investors, Investment Banks and Financial Institutions, Others) Regional Analysis North America - The US, Canada, & Mexico; Western Europe - Germany, France, The UK, Spain, Italy, Portugal, Ireland, Austria, Switzerland, Benelux, Nordic, & Rest of Western Europe; Eastern Europe - Russia, Poland, The Czech Republic, Greece, & Rest of Eastern Europe; APAC - China, Japan, South Korea, India, Australia & New Zealand, Indonesia, Malaysia, Philippines, Singapore, Thailand, Vietnam, & Rest of APAC; Latin America - Brazil, Colombia, Chile, Argentina, Costa Rica, & Rest of Latin America; Middle East & Africa - Algeria, Egypt, Israel, Kuwait, Nigeria, Saudi Arabia, South Africa, Turkey, United Arab Emirates, & Rest of MEA Competitive Landscape OpenAI, IBM, QuantConnect, Numerai, Sentient Technologies, Kavout, Kensho Technologies Customization Scope Customization for segments, region/country-level will be provided. Moreover, additional customization can be done based on the requirements. Purchase Options We have three licenses to opt for: Single User License, Multi-User License (Up to 5 Users), Corporate Use License (Unlimited User and Printable PDF) -
-
- OpenAI
- IBM
- QuantConnect
- Numerai
- Sentient Technologies
- Kavout
- Kensho Technologies
- Other Key Players
Our Clients


View Our Licence Options
