
Generative AI in Insurance Market By Component(Solutions, Services), By Deployment(On-Premise, Cloud-based), By Application(Claims Processing, Underwriting, Customer Service, Fraud Detection, Risk Assessment, Document Extraction & Classification, Others), By Enterprise Size(Large Enterprises, SMEs), By Region and Companies - Industry Segment Outlook, Market Assessment, Competition Scenario, Trends, and Forecast 2024-2033
-
36875
-
September 2024
-
300
-


-
This report was compiled by Vishwa Gaul Vishwa is an experienced market research and consulting professional with over 8 years of expertise in the ICT industry, contributing to over 700 reports across telecommunications, software, hardware, and digital solutions. Correspondence Team Lead- ICT Linkedin | Detailed Market research Methodology Our methodology involves a mix of primary research, including interviews with leading mental health experts, and secondary research from reputable medical journals and databases. View Detailed Methodology Page
-
Quick Navigation
Report Overview
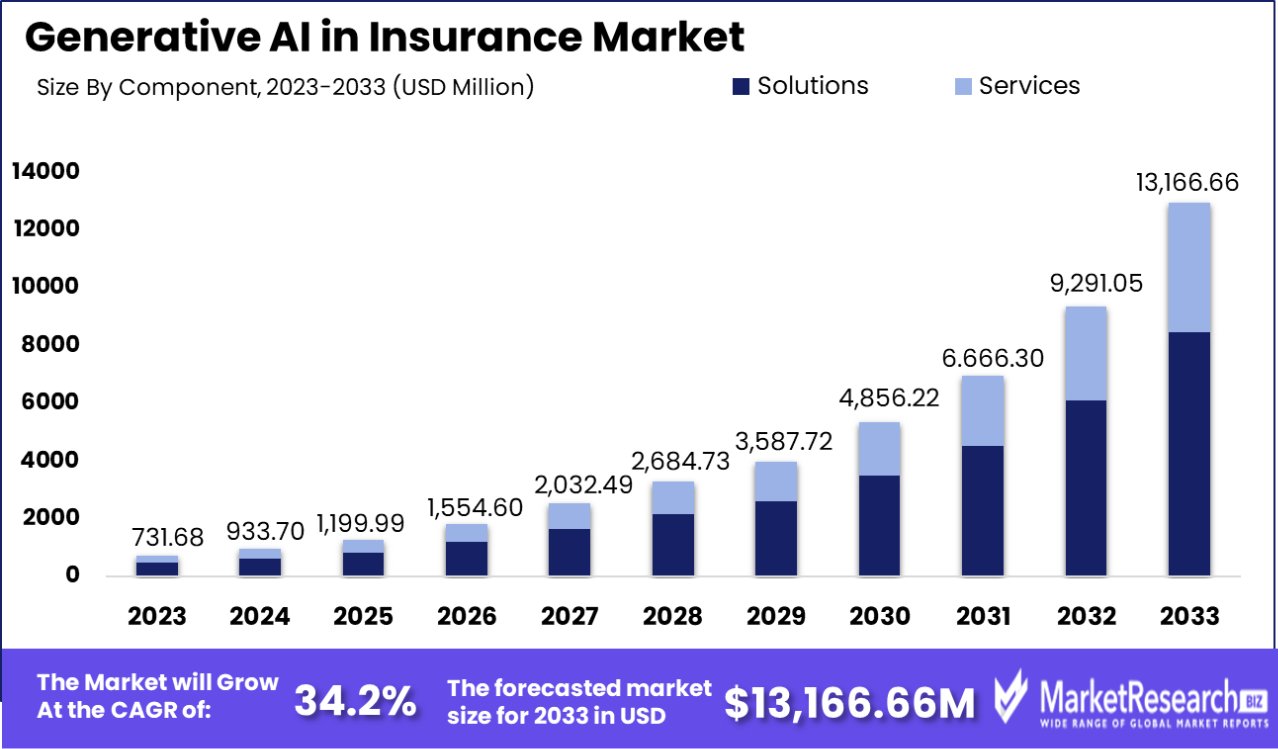
Global Generative AI in Insurance Market size is expected to be worth around USD 13,166.66 Mn by 2033 from USD 731.68 Mn in 2023, growing at a CAGR of 34.2% during the forecast period from 2024 to 2033.
The surge in demand for advanced new technologies and the rise in banking sectors are some of the main key driving factors for generative AI in insurance.
The generative AI in insurance is defined as the application of artificial intelligence methods predominantly generative models like generative adversarial networks and variational autoencoders, to change different aspects of the banking sectors. This application also comprises using generative algorithms to examine huge amounts of data, including past claims, customer behavior, and potential risk factors to produce insights and enhance insurance techniques.
Generative AI simplifies tasks like fraud detection, risk assessment, and customized underwriting by producing synthetic data and simulating multiple situations. It allows insurers to enhance pricing precision by augmenting customer experience through customized products and services and streamlining claims methods.
Furthermore, gen AI helps in the creation of innovative insurance products and the automation of daily tasks, by leading to more efficacy operations and better risk management. Generative AI in insurance focuses on propelling profitability, alleviating risks, and improving competitiveness in the growing insurance landscape.
According to Medium in November 2023, highlights that in 2022, more than 22% of customers stated dissatisfaction with their P&C insurance providers. The American Customer Satisfaction Index (ACSI) discloses a pressing requirement for improvement, particularly in areas like the availability of discounts, speed of claims processing, and clarity of billing statements. BCG highlights that gen AI applications provide substantial efficacy and cost savings all across the insurance value chain.
One of the most notable revelations is the potential 40% to 60% savings in customer service productivity. Insurance agents currently spend about 35% of their time navigating through policies and terms. With Generative AI, this can be drastically decreased by permitting swift and accurate document queries. Moreover, 87% of customers believe their claims experiences influence their loyalty to an insurer.
Generative AI in insurance offers several benefits enhanced fraud detection through synthetic data generation, augmented risk assessment through scenario simulation, and customized underwriting for customers.
It makes easy claims processing, enhances pricing precision, and nurtures new innovations, ultimately leading to better customer experience, satisfaction, and a rise in operational efficiency for insurers. The demand for generative AI in insurance will increase due to its requirement in the banking sectors which will help in market expansion in the coming years.
Key Takeaways
- Market Value: Global Generative AI in Insurance Market size is expected to be worth around USD 13,166.66 Mn by 2033 from USD 731.68 Mn in 2023, growing at a CAGR of 34.2% during the forecast period from 2024 to 2033.
- By Component: In 2023, Solutions held a dominant market position in the By Component segment of Generative AI in Insurance Market, with a 65.7% share.
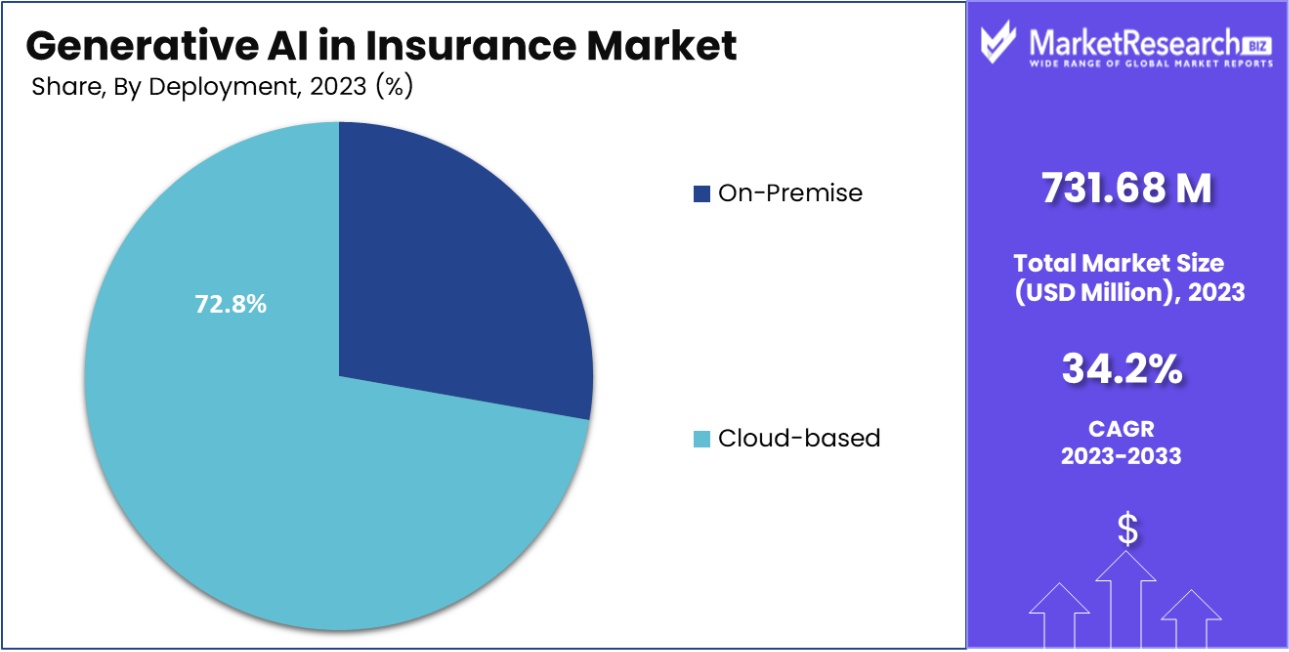
- By Deployment: In 2023, Cloud-based held a dominant market position in the By Deployment segment of Generative AI in Insurance Market, with a 72.8% share.
- By Application: In 2023, Claims Processing held a dominant market position in the By Application segment of Generative AI in Insurance Market , with a 25.9% share.
- By Enterprise Size: In 2023, Large Enterprises held a dominant market position in the By Enterprise Size segment of Generative AI in Insurance Market, with a 70.3% share.
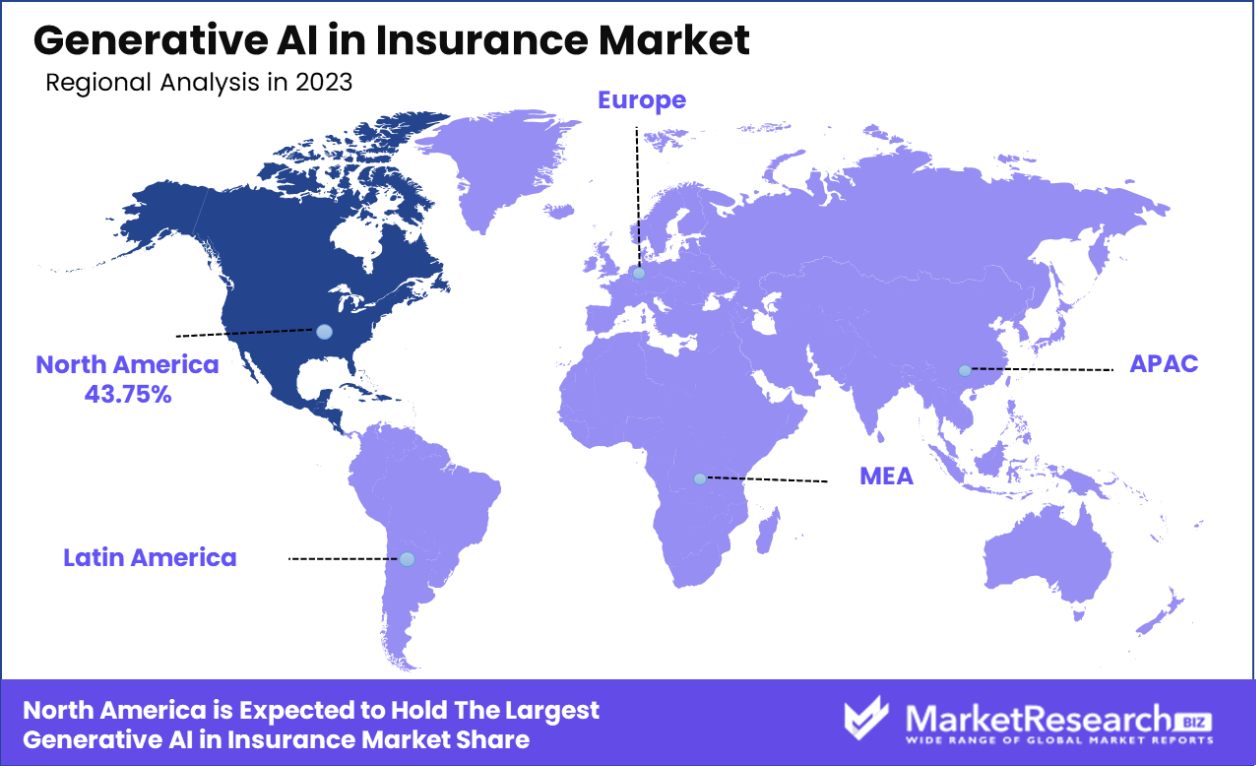
- Regional Analysis: North America holds a dominant 43.75% share in the Generative AI insurance market, leading innovation.
- Growth Opportunity: In 2023, the integration of generative AI in the insurance industry is set to enhance operational efficiency through cost-saving automation of routine tasks and revolutionize customer interactions by offering personalized experiences that boost satisfaction and loyalty.
Driving factors
Cloud Adoption: Catalyzing Flexibility and Speed in Insurance
Cloud adoption is a pivotal driver in the generative AI insurance market. By migrating core systems to cloud infrastructure, insurance companies gain remarkable agility, which is crucial in adapting to market changes and consumer demands quickly. This flexibility also facilitates the rapid deployment of innovative products, which is essential in a competitive landscape.
Moreover, cloud computing enhances customer service capabilities by enabling more responsive and personalized interactions through advanced generative data analytics powered by AI. These advancements not only streamline operational processes but also improve the efficiency and accuracy of claims processing and risk assessment, thereby reducing costs and increasing customer satisfaction.
Ecosystem Integration: Enhancing Connectivity and Insight
The integration of ecosystems in the insurance sector is transforming traditional business models. By forming strategic alliances and integrating diverse data sources—such as IoT devices, public records, and third-party services—insurers can obtain a more holistic view of risks. This comprehensive data environment enhances predictive capabilities and risk management, allowing insurers to offer more tailored products and engage in proactive risk mitigation.
Furthermore, ecosystem integration supports the implementation of generative AI tools that require vast, diverse data sets to generate insights, predict trends, and automate customer interactions, thus enriching the overall customer experience and operational resilience.
Next-Level Automation: Redefining Risk and Efficiency
The push towards automation in the insurance industry is reshaping the landscape, particularly in areas that were traditionally labor-intensive such as underwriting and claims processing. Generative AI contributes significantly to this shift by automating complex processes and decisions that typically require human judgment.
This not only speeds up operations but also helps in managing and pricing risks more effectively, as AI systems can analyze large datasets quickly and with greater accuracy than humans. Additionally, automation through AI reduces the likelihood of human error and biases, leading to fairer and more consistent decision-making. As a result, insurers can offer more competitive pricing and better service, ultimately enhancing their market position and growth prospects.
Restraining Factors
Moral Hazard: Navigating the Pitfalls of Information Asymmetry
The deployment of generative AI in the insurance sector introduces a significant challenge in the form of moral hazard due to information asymmetry. In the insurance context, this occurs when there is a discrepancy between the information available to the AI systems and the users, which can lead to unpredicted or undesirable behaviors from the AI after policies are issued. This risk is particularly acute in scenarios where AI systems make decisions based on incomplete or biased data sets, potentially leading to unfair policy terms or pricing.
Such issues not only undermine customer trust but also pose regulatory risks, as insurers are held accountable for the actions of their AI systems. Managing this requires rigorous IoT data management, transparency in AI decision processes, and continuous monitoring to ensure outcomes align with ethical standards and regulatory requirements. Addressing these challenges is crucial for maintaining the integrity of insurance offerings and for the sustainable growth of AI applications in this sector.
Professional Responsibility: Upholding Standards with AI Integration
As generative AI becomes more integrated into the insurance industry, there is an increasing need to address the concerns regarding professional responsibility. Insurance professionals and attorneys are bound by ethical obligations to provide competent, accurate, and fair services. The use of AI tools must align with these duties, necessitating a deep understanding and oversight of how AI algorithms function and are applied in practice.
Missteps in AI deployment can lead to incorrect assessments, biased decision-making, or even legal liabilities if they fail to meet professional standards. Ensuring that AI tools are reliable and their outputs are verifiable becomes imperative to uphold professional integrity and protect consumer rights. These constraints are significant as they dictate the pace and manner in which AI technology can be ethically and effectively integrated into professional practices within the industry.
By Component Analysis
In 2023, Solutions held a dominant market position in the "By Component" segment of the Generative AI in Insurance Market, with a 65.7% share. This prominence can be attributed to the extensive integration of AI solutions in claims processing, risk assessment, customer service, and fraud detection. These applications are critical in enhancing operational efficiencies and improving customer engagement strategies.
The Services segment also exhibited significant growth, driven by the rising demand for customization and integration services that support the deployment of AI solutions. As insurance companies continue to invest in digital transformation, the need for expert services that facilitate the adoption of AI technologies has become imperative. This has resulted in a compounded annual growth rate (CAGR) for Services estimated at 18.3% over the forecast period.
Overall, the integration of Generative AI into the insurance sector is transforming traditional operations, enabling companies to harness predictive analytics and improve decision-making processes. The strategic deployment of both Solutions and Services is instrumental in refining risk models and enhancing the precision of customer insights, thereby fostering a more robust and responsive insurance marketplace.
By Deployment Analysis
In 2023, Cloud-based solutions held a dominant market position in the "By Deployment" segment of the Generative AI in Insurance Market, with than a 72.8% share. The substantial market preference for cloud-based platforms can be attributed to their scalability, cost-effectiveness, and ease of integration with existing digital infrastructure. These platforms facilitate rapid deployment and seamless updates, which are crucial for leveraging generative AI capabilities in dynamic market conditions.
On-Premise solutions, while maintaining a smaller market share, continue to be relevant for organizations prioritizing data control, security, and regulatory compliance. However, the agility and reduced overhead costs associated with cloud environments significantly contribute to their larger market share.
The market dynamics indicate a continuing trend towards cloud deployments, driven by the growing recognition of their strategic benefits in processing large datasets and implementing AI-driven analytical tools. This trend is anticipated to accelerate as insurance companies increasingly adopt cloud-first strategies to enhance their competitive edge in utilizing generative AI for customer service, personalized insurance offerings, and risk management.
By Application Analysis
In 2023, Claims Processing held a dominant market position in the By Application segment of the Generative AI in Insurance Market, with a 25.9% share. This segment has been pivotal due to the integration of AI technologies that streamline and automate the evaluation and management of insurance claims, thereby reducing processing time and costs while increasing accuracy and customer satisfaction.
Underwriting followed closely, leveraging Generative AI to enhance risk assessment capabilities and customize insurance policies more effectively. This segment used sophisticated algorithms to analyze vast data sets, leading to more accurate risk predictions and premium determinations.
Customer Service also greatly benefited from Generative AI, which enabled the deployment of advanced chatbots and virtual assistants. These AI tools are capable of handling a wide range of customer inquiries and issues around the clock, improving customer engagement and operational efficiencies.
Fraud Detection utilizes Generative AI to identify and prevent fraudulent activities by analyzing patterns and anomalies that deviate from normal behaviors. AI-driven systems in this segment have become essential in safeguarding against losses and maintaining trust in insurance services.
Risk Assessment employed Generative AI to delve deeper into predictive analytics, helping insurers understand potential risks better and make informed decisions. This segment saw significant application in anticipating future claims and determining viable policy terms.
Document Extraction & Classification utilized AI to automatically extract and classify data from various document types, reducing manual efforts and errors associated with data entry and processing. This segment is crucial for improving the accuracy and efficiency of paperwork in insurance operations.
Others in the application segments included areas like policy renewal and cancellation processes, where AI tools provide significant operational improvements and customer satisfaction enhancements. These segments collectively contribute to a holistic application of Generative AI across the insurance industry, driving forward the digital transformation of traditional practices.
By Enterprise Size Analysis
In 2023, Large Enterprises held a dominant market position in the "By Enterprise Size" segment of the Generative AI in Insurance Market, with a 70.3% share. This dominance is largely driven by the significant resources that large enterprises can allocate toward advanced AI technologies, including substantial investments in generative AI for automating processes, enhancing customer experience, and optimizing risk management.
The ability of large enterprises to invest in cutting-edge technology and attract top talent enables them to leverage generative AI more effectively than their smaller counterparts. This includes deploying AI for predictive analytics, personalized insurance products, and sophisticated claim-handling processes, thereby not only improving operational efficiency but also enhancing customer satisfaction.
SMEs, while holding a smaller portion of the market share, are gradually recognizing the benefits of generative AI. The scalability of cloud-based AI solutions is lowering entry barriers for these smaller players, allowing them to compete more effectively by adopting technologies that were previously accessible only to larger corporations. As the technology becomes more mainstream and affordable, SMEs are expected to increase their adoption rates, potentially reshaping the competitive landscape in the insurance industry.
Key Market Segments
By Component
- Solutions
- Services
By Deployment
- On-Premise
- Cloud-based
By Application
- Claims Processing
- Underwriting
- Customer Service
- Fraud Detection
- Risk Assessment
- Document Extraction & Classification
- Others
By Enterprise Size
- Large Enterprises
- SMEs
Growth Opportunity
Enhanced Operational Efficiency through Cost Savings
In 2023, the insurance industry stands on the brink of transformation, primarily driven by the integration of generative AI technologies. These advanced systems promise significant cost savings by automating routine and low-risk tasks such as document processing and policy management.
This shift not only reduces the financial burden associated with manual operations but also reallocates human capital towards more strategic activities, enhancing overall productivity gains and operational efficiency. By streamlining workflows, insurers can minimize expenses and optimize resource allocation, setting a new standard in operational agility.
Revolutionizing Customer Interactions with Personalized Experiences
Generative AI is poised to redefine customer engagement within the insurance sector. By harnessing the power of AI to analyze vast amounts of data, insurers can offer highly personalized Insurance policies and dynamic customer interactions.
This capability enables insurance companies to exceed customer expectations through tailored communication and bespoke solutions, fostering a deeper connection with clients. The impact of such personalized experiences is profound, leading to increased customer satisfaction and loyalty, which are critical factors in an industry as competitive as insurance.
Latest Trends
Tailored Insurance Solutions through Personalized Policy Recommendations
As we look towards 2023, one of the most transformative trends in the insurance sector is the rise of personalized policy recommendations powered by generative AI. This technology enables insurers to design customized insurance products that align closely with individual customer needs and preferences.
By analyzing data from various touchpoints, generative AI systems can identify unique risk profiles and suggest insurance policies that are not only optimal but also competitively priced. This trend towards customization is set to enhance customer satisfaction and retention, as clients increasingly seek solutions that reflect their specific circumstances and lifestyle choices.
Enhancing Customer Support with AI-driven Chatbots and Virtual Assistants
Another significant trend reshaping the insurance industry is the widespread adoption of generative chatbots and virtual assistants. These AI-driven tools are revolutionizing customer service by providing round-the-clock support and handling a multitude of inquiries with precision and efficiency.
The capabilities of these virtual assistants go beyond mere communication; they are equipped to understand and process complex customer requests, offering solutions and assisting with claims processing. The impact of this trend is profound, as it not only improves operational efficiency but also elevates the customer experience, making interactions more engaging and responsive.
Regional Analysis
North America holds a dominant 43.75% share in the Generative AI insurance market, leading innovation.
The Generative AI market in the insurance sector demonstrates significant regional variations in adoption and growth dynamics. North America emerges as the dominating region, accounting for approximately 43.75% of the global market. This is primarily driven by substantial investments in AI technologies and robust regulatory frameworks that favor innovation.
In Europe, the market's expansion is supported by strong data protection regulations and increasing digital transformation initiatives across the insurance industry. The Asia Pacific region is witnessing rapid growth due to increasing technological adoption and the integration of AI with mobile platforms, which are highly prevalent in areas such as China and India.
In the Middle East & Africa, the market is still nascent but shows potential due to growing digital literacy and government initiatives aimed at digital transformation. Latin America, on the other hand, presents a smaller but growing segment, with generative AI beginning to make inroads into traditional markets, driven by increasing internet penetration and a youthful demographic more open to digital insurance solutions.
Collectively, these regional dynamics underline the global heterogeneity in the adoption and impact of generative AI in the insurance industry, with North America continuing to lead in innovation and market share.
Key Regions and Countries
North America
- The US
- Canada
Europe
- Germany
- France
- The UK
- Spain
- Italy
- Rest of Europe
Asia-Pacific
- China
- Japan
- South Korea
- India
- Australia
- Singapore
- Rest of Asia Pacific
Latin America
- Mexico
- Brazil
- Rest of Latin America
Middle East & Africa
- Saudi Arabia
- South Africa
- UAE
- Rest of Middle East & Africa
Key Players Analysis
Amazon Web Services, Inc. (AWS) has established itself as a pivotal player in the global Generative AI in Insurance Market in 2023. AWS offers a robust suite of AI services that empower insurance companies to enhance their claims processing, risk assessment, and customer service. The scalability of AWS cloud solutions enables insurers to manage large volumes of data efficiently, driving innovations in personalized insurance policies and real-time risk management. Furthermore, AWS’s commitment to security and compliance aligns well with the stringent requirements of the insurance sector, reinforcing its strong market position.
IBM Corporation continues to be at the forefront of integrating AI into insurance. Its AI platform, Watson, is renowned for its deep learning capabilities and industry-specific solutions, particularly in underwriting and fraud detection. IBM’s expertise in data analytics and machine learning makes it a preferred partner for insurance companies looking to leverage advanced predictive models to drive decision-making and operational efficiencies. IBM's focus on hybrid cloud environments and AI ethics also enhances its appeal in the market, emphasizing responsible AI deployment in sensitive areas such as insurance.
Hexaware stands out for its targeted approach towards transforming legacy insurance systems through AI-driven innovations. Specializing in automation and data-driven insights, Hexaware helps insurers streamline operations and deliver enhanced customer experiences. The company’s solutions in document extraction and classification and customized AI services position it as a key enabler of digital transformation in the insurance industry. Hexaware’s strategic focus on AI integration into existing insurance frameworks showcases its capability to meet diverse client needs in the evolving market landscape.
Market Key Players
- Amazon Web Services, Inc.
- IBM Corporation
- Hexaware
- Shift Technology
- Lemonade
- GEICO
- Sixfold
- Snorkel
- Appian
- Microsoft Corporation
- Other Key Players
Recent Development
- In April 2024, Swiss Re launched an augmented version of its Life Guide manual, now featuring "Swiss Re Life Guide Scout," a Generative AI-powered underwriting assistant developed in collaboration with Microsoft Azure OpenAI Service to enhance the efficiency and quality of Life & Health insurance underwriting.
- In April 2024, Majesco announced the Spring '24 Release of its software solutions, highlighted by Majesco Copilot enhancements, which integrate Generative AI across its comprehensive insurance technology portfolio, enhancing operational efficiency and customer interaction for insurers.
- In April 2024, Investments in AI technology companies disrupting the insurance sector increased by 18% year-on-year, reaching nearly $2 billion through private equity and venture financing globally, with advancements in AI and Large Language Models driving a new phase of innovation in risk analysis and claims processing.
- In April 2024, The Worldwide Insurance 2024 Predictions report highlights that by 2027, 40% of AI algorithms used by insurers in the Asia/Pacific region will incorporate synthetic data to enhance fairness and compliance with evolving regulations such as the EU AI Act, amidst broader AI-driven innovations that are transforming the insurance industry.
Report Scope
Report Features Description Market Value (2023) USD 731.68 Million Forecast Revenue (2033) USD 13,166.66 Million CAGR (2024-2032) 34.2% Base Year for Estimation 2023 Historic Period 2022 Forecast Period 2024-2033 Report Coverage Revenue Forecast, Market Dynamics, COVID-19 Impact, Competitive Landscape, Recent Developments Segments Covered By Component(Solutions, Services), By Deployment(On-Premise, Cloud-based), By Application(Claims Processing, Underwriting, Customer Service, Fraud Detection, Risk Assessment, Document Extraction & Classification, Others), By Enterprise Size(Large Enterprises, SMEs) Regional Analysis North America - The US, Canada, Europe - Germany, France, The UK, Spain, Italy, Rest of Europe, Asia-Pacific - China, Japan, South Korea, India, Australia, New Zealand, Singapore, Rest of Asia Pacific, Latin America - Mexico, Brazil, Rest of Latin America, Middle East & Africa - South Africa, Saudi Arabia, UAE, Rest of Middle East & Africa Competitive Landscape Amazon Web Services, Inc., IBM Corporation, Hexaware, Shift Technology, Lemonade, GEICO, Sixfold, Snorkel, Appian, Microsoft Corporation, Other Key Players Customization Scope Customization for segments, region/country-level will be provided. Moreover, additional customization can be done based on the requirements. Purchase Options We have three licenses to opt for Single User License, Multi-User License (Up to 5 Users), Corporate Use License (Unlimited User and Printable PDF) -
- 1. Executive Summary
- 1.1. Definition
- 1.2. Taxonomy
- 1.3. Research Scope
- 1.4. Key Analysis
- 1.5. Key Findings by Major Segments
- 1.6. Top strategies by Major Players
- 2. Global Generative AI in Insurance Market Overview
- 2.1. Generative AI in Insurance Market Dynamics
- 2.1.1. Drivers
- 2.1.2. Opportunities
- 2.1.3. Restraints
- 2.1.4. Challenges
- 2.2. Macro-economic Factors
- 2.3. Regulatory Framework
- 2.4. Market Investment Feasibility Index
- 2.5. PEST Analysis
- 2.6. PORTER’S Five Force Analysis
- 2.7. Drivers & Restraints Impact Analysis
- 2.8. Industry Chain Analysis
- 2.9. Cost Structure Analysis
- 2.10. Marketing Strategy
- 2.11. Russia-Ukraine War Impact Analysis
- 2.12. Opportunity Map Analysis
- 2.13. Market Competition Scenario Analysis
- 2.14. Product Life Cycle Analysis
- 2.15. Opportunity Orbits
- 2.16. Manufacturer Intensity Map
- 2.17. Major Companies sales by Value & Volume
- 2.1. Generative AI in Insurance Market Dynamics
- 3. Global Generative AI in Insurance Market Analysis, Opportunity and Forecast, 2016-2032
- 3.1. Global Generative AI in Insurance Market Analysis, 2016-2021
- 3.2. Global Generative AI in Insurance Market Opportunity and Forecast, 2023-2032
- 3.3. Global Generative AI in Insurance Market Analysis, Opportunity and Forecast, By Component, 2016-2032
- 3.3.1. Global Generative AI in Insurance Market Analysis by Component: Introduction
- 3.3.2. Market Size Absolute $ Opportunity Analysis and Forecast, By Component, 2016-2032
- 3.3.3. Solutions
- 3.3.4. Services
- 3.4. Global Generative AI in Insurance Market Analysis, Opportunity and Forecast, By Deployment, 2016-2032
- 3.4.1. Global Generative AI in Insurance Market Analysis by Deployment: Introduction
- 3.4.2. Market Size Absolute $ Opportunity Analysis and Forecast, By Deployment, 2016-2032
- 3.4.3. On-Premise
- 3.4.4. Cloud-based
- 3.5. Global Generative AI in Insurance Market Analysis, Opportunity and Forecast, By Application, 2016-2032
- 3.5.1. Global Generative AI in Insurance Market Analysis by Application: Introduction
- 3.5.2. Market Size Absolute $ Opportunity Analysis and Forecast, By Application, 2016-2032
- 3.5.3. Claims Processing
- 3.5.4. Underwriting
- 3.5.5. Customer Service
- 3.5.6. Fraud Detection
- 3.5.7. Risk Assessment
- 3.5.8. Document Extraction & Classification
- 3.5.9. Others
- 3.6. Global Generative AI in Insurance Market Analysis, Opportunity and Forecast, By Enterprise Size, 2016-2032
- 3.6.1. Global Generative AI in Insurance Market Analysis by Enterprise Size: Introduction
- 3.6.2. Market Size Absolute $ Opportunity Analysis and Forecast, By Enterprise Size, 2016-2032
- 3.6.3. Large Enterprises
- 3.6.4. SMEs
- 4. North America Generative AI in Insurance Market Analysis, Opportunity and Forecast, 2016-2032
- 4.1. North America Generative AI in Insurance Market Analysis, 2016-2021
- 4.2. North America Generative AI in Insurance Market Opportunity and Forecast, 2023-2032
- 4.3. North America Generative AI in Insurance Market Analysis, Opportunity and Forecast, By Component, 2016-2032
- 4.3.1. North America Generative AI in Insurance Market Analysis by Component: Introduction
- 4.3.2. Market Size Absolute $ Opportunity Analysis and Forecast, By Component, 2016-2032
- 4.3.3. Solutions
- 4.3.4. Services
- 4.4. North America Generative AI in Insurance Market Analysis, Opportunity and Forecast, By Deployment, 2016-2032
- 4.4.1. North America Generative AI in Insurance Market Analysis by Deployment: Introduction
- 4.4.2. Market Size Absolute $ Opportunity Analysis and Forecast, By Deployment, 2016-2032
- 4.4.3. On-Premise
- 4.4.4. Cloud-based
- 4.5. North America Generative AI in Insurance Market Analysis, Opportunity and Forecast, By Application, 2016-2032
- 4.5.1. North America Generative AI in Insurance Market Analysis by Application: Introduction
- 4.5.2. Market Size Absolute $ Opportunity Analysis and Forecast, By Application, 2016-2032
- 4.5.3. Claims Processing
- 4.5.4. Underwriting
- 4.5.5. Customer Service
- 4.5.6. Fraud Detection
- 4.5.7. Risk Assessment
- 4.5.8. Document Extraction & Classification
- 4.5.9. Others
- 4.6. North America Generative AI in Insurance Market Analysis, Opportunity and Forecast, By Enterprise Size, 2016-2032
- 4.6.1. North America Generative AI in Insurance Market Analysis by Enterprise Size: Introduction
- 4.6.2. Market Size Absolute $ Opportunity Analysis and Forecast, By Enterprise Size, 2016-2032
- 4.6.3. Large Enterprises
- 4.6.4. SMEs
- 4.7. North America Generative AI in Insurance Market Analysis, Opportunity and Forecast, By Country , 2016-2032
- 4.7.1. North America Generative AI in Insurance Market Analysis by Country : Introduction
- 4.7.2. Market Size Absolute $ Opportunity Analysis and Forecast, Country , 2016-2032
- 4.7.2.1. The US
- 4.7.2.2. Canada
- 4.7.2.3. Mexico
- 5. Western Europe Generative AI in Insurance Market Analysis, Opportunity and Forecast, 2016-2032
- 5.1. Western Europe Generative AI in Insurance Market Analysis, 2016-2021
- 5.2. Western Europe Generative AI in Insurance Market Opportunity and Forecast, 2023-2032
- 5.3. Western Europe Generative AI in Insurance Market Analysis, Opportunity and Forecast, By Component, 2016-2032
- 5.3.1. Western Europe Generative AI in Insurance Market Analysis by Component: Introduction
- 5.3.2. Market Size Absolute $ Opportunity Analysis and Forecast, By Component, 2016-2032
- 5.3.3. Solutions
- 5.3.4. Services
- 5.4. Western Europe Generative AI in Insurance Market Analysis, Opportunity and Forecast, By Deployment, 2016-2032
- 5.4.1. Western Europe Generative AI in Insurance Market Analysis by Deployment: Introduction
- 5.4.2. Market Size Absolute $ Opportunity Analysis and Forecast, By Deployment, 2016-2032
- 5.4.3. On-Premise
- 5.4.4. Cloud-based
- 5.5. Western Europe Generative AI in Insurance Market Analysis, Opportunity and Forecast, By Application, 2016-2032
- 5.5.1. Western Europe Generative AI in Insurance Market Analysis by Application: Introduction
- 5.5.2. Market Size Absolute $ Opportunity Analysis and Forecast, By Application, 2016-2032
- 5.5.3. Claims Processing
- 5.5.4. Underwriting
- 5.5.5. Customer Service
- 5.5.6. Fraud Detection
- 5.5.7. Risk Assessment
- 5.5.8. Document Extraction & Classification
- 5.5.9. Others
- 5.6. Western Europe Generative AI in Insurance Market Analysis, Opportunity and Forecast, By Enterprise Size, 2016-2032
- 5.6.1. Western Europe Generative AI in Insurance Market Analysis by Enterprise Size: Introduction
- 5.6.2. Market Size Absolute $ Opportunity Analysis and Forecast, By Enterprise Size, 2016-2032
- 5.6.3. Large Enterprises
- 5.6.4. SMEs
- 5.7. Western Europe Generative AI in Insurance Market Analysis, Opportunity and Forecast, By Country , 2016-2032
- 5.7.1. Western Europe Generative AI in Insurance Market Analysis by Country : Introduction
- 5.7.2. Market Size Absolute $ Opportunity Analysis and Forecast, Country , 2016-2032
- 5.7.2.1. Germany
- 5.7.2.2. France
- 5.7.2.3. The UK
- 5.7.2.4. Spain
- 5.7.2.5. Italy
- 5.7.2.6. Portugal
- 5.7.2.7. Ireland
- 5.7.2.8. Austria
- 5.7.2.9. Switzerland
- 5.7.2.10. Benelux
- 5.7.2.11. Nordic
- 5.7.2.12. Rest of Western Europe
- 6. Eastern Europe Generative AI in Insurance Market Analysis, Opportunity and Forecast, 2016-2032
- 6.1. Eastern Europe Generative AI in Insurance Market Analysis, 2016-2021
- 6.2. Eastern Europe Generative AI in Insurance Market Opportunity and Forecast, 2023-2032
- 6.3. Eastern Europe Generative AI in Insurance Market Analysis, Opportunity and Forecast, By Component, 2016-2032
- 6.3.1. Eastern Europe Generative AI in Insurance Market Analysis by Component: Introduction
- 6.3.2. Market Size Absolute $ Opportunity Analysis and Forecast, By Component, 2016-2032
- 6.3.3. Solutions
- 6.3.4. Services
- 6.4. Eastern Europe Generative AI in Insurance Market Analysis, Opportunity and Forecast, By Deployment, 2016-2032
- 6.4.1. Eastern Europe Generative AI in Insurance Market Analysis by Deployment: Introduction
- 6.4.2. Market Size Absolute $ Opportunity Analysis and Forecast, By Deployment, 2016-2032
- 6.4.3. On-Premise
- 6.4.4. Cloud-based
- 6.5. Eastern Europe Generative AI in Insurance Market Analysis, Opportunity and Forecast, By Application, 2016-2032
- 6.5.1. Eastern Europe Generative AI in Insurance Market Analysis by Application: Introduction
- 6.5.2. Market Size Absolute $ Opportunity Analysis and Forecast, By Application, 2016-2032
- 6.5.3. Claims Processing
- 6.5.4. Underwriting
- 6.5.5. Customer Service
- 6.5.6. Fraud Detection
- 6.5.7. Risk Assessment
- 6.5.8. Document Extraction & Classification
- 6.5.9. Others
- 6.6. Eastern Europe Generative AI in Insurance Market Analysis, Opportunity and Forecast, By Enterprise Size, 2016-2032
- 6.6.1. Eastern Europe Generative AI in Insurance Market Analysis by Enterprise Size: Introduction
- 6.6.2. Market Size Absolute $ Opportunity Analysis and Forecast, By Enterprise Size, 2016-2032
- 6.6.3. Large Enterprises
- 6.6.4. SMEs
- 6.7. Eastern Europe Generative AI in Insurance Market Analysis, Opportunity and Forecast, By Country , 2016-2032
- 6.7.1. Eastern Europe Generative AI in Insurance Market Analysis by Country : Introduction
- 6.7.2. Market Size Absolute $ Opportunity Analysis and Forecast, Country , 2016-2032
- 6.7.2.1. Russia
- 6.7.2.2. Poland
- 6.7.2.3. The Czech Republic
- 6.7.2.4. Greece
- 6.7.2.5. Rest of Eastern Europe
- 7. APAC Generative AI in Insurance Market Analysis, Opportunity and Forecast, 2016-2032
- 7.1. APAC Generative AI in Insurance Market Analysis, 2016-2021
- 7.2. APAC Generative AI in Insurance Market Opportunity and Forecast, 2023-2032
- 7.3. APAC Generative AI in Insurance Market Analysis, Opportunity and Forecast, By Component, 2016-2032
- 7.3.1. APAC Generative AI in Insurance Market Analysis by Component: Introduction
- 7.3.2. Market Size Absolute $ Opportunity Analysis and Forecast, By Component, 2016-2032
- 7.3.3. Solutions
- 7.3.4. Services
- 7.4. APAC Generative AI in Insurance Market Analysis, Opportunity and Forecast, By Deployment, 2016-2032
- 7.4.1. APAC Generative AI in Insurance Market Analysis by Deployment: Introduction
- 7.4.2. Market Size Absolute $ Opportunity Analysis and Forecast, By Deployment, 2016-2032
- 7.4.3. On-Premise
- 7.4.4. Cloud-based
- 7.5. APAC Generative AI in Insurance Market Analysis, Opportunity and Forecast, By Application, 2016-2032
- 7.5.1. APAC Generative AI in Insurance Market Analysis by Application: Introduction
- 7.5.2. Market Size Absolute $ Opportunity Analysis and Forecast, By Application, 2016-2032
- 7.5.3. Claims Processing
- 7.5.4. Underwriting
- 7.5.5. Customer Service
- 7.5.6. Fraud Detection
- 7.5.7. Risk Assessment
- 7.5.8. Document Extraction & Classification
- 7.5.9. Others
- 7.6. APAC Generative AI in Insurance Market Analysis, Opportunity and Forecast, By Enterprise Size, 2016-2032
- 7.6.1. APAC Generative AI in Insurance Market Analysis by Enterprise Size: Introduction
- 7.6.2. Market Size Absolute $ Opportunity Analysis and Forecast, By Enterprise Size, 2016-2032
- 7.6.3. Large Enterprises
- 7.6.4. SMEs
- 7.7. APAC Generative AI in Insurance Market Analysis, Opportunity and Forecast, By Country , 2016-2032
- 7.7.1. APAC Generative AI in Insurance Market Analysis by Country : Introduction
- 7.7.2. Market Size Absolute $ Opportunity Analysis and Forecast, Country , 2016-2032
- 7.7.2.1. China
- 7.7.2.2. Japan
- 7.7.2.3. South Korea
- 7.7.2.4. India
- 7.7.2.5. Australia & New Zeland
- 7.7.2.6. Indonesia
- 7.7.2.7. Malaysia
- 7.7.2.8. Philippines
- 7.7.2.9. Singapore
- 7.7.2.10. Thailand
- 7.7.2.11. Vietnam
- 7.7.2.12. Rest of APAC
- 8. Latin America Generative AI in Insurance Market Analysis, Opportunity and Forecast, 2016-2032
- 8.1. Latin America Generative AI in Insurance Market Analysis, 2016-2021
- 8.2. Latin America Generative AI in Insurance Market Opportunity and Forecast, 2023-2032
- 8.3. Latin America Generative AI in Insurance Market Analysis, Opportunity and Forecast, By Component, 2016-2032
- 8.3.1. Latin America Generative AI in Insurance Market Analysis by Component: Introduction
- 8.3.2. Market Size Absolute $ Opportunity Analysis and Forecast, By Component, 2016-2032
- 8.3.3. Solutions
- 8.3.4. Services
- 8.4. Latin America Generative AI in Insurance Market Analysis, Opportunity and Forecast, By Deployment, 2016-2032
- 8.4.1. Latin America Generative AI in Insurance Market Analysis by Deployment: Introduction
- 8.4.2. Market Size Absolute $ Opportunity Analysis and Forecast, By Deployment, 2016-2032
- 8.4.3. On-Premise
- 8.4.4. Cloud-based
- 8.5. Latin America Generative AI in Insurance Market Analysis, Opportunity and Forecast, By Application, 2016-2032
- 8.5.1. Latin America Generative AI in Insurance Market Analysis by Application: Introduction
- 8.5.2. Market Size Absolute $ Opportunity Analysis and Forecast, By Application, 2016-2032
- 8.5.3. Claims Processing
- 8.5.4. Underwriting
- 8.5.5. Customer Service
- 8.5.6. Fraud Detection
- 8.5.7. Risk Assessment
- 8.5.8. Document Extraction & Classification
- 8.5.9. Others
- 8.6. Latin America Generative AI in Insurance Market Analysis, Opportunity and Forecast, By Enterprise Size, 2016-2032
- 8.6.1. Latin America Generative AI in Insurance Market Analysis by Enterprise Size: Introduction
- 8.6.2. Market Size Absolute $ Opportunity Analysis and Forecast, By Enterprise Size, 2016-2032
- 8.6.3. Large Enterprises
- 8.6.4. SMEs
- 8.7. Latin America Generative AI in Insurance Market Analysis, Opportunity and Forecast, By Country , 2016-2032
- 8.7.1. Latin America Generative AI in Insurance Market Analysis by Country : Introduction
- 8.7.2. Market Size Absolute $ Opportunity Analysis and Forecast, Country , 2016-2032
- 8.7.2.1. Brazil
- 8.7.2.2. Colombia
- 8.7.2.3. Chile
- 8.7.2.4. Argentina
- 8.7.2.5. Costa Rica
- 8.7.2.6. Rest of Latin America
- 9. Middle East & Africa Generative AI in Insurance Market Analysis, Opportunity and Forecast, 2016-2032
- 9.1. Middle East & Africa Generative AI in Insurance Market Analysis, 2016-2021
- 9.2. Middle East & Africa Generative AI in Insurance Market Opportunity and Forecast, 2023-2032
- 9.3. Middle East & Africa Generative AI in Insurance Market Analysis, Opportunity and Forecast, By Component, 2016-2032
- 9.3.1. Middle East & Africa Generative AI in Insurance Market Analysis by Component: Introduction
- 9.3.2. Market Size Absolute $ Opportunity Analysis and Forecast, By Component, 2016-2032
- 9.3.3. Solutions
- 9.3.4. Services
- 9.4. Middle East & Africa Generative AI in Insurance Market Analysis, Opportunity and Forecast, By Deployment, 2016-2032
- 9.4.1. Middle East & Africa Generative AI in Insurance Market Analysis by Deployment: Introduction
- 9.4.2. Market Size Absolute $ Opportunity Analysis and Forecast, By Deployment, 2016-2032
- 9.4.3. On-Premise
- 9.4.4. Cloud-based
- 9.5. Middle East & Africa Generative AI in Insurance Market Analysis, Opportunity and Forecast, By Application, 2016-2032
- 9.5.1. Middle East & Africa Generative AI in Insurance Market Analysis by Application: Introduction
- 9.5.2. Market Size Absolute $ Opportunity Analysis and Forecast, By Application, 2016-2032
- 9.5.3. Claims Processing
- 9.5.4. Underwriting
- 9.5.5. Customer Service
- 9.5.6. Fraud Detection
- 9.5.7. Risk Assessment
- 9.5.8. Document Extraction & Classification
- 9.5.9. Others
- 9.6. Middle East & Africa Generative AI in Insurance Market Analysis, Opportunity and Forecast, By Enterprise Size, 2016-2032
- 9.6.1. Middle East & Africa Generative AI in Insurance Market Analysis by Enterprise Size: Introduction
- 9.6.2. Market Size Absolute $ Opportunity Analysis and Forecast, By Enterprise Size, 2016-2032
- 9.6.3. Large Enterprises
- 9.6.4. SMEs
- 9.7. Middle East & Africa Generative AI in Insurance Market Analysis, Opportunity and Forecast, By Country , 2016-2032
- 9.7.1. Middle East & Africa Generative AI in Insurance Market Analysis by Country : Introduction
- 9.7.2. Market Size Absolute $ Opportunity Analysis and Forecast, Country , 2016-2032
- 9.7.2.1. Algeria
- 9.7.2.2. Egypt
- 9.7.2.3. Israel
- 9.7.2.4. Kuwait
- 9.7.2.5. Nigeria
- 9.7.2.6. Saudi Arabia
- 9.7.2.7. South Africa
- 9.7.2.8. Turkey
- 9.7.2.9. The UAE
- 9.7.2.10. Rest of MEA
- 10. Global Generative AI in Insurance Market Analysis, Opportunity and Forecast, By Region , 2016-2032
- 10.1. Global Generative AI in Insurance Market Analysis by Region : Introduction
- 10.2. Market Size Absolute $ Opportunity Analysis and Forecast, By Region , 2016-2032
- 10.2.1. North America
- 10.2.2. Western Europe
- 10.2.3. Eastern Europe
- 10.2.4. APAC
- 10.2.5. Latin America
- 10.2.6. Middle East & Africa
- 11. Global Generative AI in Insurance Market Competitive Landscape, Market Share Analysis, and Company Profiles
- 11.1. Market Share Analysis
- 11.2. Company Profiles
- 11.3. Amazon Web Services, Inc.
- 11.3.1. Company Overview
- 11.3.2. Financial Highlights
- 11.3.3. Product Portfolio
- 11.3.4. SWOT Analysis
- 11.3.5. Key Strategies and Developments
- 11.4. IBM Corporation
- 11.4.1. Company Overview
- 11.4.2. Financial Highlights
- 11.4.3. Product Portfolio
- 11.4.4. SWOT Analysis
- 11.4.5. Key Strategies and Developments
- 11.5. Hexaware
- 11.5.1. Company Overview
- 11.5.2. Financial Highlights
- 11.5.3. Product Portfolio
- 11.5.4. SWOT Analysis
- 11.5.5. Key Strategies and Developments
- 11.6. Shift Technology
- 11.6.1. Company Overview
- 11.6.2. Financial Highlights
- 11.6.3. Product Portfolio
- 11.6.4. SWOT Analysis
- 11.6.5. Key Strategies and Developments
- 11.7. Lemonade
- 11.7.1. Company Overview
- 11.7.2. Financial Highlights
- 11.7.3. Product Portfolio
- 11.7.4. SWOT Analysis
- 11.7.5. Key Strategies and Developments
- 11.8. GEICO
- 11.8.1. Company Overview
- 11.8.2. Financial Highlights
- 11.8.3. Product Portfolio
- 11.8.4. SWOT Analysis
- 11.8.5. Key Strategies and Developments
- 11.9. Sixfold
- 11.9.1. Company Overview
- 11.9.2. Financial Highlights
- 11.9.3. Product Portfolio
- 11.9.4. SWOT Analysis
- 11.9.5. Key Strategies and Developments
- 11.10. Snorkel
- 11.10.1. Company Overview
- 11.10.2. Financial Highlights
- 11.10.3. Product Portfolio
- 11.10.4. SWOT Analysis
- 11.10.5. Key Strategies and Developments
- 11.11. Appian
- 11.11.1. Company Overview
- 11.11.2. Financial Highlights
- 11.11.3. Product Portfolio
- 11.11.4. SWOT Analysis
- 11.11.5. Key Strategies and Developments
- 11.12. Microsoft Corporation
- 11.12.1. Company Overview
- 11.12.2. Financial Highlights
- 11.12.3. Product Portfolio
- 11.12.4. SWOT Analysis
- 11.12.5. Key Strategies and Developments
- 11.13.1. Company Overview
- 11.13.2. Financial Highlights
- 11.13.3. Product Portfolio
- 11.13.4. SWOT Analysis
- 11.13.5. Key Strategies and Developments
- 11.14. Other Key Players
- 11.14.1. Company Overview
- 11.14.2. Financial Highlights
- 11.14.3. Product Portfolio
- 11.14.4. SWOT Analysis
- 11.14.5. Key Strategies and Developments
- 12. Assumptions and Acronyms
- 13. Research Methodology
- 14. Contact
- List of Figures
- Figure 1: Global Generative AI in Insurance Market Revenue (US$ Mn) Market Share by Component in 2022
- Figure 2: Global Generative AI in Insurance Market Attractiveness Analysis by Component, 2016-2032
- Figure 3: Global Generative AI in Insurance Market Revenue (US$ Mn) Market Share by Deploymentin 2022
- Figure 4: Global Generative AI in Insurance Market Attractiveness Analysis by Deployment, 2016-2032
- Figure 5: Global Generative AI in Insurance Market Revenue (US$ Mn) Market Share by Applicationin 2022
- Figure 6: Global Generative AI in Insurance Market Attractiveness Analysis by Application, 2016-2032
- Figure 7: Global Generative AI in Insurance Market Revenue (US$ Mn) Market Share by Enterprise Sizein 2022
- Figure 8: Global Generative AI in Insurance Market Attractiveness Analysis by Enterprise Size, 2016-2032
- Figure 9: Global Generative AI in Insurance Market Revenue (US$ Mn) Market Share by Region in 2022
- Figure 10: Global Generative AI in Insurance Market Attractiveness Analysis by Region, 2016-2032
- Figure 11: Global Generative AI in Insurance Market Revenue (US$ Mn) (2016-2032)
- Figure 12: Global Generative AI in Insurance Market Revenue (US$ Mn) Comparison by Region (2016-2032)
- Figure 13: Global Generative AI in Insurance Market Revenue (US$ Mn) Comparison by Component (2016-2032)
- Figure 14: Global Generative AI in Insurance Market Revenue (US$ Mn) Comparison by Deployment (2016-2032)
- Figure 15: Global Generative AI in Insurance Market Revenue (US$ Mn) Comparison by Application (2016-2032)
- Figure 16: Global Generative AI in Insurance Market Revenue (US$ Mn) Comparison by Enterprise Size (2016-2032)
- Figure 17: Global Generative AI in Insurance Market Y-o-Y Growth Rate Comparison by Region (2016-2032)
- Figure 18: Global Generative AI in Insurance Market Y-o-Y Growth Rate Comparison by Component (2016-2032)
- Figure 19: Global Generative AI in Insurance Market Y-o-Y Growth Rate Comparison by Deployment (2016-2032)
- Figure 20: Global Generative AI in Insurance Market Y-o-Y Growth Rate Comparison by Application (2016-2032)
- Figure 21: Global Generative AI in Insurance Market Y-o-Y Growth Rate Comparison by Enterprise Size (2016-2032)
- Figure 22: Global Generative AI in Insurance Market Share Comparison by Region (2016-2032)
- Figure 23: Global Generative AI in Insurance Market Share Comparison by Component (2016-2032)
- Figure 24: Global Generative AI in Insurance Market Share Comparison by Deployment (2016-2032)
- Figure 25: Global Generative AI in Insurance Market Share Comparison by Application (2016-2032)
- Figure 26: Global Generative AI in Insurance Market Share Comparison by Enterprise Size (2016-2032)
- Figure 27: North America Generative AI in Insurance Market Revenue (US$ Mn) Market Share by Componentin 2022
- Figure 28: North America Generative AI in Insurance Market Attractiveness Analysis by Component, 2016-2032
- Figure 29: North America Generative AI in Insurance Market Revenue (US$ Mn) Market Share by Deploymentin 2022
- Figure 30: North America Generative AI in Insurance Market Attractiveness Analysis by Deployment, 2016-2032
- Figure 31: North America Generative AI in Insurance Market Revenue (US$ Mn) Market Share by Applicationin 2022
- Figure 32: North America Generative AI in Insurance Market Attractiveness Analysis by Application, 2016-2032
- Figure 33: North America Generative AI in Insurance Market Revenue (US$ Mn) Market Share by Enterprise Sizein 2022
- Figure 34: North America Generative AI in Insurance Market Attractiveness Analysis by Enterprise Size, 2016-2032
- Figure 35: North America Generative AI in Insurance Market Revenue (US$ Mn) Market Share by Country in 2022
- Figure 36: North America Generative AI in Insurance Market Attractiveness Analysis by Country, 2016-2032
- Figure 37: North America Generative AI in Insurance Market Revenue (US$ Mn) (2016-2032)
- Figure 38: North America Generative AI in Insurance Market Revenue (US$ Mn) Comparison by Country (2016-2032)
- Figure 39: North America Generative AI in Insurance Market Revenue (US$ Mn) Comparison by Component (2016-2032)
- Figure 40: North America Generative AI in Insurance Market Revenue (US$ Mn) Comparison by Deployment (2016-2032)
- Figure 41: North America Generative AI in Insurance Market Revenue (US$ Mn) Comparison by Application (2016-2032)
- Figure 42: North America Generative AI in Insurance Market Revenue (US$ Mn) Comparison by Enterprise Size (2016-2032)
- Figure 43: North America Generative AI in Insurance Market Y-o-Y Growth Rate Comparison by Country (2016-2032)
- Figure 44: North America Generative AI in Insurance Market Y-o-Y Growth Rate Comparison by Component (2016-2032)
- Figure 45: North America Generative AI in Insurance Market Y-o-Y Growth Rate Comparison by Deployment (2016-2032)
- Figure 46: North America Generative AI in Insurance Market Y-o-Y Growth Rate Comparison by Application (2016-2032)
- Figure 47: North America Generative AI in Insurance Market Y-o-Y Growth Rate Comparison by Enterprise Size (2016-2032)
- Figure 48: North America Generative AI in Insurance Market Share Comparison by Country (2016-2032)
- Figure 49: North America Generative AI in Insurance Market Share Comparison by Component (2016-2032)
- Figure 50: North America Generative AI in Insurance Market Share Comparison by Deployment (2016-2032)
- Figure 51: North America Generative AI in Insurance Market Share Comparison by Application (2016-2032)
- Figure 52: North America Generative AI in Insurance Market Share Comparison by Enterprise Size (2016-2032)
- Figure 53: Western Europe Generative AI in Insurance Market Revenue (US$ Mn) Market Share by Componentin 2022
- Figure 54: Western Europe Generative AI in Insurance Market Attractiveness Analysis by Component, 2016-2032
- Figure 55: Western Europe Generative AI in Insurance Market Revenue (US$ Mn) Market Share by Deploymentin 2022
- Figure 56: Western Europe Generative AI in Insurance Market Attractiveness Analysis by Deployment, 2016-2032
- Figure 57: Western Europe Generative AI in Insurance Market Revenue (US$ Mn) Market Share by Applicationin 2022
- Figure 58: Western Europe Generative AI in Insurance Market Attractiveness Analysis by Application, 2016-2032
- Figure 59: Western Europe Generative AI in Insurance Market Revenue (US$ Mn) Market Share by Enterprise Sizein 2022
- Figure 60: Western Europe Generative AI in Insurance Market Attractiveness Analysis by Enterprise Size, 2016-2032
- Figure 61: Western Europe Generative AI in Insurance Market Revenue (US$ Mn) Market Share by Country in 2022
- Figure 62: Western Europe Generative AI in Insurance Market Attractiveness Analysis by Country, 2016-2032
- Figure 63: Western Europe Generative AI in Insurance Market Revenue (US$ Mn) (2016-2032)
- Figure 64: Western Europe Generative AI in Insurance Market Revenue (US$ Mn) Comparison by Country (2016-2032)
- Figure 65: Western Europe Generative AI in Insurance Market Revenue (US$ Mn) Comparison by Component (2016-2032)
- Figure 66: Western Europe Generative AI in Insurance Market Revenue (US$ Mn) Comparison by Deployment (2016-2032)
- Figure 67: Western Europe Generative AI in Insurance Market Revenue (US$ Mn) Comparison by Application (2016-2032)
- Figure 68: Western Europe Generative AI in Insurance Market Revenue (US$ Mn) Comparison by Enterprise Size (2016-2032)
- Figure 69: Western Europe Generative AI in Insurance Market Y-o-Y Growth Rate Comparison by Country (2016-2032)
- Figure 70: Western Europe Generative AI in Insurance Market Y-o-Y Growth Rate Comparison by Component (2016-2032)
- Figure 71: Western Europe Generative AI in Insurance Market Y-o-Y Growth Rate Comparison by Deployment (2016-2032)
- Figure 72: Western Europe Generative AI in Insurance Market Y-o-Y Growth Rate Comparison by Application (2016-2032)
- Figure 73: Western Europe Generative AI in Insurance Market Y-o-Y Growth Rate Comparison by Enterprise Size (2016-2032)
- Figure 74: Western Europe Generative AI in Insurance Market Share Comparison by Country (2016-2032)
- Figure 75: Western Europe Generative AI in Insurance Market Share Comparison by Component (2016-2032)
- Figure 76: Western Europe Generative AI in Insurance Market Share Comparison by Deployment (2016-2032)
- Figure 77: Western Europe Generative AI in Insurance Market Share Comparison by Application (2016-2032)
- Figure 78: Western Europe Generative AI in Insurance Market Share Comparison by Enterprise Size (2016-2032)
- Figure 79: Eastern Europe Generative AI in Insurance Market Revenue (US$ Mn) Market Share by Componentin 2022
- Figure 80: Eastern Europe Generative AI in Insurance Market Attractiveness Analysis by Component, 2016-2032
- Figure 81: Eastern Europe Generative AI in Insurance Market Revenue (US$ Mn) Market Share by Deploymentin 2022
- Figure 82: Eastern Europe Generative AI in Insurance Market Attractiveness Analysis by Deployment, 2016-2032
- Figure 83: Eastern Europe Generative AI in Insurance Market Revenue (US$ Mn) Market Share by Applicationin 2022
- Figure 84: Eastern Europe Generative AI in Insurance Market Attractiveness Analysis by Application, 2016-2032
- Figure 85: Eastern Europe Generative AI in Insurance Market Revenue (US$ Mn) Market Share by Enterprise Sizein 2022
- Figure 86: Eastern Europe Generative AI in Insurance Market Attractiveness Analysis by Enterprise Size, 2016-2032
- Figure 87: Eastern Europe Generative AI in Insurance Market Revenue (US$ Mn) Market Share by Country in 2022
- Figure 88: Eastern Europe Generative AI in Insurance Market Attractiveness Analysis by Country, 2016-2032
- Figure 89: Eastern Europe Generative AI in Insurance Market Revenue (US$ Mn) (2016-2032)
- Figure 90: Eastern Europe Generative AI in Insurance Market Revenue (US$ Mn) Comparison by Country (2016-2032)
- Figure 91: Eastern Europe Generative AI in Insurance Market Revenue (US$ Mn) Comparison by Component (2016-2032)
- Figure 92: Eastern Europe Generative AI in Insurance Market Revenue (US$ Mn) Comparison by Deployment (2016-2032)
- Figure 93: Eastern Europe Generative AI in Insurance Market Revenue (US$ Mn) Comparison by Application (2016-2032)
- Figure 94: Eastern Europe Generative AI in Insurance Market Revenue (US$ Mn) Comparison by Enterprise Size (2016-2032)
- Figure 95: Eastern Europe Generative AI in Insurance Market Y-o-Y Growth Rate Comparison by Country (2016-2032)
- Figure 96: Eastern Europe Generative AI in Insurance Market Y-o-Y Growth Rate Comparison by Component (2016-2032)
- Figure 97: Eastern Europe Generative AI in Insurance Market Y-o-Y Growth Rate Comparison by Deployment (2016-2032)
- Figure 98: Eastern Europe Generative AI in Insurance Market Y-o-Y Growth Rate Comparison by Application (2016-2032)
- Figure 99: Eastern Europe Generative AI in Insurance Market Y-o-Y Growth Rate Comparison by Enterprise Size (2016-2032)
- Figure 100: Eastern Europe Generative AI in Insurance Market Share Comparison by Country (2016-2032)
- Figure 101: Eastern Europe Generative AI in Insurance Market Share Comparison by Component (2016-2032)
- Figure 102: Eastern Europe Generative AI in Insurance Market Share Comparison by Deployment (2016-2032)
- Figure 103: Eastern Europe Generative AI in Insurance Market Share Comparison by Application (2016-2032)
- Figure 104: Eastern Europe Generative AI in Insurance Market Share Comparison by Enterprise Size (2016-2032)
- Figure 105: APAC Generative AI in Insurance Market Revenue (US$ Mn) Market Share by Componentin 2022
- Figure 106: APAC Generative AI in Insurance Market Attractiveness Analysis by Component, 2016-2032
- Figure 107: APAC Generative AI in Insurance Market Revenue (US$ Mn) Market Share by Deploymentin 2022
- Figure 108: APAC Generative AI in Insurance Market Attractiveness Analysis by Deployment, 2016-2032
- Figure 109: APAC Generative AI in Insurance Market Revenue (US$ Mn) Market Share by Applicationin 2022
- Figure 110: APAC Generative AI in Insurance Market Attractiveness Analysis by Application, 2016-2032
- Figure 111: APAC Generative AI in Insurance Market Revenue (US$ Mn) Market Share by Enterprise Sizein 2022
- Figure 112: APAC Generative AI in Insurance Market Attractiveness Analysis by Enterprise Size, 2016-2032
- Figure 113: APAC Generative AI in Insurance Market Revenue (US$ Mn) Market Share by Country in 2022
- Figure 114: APAC Generative AI in Insurance Market Attractiveness Analysis by Country, 2016-2032
- Figure 115: APAC Generative AI in Insurance Market Revenue (US$ Mn) (2016-2032)
- Figure 116: APAC Generative AI in Insurance Market Revenue (US$ Mn) Comparison by Country (2016-2032)
- Figure 117: APAC Generative AI in Insurance Market Revenue (US$ Mn) Comparison by Component (2016-2032)
- Figure 118: APAC Generative AI in Insurance Market Revenue (US$ Mn) Comparison by Deployment (2016-2032)
- Figure 119: APAC Generative AI in Insurance Market Revenue (US$ Mn) Comparison by Application (2016-2032)
- Figure 120: APAC Generative AI in Insurance Market Revenue (US$ Mn) Comparison by Enterprise Size (2016-2032)
- Figure 121: APAC Generative AI in Insurance Market Y-o-Y Growth Rate Comparison by Country (2016-2032)
- Figure 122: APAC Generative AI in Insurance Market Y-o-Y Growth Rate Comparison by Component (2016-2032)
- Figure 123: APAC Generative AI in Insurance Market Y-o-Y Growth Rate Comparison by Deployment (2016-2032)
- Figure 124: APAC Generative AI in Insurance Market Y-o-Y Growth Rate Comparison by Application (2016-2032)
- Figure 125: APAC Generative AI in Insurance Market Y-o-Y Growth Rate Comparison by Enterprise Size (2016-2032)
- Figure 126: APAC Generative AI in Insurance Market Share Comparison by Country (2016-2032)
- Figure 127: APAC Generative AI in Insurance Market Share Comparison by Component (2016-2032)
- Figure 128: APAC Generative AI in Insurance Market Share Comparison by Deployment (2016-2032)
- Figure 129: APAC Generative AI in Insurance Market Share Comparison by Application (2016-2032)
- Figure 130: APAC Generative AI in Insurance Market Share Comparison by Enterprise Size (2016-2032)
- Figure 131: Latin America Generative AI in Insurance Market Revenue (US$ Mn) Market Share by Componentin 2022
- Figure 132: Latin America Generative AI in Insurance Market Attractiveness Analysis by Component, 2016-2032
- Figure 133: Latin America Generative AI in Insurance Market Revenue (US$ Mn) Market Share by Deploymentin 2022
- Figure 134: Latin America Generative AI in Insurance Market Attractiveness Analysis by Deployment, 2016-2032
- Figure 135: Latin America Generative AI in Insurance Market Revenue (US$ Mn) Market Share by Applicationin 2022
- Figure 136: Latin America Generative AI in Insurance Market Attractiveness Analysis by Application, 2016-2032
- Figure 137: Latin America Generative AI in Insurance Market Revenue (US$ Mn) Market Share by Enterprise Sizein 2022
- Figure 138: Latin America Generative AI in Insurance Market Attractiveness Analysis by Enterprise Size, 2016-2032
- Figure 139: Latin America Generative AI in Insurance Market Revenue (US$ Mn) Market Share by Country in 2022
- Figure 140: Latin America Generative AI in Insurance Market Attractiveness Analysis by Country, 2016-2032
- Figure 141: Latin America Generative AI in Insurance Market Revenue (US$ Mn) (2016-2032)
- Figure 142: Latin America Generative AI in Insurance Market Revenue (US$ Mn) Comparison by Country (2016-2032)
- Figure 143: Latin America Generative AI in Insurance Market Revenue (US$ Mn) Comparison by Component (2016-2032)
- Figure 144: Latin America Generative AI in Insurance Market Revenue (US$ Mn) Comparison by Deployment (2016-2032)
- Figure 145: Latin America Generative AI in Insurance Market Revenue (US$ Mn) Comparison by Application (2016-2032)
- Figure 146: Latin America Generative AI in Insurance Market Revenue (US$ Mn) Comparison by Enterprise Size (2016-2032)
- Figure 147: Latin America Generative AI in Insurance Market Y-o-Y Growth Rate Comparison by Country (2016-2032)
- Figure 148: Latin America Generative AI in Insurance Market Y-o-Y Growth Rate Comparison by Component (2016-2032)
- Figure 149: Latin America Generative AI in Insurance Market Y-o-Y Growth Rate Comparison by Deployment (2016-2032)
- Figure 150: Latin America Generative AI in Insurance Market Y-o-Y Growth Rate Comparison by Application (2016-2032)
- Figure 151: Latin America Generative AI in Insurance Market Y-o-Y Growth Rate Comparison by Enterprise Size (2016-2032)
- Figure 152: Latin America Generative AI in Insurance Market Share Comparison by Country (2016-2032)
- Figure 153: Latin America Generative AI in Insurance Market Share Comparison by Component (2016-2032)
- Figure 154: Latin America Generative AI in Insurance Market Share Comparison by Deployment (2016-2032)
- Figure 155: Latin America Generative AI in Insurance Market Share Comparison by Application (2016-2032)
- Figure 156: Latin America Generative AI in Insurance Market Share Comparison by Enterprise Size (2016-2032)
- Figure 157: Middle East & Africa Generative AI in Insurance Market Revenue (US$ Mn) Market Share by Componentin 2022
- Figure 158: Middle East & Africa Generative AI in Insurance Market Attractiveness Analysis by Component, 2016-2032
- Figure 159: Middle East & Africa Generative AI in Insurance Market Revenue (US$ Mn) Market Share by Deploymentin 2022
- Figure 160: Middle East & Africa Generative AI in Insurance Market Attractiveness Analysis by Deployment, 2016-2032
- Figure 161: Middle East & Africa Generative AI in Insurance Market Revenue (US$ Mn) Market Share by Applicationin 2022
- Figure 162: Middle East & Africa Generative AI in Insurance Market Attractiveness Analysis by Application, 2016-2032
- Figure 163: Middle East & Africa Generative AI in Insurance Market Revenue (US$ Mn) Market Share by Enterprise Sizein 2022
- Figure 164: Middle East & Africa Generative AI in Insurance Market Attractiveness Analysis by Enterprise Size, 2016-2032
- Figure 165: Middle East & Africa Generative AI in Insurance Market Revenue (US$ Mn) Market Share by Country in 2022
- Figure 166: Middle East & Africa Generative AI in Insurance Market Attractiveness Analysis by Country, 2016-2032
- Figure 167: Middle East & Africa Generative AI in Insurance Market Revenue (US$ Mn) (2016-2032)
- Figure 168: Middle East & Africa Generative AI in Insurance Market Revenue (US$ Mn) Comparison by Country (2016-2032)
- Figure 169: Middle East & Africa Generative AI in Insurance Market Revenue (US$ Mn) Comparison by Component (2016-2032)
- Figure 170: Middle East & Africa Generative AI in Insurance Market Revenue (US$ Mn) Comparison by Deployment (2016-2032)
- Figure 171: Middle East & Africa Generative AI in Insurance Market Revenue (US$ Mn) Comparison by Application (2016-2032)
- Figure 172: Middle East & Africa Generative AI in Insurance Market Revenue (US$ Mn) Comparison by Enterprise Size (2016-2032)
- Figure 173: Middle East & Africa Generative AI in Insurance Market Y-o-Y Growth Rate Comparison by Country (2016-2032)
- Figure 174: Middle East & Africa Generative AI in Insurance Market Y-o-Y Growth Rate Comparison by Component (2016-2032)
- Figure 175: Middle East & Africa Generative AI in Insurance Market Y-o-Y Growth Rate Comparison by Deployment (2016-2032)
- Figure 176: Middle East & Africa Generative AI in Insurance Market Y-o-Y Growth Rate Comparison by Application (2016-2032)
- Figure 177: Middle East & Africa Generative AI in Insurance Market Y-o-Y Growth Rate Comparison by Enterprise Size (2016-2032)
- Figure 178: Middle East & Africa Generative AI in Insurance Market Share Comparison by Country (2016-2032)
- Figure 179: Middle East & Africa Generative AI in Insurance Market Share Comparison by Component (2016-2032)
- Figure 180: Middle East & Africa Generative AI in Insurance Market Share Comparison by Deployment (2016-2032)
- Figure 181: Middle East & Africa Generative AI in Insurance Market Share Comparison by Application (2016-2032)
- Figure 182: Middle East & Africa Generative AI in Insurance Market Share Comparison by Enterprise Size (2016-2032)
- List of Tables
- Table 1: Global Generative AI in Insurance Market Comparison by Component (2016-2032)
- Table 2: Global Generative AI in Insurance Market Comparison by Deployment (2016-2032)
- Table 3: Global Generative AI in Insurance Market Comparison by Application (2016-2032)
- Table 4: Global Generative AI in Insurance Market Comparison by Enterprise Size (2016-2032)
- Table 5: Global Generative AI in Insurance Market Revenue (US$ Mn) Comparison by Region (2016-2032)
- Table 6: Global Generative AI in Insurance Market Revenue (US$ Mn) (2016-2032)
- Table 7: Global Generative AI in Insurance Market Revenue (US$ Mn) Comparison by Region (2016-2032)
- Table 8: Global Generative AI in Insurance Market Revenue (US$ Mn) Comparison by Component (2016-2032)
- Table 9: Global Generative AI in Insurance Market Revenue (US$ Mn) Comparison by Deployment (2016-2032)
- Table 10: Global Generative AI in Insurance Market Revenue (US$ Mn) Comparison by Application (2016-2032)
- Table 11: Global Generative AI in Insurance Market Revenue (US$ Mn) Comparison by Enterprise Size (2016-2032)
- Table 12: Global Generative AI in Insurance Market Y-o-Y Growth Rate Comparison by Region (2016-2032)
- Table 13: Global Generative AI in Insurance Market Y-o-Y Growth Rate Comparison by Component (2016-2032)
- Table 14: Global Generative AI in Insurance Market Y-o-Y Growth Rate Comparison by Deployment (2016-2032)
- Table 15: Global Generative AI in Insurance Market Y-o-Y Growth Rate Comparison by Application (2016-2032)
- Table 16: Global Generative AI in Insurance Market Y-o-Y Growth Rate Comparison by Enterprise Size (2016-2032)
- Table 17: Global Generative AI in Insurance Market Share Comparison by Region (2016-2032)
- Table 18: Global Generative AI in Insurance Market Share Comparison by Component (2016-2032)
- Table 19: Global Generative AI in Insurance Market Share Comparison by Deployment (2016-2032)
- Table 20: Global Generative AI in Insurance Market Share Comparison by Application (2016-2032)
- Table 21: Global Generative AI in Insurance Market Share Comparison by Enterprise Size (2016-2032)
- Table 22: North America Generative AI in Insurance Market Comparison by Deployment (2016-2032)
- Table 23: North America Generative AI in Insurance Market Comparison by Application (2016-2032)
- Table 24: North America Generative AI in Insurance Market Comparison by Enterprise Size (2016-2032)
- Table 25: North America Generative AI in Insurance Market Revenue (US$ Mn) Comparison by Country (2016-2032)
- Table 26: North America Generative AI in Insurance Market Revenue (US$ Mn) (2016-2032)
- Table 27: North America Generative AI in Insurance Market Revenue (US$ Mn) Comparison by Country (2016-2032)
- Table 28: North America Generative AI in Insurance Market Revenue (US$ Mn) Comparison by Component (2016-2032)
- Table 29: North America Generative AI in Insurance Market Revenue (US$ Mn) Comparison by Deployment (2016-2032)
- Table 30: North America Generative AI in Insurance Market Revenue (US$ Mn) Comparison by Application (2016-2032)
- Table 31: North America Generative AI in Insurance Market Revenue (US$ Mn) Comparison by Enterprise Size (2016-2032)
- Table 32: North America Generative AI in Insurance Market Y-o-Y Growth Rate Comparison by Country (2016-2032)
- Table 33: North America Generative AI in Insurance Market Y-o-Y Growth Rate Comparison by Component (2016-2032)
- Table 34: North America Generative AI in Insurance Market Y-o-Y Growth Rate Comparison by Deployment (2016-2032)
- Table 35: North America Generative AI in Insurance Market Y-o-Y Growth Rate Comparison by Application (2016-2032)
- Table 36: North America Generative AI in Insurance Market Y-o-Y Growth Rate Comparison by Enterprise Size (2016-2032)
- Table 37: North America Generative AI in Insurance Market Share Comparison by Country (2016-2032)
- Table 38: North America Generative AI in Insurance Market Share Comparison by Component (2016-2032)
- Table 39: North America Generative AI in Insurance Market Share Comparison by Deployment (2016-2032)
- Table 40: North America Generative AI in Insurance Market Share Comparison by Application (2016-2032)
- Table 41: North America Generative AI in Insurance Market Share Comparison by Enterprise Size (2016-2032)
- Table 42: Western Europe Generative AI in Insurance Market Comparison by Component (2016-2032)
- Table 43: Western Europe Generative AI in Insurance Market Comparison by Deployment (2016-2032)
- Table 44: Western Europe Generative AI in Insurance Market Comparison by Application (2016-2032)
- Table 45: Western Europe Generative AI in Insurance Market Comparison by Enterprise Size (2016-2032)
- Table 46: Western Europe Generative AI in Insurance Market Revenue (US$ Mn) Comparison by Country (2016-2032)
- Table 47: Western Europe Generative AI in Insurance Market Revenue (US$ Mn) (2016-2032)
- Table 48: Western Europe Generative AI in Insurance Market Revenue (US$ Mn) Comparison by Country (2016-2032)
- Table 49: Western Europe Generative AI in Insurance Market Revenue (US$ Mn) Comparison by Component (2016-2032)
- Table 50: Western Europe Generative AI in Insurance Market Revenue (US$ Mn) Comparison by Deployment (2016-2032)
- Table 51: Western Europe Generative AI in Insurance Market Revenue (US$ Mn) Comparison by Application (2016-2032)
- Table 52: Western Europe Generative AI in Insurance Market Revenue (US$ Mn) Comparison by Enterprise Size (2016-2032)
- Table 53: Western Europe Generative AI in Insurance Market Y-o-Y Growth Rate Comparison by Country (2016-2032)
- Table 54: Western Europe Generative AI in Insurance Market Y-o-Y Growth Rate Comparison by Component (2016-2032)
- Table 55: Western Europe Generative AI in Insurance Market Y-o-Y Growth Rate Comparison by Deployment (2016-2032)
- Table 56: Western Europe Generative AI in Insurance Market Y-o-Y Growth Rate Comparison by Application (2016-2032)
- Table 57: Western Europe Generative AI in Insurance Market Y-o-Y Growth Rate Comparison by Enterprise Size (2016-2032)
- Table 58: Western Europe Generative AI in Insurance Market Share Comparison by Country (2016-2032)
- Table 59: Western Europe Generative AI in Insurance Market Share Comparison by Component (2016-2032)
- Table 60: Western Europe Generative AI in Insurance Market Share Comparison by Deployment (2016-2032)
- Table 61: Western Europe Generative AI in Insurance Market Share Comparison by Application (2016-2032)
- Table 62: Western Europe Generative AI in Insurance Market Share Comparison by Enterprise Size (2016-2032)
- Table 63: Eastern Europe Generative AI in Insurance Market Comparison by Component (2016-2032)
- Table 64: Eastern Europe Generative AI in Insurance Market Comparison by Deployment (2016-2032)
- Table 65: Eastern Europe Generative AI in Insurance Market Comparison by Application (2016-2032)
- Table 66: Eastern Europe Generative AI in Insurance Market Comparison by Enterprise Size (2016-2032)
- Table 67: Eastern Europe Generative AI in Insurance Market Revenue (US$ Mn) Comparison by Country (2016-2032)
- Table 68: Eastern Europe Generative AI in Insurance Market Revenue (US$ Mn) (2016-2032)
- Table 69: Eastern Europe Generative AI in Insurance Market Revenue (US$ Mn) Comparison by Country (2016-2032)
- Table 70: Eastern Europe Generative AI in Insurance Market Revenue (US$ Mn) Comparison by Component (2016-2032)
- Table 71: Eastern Europe Generative AI in Insurance Market Revenue (US$ Mn) Comparison by Deployment (2016-2032)
- Table 72: Eastern Europe Generative AI in Insurance Market Revenue (US$ Mn) Comparison by Application (2016-2032)
- Table 73: Eastern Europe Generative AI in Insurance Market Revenue (US$ Mn) Comparison by Enterprise Size (2016-2032)
- Table 74: Eastern Europe Generative AI in Insurance Market Y-o-Y Growth Rate Comparison by Country (2016-2032)
- Table 75: Eastern Europe Generative AI in Insurance Market Y-o-Y Growth Rate Comparison by Component (2016-2032)
- Table 76: Eastern Europe Generative AI in Insurance Market Y-o-Y Growth Rate Comparison by Deployment (2016-2032)
- Table 77: Eastern Europe Generative AI in Insurance Market Y-o-Y Growth Rate Comparison by Application (2016-2032)
- Table 78: Eastern Europe Generative AI in Insurance Market Y-o-Y Growth Rate Comparison by Enterprise Size (2016-2032)
- Table 79: Eastern Europe Generative AI in Insurance Market Share Comparison by Country (2016-2032)
- Table 80: Eastern Europe Generative AI in Insurance Market Share Comparison by Component (2016-2032)
- Table 81: Eastern Europe Generative AI in Insurance Market Share Comparison by Deployment (2016-2032)
- Table 82: Eastern Europe Generative AI in Insurance Market Share Comparison by Application (2016-2032)
- Table 83: Eastern Europe Generative AI in Insurance Market Share Comparison by Enterprise Size (2016-2032)
- Table 84: APAC Generative AI in Insurance Market Comparison by Component (2016-2032)
- Table 85: APAC Generative AI in Insurance Market Comparison by Deployment (2016-2032)
- Table 86: APAC Generative AI in Insurance Market Comparison by Application (2016-2032)
- Table 87: APAC Generative AI in Insurance Market Comparison by Enterprise Size (2016-2032)
- Table 88: APAC Generative AI in Insurance Market Revenue (US$ Mn) Comparison by Country (2016-2032)
- Table 89: APAC Generative AI in Insurance Market Revenue (US$ Mn) (2016-2032)
- Table 90: APAC Generative AI in Insurance Market Revenue (US$ Mn) Comparison by Country (2016-2032)
- Table 91: APAC Generative AI in Insurance Market Revenue (US$ Mn) Comparison by Component (2016-2032)
- Table 92: APAC Generative AI in Insurance Market Revenue (US$ Mn) Comparison by Deployment (2016-2032)
- Table 93: APAC Generative AI in Insurance Market Revenue (US$ Mn) Comparison by Application (2016-2032)
- Table 94: APAC Generative AI in Insurance Market Revenue (US$ Mn) Comparison by Enterprise Size (2016-2032)
- Table 95: APAC Generative AI in Insurance Market Y-o-Y Growth Rate Comparison by Country (2016-2032)
- Table 96: APAC Generative AI in Insurance Market Y-o-Y Growth Rate Comparison by Component (2016-2032)
- Table 97: APAC Generative AI in Insurance Market Y-o-Y Growth Rate Comparison by Deployment (2016-2032)
- Table 98: APAC Generative AI in Insurance Market Y-o-Y Growth Rate Comparison by Application (2016-2032)
- Table 99: APAC Generative AI in Insurance Market Y-o-Y Growth Rate Comparison by Enterprise Size (2016-2032)
- Table 100: APAC Generative AI in Insurance Market Share Comparison by Country (2016-2032)
- Table 101: APAC Generative AI in Insurance Market Share Comparison by Component (2016-2032)
- Table 102: APAC Generative AI in Insurance Market Share Comparison by Deployment (2016-2032)
- Table 103: APAC Generative AI in Insurance Market Share Comparison by Application (2016-2032)
- Table 104: APAC Generative AI in Insurance Market Share Comparison by Enterprise Size (2016-2032)
- Table 105: Latin America Generative AI in Insurance Market Comparison by Component (2016-2032)
- Table 106: Latin America Generative AI in Insurance Market Comparison by Deployment (2016-2032)
- Table 107: Latin America Generative AI in Insurance Market Comparison by Application (2016-2032)
- Table 108: Latin America Generative AI in Insurance Market Comparison by Enterprise Size (2016-2032)
- Table 109: Latin America Generative AI in Insurance Market Revenue (US$ Mn) Comparison by Country (2016-2032)
- Table 110: Latin America Generative AI in Insurance Market Revenue (US$ Mn) (2016-2032)
- Table 111: Latin America Generative AI in Insurance Market Revenue (US$ Mn) Comparison by Country (2016-2032)
- Table 112: Latin America Generative AI in Insurance Market Revenue (US$ Mn) Comparison by Component (2016-2032)
- Table 113: Latin America Generative AI in Insurance Market Revenue (US$ Mn) Comparison by Deployment (2016-2032)
- Table 114: Latin America Generative AI in Insurance Market Revenue (US$ Mn) Comparison by Application (2016-2032)
- Table 115: Latin America Generative AI in Insurance Market Revenue (US$ Mn) Comparison by Enterprise Size (2016-2032)
- Table 116: Latin America Generative AI in Insurance Market Y-o-Y Growth Rate Comparison by Country (2016-2032)
- Table 117: Latin America Generative AI in Insurance Market Y-o-Y Growth Rate Comparison by Component (2016-2032)
- Table 118: Latin America Generative AI in Insurance Market Y-o-Y Growth Rate Comparison by Deployment (2016-2032)
- Table 119: Latin America Generative AI in Insurance Market Y-o-Y Growth Rate Comparison by Application (2016-2032)
- Table 120: Latin America Generative AI in Insurance Market Y-o-Y Growth Rate Comparison by Enterprise Size (2016-2032)
- Table 121: Latin America Generative AI in Insurance Market Share Comparison by Country (2016-2032)
- Table 122: Latin America Generative AI in Insurance Market Share Comparison by Component (2016-2032)
- Table 123: Latin America Generative AI in Insurance Market Share Comparison by Deployment (2016-2032)
- Table 124: Latin America Generative AI in Insurance Market Share Comparison by Application (2016-2032)
- Table 125: Latin America Generative AI in Insurance Market Share Comparison by Enterprise Size (2016-2032)
- Table 126: Middle East & Africa Generative AI in Insurance Market Comparison by Component (2016-2032)
- Table 127: Middle East & Africa Generative AI in Insurance Market Comparison by Deployment (2016-2032)
- Table 128: Middle East & Africa Generative AI in Insurance Market Comparison by Application (2016-2032)
- Table 129: Middle East & Africa Generative AI in Insurance Market Comparison by Enterprise Size (2016-2032)
- Table 130: Middle East & Africa Generative AI in Insurance Market Revenue (US$ Mn) Comparison by Country (2016-2032)
- Table 131: Middle East & Africa Generative AI in Insurance Market Revenue (US$ Mn) (2016-2032)
- Table 132: Middle East & Africa Generative AI in Insurance Market Revenue (US$ Mn) Comparison by Country (2016-2032)
- Table 133: Middle East & Africa Generative AI in Insurance Market Revenue (US$ Mn) Comparison by Component (2016-2032)
- Table 134: Middle East & Africa Generative AI in Insurance Market Revenue (US$ Mn) Comparison by Deployment (2016-2032)
- Table 135: Middle East & Africa Generative AI in Insurance Market Revenue (US$ Mn) Comparison by Application (2016-2032)
- Table 136: Middle East & Africa Generative AI in Insurance Market Revenue (US$ Mn) Comparison by Enterprise Size (2016-2032)
- Table 137: Middle East & Africa Generative AI in Insurance Market Y-o-Y Growth Rate Comparison by Country (2016-2032)
- Table 138: Middle East & Africa Generative AI in Insurance Market Y-o-Y Growth Rate Comparison by Component (2016-2032)
- Table 139: Middle East & Africa Generative AI in Insurance Market Y-o-Y Growth Rate Comparison by Deployment (2016-2032)
- Table 140: Middle East & Africa Generative AI in Insurance Market Y-o-Y Growth Rate Comparison by Application (2016-2032)
- Table 141: Middle East & Africa Generative AI in Insurance Market Y-o-Y Growth Rate Comparison by Enterprise Size (2016-2032)
- Table 142: Middle East & Africa Generative AI in Insurance Market Share Comparison by Country (2016-2032)
- Table 143: Middle East & Africa Generative AI in Insurance Market Share Comparison by Component (2016-2032)
- Table 144: Middle East & Africa Generative AI in Insurance Market Share Comparison by Deployment (2016-2032)
- Table 145: Middle East & Africa Generative AI in Insurance Market Share Comparison by Application (2016-2032)
- Table 146: Middle East & Africa Generative AI in Insurance Market Share Comparison by Enterprise Size (2016-2032)
- 1. Executive Summary
-
- Amazon Web Services, Inc.
- IBM Corporation
- Hexaware
- Shift Technology
- Lemonade
- GEICO
- Sixfold
- Snorkel
- Appian
- Microsoft Corporation
- Other Key Players
Our Clients


View Our Licence Options
