
Generative AI in FP&A Market Report By Deployment Mode (Cloud, On-premises), By Organization Size (Small and Medium Enterprises (SMEs), Large Enterprises), By Application (Budgeting and Forecasting, Financial Reporting, Others), By Region and Companies - Industry Segment Outlook, Market Assessment, Competition Scenario, Trends and Forecast 2024-2033
-
43412
-
Feb 2024
-
130
-


-
This report was compiled by Vishwa Gaul Vishwa is an experienced market research and consulting professional with over 8 years of expertise in the ICT industry, contributing to over 700 reports across telecommunications, software, hardware, and digital solutions. Correspondence Team Lead- ICT Linkedin | Detailed Market research Methodology Our methodology involves a mix of primary research, including interviews with leading mental health experts, and secondary research from reputable medical journals and databases. View Detailed Methodology Page
-
Quick Navigation
Report Overview
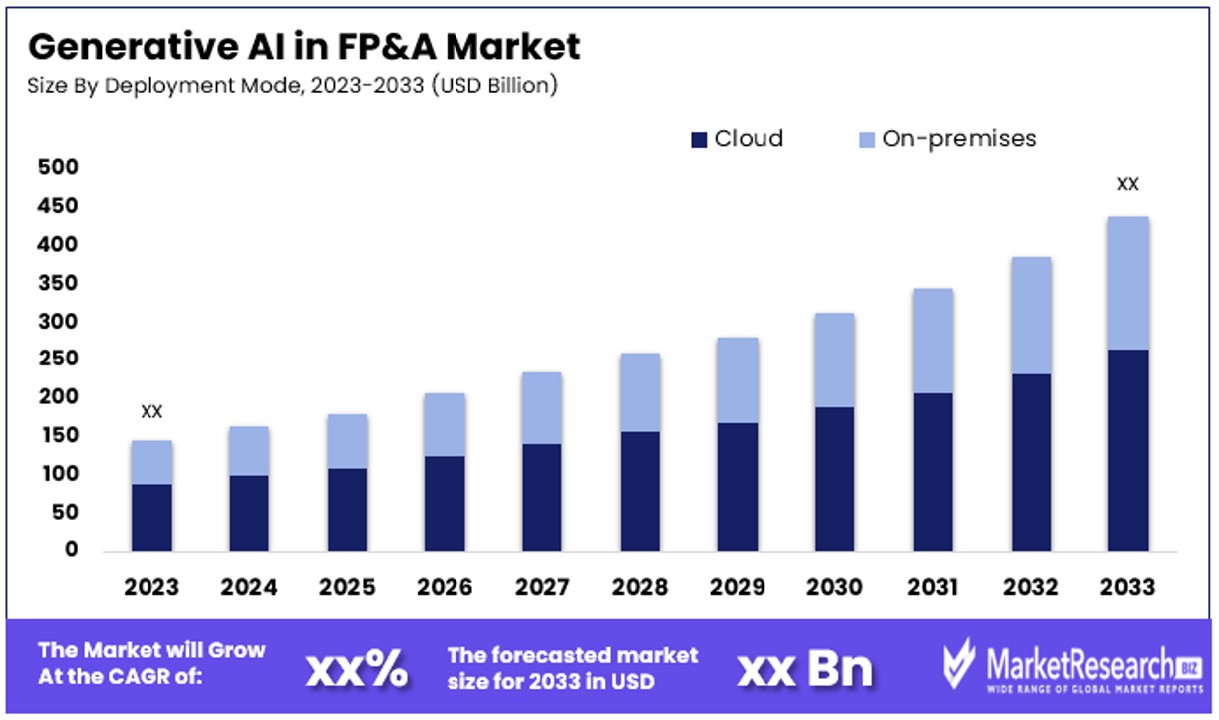
The Global Generative AI in FP&A Market size is expected to be worth around USD xx Billion by 2033, from USD xx Billion in 2023, growing at a CAGR of xx% during the forecast period from 2024 to 2033.
Generative AI in the Financial Planning & Analysis (FP&A) market refers to the application of advanced artificial intelligence technologies that can generate predictive models, financial forecasts, and analytical reports autonomously.
This market segment is revolutionizing how businesses strategize, plan, and make financial decisions by leveraging machine learning algorithms to simulate financial outcomes, optimize budget allocations, and enhance scenario planning.
Generative AI in Financial Planning & Analysis (FP&A) market reveals a sector on the cusp of substantial growth and transformation. Insights derived from a study indicate a strong momentum within the financial leadership community,
It mentioned that 80% of CFOs in 2022 planned to increase their AI investments in the next two years. This reflects a strategic pivot towards leveraging AI to enhance financial forecasting, planning, and decision-making processes.
Further emphasizing the sector's potential, a recent KPMG survey conducted between March and June 2023 shows a significant shift towards generative AI adoption among financial services leaders. With two-thirds of respondents (66%) considering its integration into their operations.
This survey not only highlights generative AI's impact on software development but also its broader implications for the financial services industry. This trend suggests a growing recognition of generative AI's ability to revolutionize traditional financial planning and analysis by offering more accurate forecasts, automating routine tasks, and providing deeper analytical insights.
Investing in generative AI technologies is becoming increasingly essential. Not only does it promise to streamline operations and enhance efficiency, but it also positions organizations to navigate the complexities of the financial landscape with greater agility and informed confidence.
Key Takeaways
- Market Value and Growth Projection: The Global Generative AI in FP&A Market is projected to reach around USD xx by 2033, growing at a CAGR of xx% during 2024-2033.
- Dominant Segments:
- Deployment Mode: Cloud deployment dominates due to scalability, flexibility, and cost-efficiency, while on-premises solutions remain crucial for industries with stringent data security regulations.
- Organization Size: Large enterprises lead in adopting Generative AI due to the scale and complexity of financial operations, while SMEs show potential for growth, leveraging cloud-based solutions.
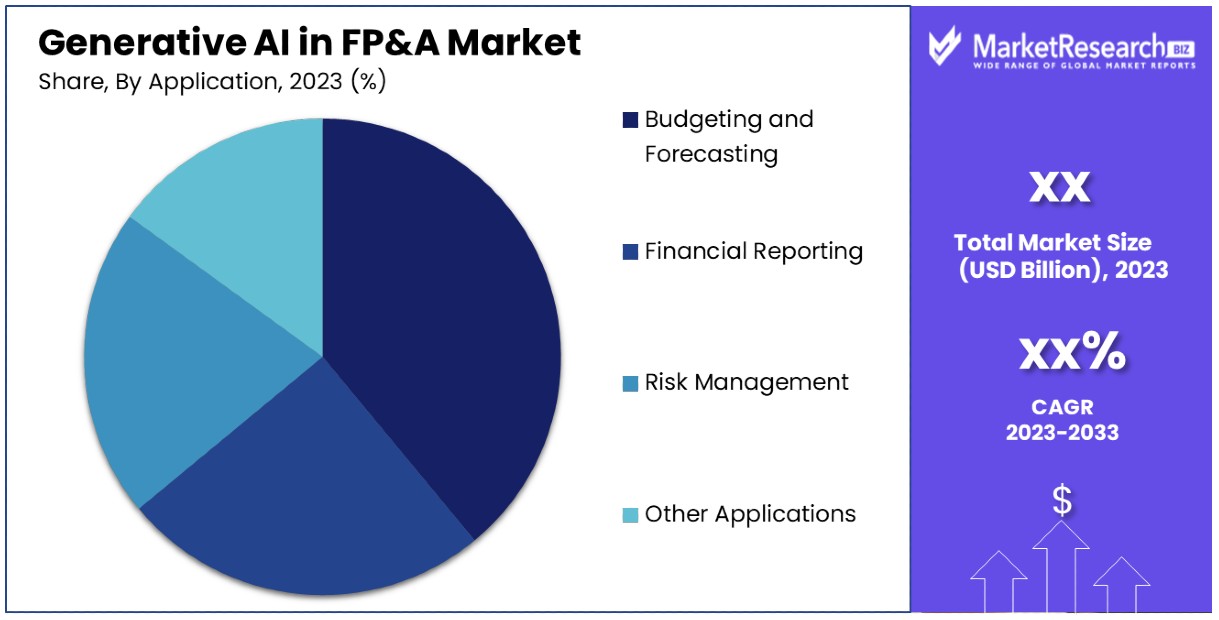
- Application: Budgeting and Forecasting stand out as the dominant application sub-segment, facilitating accurate predictions and resource allocation decisions.
- Regional Analysis:
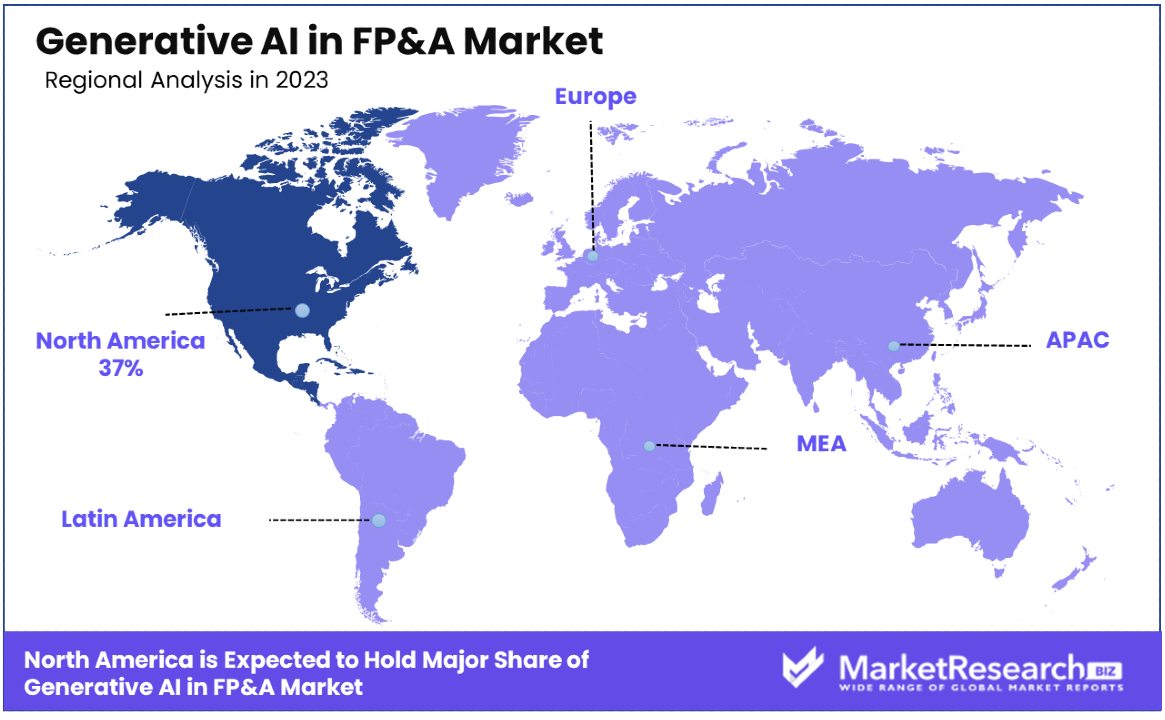
- North America Dominance: North America leads with 37% market share, driven by advanced technological infrastructure and a proactive approach to AI adoption.
- Europe's Focus on Compliance: Europe emphasizes regulatory compliance and ethical AI use, leveraging its fintech ecosystem to integrate AI into financial services.
- Key Players Analysis:
- Companies like IBM, SAP, Oracle, and Microsoft lead with robust AI solutions tailored for financial analysis.
- Specialized firms like Anaplan, Adaptive Insights, and Vena Solutions integrate AI into cloud-based platforms, driving wider adoption across organizations.
Driving Factors
Increased Data Volume and Complexity Drives Market Growth
Data volume and complexity growth is one of the primary drivers behind Generative AI in FP&A Market growth. Financial Planning & Analysis (FP&A) teams today must sift through an abundance of unstructured data such as customer feedback, transaction records, and market trends to effectively plan for the future.
Generative AI becomes an indispensable asset here, providing the capability of synthesizing and extracting actionable insights from this complex data landscape. Generative AI uses sophisticated algorithms to quickly analyze customer sentiment analysis or predict market movements, helping organizations make more data-driven decisions.
Need for Accelerated Analysis Accelerates Market Adoption
Generative AI's rapid data processing capability and ability to rapidly adapt to market changes is increasingly in demand in today's fast-paced business environment, further driving its adoption in financial planning and analysis processes.
Generative AI addresses this need by automating repetitive tasks and providing natural language suggestions, significantly shortening analysis workflows. As an example, it can instantly provide explanations for budget variances caused by specific business events. Thus it cuts the time analysts spend processing data routinely and increasing efficiency while also providing greater access to financial insights for strategic decision-making and competitive edge.
Demand for Continuous Forecasting Catalyzes Market Expansion
In an era characterized by market volatility, the demand for continuous forecasting has become more pronounced. Traditional forecasting methods, which often rely on historical data and periodic updates, are becoming inadequate.
Generative AI, with its ability to rapidly process and incorporate new data, offers a solution by enabling continuous, real-time forecasting. This capability allows businesses to adjust their sales forecasts, operational plans, and financial projections with greater accuracy and in response to the latest market conditions. The shift towards continuous forecasting represents not only a response to market volatility but also a strategic move towards more agile and responsive financial planning practices.
Restraining Factors
Increased Data Volume and Complexity Drives Market Growth
Data volume and complexity are two primary drivers behind Generative AI in FP&A Market growth. Financial Planning & Analysis (FP&A) teams today must manage a vast expanse of data derived from multiple channels and sources - customer feedback, transaction records, market trends.
Generative AI proves an invaluable asset here, providing a means of synthesizing and extracting actionable insights from this complex data landscape. Generative AI utilizes sophisticated algorithms to assess customer sentiment or predict market movements, aiding organizations in making more informed, data-driven decisions.
Need for Accelerated Analysis Accelerates Market Adoption
Generative AI's use in financial planning and analysis processes has become more widespread due to increasing demands for faster processes.
Generative AI provides businesses with an invaluable way to quickly analyze data while remaining responsive to market changes, making Generative AI an indispensable asset in today's fast-paced business environments. Generative AI meets this need by automating tedious tasks and providing natural language suggestions, significantly speeding up analysis workflows.
Deployment Mode Analysis
Generative AI for Financial Forecasting and Analysis has rapidly adopted cloud deployment models due to their scalability, flexibility and cost-efficiency. They are essential factors when dealing with data-intensive generative AI applications that demand vast computing power on an on-demand basis for complex calculations required for forecasting and analysis without major upfront investments in physical infrastructure.
Cloud platforms enable organizations to gain access to this computing power on demand allowing complex calculations required by forecasting to take place without extensive upfront capital requirements for physical infrastructure investments.
Moreover, cloud deployment supports enhanced collaboration across different departments and geographies, a key requirement for dynamic FP&A functions that must rapidly adapt to changing market conditions. The ability to seamlessly integrate with various data sources and other financial systems in real-time further underscores the cloud's value proposition, ensuring that financial planning and analysis are based on the most current and comprehensive data available.
Despite the cloud's growing dominance, the On-premises deployment mode still plays a crucial role, particularly in industries and regions with stringent data security and privacy regulations. On-premises solutions offer organizations complete control over their data and infrastructure, which is a critical consideration for companies operating in sectors where data governance and compliance are non-negotiable.
Organization Size Analysis
Large Enterprises emerge as the dominant sub-segment in the Generative AI in FP&A market. This segment's leading position is primarily due to the scale and complexity of financial operations in large organizations, which necessitate advanced AI-driven solutions to efficiently manage and analyze vast amounts of financial data.
Large enterprises typically have the resources and infrastructure to invest in and adopt generative AI technologies, enabling them to leverage these tools for sophisticated financial planning, analysis, and risk management.
Generative AI allows large enterprises to automate routine tasks, enhance accuracy in financial forecasting, and identify strategic investment opportunities, thereby improving overall decision-making processes. Furthermore, the ability of generative AI to provide insights into potential financial risks and opportunities aligns with the strategic needs of large organizations looking to maintain their competitive edge in volatile markets.
SME (Small and Medium Enterprises), while not the dominant segment in Generative AI FP&A market growth, remain an integral area. Thanks to cloud scalability, cloud-based Generative AI solutions have become more accessible to SMEs than ever, giving these smaller entities access to cutting-edge analytics and forecasting tools previously out of reach.
Application Analysis
Budgeting and Forecasting is the dominant application sub-segment within the Generative AI in FP&A market. This preeminence stems from the core requirement for businesses to accurately predict future financial performance and allocate resources efficiently.
Generative AI significantly enhances the budgeting and forecasting process by enabling more accurate, data-driven predictions that can adapt to changing market conditions. These AI-driven tools can analyze vast datasets to identify trends, patterns, and potential financial outcomes, facilitating more strategic and informed budgeting and resource allocation decisions.
While Budgeting and Forecasting lead the application segment, other applications such as Financial Reporting and Risk Management also play critical roles in the market's growth.
Financial Reporting benefits from generative AI through the automation of complex reporting tasks and the generation of insights from financial data, thereby improving accuracy and efficiency. Risk Management applications leverage generative AI to predict and mitigate financial risks by analyzing market trends and internal financial indicators, providing a proactive approach to financial planning.
Key Market Segments
By Deployment Mode
- Cloud
- On-premises
By Organization Size
- Small and Medium Enterprises (SMEs)
- Large Enterprises
By Application
- Budgeting and Forecasting
- Financial Reporting
- Risk Management
- Other Applications
Growth Opportunities
Automating Financial Reporting Offers Growth Opportunity
Generative AI presents an immense growth potential within the Financial Planning & Analysis market. Generative AI can save businesses valuable time and resources by streamlining the repetitive aspects of financial reporting. Data analysis, trend identification and narrative generation among them - which require considerable resources for their completion.
AI systems that analyze sales data by region and automatically draft management discussion and analysis sections not only speed up the reporting process but also increase their accuracy and relevance in financial documents. Automation allows finance teams to focus more on strategic analysis and decision-making, thus increasing efficiency and productivity.
Enhanced Scenario Planning Offers Growth Opportunity
Generative AI's ability to rapidly develop and analyze financial models for various market scenarios offers another avenue for growth in the FP&A market. This technology provides companies with the foresight needed to prepare for and respond to different market conditions, such as fluctuations in oil prices or changes in consumer demand.
By leveraging Generative AI, businesses can simulate a wide range of financial outcomes based on varying market variables, enabling more informed strategic planning and risk management. This capability is particularly valuable in today's volatile market environment, where the ability to quickly adapt and make data-driven decisions can significantly impact a company's resilience and success.
Trending Factors
Consolidation of FP&A Systems Are Trending Factors
The trend towards the consolidation of Financial Planning & Analysis (FP&A) systems, with Generative AI being integrated directly into comprehensive FP&A suites like Anaplan, signifies a major shift in how businesses approach financial planning and analysis.
This integration facilitates tighter, more seamless operations, allowing for the automation of complex analytical tasks and the generation of insights within a unified platform. The move away from separate bolt-on applications towards consolidated systems enhances data coherence, improves workflow efficiencies, and reduces the potential for errors, driving significant improvements in overall financial management.
Explainable AI Are Trending Factors
Explainable AI in finance has emerged as a significant trend within Generative AI for FP&A market. Financial recommendations and forecasts must not only be accurate, but auditable and transparent enough for stakeholders to comprehend their rationale behind AI-based decisions.
Explainability requirements arise due to both accountability in financial reporting and compliance, and building trust among finance professionals for AI systems. Understanding and explaining the key drivers affecting cash flow forecasts increases AI models' credibility and utility. While meeting regulatory scrutiny without sacrificing transparency, making explainable AI language models increasingly vital in shaping the future of FP&A market.
Regional Analysis
North America Dominates with 37% Market Share
North America's dominance in the Generative AI in FP&A market can be attributed to its advanced technological infrastructure, high investment in AI research and development, and the presence of leading AI firms and startups. The region's robust financial sector, coupled with a strong push for innovation and digital transformation, drives the adoption of generative AI technologies in FP&A operations.
The regional market is characterized by a proactive approach to adopting new technologies, supported by favorable regulatory frameworks and a skilled workforce. This environment fosters the development and integration of AI solutions in financial planning and analysis, enhancing efficiency and strategic decision-making.
Given its current trajectory, North America is expected to maintain its leadership position in the market. Continuous investments in AI and a growing focus on financial analytics and automation are likely to further propel the region's market share and influence in the global landscape.
Europe
Europe's Generative AI in FP&A market is driven by stringent regulatory compliance demands and a strong focus on financial transparency. The region benefits from a well-established fintech ecosystem, promoting the integration of AI in financial services. European firms prioritize data privacy and ethical AI use, aligning with the region's regulatory environment.
Asia Pacific
The Asia Pacific region shows rapid growth in the Generative AI in FP&A market, fueled by digital transformation initiatives and economic development. Countries like China, Japan, and South Korea lead in technology adoption, with a surge in startups and investments in AI. The region's diverse economic landscape offers unique opportunities for generative AI applications.
Middle East & Africa
The Middle East & Africa region is witnessing a gradual adoption of Generative AI in FP&A, with growth driven by digital transformation efforts in the finance sector and investments in smart technologies. The region's focus on diversifying economies and enhancing financial services through technology underpins this emerging trend.
Latin America
Latin America's Generative AI in FP&A market is emerging, with growth influenced by increasing digitalization of businesses and a rising startup culture focused on fintech innovations. Challenges such as economic volatility and infrastructure gaps are being addressed through strategic partnerships and government initiatives to foster AI adoption.
Key Regions and Countries
- North America
- The US
- Canada
- Mexico
- Western Europe
- Germany
- France
- The UK
- Spain
- Italy
- Portugal
- Ireland
- Austria
- Switzerland
- Benelux
- Nordic
- Rest of Western Europe
- Eastern Europe
- Russia
- Poland
- The Czech Republic
- Greece
- Rest of Eastern Europe
- APAC
- China
- Japan
- South Korea
- India
- Australia & New Zealand
- Indonesia
- Malaysia
- Philippines
- Singapore
- Thailand
- Vietnam
- Rest of APAC
- Latin America
- Brazil
- Colombia
- Chile
- Argentina
- Costa Rica
- Rest of Latin America
- Middle East & Africa
- Algeria
- Egypt
- Israel
- Kuwait
- Nigeria
- Saudi Arabia
- South Africa
- Turkey
- United Arab Emirates
- Rest of MEA
Key Players Analysis
In the rapidly evolving Generative AI in Financial Planning & Analysis (FP&A) market, several finance leaders have established significant influence and strategic positioning. Companies such as IBM Corporation, SAP SE, Oracle Corporation, and Microsoft Corporation lead the pack with robust AI solutions tailored for financial analysis and planning. Their extensive portfolios offer advanced analytics, machine learning, and data processing capabilities, enabling businesses to derive actionable insights and enhance decision-making processes.
Firms like Anaplan Inc., Adaptive Insights (a Workday Company), and Vena Solutions Inc. specialize in integrating AI into FP&A software, providing flexible, cloud-based platforms that facilitate real-time financial planning and analysis. These players are pivotal in driving the adoption of generative AI technologies by making them accessible to a wider range of organizations, from large enterprises to small and medium-sized businesses.
Market Key Players
- IBM Corporation
- SAP SE
- Oracle Corporation
- SAS Institute Inc.
- Microsoft Corporation
- Anaplan Inc.
- Adaptive Insights (a Workday Company)
- FICO (Fair Isaac Corporation)
- Tagetik Software (a Wolters Kluwer Company)
- Vena Solutions Inc.
- Qlik Technologies Inc.
- Other Key Players
Recent Developments
- In May 2023, Amazon Web Services, Inc. introduced Amazon Aurora Input/Output (I/O)-Optimized, a new feature enhancing performance and pricing predictability for clients with high input/output software demands on Amazon Aurora.
- On July 2023, Jumpsuit Finance unveiled the Genesis J2T-F1 tailored for the Financial Services Industry. Covering areas such as asset management, banking trades, finance technology, and wealth management, the Genesis J2T-F1 facilitates scenario forecasting to expedite insight production.
- In December 2023, FIS, a global leader in financial services technology, conducted consumer research to gauge understanding and trust in Generative Artificial Intelligence (GenAI). The study also explored attitudes towards GenAI's role in personal finance and banking.
Report Scope
Report Features Description Market Value (2023) USD xx Billion Forecast Revenue (2033) USD xx Billion CAGR (2024-2033) xx% Base Year for Estimation 2023 Historic Period 2018-2023 Forecast Period 2024-2033 Report Coverage Revenue Forecast, Market Dynamics, Competitive Landscape, Recent Developments Segments Covered By Deployment Mode (Cloud, On-premises), By Organization Size (Small and Medium Enterprises (SMEs), Large Enterprises), By Application (Budgeting and Forecasting, Financial Reporting, Risk Management, Other Applications) Regional Analysis North America - The US, Canada, & Mexico; Western Europe - Germany, France, The UK, Spain, Italy, Portugal, Ireland, Austria, Switzerland, Benelux, Nordic, & Rest of Western Europe; Eastern Europe - Russia, Poland, The Czech Republic, Greece, & Rest of Eastern Europe; APAC - China, Japan, South Korea, India, Australia & New Zealand, Indonesia, Malaysia, Philippines, Singapore, Thailand, Vietnam, & Rest of APAC; Latin America - Brazil, Colombia, Chile, Argentina, Costa Rica, & Rest of Latin America; Middle East & Africa - Algeria, Egypt, Israel, Kuwait, Nigeria, Saudi Arabia, South Africa, Turkey, United Arab Emirates, & Rest of MEA Competitive Landscape IBM Corporation, SAP SE, Oracle Corporation, SAS Institute Inc., Microsoft Corporation, Anaplan Inc., Adaptive Insights (a Workday Company), FICO (Fair Isaac Corporation), Tagetik Software (a Wolters Kluwer Company), Vena Solutions Inc., Qlik Technologies Inc., Other Key Players Customization Scope Customization for segments, region/country-level will be provided. Moreover, additional customization can be done based on the requirements. Purchase Options We have three licenses to opt for: Single User License, Multi-User License (Up to 5 Users), Corporate Use License (Unlimited User and Printable PDF) -
- 1. Executive Summary
- 1.1. Definition
- 1.2. Taxonomy
- 1.3. Research Scope
- 1.4. Key Analysis
- 1.5. Key Findings by Major Segments
- 1.6. Top strategies by Major Players
- 2. Global Generative AI in FP&A Market Overview
- 2.1. Generative AI in FP&A Market Dynamics
- 2.1.1. Drivers
- 2.1.2. Opportunities
- 2.1.3. Restraints
- 2.1.4. Challenges
- 2.2. Macro-economic Factors
- 2.3. Regulatory Framework
- 2.4. Market Investment Feasibility Index
- 2.5. PEST Analysis
- 2.6. PORTER’S Five Force Analysis
- 2.7. Drivers & Restraints Impact Analysis
- 2.8. Industry Chain Analysis
- 2.9. Cost Structure Analysis
- 2.10. Marketing Strategy
- 2.11. Russia-Ukraine War Impact Analysis
- 2.12. Opportunity Map Analysis
- 2.13. Market Competition Scenario Analysis
- 2.14. Product Life Cycle Analysis
- 2.15. Opportunity Orbits
- 2.16. Manufacturer Intensity Map
- 2.17. Major Companies sales by Value & Volume
- 2.1. Generative AI in FP&A Market Dynamics
- 3. Global Generative AI in FP&A Market Analysis, Opportunity and Forecast, 2018-2033
- 3.1. Global Generative AI in FP&A Market Analysis, 2018-2021
- 3.2. Global Generative AI in FP&A Market Opportunity and Forecast, 2023-2033
- 3.3. Global Generative AI in FP&A Market Analysis, Opportunity and Forecast, By Deployment Mode, 2018-2033
- 3.3.1. Global Generative AI in FP&A Market Analysis by By Deployment Mode: Introduction
- 3.3.2. Market Size Absolute $ Opportunity Analysis and Forecast, By Deployment Mode, 2018-2033
- 3.3.3. Cloud
- 3.3.4. On-premises
- 3.4. Global Generative AI in FP&A Market Analysis, Opportunity and Forecast, By Organization Size, 2018-2033
- 3.4.1. Global Generative AI in FP&A Market Analysis by By Organization Size: Introduction
- 3.4.2. Market Size Absolute $ Opportunity Analysis and Forecast, By Organization Size, 2018-2033
- 3.4.3. Small and Medium Enterprises (SMEs)
- 3.4.4. Large Enterprises
- 3.5. Global Generative AI in FP&A Market Analysis, Opportunity and Forecast, By Application, 2018-2033
- 3.5.1. Global Generative AI in FP&A Market Analysis by By Application: Introduction
- 3.5.2. Market Size Absolute $ Opportunity Analysis and Forecast, By Application, 2018-2033
- 3.5.3. Budgeting and Forecasting
- 3.5.4. Financial Reporting
- 3.5.5. Risk Management
- 3.5.6. Other Applications
- 4. North America Generative AI in FP&A Market Analysis, Opportunity and Forecast, 2018-2033
- 4.1. North America Generative AI in FP&A Market Analysis, 2018-2021
- 4.2. North America Generative AI in FP&A Market Opportunity and Forecast, 2023-2033
- 4.3. North America Generative AI in FP&A Market Analysis, Opportunity and Forecast, By Deployment Mode, 2018-2033
- 4.3.1. North America Generative AI in FP&A Market Analysis by By Deployment Mode: Introduction
- 4.3.2. Market Size Absolute $ Opportunity Analysis and Forecast, By Deployment Mode, 2018-2033
- 4.3.3. Cloud
- 4.3.4. On-premises
- 4.4. North America Generative AI in FP&A Market Analysis, Opportunity and Forecast, By Organization Size, 2018-2033
- 4.4.1. North America Generative AI in FP&A Market Analysis by By Organization Size: Introduction
- 4.4.2. Market Size Absolute $ Opportunity Analysis and Forecast, By Organization Size, 2018-2033
- 4.4.3. Small and Medium Enterprises (SMEs)
- 4.4.4. Large Enterprises
- 4.5. North America Generative AI in FP&A Market Analysis, Opportunity and Forecast, By Application, 2018-2033
- 4.5.1. North America Generative AI in FP&A Market Analysis by By Application: Introduction
- 4.5.2. Market Size Absolute $ Opportunity Analysis and Forecast, By Application, 2018-2033
- 4.5.3. Budgeting and Forecasting
- 4.5.4. Financial Reporting
- 4.5.5. Risk Management
- 4.5.6. Other Applications
- 4.6. North America Generative AI in FP&A Market Analysis, Opportunity and Forecast, By Country , 2018-2033
- 4.6.1. North America Generative AI in FP&A Market Analysis by Country : Introduction
- 4.6.2. Market Size Absolute $ Opportunity Analysis and Forecast, Country , 2018-2033
- 4.6.2.1. The US
- 4.6.2.2. Canada
- 4.6.2.3. Mexico
- 5. Western Europe Generative AI in FP&A Market Analysis, Opportunity and Forecast, 2018-2033
- 5.1. Western Europe Generative AI in FP&A Market Analysis, 2018-2021
- 5.2. Western Europe Generative AI in FP&A Market Opportunity and Forecast, 2023-2033
- 5.3. Western Europe Generative AI in FP&A Market Analysis, Opportunity and Forecast, By Deployment Mode, 2018-2033
- 5.3.1. Western Europe Generative AI in FP&A Market Analysis by By Deployment Mode: Introduction
- 5.3.2. Market Size Absolute $ Opportunity Analysis and Forecast, By Deployment Mode, 2018-2033
- 5.3.3. Cloud
- 5.3.4. On-premises
- 5.4. Western Europe Generative AI in FP&A Market Analysis, Opportunity and Forecast, By Organization Size, 2018-2033
- 5.4.1. Western Europe Generative AI in FP&A Market Analysis by By Organization Size: Introduction
- 5.4.2. Market Size Absolute $ Opportunity Analysis and Forecast, By Organization Size, 2018-2033
- 5.4.3. Small and Medium Enterprises (SMEs)
- 5.4.4. Large Enterprises
- 5.5. Western Europe Generative AI in FP&A Market Analysis, Opportunity and Forecast, By Application, 2018-2033
- 5.5.1. Western Europe Generative AI in FP&A Market Analysis by By Application: Introduction
- 5.5.2. Market Size Absolute $ Opportunity Analysis and Forecast, By Application, 2018-2033
- 5.5.3. Budgeting and Forecasting
- 5.5.4. Financial Reporting
- 5.5.5. Risk Management
- 5.5.6. Other Applications
- 5.6. Western Europe Generative AI in FP&A Market Analysis, Opportunity and Forecast, By Country , 2018-2033
- 5.6.1. Western Europe Generative AI in FP&A Market Analysis by Country : Introduction
- 5.6.2. Market Size Absolute $ Opportunity Analysis and Forecast, Country , 2018-2033
- 5.6.2.1. Germany
- 5.6.2.2. France
- 5.6.2.3. The UK
- 5.6.2.4. Spain
- 5.6.2.5. Italy
- 5.6.2.6. Portugal
- 5.6.2.7. Ireland
- 5.6.2.8. Austria
- 5.6.2.9. Switzerland
- 5.6.2.10. Benelux
- 5.6.2.11. Nordic
- 5.6.2.12. Rest of Western Europe
- 6. Eastern Europe Generative AI in FP&A Market Analysis, Opportunity and Forecast, 2018-2033
- 6.1. Eastern Europe Generative AI in FP&A Market Analysis, 2018-2021
- 6.2. Eastern Europe Generative AI in FP&A Market Opportunity and Forecast, 2023-2033
- 6.3. Eastern Europe Generative AI in FP&A Market Analysis, Opportunity and Forecast, By Deployment Mode, 2018-2033
- 6.3.1. Eastern Europe Generative AI in FP&A Market Analysis by By Deployment Mode: Introduction
- 6.3.2. Market Size Absolute $ Opportunity Analysis and Forecast, By Deployment Mode, 2018-2033
- 6.3.3. Cloud
- 6.3.4. On-premises
- 6.4. Eastern Europe Generative AI in FP&A Market Analysis, Opportunity and Forecast, By Organization Size, 2018-2033
- 6.4.1. Eastern Europe Generative AI in FP&A Market Analysis by By Organization Size: Introduction
- 6.4.2. Market Size Absolute $ Opportunity Analysis and Forecast, By Organization Size, 2018-2033
- 6.4.3. Small and Medium Enterprises (SMEs)
- 6.4.4. Large Enterprises
- 6.5. Eastern Europe Generative AI in FP&A Market Analysis, Opportunity and Forecast, By Application, 2018-2033
- 6.5.1. Eastern Europe Generative AI in FP&A Market Analysis by By Application: Introduction
- 6.5.2. Market Size Absolute $ Opportunity Analysis and Forecast, By Application, 2018-2033
- 6.5.3. Budgeting and Forecasting
- 6.5.4. Financial Reporting
- 6.5.5. Risk Management
- 6.5.6. Other Applications
- 6.6. Eastern Europe Generative AI in FP&A Market Analysis, Opportunity and Forecast, By Country , 2018-2033
- 6.6.1. Eastern Europe Generative AI in FP&A Market Analysis by Country : Introduction
- 6.6.2. Market Size Absolute $ Opportunity Analysis and Forecast, Country , 2018-2033
- 6.6.2.1. Russia
- 6.6.2.2. Poland
- 6.6.2.3. The Czech Republic
- 6.6.2.4. Greece
- 6.6.2.5. Rest of Eastern Europe
- 7. APAC Generative AI in FP&A Market Analysis, Opportunity and Forecast, 2018-2033
- 7.1. APAC Generative AI in FP&A Market Analysis, 2018-2021
- 7.2. APAC Generative AI in FP&A Market Opportunity and Forecast, 2023-2033
- 7.3. APAC Generative AI in FP&A Market Analysis, Opportunity and Forecast, By Deployment Mode, 2018-2033
- 7.3.1. APAC Generative AI in FP&A Market Analysis by By Deployment Mode: Introduction
- 7.3.2. Market Size Absolute $ Opportunity Analysis and Forecast, By Deployment Mode, 2018-2033
- 7.3.3. Cloud
- 7.3.4. On-premises
- 7.4. APAC Generative AI in FP&A Market Analysis, Opportunity and Forecast, By Organization Size, 2018-2033
- 7.4.1. APAC Generative AI in FP&A Market Analysis by By Organization Size: Introduction
- 7.4.2. Market Size Absolute $ Opportunity Analysis and Forecast, By Organization Size, 2018-2033
- 7.4.3. Small and Medium Enterprises (SMEs)
- 7.4.4. Large Enterprises
- 7.5. APAC Generative AI in FP&A Market Analysis, Opportunity and Forecast, By Application, 2018-2033
- 7.5.1. APAC Generative AI in FP&A Market Analysis by By Application: Introduction
- 7.5.2. Market Size Absolute $ Opportunity Analysis and Forecast, By Application, 2018-2033
- 7.5.3. Budgeting and Forecasting
- 7.5.4. Financial Reporting
- 7.5.5. Risk Management
- 7.5.6. Other Applications
- 7.6. APAC Generative AI in FP&A Market Analysis, Opportunity and Forecast, By Country , 2018-2033
- 7.6.1. APAC Generative AI in FP&A Market Analysis by Country : Introduction
- 7.6.2. Market Size Absolute $ Opportunity Analysis and Forecast, Country , 2018-2033
- 7.6.2.1. China
- 7.6.2.2. Japan
- 7.6.2.3. South Korea
- 7.6.2.4. India
- 7.6.2.5. Australia & New Zeland
- 7.6.2.6. Indonesia
- 7.6.2.7. Malaysia
- 7.6.2.8. Philippines
- 7.6.2.9. Singapore
- 7.6.2.10. Thailand
- 7.6.2.11. Vietnam
- 7.6.2.12. Rest of APAC
- 8. Latin America Generative AI in FP&A Market Analysis, Opportunity and Forecast, 2018-2033
- 8.1. Latin America Generative AI in FP&A Market Analysis, 2018-2021
- 8.2. Latin America Generative AI in FP&A Market Opportunity and Forecast, 2023-2033
- 8.3. Latin America Generative AI in FP&A Market Analysis, Opportunity and Forecast, By Deployment Mode, 2018-2033
- 8.3.1. Latin America Generative AI in FP&A Market Analysis by By Deployment Mode: Introduction
- 8.3.2. Market Size Absolute $ Opportunity Analysis and Forecast, By Deployment Mode, 2018-2033
- 8.3.3. Cloud
- 8.3.4. On-premises
- 8.4. Latin America Generative AI in FP&A Market Analysis, Opportunity and Forecast, By Organization Size, 2018-2033
- 8.4.1. Latin America Generative AI in FP&A Market Analysis by By Organization Size: Introduction
- 8.4.2. Market Size Absolute $ Opportunity Analysis and Forecast, By Organization Size, 2018-2033
- 8.4.3. Small and Medium Enterprises (SMEs)
- 8.4.4. Large Enterprises
- 8.5. Latin America Generative AI in FP&A Market Analysis, Opportunity and Forecast, By Application, 2018-2033
- 8.5.1. Latin America Generative AI in FP&A Market Analysis by By Application: Introduction
- 8.5.2. Market Size Absolute $ Opportunity Analysis and Forecast, By Application, 2018-2033
- 8.5.3. Budgeting and Forecasting
- 8.5.4. Financial Reporting
- 8.5.5. Risk Management
- 8.5.6. Other Applications
- 8.6. Latin America Generative AI in FP&A Market Analysis, Opportunity and Forecast, By Country , 2018-2033
- 8.6.1. Latin America Generative AI in FP&A Market Analysis by Country : Introduction
- 8.6.2. Market Size Absolute $ Opportunity Analysis and Forecast, Country , 2018-2033
- 8.6.2.1. Brazil
- 8.6.2.2. Colombia
- 8.6.2.3. Chile
- 8.6.2.4. Argentina
- 8.6.2.5. Costa Rica
- 8.6.2.6. Rest of Latin America
- 9. Middle East & Africa Generative AI in FP&A Market Analysis, Opportunity and Forecast, 2018-2033
- 9.1. Middle East & Africa Generative AI in FP&A Market Analysis, 2018-2021
- 9.2. Middle East & Africa Generative AI in FP&A Market Opportunity and Forecast, 2023-2033
- 9.3. Middle East & Africa Generative AI in FP&A Market Analysis, Opportunity and Forecast, By Deployment Mode, 2018-2033
- 9.3.1. Middle East & Africa Generative AI in FP&A Market Analysis by By Deployment Mode: Introduction
- 9.3.2. Market Size Absolute $ Opportunity Analysis and Forecast, By Deployment Mode, 2018-2033
- 9.3.3. Cloud
- 9.3.4. On-premises
- 9.4. Middle East & Africa Generative AI in FP&A Market Analysis, Opportunity and Forecast, By Organization Size, 2018-2033
- 9.4.1. Middle East & Africa Generative AI in FP&A Market Analysis by By Organization Size: Introduction
- 9.4.2. Market Size Absolute $ Opportunity Analysis and Forecast, By Organization Size, 2018-2033
- 9.4.3. Small and Medium Enterprises (SMEs)
- 9.4.4. Large Enterprises
- 9.5. Middle East & Africa Generative AI in FP&A Market Analysis, Opportunity and Forecast, By Application, 2018-2033
- 9.5.1. Middle East & Africa Generative AI in FP&A Market Analysis by By Application: Introduction
- 9.5.2. Market Size Absolute $ Opportunity Analysis and Forecast, By Application, 2018-2033
- 9.5.3. Budgeting and Forecasting
- 9.5.4. Financial Reporting
- 9.5.5. Risk Management
- 9.5.6. Other Applications
- 9.6. Middle East & Africa Generative AI in FP&A Market Analysis, Opportunity and Forecast, By Country , 2018-2033
- 9.6.1. Middle East & Africa Generative AI in FP&A Market Analysis by Country : Introduction
- 9.6.2. Market Size Absolute $ Opportunity Analysis and Forecast, Country , 2018-2033
- 9.6.2.1. Algeria
- 9.6.2.2. Egypt
- 9.6.2.3. Israel
- 9.6.2.4. Kuwait
- 9.6.2.5. Nigeria
- 9.6.2.6. Saudi Arabia
- 9.6.2.7. South Africa
- 9.6.2.8. Turkey
- 9.6.2.9. The UAE
- 9.6.2.10. Rest of MEA
- 10. Global Generative AI in FP&A Market Analysis, Opportunity and Forecast, By Region , 2018-2033
- 10.1. Global Generative AI in FP&A Market Analysis by Region : Introduction
- 10.2. Market Size Absolute $ Opportunity Analysis and Forecast, By Region , 2018-2033
- 10.2.1. North America
- 10.2.2. Western Europe
- 10.2.3. Eastern Europe
- 10.2.4. APAC
- 10.2.5. Latin America
- 10.2.6. Middle East & Africa
- 11. Global Generative AI in FP&A Market Competitive Landscape, Market Share Analysis, and Company Profiles
- 11.1. Market Share Analysis
- 11.2. Company Profiles
- 11.3. IBM Corporation
- 11.3.1. Company Overview
- 11.3.2. Financial Highlights
- 11.3.3. Product Portfolio
- 11.3.4. SWOT Analysis
- 11.3.5. Key Strategies and Developments
- 11.4. SAP SE
- 11.4.1. Company Overview
- 11.4.2. Financial Highlights
- 11.4.3. Product Portfolio
- 11.4.4. SWOT Analysis
- 11.4.5. Key Strategies and Developments
- 11.5. Oracle Corporation
- 11.5.1. Company Overview
- 11.5.2. Financial Highlights
- 11.5.3. Product Portfolio
- 11.5.4. SWOT Analysis
- 11.5.5. Key Strategies and Developments
- 11.6. SAS Institute Inc.
- 11.6.1. Company Overview
- 11.6.2. Financial Highlights
- 11.6.3. Product Portfolio
- 11.6.4. SWOT Analysis
- 11.6.5. Key Strategies and Developments
- 11.7. Microsoft Corporation
- 11.7.1. Company Overview
- 11.7.2. Financial Highlights
- 11.7.3. Product Portfolio
- 11.7.4. SWOT Analysis
- 11.7.5. Key Strategies and Developments
- 11.8. Anaplan Inc.
- 11.8.1. Company Overview
- 11.8.2. Financial Highlights
- 11.8.3. Product Portfolio
- 11.8.4. SWOT Analysis
- 11.8.5. Key Strategies and Developments
- 11.9. Adaptive Insights (a Workday Company)
- 11.9.1. Company Overview
- 11.9.2. Financial Highlights
- 11.9.3. Product Portfolio
- 11.9.4. SWOT Analysis
- 11.9.5. Key Strategies and Developments
- 11.10. FICO (Fair Isaac Corporation)
- 11.10.1. Company Overview
- 11.10.2. Financial Highlights
- 11.10.3. Product Portfolio
- 11.10.4. SWOT Analysis
- 11.10.5. Key Strategies and Developments
- 11.11. Tagetik Software (a Wolters Kluwer Company)
- 11.11.1. Company Overview
- 11.11.2. Financial Highlights
- 11.11.3. Product Portfolio
- 11.11.4. SWOT Analysis
- 11.11.5. Key Strategies and Developments
- 11.12. Vena Solutions Inc.
- 11.12.1. Company Overview
- 11.12.2. Financial Highlights
- 11.12.3. Product Portfolio
- 11.12.4. SWOT Analysis
- 11.12.5. Key Strategies and Developments
- 11.13.1. Company Overview
- 11.13.2. Financial Highlights
- 11.13.3. Product Portfolio
- 11.13.4. SWOT Analysis
- 11.13.5. Key Strategies and Developments
- 11.14. Qlik Technologies Inc.
- 11.14.1. Company Overview
- 11.14.2. Financial Highlights
- 11.14.3. Product Portfolio
- 11.14.4. SWOT Analysis
- 11.14.5. Key Strategies and Developments
- 12. Assumptions and Acronyms
- 13. Research Methodology
- 14. Contact
"
- List of Figures
- "
- Figure 1: Global Generative AI in FP&A Market Revenue (US$ Mn) Market Share by By Deployment Mode in 2022
- Figure 2: Global Generative AI in FP&A Market Attractiveness Analysis by By Deployment Mode, 2018-2033
- Figure 3: Global Generative AI in FP&A Market Revenue (US$ Mn) Market Share by By Organization Sizein 2022
- Figure 4: Global Generative AI in FP&A Market Attractiveness Analysis by By Organization Size, 2018-2033
- Figure 5: Global Generative AI in FP&A Market Revenue (US$ Mn) Market Share by By Applicationin 2022
- Figure 6: Global Generative AI in FP&A Market Attractiveness Analysis by By Application, 2018-2033
- Figure 7: Global Generative AI in FP&A Market Revenue (US$ Mn) Market Share by Region in 2022
- Figure 8: Global Generative AI in FP&A Market Attractiveness Analysis by Region, 2018-2033
- Figure 9: Global Generative AI in FP&A Market Revenue (US$ Mn) (2018-2033)
- Figure 10: Global Generative AI in FP&A Market Revenue (US$ Mn) Comparison by Region (2018-2033)
- Figure 11: Global Generative AI in FP&A Market Revenue (US$ Mn) Comparison by By Deployment Mode (2018-2033)
- Figure 12: Global Generative AI in FP&A Market Revenue (US$ Mn) Comparison by By Organization Size (2018-2033)
- Figure 13: Global Generative AI in FP&A Market Revenue (US$ Mn) Comparison by By Application (2018-2033)
- Figure 14: Global Generative AI in FP&A Market Y-o-Y Growth Rate Comparison by Region (2018-2033)
- Figure 15: Global Generative AI in FP&A Market Y-o-Y Growth Rate Comparison by By Deployment Mode (2018-2033)
- Figure 16: Global Generative AI in FP&A Market Y-o-Y Growth Rate Comparison by By Organization Size (2018-2033)
- Figure 17: Global Generative AI in FP&A Market Y-o-Y Growth Rate Comparison by By Application (2018-2033)
- Figure 18: Global Generative AI in FP&A Market Share Comparison by Region (2018-2033)
- Figure 19: Global Generative AI in FP&A Market Share Comparison by By Deployment Mode (2018-2033)
- Figure 20: Global Generative AI in FP&A Market Share Comparison by By Organization Size (2018-2033)
- Figure 21: Global Generative AI in FP&A Market Share Comparison by By Application (2018-2033)
- Figure 22: North America Generative AI in FP&A Market Revenue (US$ Mn) Market Share by By Deployment Modein 2022
- Figure 23: North America Generative AI in FP&A Market Attractiveness Analysis by By Deployment Mode, 2018-2033
- Figure 24: North America Generative AI in FP&A Market Revenue (US$ Mn) Market Share by By Organization Sizein 2022
- Figure 25: North America Generative AI in FP&A Market Attractiveness Analysis by By Organization Size, 2018-2033
- Figure 26: North America Generative AI in FP&A Market Revenue (US$ Mn) Market Share by By Applicationin 2022
- Figure 27: North America Generative AI in FP&A Market Attractiveness Analysis by By Application, 2018-2033
- Figure 28: North America Generative AI in FP&A Market Revenue (US$ Mn) Market Share by Country in 2022
- Figure 29: North America Generative AI in FP&A Market Attractiveness Analysis by Country, 2018-2033
- Figure 30: North America Generative AI in FP&A Market Revenue (US$ Mn) (2018-2033)
- Figure 31: North America Generative AI in FP&A Market Revenue (US$ Mn) Comparison by Country (2018-2033)
- Figure 32: North America Generative AI in FP&A Market Revenue (US$ Mn) Comparison by By Deployment Mode (2018-2033)
- Figure 33: North America Generative AI in FP&A Market Revenue (US$ Mn) Comparison by By Organization Size (2018-2033)
- Figure 34: North America Generative AI in FP&A Market Revenue (US$ Mn) Comparison by By Application (2018-2033)
- Figure 35: North America Generative AI in FP&A Market Y-o-Y Growth Rate Comparison by Country (2018-2033)
- Figure 36: North America Generative AI in FP&A Market Y-o-Y Growth Rate Comparison by By Deployment Mode (2018-2033)
- Figure 37: North America Generative AI in FP&A Market Y-o-Y Growth Rate Comparison by By Organization Size (2018-2033)
- Figure 38: North America Generative AI in FP&A Market Y-o-Y Growth Rate Comparison by By Application (2018-2033)
- Figure 39: North America Generative AI in FP&A Market Share Comparison by Country (2018-2033)
- Figure 40: North America Generative AI in FP&A Market Share Comparison by By Deployment Mode (2018-2033)
- Figure 41: North America Generative AI in FP&A Market Share Comparison by By Organization Size (2018-2033)
- Figure 42: North America Generative AI in FP&A Market Share Comparison by By Application (2018-2033)
- Figure 43: Western Europe Generative AI in FP&A Market Revenue (US$ Mn) Market Share by By Deployment Modein 2022
- Figure 44: Western Europe Generative AI in FP&A Market Attractiveness Analysis by By Deployment Mode, 2018-2033
- Figure 45: Western Europe Generative AI in FP&A Market Revenue (US$ Mn) Market Share by By Organization Sizein 2022
- Figure 46: Western Europe Generative AI in FP&A Market Attractiveness Analysis by By Organization Size, 2018-2033
- Figure 47: Western Europe Generative AI in FP&A Market Revenue (US$ Mn) Market Share by By Applicationin 2022
- Figure 48: Western Europe Generative AI in FP&A Market Attractiveness Analysis by By Application, 2018-2033
- Figure 49: Western Europe Generative AI in FP&A Market Revenue (US$ Mn) Market Share by Country in 2022
- Figure 50: Western Europe Generative AI in FP&A Market Attractiveness Analysis by Country, 2018-2033
- Figure 51: Western Europe Generative AI in FP&A Market Revenue (US$ Mn) (2018-2033)
- Figure 52: Western Europe Generative AI in FP&A Market Revenue (US$ Mn) Comparison by Country (2018-2033)
- Figure 53: Western Europe Generative AI in FP&A Market Revenue (US$ Mn) Comparison by By Deployment Mode (2018-2033)
- Figure 54: Western Europe Generative AI in FP&A Market Revenue (US$ Mn) Comparison by By Organization Size (2018-2033)
- Figure 55: Western Europe Generative AI in FP&A Market Revenue (US$ Mn) Comparison by By Application (2018-2033)
- Figure 56: Western Europe Generative AI in FP&A Market Y-o-Y Growth Rate Comparison by Country (2018-2033)
- Figure 57: Western Europe Generative AI in FP&A Market Y-o-Y Growth Rate Comparison by By Deployment Mode (2018-2033)
- Figure 58: Western Europe Generative AI in FP&A Market Y-o-Y Growth Rate Comparison by By Organization Size (2018-2033)
- Figure 59: Western Europe Generative AI in FP&A Market Y-o-Y Growth Rate Comparison by By Application (2018-2033)
- Figure 60: Western Europe Generative AI in FP&A Market Share Comparison by Country (2018-2033)
- Figure 61: Western Europe Generative AI in FP&A Market Share Comparison by By Deployment Mode (2018-2033)
- Figure 62: Western Europe Generative AI in FP&A Market Share Comparison by By Organization Size (2018-2033)
- Figure 63: Western Europe Generative AI in FP&A Market Share Comparison by By Application (2018-2033)
- Figure 64: Eastern Europe Generative AI in FP&A Market Revenue (US$ Mn) Market Share by By Deployment Modein 2022
- Figure 65: Eastern Europe Generative AI in FP&A Market Attractiveness Analysis by By Deployment Mode, 2018-2033
- Figure 66: Eastern Europe Generative AI in FP&A Market Revenue (US$ Mn) Market Share by By Organization Sizein 2022
- Figure 67: Eastern Europe Generative AI in FP&A Market Attractiveness Analysis by By Organization Size, 2018-2033
- Figure 68: Eastern Europe Generative AI in FP&A Market Revenue (US$ Mn) Market Share by By Applicationin 2022
- Figure 69: Eastern Europe Generative AI in FP&A Market Attractiveness Analysis by By Application, 2018-2033
- Figure 70: Eastern Europe Generative AI in FP&A Market Revenue (US$ Mn) Market Share by Country in 2022
- Figure 71: Eastern Europe Generative AI in FP&A Market Attractiveness Analysis by Country, 2018-2033
- Figure 72: Eastern Europe Generative AI in FP&A Market Revenue (US$ Mn) (2018-2033)
- Figure 73: Eastern Europe Generative AI in FP&A Market Revenue (US$ Mn) Comparison by Country (2018-2033)
- Figure 74: Eastern Europe Generative AI in FP&A Market Revenue (US$ Mn) Comparison by By Deployment Mode (2018-2033)
- Figure 75: Eastern Europe Generative AI in FP&A Market Revenue (US$ Mn) Comparison by By Organization Size (2018-2033)
- Figure 76: Eastern Europe Generative AI in FP&A Market Revenue (US$ Mn) Comparison by By Application (2018-2033)
- Figure 77: Eastern Europe Generative AI in FP&A Market Y-o-Y Growth Rate Comparison by Country (2018-2033)
- Figure 78: Eastern Europe Generative AI in FP&A Market Y-o-Y Growth Rate Comparison by By Deployment Mode (2018-2033)
- Figure 79: Eastern Europe Generative AI in FP&A Market Y-o-Y Growth Rate Comparison by By Organization Size (2018-2033)
- Figure 80: Eastern Europe Generative AI in FP&A Market Y-o-Y Growth Rate Comparison by By Application (2018-2033)
- Figure 81: Eastern Europe Generative AI in FP&A Market Share Comparison by Country (2018-2033)
- Figure 82: Eastern Europe Generative AI in FP&A Market Share Comparison by By Deployment Mode (2018-2033)
- Figure 83: Eastern Europe Generative AI in FP&A Market Share Comparison by By Organization Size (2018-2033)
- Figure 84: Eastern Europe Generative AI in FP&A Market Share Comparison by By Application (2018-2033)
- Figure 85: APAC Generative AI in FP&A Market Revenue (US$ Mn) Market Share by By Deployment Modein 2022
- Figure 86: APAC Generative AI in FP&A Market Attractiveness Analysis by By Deployment Mode, 2018-2033
- Figure 87: APAC Generative AI in FP&A Market Revenue (US$ Mn) Market Share by By Organization Sizein 2022
- Figure 88: APAC Generative AI in FP&A Market Attractiveness Analysis by By Organization Size, 2018-2033
- Figure 89: APAC Generative AI in FP&A Market Revenue (US$ Mn) Market Share by By Applicationin 2022
- Figure 90: APAC Generative AI in FP&A Market Attractiveness Analysis by By Application, 2018-2033
- Figure 91: APAC Generative AI in FP&A Market Revenue (US$ Mn) Market Share by Country in 2022
- Figure 92: APAC Generative AI in FP&A Market Attractiveness Analysis by Country, 2018-2033
- Figure 93: APAC Generative AI in FP&A Market Revenue (US$ Mn) (2018-2033)
- Figure 94: APAC Generative AI in FP&A Market Revenue (US$ Mn) Comparison by Country (2018-2033)
- Figure 95: APAC Generative AI in FP&A Market Revenue (US$ Mn) Comparison by By Deployment Mode (2018-2033)
- Figure 96: APAC Generative AI in FP&A Market Revenue (US$ Mn) Comparison by By Organization Size (2018-2033)
- Figure 97: APAC Generative AI in FP&A Market Revenue (US$ Mn) Comparison by By Application (2018-2033)
- Figure 98: APAC Generative AI in FP&A Market Y-o-Y Growth Rate Comparison by Country (2018-2033)
- Figure 99: APAC Generative AI in FP&A Market Y-o-Y Growth Rate Comparison by By Deployment Mode (2018-2033)
- Figure 100: APAC Generative AI in FP&A Market Y-o-Y Growth Rate Comparison by By Organization Size (2018-2033)
- Figure 101: APAC Generative AI in FP&A Market Y-o-Y Growth Rate Comparison by By Application (2018-2033)
- Figure 102: APAC Generative AI in FP&A Market Share Comparison by Country (2018-2033)
- Figure 103: APAC Generative AI in FP&A Market Share Comparison by By Deployment Mode (2018-2033)
- Figure 104: APAC Generative AI in FP&A Market Share Comparison by By Organization Size (2018-2033)
- Figure 105: APAC Generative AI in FP&A Market Share Comparison by By Application (2018-2033)
- Figure 106: Latin America Generative AI in FP&A Market Revenue (US$ Mn) Market Share by By Deployment Modein 2022
- Figure 107: Latin America Generative AI in FP&A Market Attractiveness Analysis by By Deployment Mode, 2018-2033
- Figure 108: Latin America Generative AI in FP&A Market Revenue (US$ Mn) Market Share by By Organization Sizein 2022
- Figure 109: Latin America Generative AI in FP&A Market Attractiveness Analysis by By Organization Size, 2018-2033
- Figure 110: Latin America Generative AI in FP&A Market Revenue (US$ Mn) Market Share by By Applicationin 2022
- Figure 111: Latin America Generative AI in FP&A Market Attractiveness Analysis by By Application, 2018-2033
- Figure 112: Latin America Generative AI in FP&A Market Revenue (US$ Mn) Market Share by Country in 2022
- Figure 113: Latin America Generative AI in FP&A Market Attractiveness Analysis by Country, 2018-2033
- Figure 114: Latin America Generative AI in FP&A Market Revenue (US$ Mn) (2018-2033)
- Figure 115: Latin America Generative AI in FP&A Market Revenue (US$ Mn) Comparison by Country (2018-2033)
- Figure 116: Latin America Generative AI in FP&A Market Revenue (US$ Mn) Comparison by By Deployment Mode (2018-2033)
- Figure 117: Latin America Generative AI in FP&A Market Revenue (US$ Mn) Comparison by By Organization Size (2018-2033)
- Figure 118: Latin America Generative AI in FP&A Market Revenue (US$ Mn) Comparison by By Application (2018-2033)
- Figure 119: Latin America Generative AI in FP&A Market Y-o-Y Growth Rate Comparison by Country (2018-2033)
- Figure 120: Latin America Generative AI in FP&A Market Y-o-Y Growth Rate Comparison by By Deployment Mode (2018-2033)
- Figure 121: Latin America Generative AI in FP&A Market Y-o-Y Growth Rate Comparison by By Organization Size (2018-2033)
- Figure 122: Latin America Generative AI in FP&A Market Y-o-Y Growth Rate Comparison by By Application (2018-2033)
- Figure 123: Latin America Generative AI in FP&A Market Share Comparison by Country (2018-2033)
- Figure 124: Latin America Generative AI in FP&A Market Share Comparison by By Deployment Mode (2018-2033)
- Figure 125: Latin America Generative AI in FP&A Market Share Comparison by By Organization Size (2018-2033)
- Figure 126: Latin America Generative AI in FP&A Market Share Comparison by By Application (2018-2033)
- Figure 127: Middle East & Africa Generative AI in FP&A Market Revenue (US$ Mn) Market Share by By Deployment Modein 2022
- Figure 128: Middle East & Africa Generative AI in FP&A Market Attractiveness Analysis by By Deployment Mode, 2018-2033
- Figure 129: Middle East & Africa Generative AI in FP&A Market Revenue (US$ Mn) Market Share by By Organization Sizein 2022
- Figure 130: Middle East & Africa Generative AI in FP&A Market Attractiveness Analysis by By Organization Size, 2018-2033
- Figure 131: Middle East & Africa Generative AI in FP&A Market Revenue (US$ Mn) Market Share by By Applicationin 2022
- Figure 132: Middle East & Africa Generative AI in FP&A Market Attractiveness Analysis by By Application, 2018-2033
- Figure 133: Middle East & Africa Generative AI in FP&A Market Revenue (US$ Mn) Market Share by Country in 2022
- Figure 134: Middle East & Africa Generative AI in FP&A Market Attractiveness Analysis by Country, 2018-2033
- Figure 135: Middle East & Africa Generative AI in FP&A Market Revenue (US$ Mn) (2018-2033)
- Figure 136: Middle East & Africa Generative AI in FP&A Market Revenue (US$ Mn) Comparison by Country (2018-2033)
- Figure 137: Middle East & Africa Generative AI in FP&A Market Revenue (US$ Mn) Comparison by By Deployment Mode (2018-2033)
- Figure 138: Middle East & Africa Generative AI in FP&A Market Revenue (US$ Mn) Comparison by By Organization Size (2018-2033)
- Figure 139: Middle East & Africa Generative AI in FP&A Market Revenue (US$ Mn) Comparison by By Application (2018-2033)
- Figure 140: Middle East & Africa Generative AI in FP&A Market Y-o-Y Growth Rate Comparison by Country (2018-2033)
- Figure 141: Middle East & Africa Generative AI in FP&A Market Y-o-Y Growth Rate Comparison by By Deployment Mode (2018-2033)
- Figure 142: Middle East & Africa Generative AI in FP&A Market Y-o-Y Growth Rate Comparison by By Organization Size (2018-2033)
- Figure 143: Middle East & Africa Generative AI in FP&A Market Y-o-Y Growth Rate Comparison by By Application (2018-2033)
- Figure 144: Middle East & Africa Generative AI in FP&A Market Share Comparison by Country (2018-2033)
- Figure 145: Middle East & Africa Generative AI in FP&A Market Share Comparison by By Deployment Mode (2018-2033)
- Figure 146: Middle East & Africa Generative AI in FP&A Market Share Comparison by By Organization Size (2018-2033)
- Figure 147: Middle East & Africa Generative AI in FP&A Market Share Comparison by By Application (2018-2033)
"
- List of Tables
- "
- Table 1: Global Generative AI in FP&A Market Comparison by By Deployment Mode (2018-2033)
- Table 2: Global Generative AI in FP&A Market Comparison by By Organization Size (2018-2033)
- Table 3: Global Generative AI in FP&A Market Comparison by By Application (2018-2033)
- Table 4: Global Generative AI in FP&A Market Revenue (US$ Mn) Comparison by Region (2018-2033)
- Table 5: Global Generative AI in FP&A Market Revenue (US$ Mn) (2018-2033)
- Table 6: Global Generative AI in FP&A Market Revenue (US$ Mn) Comparison by Region (2018-2033)
- Table 7: Global Generative AI in FP&A Market Revenue (US$ Mn) Comparison by By Deployment Mode (2018-2033)
- Table 8: Global Generative AI in FP&A Market Revenue (US$ Mn) Comparison by By Organization Size (2018-2033)
- Table 9: Global Generative AI in FP&A Market Revenue (US$ Mn) Comparison by By Application (2018-2033)
- Table 10: Global Generative AI in FP&A Market Y-o-Y Growth Rate Comparison by Region (2018-2033)
- Table 11: Global Generative AI in FP&A Market Y-o-Y Growth Rate Comparison by By Deployment Mode (2018-2033)
- Table 12: Global Generative AI in FP&A Market Y-o-Y Growth Rate Comparison by By Organization Size (2018-2033)
- Table 13: Global Generative AI in FP&A Market Y-o-Y Growth Rate Comparison by By Application (2018-2033)
- Table 14: Global Generative AI in FP&A Market Share Comparison by Region (2018-2033)
- Table 15: Global Generative AI in FP&A Market Share Comparison by By Deployment Mode (2018-2033)
- Table 16: Global Generative AI in FP&A Market Share Comparison by By Organization Size (2018-2033)
- Table 17: Global Generative AI in FP&A Market Share Comparison by By Application (2018-2033)
- Table 18: North America Generative AI in FP&A Market Comparison by By Organization Size (2018-2033)
- Table 19: North America Generative AI in FP&A Market Comparison by By Application (2018-2033)
- Table 20: North America Generative AI in FP&A Market Revenue (US$ Mn) Comparison by Country (2018-2033)
- Table 21: North America Generative AI in FP&A Market Revenue (US$ Mn) (2018-2033)
- Table 22: North America Generative AI in FP&A Market Revenue (US$ Mn) Comparison by Country (2018-2033)
- Table 23: North America Generative AI in FP&A Market Revenue (US$ Mn) Comparison by By Deployment Mode (2018-2033)
- Table 24: North America Generative AI in FP&A Market Revenue (US$ Mn) Comparison by By Organization Size (2018-2033)
- Table 25: North America Generative AI in FP&A Market Revenue (US$ Mn) Comparison by By Application (2018-2033)
- Table 26: North America Generative AI in FP&A Market Y-o-Y Growth Rate Comparison by Country (2018-2033)
- Table 27: North America Generative AI in FP&A Market Y-o-Y Growth Rate Comparison by By Deployment Mode (2018-2033)
- Table 28: North America Generative AI in FP&A Market Y-o-Y Growth Rate Comparison by By Organization Size (2018-2033)
- Table 29: North America Generative AI in FP&A Market Y-o-Y Growth Rate Comparison by By Application (2018-2033)
- Table 30: North America Generative AI in FP&A Market Share Comparison by Country (2018-2033)
- Table 31: North America Generative AI in FP&A Market Share Comparison by By Deployment Mode (2018-2033)
- Table 32: North America Generative AI in FP&A Market Share Comparison by By Organization Size (2018-2033)
- Table 33: North America Generative AI in FP&A Market Share Comparison by By Application (2018-2033)
- Table 34: Western Europe Generative AI in FP&A Market Comparison by By Deployment Mode (2018-2033)
- Table 35: Western Europe Generative AI in FP&A Market Comparison by By Organization Size (2018-2033)
- Table 36: Western Europe Generative AI in FP&A Market Comparison by By Application (2018-2033)
- Table 37: Western Europe Generative AI in FP&A Market Revenue (US$ Mn) Comparison by Country (2018-2033)
- Table 38: Western Europe Generative AI in FP&A Market Revenue (US$ Mn) (2018-2033)
- Table 39: Western Europe Generative AI in FP&A Market Revenue (US$ Mn) Comparison by Country (2018-2033)
- Table 40: Western Europe Generative AI in FP&A Market Revenue (US$ Mn) Comparison by By Deployment Mode (2018-2033)
- Table 41: Western Europe Generative AI in FP&A Market Revenue (US$ Mn) Comparison by By Organization Size (2018-2033)
- Table 42: Western Europe Generative AI in FP&A Market Revenue (US$ Mn) Comparison by By Application (2018-2033)
- Table 43: Western Europe Generative AI in FP&A Market Y-o-Y Growth Rate Comparison by Country (2018-2033)
- Table 44: Western Europe Generative AI in FP&A Market Y-o-Y Growth Rate Comparison by By Deployment Mode (2018-2033)
- Table 45: Western Europe Generative AI in FP&A Market Y-o-Y Growth Rate Comparison by By Organization Size (2018-2033)
- Table 46: Western Europe Generative AI in FP&A Market Y-o-Y Growth Rate Comparison by By Application (2018-2033)
- Table 47: Western Europe Generative AI in FP&A Market Share Comparison by Country (2018-2033)
- Table 48: Western Europe Generative AI in FP&A Market Share Comparison by By Deployment Mode (2018-2033)
- Table 49: Western Europe Generative AI in FP&A Market Share Comparison by By Organization Size (2018-2033)
- Table 50: Western Europe Generative AI in FP&A Market Share Comparison by By Application (2018-2033)
- Table 51: Eastern Europe Generative AI in FP&A Market Comparison by By Deployment Mode (2018-2033)
- Table 52: Eastern Europe Generative AI in FP&A Market Comparison by By Organization Size (2018-2033)
- Table 53: Eastern Europe Generative AI in FP&A Market Comparison by By Application (2018-2033)
- Table 54: Eastern Europe Generative AI in FP&A Market Revenue (US$ Mn) Comparison by Country (2018-2033)
- Table 55: Eastern Europe Generative AI in FP&A Market Revenue (US$ Mn) (2018-2033)
- Table 56: Eastern Europe Generative AI in FP&A Market Revenue (US$ Mn) Comparison by Country (2018-2033)
- Table 57: Eastern Europe Generative AI in FP&A Market Revenue (US$ Mn) Comparison by By Deployment Mode (2018-2033)
- Table 58: Eastern Europe Generative AI in FP&A Market Revenue (US$ Mn) Comparison by By Organization Size (2018-2033)
- Table 59: Eastern Europe Generative AI in FP&A Market Revenue (US$ Mn) Comparison by By Application (2018-2033)
- Table 60: Eastern Europe Generative AI in FP&A Market Y-o-Y Growth Rate Comparison by Country (2018-2033)
- Table 61: Eastern Europe Generative AI in FP&A Market Y-o-Y Growth Rate Comparison by By Deployment Mode (2018-2033)
- Table 62: Eastern Europe Generative AI in FP&A Market Y-o-Y Growth Rate Comparison by By Organization Size (2018-2033)
- Table 63: Eastern Europe Generative AI in FP&A Market Y-o-Y Growth Rate Comparison by By Application (2018-2033)
- Table 64: Eastern Europe Generative AI in FP&A Market Share Comparison by Country (2018-2033)
- Table 65: Eastern Europe Generative AI in FP&A Market Share Comparison by By Deployment Mode (2018-2033)
- Table 66: Eastern Europe Generative AI in FP&A Market Share Comparison by By Organization Size (2018-2033)
- Table 67: Eastern Europe Generative AI in FP&A Market Share Comparison by By Application (2018-2033)
- Table 68: APAC Generative AI in FP&A Market Comparison by By Deployment Mode (2018-2033)
- Table 69: APAC Generative AI in FP&A Market Comparison by By Organization Size (2018-2033)
- Table 70: APAC Generative AI in FP&A Market Comparison by By Application (2018-2033)
- Table 71: APAC Generative AI in FP&A Market Revenue (US$ Mn) Comparison by Country (2018-2033)
- Table 72: APAC Generative AI in FP&A Market Revenue (US$ Mn) (2018-2033)
- Table 73: APAC Generative AI in FP&A Market Revenue (US$ Mn) Comparison by Country (2018-2033)
- Table 74: APAC Generative AI in FP&A Market Revenue (US$ Mn) Comparison by By Deployment Mode (2018-2033)
- Table 75: APAC Generative AI in FP&A Market Revenue (US$ Mn) Comparison by By Organization Size (2018-2033)
- Table 76: APAC Generative AI in FP&A Market Revenue (US$ Mn) Comparison by By Application (2018-2033)
- Table 77: APAC Generative AI in FP&A Market Y-o-Y Growth Rate Comparison by Country (2018-2033)
- Table 78: APAC Generative AI in FP&A Market Y-o-Y Growth Rate Comparison by By Deployment Mode (2018-2033)
- Table 79: APAC Generative AI in FP&A Market Y-o-Y Growth Rate Comparison by By Organization Size (2018-2033)
- Table 80: APAC Generative AI in FP&A Market Y-o-Y Growth Rate Comparison by By Application (2018-2033)
- Table 81: APAC Generative AI in FP&A Market Share Comparison by Country (2018-2033)
- Table 82: APAC Generative AI in FP&A Market Share Comparison by By Deployment Mode (2018-2033)
- Table 83: APAC Generative AI in FP&A Market Share Comparison by By Organization Size (2018-2033)
- Table 84: APAC Generative AI in FP&A Market Share Comparison by By Application (2018-2033)
- Table 85: Latin America Generative AI in FP&A Market Comparison by By Deployment Mode (2018-2033)
- Table 86: Latin America Generative AI in FP&A Market Comparison by By Organization Size (2018-2033)
- Table 87: Latin America Generative AI in FP&A Market Comparison by By Application (2018-2033)
- Table 88: Latin America Generative AI in FP&A Market Revenue (US$ Mn) Comparison by Country (2018-2033)
- Table 89: Latin America Generative AI in FP&A Market Revenue (US$ Mn) (2018-2033)
- Table 90: Latin America Generative AI in FP&A Market Revenue (US$ Mn) Comparison by Country (2018-2033)
- Table 91: Latin America Generative AI in FP&A Market Revenue (US$ Mn) Comparison by By Deployment Mode (2018-2033)
- Table 92: Latin America Generative AI in FP&A Market Revenue (US$ Mn) Comparison by By Organization Size (2018-2033)
- Table 93: Latin America Generative AI in FP&A Market Revenue (US$ Mn) Comparison by By Application (2018-2033)
- Table 94: Latin America Generative AI in FP&A Market Y-o-Y Growth Rate Comparison by Country (2018-2033)
- Table 95: Latin America Generative AI in FP&A Market Y-o-Y Growth Rate Comparison by By Deployment Mode (2018-2033)
- Table 96: Latin America Generative AI in FP&A Market Y-o-Y Growth Rate Comparison by By Organization Size (2018-2033)
- Table 97: Latin America Generative AI in FP&A Market Y-o-Y Growth Rate Comparison by By Application (2018-2033)
- Table 98: Latin America Generative AI in FP&A Market Share Comparison by Country (2018-2033)
- Table 99: Latin America Generative AI in FP&A Market Share Comparison by By Deployment Mode (2018-2033)
- Table 100: Latin America Generative AI in FP&A Market Share Comparison by By Organization Size (2018-2033)
- Table 101: Latin America Generative AI in FP&A Market Share Comparison by By Application (2018-2033)
- Table 102: Middle East & Africa Generative AI in FP&A Market Comparison by By Deployment Mode (2018-2033)
- Table 103: Middle East & Africa Generative AI in FP&A Market Comparison by By Organization Size (2018-2033)
- Table 104: Middle East & Africa Generative AI in FP&A Market Comparison by By Application (2018-2033)
- Table 105: Middle East & Africa Generative AI in FP&A Market Revenue (US$ Mn) Comparison by Country (2018-2033)
- Table 106: Middle East & Africa Generative AI in FP&A Market Revenue (US$ Mn) (2018-2033)
- Table 107: Middle East & Africa Generative AI in FP&A Market Revenue (US$ Mn) Comparison by Country (2018-2033)
- Table 108: Middle East & Africa Generative AI in FP&A Market Revenue (US$ Mn) Comparison by By Deployment Mode (2018-2033)
- Table 109: Middle East & Africa Generative AI in FP&A Market Revenue (US$ Mn) Comparison by By Organization Size (2018-2033)
- Table 110: Middle East & Africa Generative AI in FP&A Market Revenue (US$ Mn) Comparison by By Application (2018-2033)
- Table 111: Middle East & Africa Generative AI in FP&A Market Y-o-Y Growth Rate Comparison by Country (2018-2033)
- Table 112: Middle East & Africa Generative AI in FP&A Market Y-o-Y Growth Rate Comparison by By Deployment Mode (2018-2033)
- Table 113: Middle East & Africa Generative AI in FP&A Market Y-o-Y Growth Rate Comparison by By Organization Size (2018-2033)
- Table 114: Middle East & Africa Generative AI in FP&A Market Y-o-Y Growth Rate Comparison by By Application (2018-2033)
- Table 115: Middle East & Africa Generative AI in FP&A Market Share Comparison by Country (2018-2033)
- Table 116: Middle East & Africa Generative AI in FP&A Market Share Comparison by By Deployment Mode (2018-2033)
- Table 117: Middle East & Africa Generative AI in FP&A Market Share Comparison by By Organization Size (2016-2033)
- Table 118: Middle East & Africa Generative AI in FP&A Market Share Comparison by By Application (2016-2033)
- 1. Executive Summary
-
- IBM Corporation
- SAP SE
- Oracle Corporation
- SAS Institute Inc.
- Microsoft Corporation
- Anaplan Inc.
- Adaptive Insights (a Workday Company)
- FICO (Fair Isaac Corporation)
- Tagetik Software (a Wolters Kluwer Company)
- Vena Solutions Inc.
- Qlik Technologies Inc.
- Other Key Players
Our Clients


View Our Licence Options
