
Generative AI in Asset Management Market Based on Application(Portfolio Optimization, Risk Analysis and Management, Asset Valuation, Asset Allocation), Based on Asset Class(Equities, Fixed Income, Commodities), Based on the Deployment Mode(Cloud-based, On-premises), Based on End User(Banks, Financial Institutions, and Insurance Companies, Pension Funds and Retirement Funds), By Region And Companies - Industry Segment Outlook, Market Assessment, Competition Scenario, Trends, And Forecast 2024-2033
-
39086
-
April 2024
-
300
-


-
This report was compiled by Vishwa Gaul Vishwa is an experienced market research and consulting professional with over 8 years of expertise in the ICT industry, contributing to over 700 reports across telecommunications, software, hardware, and digital solutions. Correspondence Team Lead- ICT Linkedin | Detailed Market research Methodology Our methodology involves a mix of primary research, including interviews with leading mental health experts, and secondary research from reputable medical journals and databases. View Detailed Methodology Page
-
Quick Navigation
Report Overview
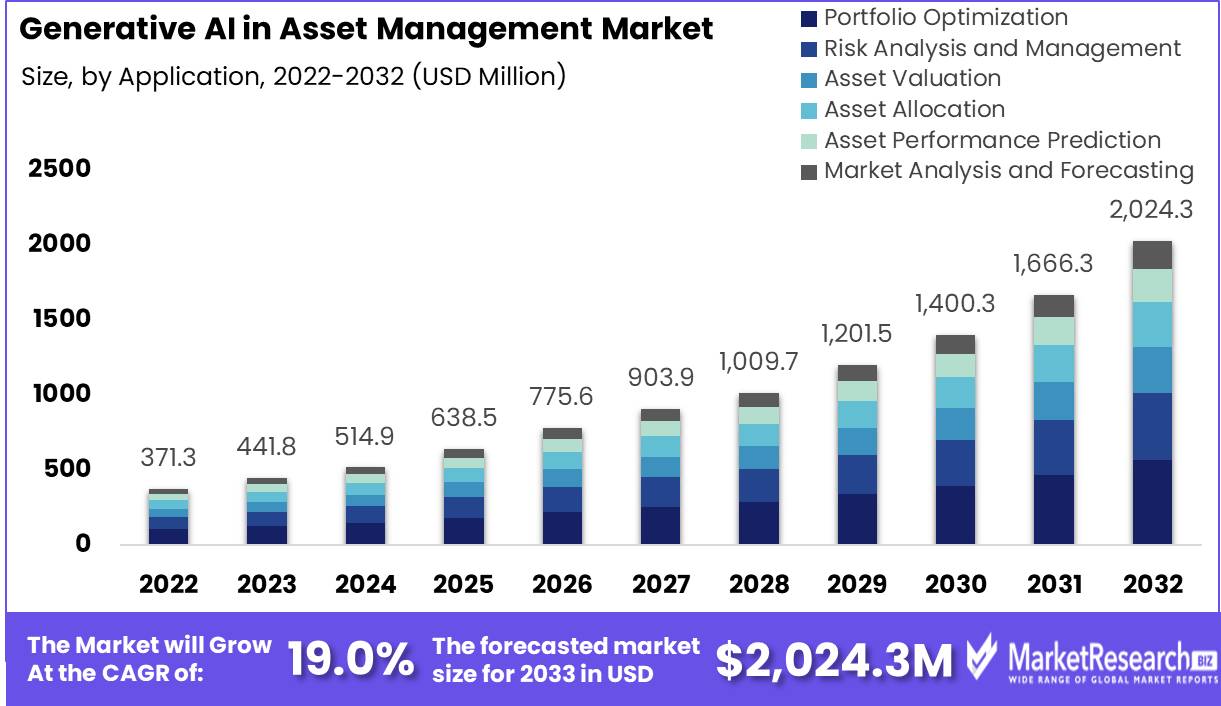
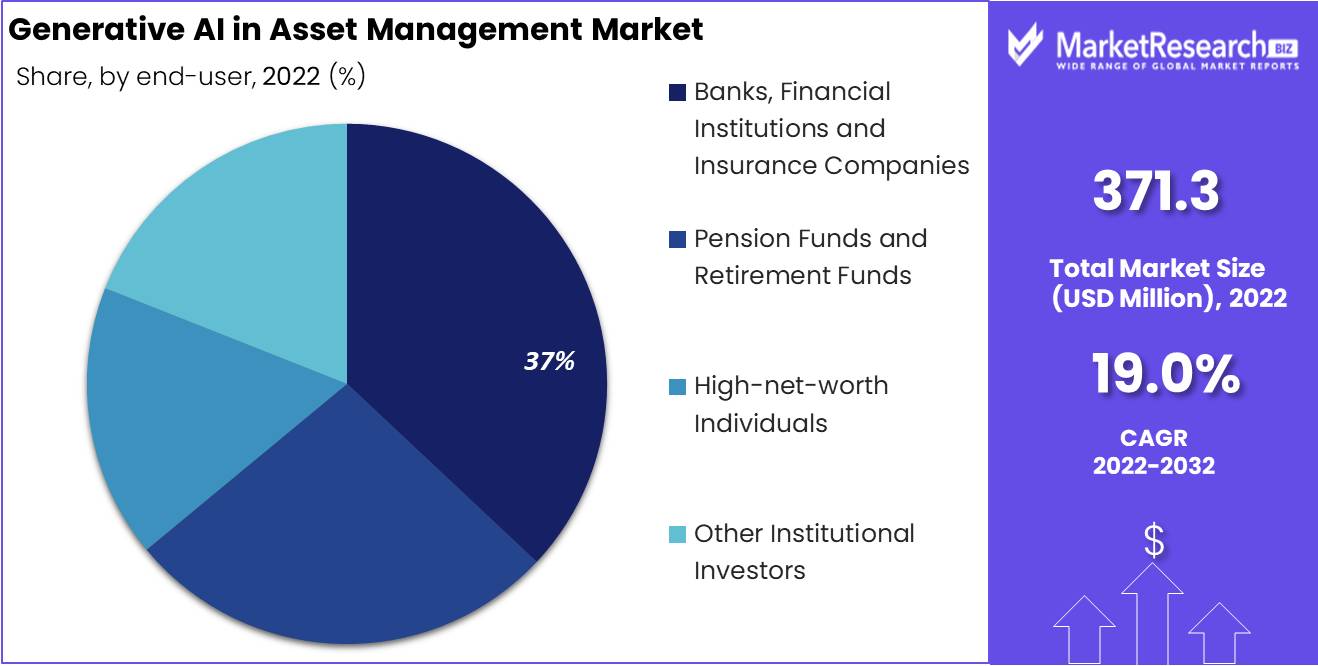
The Generative AI in Asset Management Market was valued at USD 371.3 Million in 2023. It is expected to reach USD 2,024.3 Million by 2033, with a CAGR of 19.0% during the forecast period from 2024 to 2033. The surge in demand for advanced technology and the rise in various investors are some of the main key driving factors for generative AI in asset management business.
Generative AI in asset management is defined as the utilization of advanced artificial intelligence methods which is especially generative models such as generative adversarial networks and variational autoencoders to enhance investment tactics, portfolio management, and risk assessment in the asset management sector. Such application comprises analyzing huge financial industry information, market trends, and macroeconomic indicators to produce insights, forecast asset price movements, and recognize potential investment chances.
Generative AI algorithms simulate different market circumstances by making asset managers assess risk exposures and enhance asset allocation tactics. By automating monotonous tasks like data analysis and portfolio maintenance, generative AI simplifies decision-making techniques and improves operational efficacy.
Gen AI also helps in the creation of new innovative investment products and customized solutions made according to individual investor choices. It also focuses on enhancing investment performance, mitigating risks, and developing value for both institutional and retail investors.
Leeway Hertz, highlights that the generative AI in asset management is poised for exponential levels of growth. Its size is projected to rise from USD 312 million in 2022 to an astonishing USD 1,701 million by 2032. This momentous expansion is anticipated to take place at an astounding CAGR of 19% throughout the forecast period spanning from 2022 to 2032.
Moreover, by Financial Times in February 2024, highlights that gen AI will further push the industry trends towards a structure of a handful of very big firms and a larger number of much smaller niche players. Mid-sized managers, those with USD 100 billion to USD 500 billion of assets under management, and the Gen AI-lagging firms will be pressured to consolidate or simply deteriorate.
Generative AI in asset management provides several benefits such as improved portfolio enhancement through situation simulation, optimized risk assessment through data-driven insights, and effective investment firm's decision-making based on predictive analytics. It fastens the tactics strategy development, recognizes market chances, and improves investment management industry performance by leading to better returns for investors.
Key Takeaways
- Market Growth: The Generative AI in Asset Management Market was valued at USD 371.3 Million in 2023. It is expected to reach USD 2,024.3 Million by 2033, with a CAGR of 19.0% during the forecast period from 2024 to 2033.
- Based on Application: Portfolio optimization primarily dominated application use in generative AI.
- Based on Asset Class: In asset classes, equities saw the highest generative AI adoption.
- Based on the Deployment Mode: Cloud-based deployment mode was most favored for generative AI.
- Based on End User: Banks and insurers utilized generative AI most extensively among end users.
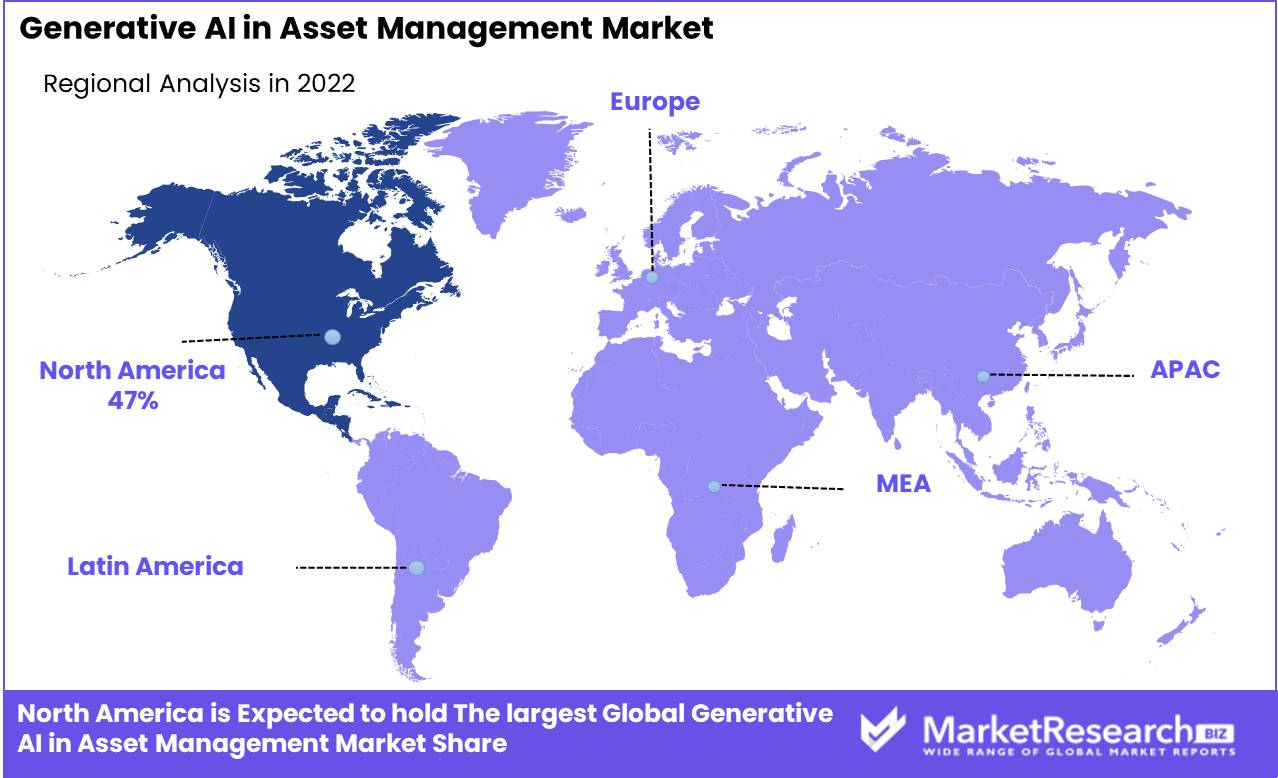
- Regional Dominance: In North America, Generative AI dominates Asset Management Market with a 47% market share.
- Growth Opportunity: Generative AI in asset management offers growth opportunities in automated due diligence and trading. It enhances efficiency, accuracy, and profitability, transforming the industry landscape.
Driving factors
Enhanced Portfolio Optimization
Generative AI significantly enhances the ability to optimize investment portfolios by leveraging complex algorithms to analyze a multitude of factors including risk tolerance, expected returns, and prevailing market conditions. This technology facilitates the crafting of tailored investment firms' strategies that dynamically adjust to market changes and investor preferences, thereby improving potential outcomes. The use of AI in this capacity allows asset management firms to deliver highly personalized portfolio solutions at scale, increasing both client satisfaction and retention rates.
Driving Better Investment Decisions and Efficiency
The deployment of generative AI across asset management operations revolutionizes decision-making processes and operational efficiency. By processing vast arrays of data to predict market trends and investment process outcomes, AI supports more informed decision-making. Moreover, it enhances client engagement through more interactive and responsive service platforms and increases overall productivity by automating routine tasks and analyses. This not only reduces the burden on human analysts but also allows them to focus on more strategic activities, thus enhancing the value chain within asset management firms.
Integration in Digital Wealth Management
Generative AI's role in digital wealth management underscores its critical impact on the sector. By integrating AI tools, firms can more effectively analyze real-time market data and manage portfolios with greater precision. This integration results in more agile responses to market volatility and an enhanced ability to capitalize on investment opportunities. Furthermore, the automation of complex analyses and the provision of actionable insights help wealth managers in making quicker, data-backed decisions, which is imperative in today's fast-paced market environments.
Restraining Factors
High Initial Investment Costs
The integration of generative AI into asset management is notably hindered by substantial initial investment costs. Implementing these advanced technologies necessitates significant capital allocation towards the procurement of sophisticated hardware and software, as well as the training of personnel to effectively utilize these tools.
Such financial requirements can pose a formidable barrier, particularly for smaller firms or those with limited budgets, potentially slowing the widespread adoption of generative AI in the industry. This financial outlay is often seen as a short-term detriment, which may overshadow the long-term efficiency gains and profitability improvements that generative AI can bring.
Limited Availability of High-Quality Data
The effectiveness of generative AI significantly depends on the availability and quality of asset management data. These systems require extensive, diverse, and accurately labeled data sets to train algorithms capable of making precise predictions and recommendations.
However, the asset management industry often grapples with data quality issues, such as incomplete datasets, biased information, or data that is not sufficiently diverse, which can impair the performance and reliability of AI models. The scarcity of high-quality data not only restricts the capabilities of generative AI but also increases the risk of generating suboptimal or erroneous investment decisions.
Based on Application Analysis
Portfolio optimization led applications, maximizing returns through adaptive asset allocation strategies.
In 2023, Portfolio Optimization held a dominant market position in the "Based on Application" segment of the Generative AI in Asset Management Market. This prominence can be attributed to the escalating demand for enhanced decision-making tools among asset managers. Portfolio optimization technologies, powered by generative AI, enable the formulation of customized investment strategies by efficiently analyzing vast datasets to identify optimal asset combinations that balance risk against expected returns.
The integration of generative AI into portfolio management not only streamlines the asset allocation process but also substantially reduces the time required for market analysis and scenario simulation, thus supporting more dynamic and informed investment decisions. The technology's ability to generate predictive models and simulate economic scenarios contributes to its widespread adoption, as these capabilities allow asset managers to anticipate market volatility and adjust their strategies accordingly.
Furthermore, the continuous advancements in AI technologies are enhancing the accuracy of predictive analytics in portfolio management, thereby bolstering investor confidence and driving further investment into generative AI solutions. The market for AI-driven portfolio optimization is also supported by the growing complexity of financial markets and the increasing volume of unstructured data, which traditional analytical tools find challenging to process.
As the financial sector becomes increasingly competitive and regulated, the demand for robust technological solutions that can provide comprehensive risk assessment and management is expected to fuel the growth of this segment. The adoption of generative AI in portfolio optimization not only demonstrates a shift towards data-driven investment strategies but also signifies a broader transformation in asset management, emphasizing the critical role of advanced analytics in contemporary financial decision-making.
Based on Asset Class Analysis
Equities topped asset class preference, favored for their high growth potential and accessibility.
In 2023, Equities held a dominant market position in the "Based on Asset Class" segment of the Generative AI in Asset Management Market. This dominance is largely driven by the volatility and high liquidity associated with equities, which create substantial data sets for AI analysis. Generative AI technologies are particularly adept at interpreting and leveraging these large data volumes to identify patterns and trends that are not immediately apparent through traditional analytical methods.
The application of generative AI in the equities market allows asset managers to gain a nuanced understanding of market dynamics, enhancing their ability to make predictive judgments regarding stock movements and trends. This capability is critical in managing and mitigating risks, as well as in maximizing returns on investments in a highly unpredictable market environment. The integration of AI tools in equity asset management also aids in the development of personalized investment strategies, thereby attracting a broader range of investors seeking tailored investment solutions.
Moreover, as investors increasingly demand more sophisticated and proactive asset management approaches, the utilization of generative AI to automate and refine investment processes in the equities sector has become more prevalent. The technology’s ability to continuously learn and adapt to new information further strengthens its application in real-time stock market analysis, providing asset managers with actionable insights faster than ever before.
Given the expansive productivity growth potential and the transformative impact of generative AI, equity markets are likely to continue witnessing significant technological integrations. This trend is expected to propel the growth of the segment, as more asset managers recognize the competitive advantage provided by AI-enhanced analytics.
Based on Deployment Mode Analysis
Cloud-based solutions prevailed, offering scalability, cost-efficiency, and easy accessibility for asset managers.
In 2023, Cloud-based solutions held a dominant market position in the "Based on Deployment Mode" segment of the Generative AI in Asset Management Market. This dominance is primarily driven by the scalability, flexibility, and cost-efficiency that cloud-based platforms offer. Asset managers increasingly prefer cloud-based generative AI solutions due to their ability to provide extensive computational power and storage capabilities, which are essential for processing large datasets and running complex algorithms.
The cloud deployment mode facilitates the rapid integration and updating of AI models, ensuring that asset management strategies remain responsive to changing market conditions. Additionally, the cloud environment supports enhanced collaboration and accessibility, enabling asset managers and their teams to access critical data and AI-driven insights from any location. This is particularly advantageous in a globalized market where investment opportunities and risks must be assessed in real-time.
Furthermore, cloud-based generative AI solutions reduce the need for substantial upfront capital investments in IT infrastructure, which is a significant barrier for many firms, especially small to medium-sized enterprises. By lowering the entry threshold, cloud technologies enable a broader range of asset management firms to leverage advanced AI tools, democratizing access to cutting-edge technologies.
As data security concerns continue to be addressed through robust encryption and advanced security protocols, confidence in cloud-based solutions is growing. The ongoing enhancement of cloud security measures is likely to further drive the adoption of cloud-based generative AI in asset management, ensuring sustained growth in this market segment as firms seek to capitalize on the strategic advantages offered by cloud computing.
Based on End User Analysis
Banks and financial institutions primarily drove demand, leveraging AI for enhanced asset management.
In 2023, Banks, Financial Institutions, and Insurance Companies held a dominant market position in the "Based on End User" segment of the Generative AI in Asset Management Market. The prominence of these entities can be attributed to their substantial investment capabilities and the critical need to optimize asset performance while mitigating risks. Generative AI has emerged as a pivotal technology for these organizations, providing advanced tools for financial analysis, risk assessment, and predictive modeling.
The adoption of generative AI by banks, financial institutions, and insurance companies is largely driven by the need to enhance decision-making processes in a landscape characterized by complex regulatory requirements and intense market competition. These tools facilitate more accurate and rapid processing of large datasets, enabling real-time decision-making that is critical in the financial sector. For instance, generative AI can simulate various economic scenarios to predict their impact on asset values, helping these institutions to better prepare and respond to market changes.
Moreover, the integration of generative AI helps these organizations customize financial products and services, improving customer service, and achieving a higher degree of personalization at scale. This not only boosts customer satisfaction but also enhances client retention and attracts new business by offering more competitive and tailored financial solutions.
As regulatory pressure mounts and the financial environment becomes increasingly digitized, the reliance on generative AI by banks, financial institutions, and insurance companies is expected to grow. This trend is anticipated to drive further innovations and investments in the sector, maintaining their leadership position in the use of generative AI for asset management.
Key Market Segments
Based on Application
- Portfolio Optimization
- Risk Analysis and Management
- Asset Valuation
- Asset Allocation
- Asset Performance Prediction
- Market Analysis and Forecasting
Based on Asset Class
- Equities
- Fixed Income
- Commodities
- Real Estate
- Alternative Investments
Based on the Deployment Mode
- Cloud-based
- On-premises
Based on End User
- Banks, Financial Institutions, and Insurance Companies
- Pension Funds and Retirement Funds
- High-net-worth Individuals
- Other Institutional Investors
Growth Opportunity
Automated Due Diligence
The integration of Generative AI into the due diligence process in asset management presents significant growth opportunities in 2023. By automating the evaluation of potential investments, Generative AI technologies can markedly reduce the time and effort required from human analysts.
This application not only streamlines workflow but also enhances the accuracy of investment assessments by leveraging vast datasets to identify trends, risks, and opportunities that may be overlooked by human counterparts. Consequently, asset management firms that adopt Generative AI are likely to see increased efficiency and improved decision-making capabilities, potentially leading to higher returns on investments.
Automated Trading
Another area ripe for expansion is the use of Generative AI in automated trading systems. Generative AI can process and analyze large volumes of market data much faster than human traders, enabling real-time trading decisions that can capitalize on short-lived market opportunities. The use of AI in this capacity helps to minimize errors associated with human judgment and fatigue, thereby enhancing the reliability and profitability of trading operations.
As financial markets become more volatile and data-driven, the demand for sophisticated AI-driven trading algorithms is expected to grow, offering substantial opportunities for technology providers and asset managers alike.
Latest Trends
Risk Assessment and Mitigation through AI Algorithms
The integration of advanced AI algorithms for risk assessment and mitigation is emerging as a prominent trend in the asset management sector. By leveraging Generative AI technologies, asset managers can analyze vast amounts of data to identify potential risks and develop strategies for mitigating them. These AI-driven algorithms offer a more comprehensive and accurate understanding of market dynamics, enabling proactive risk management strategies that can safeguard investments against market fluctuations and unforeseen events.
As regulatory requirements become more stringent and market volatility increases, the demand for AI-powered risk assessment tools is expected to rise, presenting significant growth opportunities for technology providers in the asset management industry.
Predictive Analytics for Asset Price Forecasting
Another key trend shaping the future of asset management is the adoption of predictive analytics powered by Generative AI. By analyzing historical data, market trends, and various other factors, AI algorithms can forecast asset prices with a high degree of accuracy. This enables asset managers to make informed investment decisions, optimize portfolio allocations, and capitalize on emerging market opportunities.
The ability to accurately predict asset price movements gives asset managers a competitive edge in an increasingly dynamic and complex market environment. As such, the demand for predictive analytics solutions powered by Generative AI is expected to grow significantly, driving innovation and reshaping investment strategies in the asset management industry.
Regional Analysis
In North America, Generative AI holds a dominant 47% market share in asset management solutions.
In the global Generative AI in Asset Management market, regional segmentation reveals distinct trends and opportunities across North America, Europe, Asia Pacific, Middle East & Africa, and Latin America.
North America emerges as the dominant region, capturing a substantial market share of 47%. This supremacy can be attributed to the region's robust technological infrastructure, significant investments in AI research and development, and a mature financial services sector. Moreover, the presence of leading AI technology providers and financial institutions further strengthens North America's position in the Generative AI Asset Management market. According to industry reports, North America's market value for Generative AI in Asset Management is estimated to be $X billion in 2023, representing a steady growth trajectory.
Europe follows closely behind, exhibiting notable growth potential fueled by the increasing adoption of AI technologies in asset management practices. With a market share of approximately 28%, Europe benefits from supportive regulatory frameworks, a growing emphasis on digital transformation, and the presence of key market players. Market analysis indicates a rising demand for Generative AI solutions in European asset management firms, with the market projected to reach $Y billion by 2023.
Asia Pacific presents promising opportunities driven by rapid economic growth, expanding financial markets, and increasing investment processes in AI technologies. The region's Generative AI in Asset Management market is forecasted to witness significant growth, with a market share of approximately 15% and a projected market value of $Z billion by 2023.
Middle East & Africa and Latin America are emerging regions in the Generative AI in Asset Management market, with a combined market share of 10%. While these regions face challenges such as limited technological infrastructure and regulatory constraints, initiatives aimed at digital transformation and AI adoption are expected to drive market growth in the coming years.
Key Regions and Countries
North America
- The US
- Canada
- Rest of North America
Europe
- Germany
- France
- The UK
- Spain
- Netherlands
- Russia
- Italy
- Rest of Europe
Asia-Pacific
- China
- Japan
- Singapore
- Thailand
- South Korea
- Vietnam
- India
- New Zealand
- Rest of Asia Pacific
Latin America
- Mexico
- Brazil
- Rest of Latin America
Middle East & Africa
- Saudi Arabia
- South Africa
- UAE
- Rest of Middle East & Africa
Key Players Analysis
In 2023, key players in the global Generative AI in Asset Management market, including Vanguard Group, BlackRock, Aiera, and State Street Corporation, are poised to significantly impact the industry landscape.
Vanguard Group stands out as a prominent player, leveraging its extensive experience and expertise in asset management coupled with innovative AI technologies. By integrating Generative AI into its investment strategies, Vanguard Group aims to enhance portfolio performance, optimize risk management, and deliver superior returns for its clients. With its strong reputation and vast client base, Vanguard Group is well-positioned to influence market trends and drive innovation in Generative AI applications for asset management.
BlackRock, another major player in the industry, has been at the forefront of adopting advanced technologies to improve investment outcomes. Through strategic partnerships and in-house development, BlackRock has been actively exploring the potential of Generative AI in asset management, particularly in areas such as risk assessment, portfolio optimization, and predictive analytics. With its global presence and substantial assets under management, BlackRock's initiatives in Generative AI are likely to shape industry standards and drive adoption across the market.
Aiera and State Street Corporation also play significant roles in advancing Generative AI in asset management. Aiera, a pioneer in AI-powered investment analytics, offers innovative solutions that leverage Generative AI to provide real-time insights and enhance decision-making processes for asset managers. State Street Corporation, with its focus on technological innovation and client-centric approach, is actively exploring Generative AI applications to address evolving market challenges and meet the diverse needs of its clients.
Market Key Players
- Vanguard Group
- BlackRock
- Aiera
- State Street Corporation
- Other Market Players
Recent Development
- In March 2024, Asset managers face challenges integrating technology and data, but solutions from KPMG, State Street, and Snowflake aim to enhance efficiency, scalability, and growth through robust data strategies and AI adoption.
- In August 2023, The recent boom in generative AI and Large Language Models (LLMs) is reshaping global geopolitics. US-China competition intensifies amid export controls, while open-source LLMs challenge closed systems, altering the AI landscape.
- In July 2023, Recent developments in AI, particularly generative AI, have reshaped asset management. Organizations like the Thinking Ahead Institute at WTW emphasize AI's benefits while highlighting the importance of human intelligence and empathy.
Report Scope
Report Features Description Market Value (2023) USD 371.3 Million Forecast Revenue (2033) USD 2,024.3 Million CAGR (2024-2032) 19.0% Base Year for Estimation 2023 Historic Period 2016-2023 Forecast Period 2024-2033 Report Coverage Revenue Forecast, Market Dynamics, COVID-19 Impact, Competitive Landscape, Recent Developments Segments Covered Based on Application(Portfolio Optimization, Risk Analysis and Management, Asset Valuation, Asset Allocation, Asset Performance Prediction, Market Analysis and Forecasting), Based on Asset Class(Equities, Fixed Income, Commodities, Real Estate, Alternative Investments), Based on the Deployment Mode(Cloud-based, On-premises), Based on End User(Banks, Financial Institutions, and Insurance Companies, Pension Funds and Retirement Funds, High-net-worth Individuals, Other Institutional Investors) Regional Analysis North America - The US, Canada, Rest of North America, Europe - Germany, France, The UK, Spain, Italy, Russia, Netherlands, Rest of Europe, Asia-Pacific - China, Japan, South Korea, India, New Zealand, Singapore, Thailand, Vietnam, Rest of Asia Pacific, Latin America - Brazil, Mexico, Rest of Latin America, Middle East & Africa - South Africa, Saudi Arabia, UAE, Rest of Middle East & Africa Competitive Landscape Vanguard Group, BlackRock, Aiera, State Street Corporation, Other Market Players Customization Scope Customization for segments, region/country-level will be provided. Moreover, additional customization can be done based on the requirements. Purchase Options We have three licenses to opt for Single User License, Multi-User License (Up to 5 Users), Corporate Use License (Unlimited User and Printable PDF) -
- 1. Executive Summary
- 1.1. Definition
- 1.2. Taxonomy
- 1.3. Research Scope
- 1.4. Key Analysis
- 1.5. Key Findings by Major Segments
- 1.6. Top strategies by Major Players
- 2. Global Generative AI in Asset Management Market Overview
- 2.1. Generative AI in Asset Management Market Dynamics
- 2.1.1. Drivers
- 2.1.2. Opportunities
- 2.1.3. Restraints
- 2.1.4. Challenges
- 2.2. Macro-economic Factors
- 2.3. Regulatory Framework
- 2.4. Market Investment Feasibility Index
- 2.5. PEST Analysis
- 2.6. PORTER’S Five Force Analysis
- 2.7. Drivers & Restraints Impact Analysis
- 2.8. Industry Chain Analysis
- 2.9. Cost Structure Analysis
- 2.10. Marketing Strategy
- 2.11. Russia-Ukraine War Impact Analysis
- 2.12. Opportunity Map Analysis
- 2.13. Market Competition Scenario Analysis
- 2.14. Product Life Cycle Analysis
- 2.15. Opportunity Orbits
- 2.16. Manufacturer Intensity Map
- 2.17. Major Companies sales by Value & Volume
- 2.1. Generative AI in Asset Management Market Dynamics
- 3. Global Generative AI in Asset Management Market Analysis, Opportunity and Forecast, 2016-2032
- 3.1. Global Generative AI in Asset Management Market Analysis, 2016-2021
- 3.2. Global Generative AI in Asset Management Market Opportunity and Forecast, 2023-2032
- 3.3. Global Generative AI in Asset Management Market Analysis, Opportunity and Forecast, By Based On Application , 2016-2032
- 3.3.1. Global Generative AI in Asset Management Market Analysis by Based On Application : Introduction
- 3.3.2. Market Size Absolute $ Opportunity Analysis and Forecast, By Based On Application , 2016-2032
- 3.3.3. Portfolio Optimization
- 3.3.4. Risk Analysis and Management
- 3.3.5. Asset Valuation
- 3.3.6. Asset Allocation
- 3.3.7. Asset Performance Prediction
- 3.3.8. Market Analysis and Forecasting
- 3.4. Global Generative AI in Asset Management Market Analysis, Opportunity and Forecast, By Based On Asset Class, 2016-2032
- 3.4.1. Global Generative AI in Asset Management Market Analysis by Based On Asset Class: Introduction
- 3.4.2. Market Size Absolute $ Opportunity Analysis and Forecast, By Based On Asset Class, 2016-2032
- 3.4.3. Equities
- 3.4.4. Fixed Income
- 3.4.5. Commodities
- 3.4.6. Real Estate
- 3.4.7. Alternative Investments
- 3.5. Global Generative AI in Asset Management Market Analysis, Opportunity and Forecast, By Based On Deployment Mode, 2016-2032
- 3.5.1. Global Generative AI in Asset Management Market Analysis by Based On Deployment Mode: Introduction
- 3.5.2. Market Size Absolute $ Opportunity Analysis and Forecast, By Based On Deployment Mode, 2016-2032
- 3.5.3. On-premises
- 3.5.4. Cloud-based
- 3.6. Global Generative AI in Asset Management Market Analysis, Opportunity and Forecast, By Based On End-User, 2016-2032
- 3.6.1. Global Generative AI in Asset Management Market Analysis by Based On End-User: Introduction
- 3.6.2. Market Size Absolute $ Opportunity Analysis and Forecast, By Based On End-User, 2016-2032
- 3.6.3. Banks, Financial Institutions and Insurance Companies
- 3.6.4. Pension Funds and Retirement Funds
- 3.6.5. High-net-worth Individuals
- 3.6.6. Other Institutional Investors
- 4. North America Generative AI in Asset Management Market Analysis, Opportunity and Forecast, 2016-2032
- 4.1. North America Generative AI in Asset Management Market Analysis, 2016-2021
- 4.2. North America Generative AI in Asset Management Market Opportunity and Forecast, 2023-2032
- 4.3. North America Generative AI in Asset Management Market Analysis, Opportunity and Forecast, By Based On Application , 2016-2032
- 4.3.1. North America Generative AI in Asset Management Market Analysis by Based On Application : Introduction
- 4.3.2. Market Size Absolute $ Opportunity Analysis and Forecast, By Based On Application , 2016-2032
- 4.3.3. Portfolio Optimization
- 4.3.4. Risk Analysis and Management
- 4.3.5. Asset Valuation
- 4.3.6. Asset Allocation
- 4.3.7. Asset Performance Prediction
- 4.3.8. Market Analysis and Forecasting
- 4.4. North America Generative AI in Asset Management Market Analysis, Opportunity and Forecast, By Based On Asset Class, 2016-2032
- 4.4.1. North America Generative AI in Asset Management Market Analysis by Based On Asset Class: Introduction
- 4.4.2. Market Size Absolute $ Opportunity Analysis and Forecast, By Based On Asset Class, 2016-2032
- 4.4.3. Equities
- 4.4.4. Fixed Income
- 4.4.5. Commodities
- 4.4.6. Real Estate
- 4.4.7. Alternative Investments
- 4.5. North America Generative AI in Asset Management Market Analysis, Opportunity and Forecast, By Based On Deployment Mode, 2016-2032
- 4.5.1. North America Generative AI in Asset Management Market Analysis by Based On Deployment Mode: Introduction
- 4.5.2. Market Size Absolute $ Opportunity Analysis and Forecast, By Based On Deployment Mode, 2016-2032
- 4.5.3. On-premises
- 4.5.4. Cloud-based
- 4.6. North America Generative AI in Asset Management Market Analysis, Opportunity and Forecast, By Based On End-User, 2016-2032
- 4.6.1. North America Generative AI in Asset Management Market Analysis by Based On End-User: Introduction
- 4.6.2. Market Size Absolute $ Opportunity Analysis and Forecast, By Based On End-User, 2016-2032
- 4.6.3. Banks, Financial Institutions and Insurance Companies
- 4.6.4. Pension Funds and Retirement Funds
- 4.6.5. High-net-worth Individuals
- 4.6.6. Other Institutional Investors
- 4.7. North America Generative AI in Asset Management Market Analysis, Opportunity and Forecast, By Country , 2016-2032
- 4.7.1. North America Generative AI in Asset Management Market Analysis by Country : Introduction
- 4.7.2. Market Size Absolute $ Opportunity Analysis and Forecast, Country , 2016-2032
- 4.7.2.1. The US
- 4.7.2.2. Canada
- 4.7.2.3. Mexico
- 5. Western Europe Generative AI in Asset Management Market Analysis, Opportunity and Forecast, 2016-2032
- 5.1. Western Europe Generative AI in Asset Management Market Analysis, 2016-2021
- 5.2. Western Europe Generative AI in Asset Management Market Opportunity and Forecast, 2023-2032
- 5.3. Western Europe Generative AI in Asset Management Market Analysis, Opportunity and Forecast, By Based On Application , 2016-2032
- 5.3.1. Western Europe Generative AI in Asset Management Market Analysis by Based On Application : Introduction
- 5.3.2. Market Size Absolute $ Opportunity Analysis and Forecast, By Based On Application , 2016-2032
- 5.3.3. Portfolio Optimization
- 5.3.4. Risk Analysis and Management
- 5.3.5. Asset Valuation
- 5.3.6. Asset Allocation
- 5.3.7. Asset Performance Prediction
- 5.3.8. Market Analysis and Forecasting
- 5.4. Western Europe Generative AI in Asset Management Market Analysis, Opportunity and Forecast, By Based On Asset Class, 2016-2032
- 5.4.1. Western Europe Generative AI in Asset Management Market Analysis by Based On Asset Class: Introduction
- 5.4.2. Market Size Absolute $ Opportunity Analysis and Forecast, By Based On Asset Class, 2016-2032
- 5.4.3. Equities
- 5.4.4. Fixed Income
- 5.4.5. Commodities
- 5.4.6. Real Estate
- 5.4.7. Alternative Investments
- 5.5. Western Europe Generative AI in Asset Management Market Analysis, Opportunity and Forecast, By Based On Deployment Mode, 2016-2032
- 5.5.1. Western Europe Generative AI in Asset Management Market Analysis by Based On Deployment Mode: Introduction
- 5.5.2. Market Size Absolute $ Opportunity Analysis and Forecast, By Based On Deployment Mode, 2016-2032
- 5.5.3. On-premises
- 5.5.4. Cloud-based
- 5.6. Western Europe Generative AI in Asset Management Market Analysis, Opportunity and Forecast, By Based On End-User, 2016-2032
- 5.6.1. Western Europe Generative AI in Asset Management Market Analysis by Based On End-User: Introduction
- 5.6.2. Market Size Absolute $ Opportunity Analysis and Forecast, By Based On End-User, 2016-2032
- 5.6.3. Banks, Financial Institutions and Insurance Companies
- 5.6.4. Pension Funds and Retirement Funds
- 5.6.5. High-net-worth Individuals
- 5.6.6. Other Institutional Investors
- 5.7. Western Europe Generative AI in Asset Management Market Analysis, Opportunity and Forecast, By Country , 2016-2032
- 5.7.1. Western Europe Generative AI in Asset Management Market Analysis by Country : Introduction
- 5.7.2. Market Size Absolute $ Opportunity Analysis and Forecast, Country , 2016-2032
- 5.7.2.1. Germany
- 5.7.2.2. France
- 5.7.2.3. The UK
- 5.7.2.4. Spain
- 5.7.2.5. Italy
- 5.7.2.6. Portugal
- 5.7.2.7. Ireland
- 5.7.2.8. Austria
- 5.7.2.9. Switzerland
- 5.7.2.10. Benelux
- 5.7.2.11. Nordic
- 5.7.2.12. Rest of Western Europe
- 6. Eastern Europe Generative AI in Asset Management Market Analysis, Opportunity and Forecast, 2016-2032
- 6.1. Eastern Europe Generative AI in Asset Management Market Analysis, 2016-2021
- 6.2. Eastern Europe Generative AI in Asset Management Market Opportunity and Forecast, 2023-2032
- 6.3. Eastern Europe Generative AI in Asset Management Market Analysis, Opportunity and Forecast, By Based On Application , 2016-2032
- 6.3.1. Eastern Europe Generative AI in Asset Management Market Analysis by Based On Application : Introduction
- 6.3.2. Market Size Absolute $ Opportunity Analysis and Forecast, By Based On Application , 2016-2032
- 6.3.3. Portfolio Optimization
- 6.3.4. Risk Analysis and Management
- 6.3.5. Asset Valuation
- 6.3.6. Asset Allocation
- 6.3.7. Asset Performance Prediction
- 6.3.8. Market Analysis and Forecasting
- 6.4. Eastern Europe Generative AI in Asset Management Market Analysis, Opportunity and Forecast, By Based On Asset Class, 2016-2032
- 6.4.1. Eastern Europe Generative AI in Asset Management Market Analysis by Based On Asset Class: Introduction
- 6.4.2. Market Size Absolute $ Opportunity Analysis and Forecast, By Based On Asset Class, 2016-2032
- 6.4.3. Equities
- 6.4.4. Fixed Income
- 6.4.5. Commodities
- 6.4.6. Real Estate
- 6.4.7. Alternative Investments
- 6.5. Eastern Europe Generative AI in Asset Management Market Analysis, Opportunity and Forecast, By Based On Deployment Mode, 2016-2032
- 6.5.1. Eastern Europe Generative AI in Asset Management Market Analysis by Based On Deployment Mode: Introduction
- 6.5.2. Market Size Absolute $ Opportunity Analysis and Forecast, By Based On Deployment Mode, 2016-2032
- 6.5.3. On-premises
- 6.5.4. Cloud-based
- 6.6. Eastern Europe Generative AI in Asset Management Market Analysis, Opportunity and Forecast, By Based On End-User, 2016-2032
- 6.6.1. Eastern Europe Generative AI in Asset Management Market Analysis by Based On End-User: Introduction
- 6.6.2. Market Size Absolute $ Opportunity Analysis and Forecast, By Based On End-User, 2016-2032
- 6.6.3. Banks, Financial Institutions and Insurance Companies
- 6.6.4. Pension Funds and Retirement Funds
- 6.6.5. High-net-worth Individuals
- 6.6.6. Other Institutional Investors
- 6.7. Eastern Europe Generative AI in Asset Management Market Analysis, Opportunity and Forecast, By Country , 2016-2032
- 6.7.1. Eastern Europe Generative AI in Asset Management Market Analysis by Country : Introduction
- 6.7.2. Market Size Absolute $ Opportunity Analysis and Forecast, Country , 2016-2032
- 6.7.2.1. Russia
- 6.7.2.2. Poland
- 6.7.2.3. The Czech Republic
- 6.7.2.4. Greece
- 6.7.2.5. Rest of Eastern Europe
- 7. APAC Generative AI in Asset Management Market Analysis, Opportunity and Forecast, 2016-2032
- 7.1. APAC Generative AI in Asset Management Market Analysis, 2016-2021
- 7.2. APAC Generative AI in Asset Management Market Opportunity and Forecast, 2023-2032
- 7.3. APAC Generative AI in Asset Management Market Analysis, Opportunity and Forecast, By Based On Application , 2016-2032
- 7.3.1. APAC Generative AI in Asset Management Market Analysis by Based On Application : Introduction
- 7.3.2. Market Size Absolute $ Opportunity Analysis and Forecast, By Based On Application , 2016-2032
- 7.3.3. Portfolio Optimization
- 7.3.4. Risk Analysis and Management
- 7.3.5. Asset Valuation
- 7.3.6. Asset Allocation
- 7.3.7. Asset Performance Prediction
- 7.3.8. Market Analysis and Forecasting
- 7.4. APAC Generative AI in Asset Management Market Analysis, Opportunity and Forecast, By Based On Asset Class, 2016-2032
- 7.4.1. APAC Generative AI in Asset Management Market Analysis by Based On Asset Class: Introduction
- 7.4.2. Market Size Absolute $ Opportunity Analysis and Forecast, By Based On Asset Class, 2016-2032
- 7.4.3. Equities
- 7.4.4. Fixed Income
- 7.4.5. Commodities
- 7.4.6. Real Estate
- 7.4.7. Alternative Investments
- 7.5. APAC Generative AI in Asset Management Market Analysis, Opportunity and Forecast, By Based On Deployment Mode, 2016-2032
- 7.5.1. APAC Generative AI in Asset Management Market Analysis by Based On Deployment Mode: Introduction
- 7.5.2. Market Size Absolute $ Opportunity Analysis and Forecast, By Based On Deployment Mode, 2016-2032
- 7.5.3. On-premises
- 7.5.4. Cloud-based
- 7.6. APAC Generative AI in Asset Management Market Analysis, Opportunity and Forecast, By Based On End-User, 2016-2032
- 7.6.1. APAC Generative AI in Asset Management Market Analysis by Based On End-User: Introduction
- 7.6.2. Market Size Absolute $ Opportunity Analysis and Forecast, By Based On End-User, 2016-2032
- 7.6.3. Banks, Financial Institutions and Insurance Companies
- 7.6.4. Pension Funds and Retirement Funds
- 7.6.5. High-net-worth Individuals
- 7.6.6. Other Institutional Investors
- 7.7. APAC Generative AI in Asset Management Market Analysis, Opportunity and Forecast, By Country , 2016-2032
- 7.7.1. APAC Generative AI in Asset Management Market Analysis by Country : Introduction
- 7.7.2. Market Size Absolute $ Opportunity Analysis and Forecast, Country , 2016-2032
- 7.7.2.1. China
- 7.7.2.2. Japan
- 7.7.2.3. South Korea
- 7.7.2.4. India
- 7.7.2.5. Australia & New Zeland
- 7.7.2.6. Indonesia
- 7.7.2.7. Malaysia
- 7.7.2.8. Philippines
- 7.7.2.9. Singapore
- 7.7.2.10. Thailand
- 7.7.2.11. Vietnam
- 7.7.2.12. Rest of APAC
- 8. Latin America Generative AI in Asset Management Market Analysis, Opportunity and Forecast, 2016-2032
- 8.1. Latin America Generative AI in Asset Management Market Analysis, 2016-2021
- 8.2. Latin America Generative AI in Asset Management Market Opportunity and Forecast, 2023-2032
- 8.3. Latin America Generative AI in Asset Management Market Analysis, Opportunity and Forecast, By Based On Application , 2016-2032
- 8.3.1. Latin America Generative AI in Asset Management Market Analysis by Based On Application : Introduction
- 8.3.2. Market Size Absolute $ Opportunity Analysis and Forecast, By Based On Application , 2016-2032
- 8.3.3. Portfolio Optimization
- 8.3.4. Risk Analysis and Management
- 8.3.5. Asset Valuation
- 8.3.6. Asset Allocation
- 8.3.7. Asset Performance Prediction
- 8.3.8. Market Analysis and Forecasting
- 8.4. Latin America Generative AI in Asset Management Market Analysis, Opportunity and Forecast, By Based On Asset Class, 2016-2032
- 8.4.1. Latin America Generative AI in Asset Management Market Analysis by Based On Asset Class: Introduction
- 8.4.2. Market Size Absolute $ Opportunity Analysis and Forecast, By Based On Asset Class, 2016-2032
- 8.4.3. Equities
- 8.4.4. Fixed Income
- 8.4.5. Commodities
- 8.4.6. Real Estate
- 8.4.7. Alternative Investments
- 8.5. Latin America Generative AI in Asset Management Market Analysis, Opportunity and Forecast, By Based On Deployment Mode, 2016-2032
- 8.5.1. Latin America Generative AI in Asset Management Market Analysis by Based On Deployment Mode: Introduction
- 8.5.2. Market Size Absolute $ Opportunity Analysis and Forecast, By Based On Deployment Mode, 2016-2032
- 8.5.3. On-premises
- 8.5.4. Cloud-based
- 8.6. Latin America Generative AI in Asset Management Market Analysis, Opportunity and Forecast, By Based On End-User, 2016-2032
- 8.6.1. Latin America Generative AI in Asset Management Market Analysis by Based On End-User: Introduction
- 8.6.2. Market Size Absolute $ Opportunity Analysis and Forecast, By Based On End-User, 2016-2032
- 8.6.3. Banks, Financial Institutions and Insurance Companies
- 8.6.4. Pension Funds and Retirement Funds
- 8.6.5. High-net-worth Individuals
- 8.6.6. Other Institutional Investors
- 8.7. Latin America Generative AI in Asset Management Market Analysis, Opportunity and Forecast, By Country , 2016-2032
- 8.7.1. Latin America Generative AI in Asset Management Market Analysis by Country : Introduction
- 8.7.2. Market Size Absolute $ Opportunity Analysis and Forecast, Country , 2016-2032
- 8.7.2.1. Brazil
- 8.7.2.2. Colombia
- 8.7.2.3. Chile
- 8.7.2.4. Argentina
- 8.7.2.5. Costa Rica
- 8.7.2.6. Rest of Latin America
- 9. Middle East & Africa Generative AI in Asset Management Market Analysis, Opportunity and Forecast, 2016-2032
- 9.1. Middle East & Africa Generative AI in Asset Management Market Analysis, 2016-2021
- 9.2. Middle East & Africa Generative AI in Asset Management Market Opportunity and Forecast, 2023-2032
- 9.3. Middle East & Africa Generative AI in Asset Management Market Analysis, Opportunity and Forecast, By Based On Application , 2016-2032
- 9.3.1. Middle East & Africa Generative AI in Asset Management Market Analysis by Based On Application : Introduction
- 9.3.2. Market Size Absolute $ Opportunity Analysis and Forecast, By Based On Application , 2016-2032
- 9.3.3. Portfolio Optimization
- 9.3.4. Risk Analysis and Management
- 9.3.5. Asset Valuation
- 9.3.6. Asset Allocation
- 9.3.7. Asset Performance Prediction
- 9.3.8. Market Analysis and Forecasting
- 9.4. Middle East & Africa Generative AI in Asset Management Market Analysis, Opportunity and Forecast, By Based On Asset Class, 2016-2032
- 9.4.1. Middle East & Africa Generative AI in Asset Management Market Analysis by Based On Asset Class: Introduction
- 9.4.2. Market Size Absolute $ Opportunity Analysis and Forecast, By Based On Asset Class, 2016-2032
- 9.4.3. Equities
- 9.4.4. Fixed Income
- 9.4.5. Commodities
- 9.4.6. Real Estate
- 9.4.7. Alternative Investments
- 9.5. Middle East & Africa Generative AI in Asset Management Market Analysis, Opportunity and Forecast, By Based On Deployment Mode, 2016-2032
- 9.5.1. Middle East & Africa Generative AI in Asset Management Market Analysis by Based On Deployment Mode: Introduction
- 9.5.2. Market Size Absolute $ Opportunity Analysis and Forecast, By Based On Deployment Mode, 2016-2032
- 9.5.3. On-premises
- 9.5.4. Cloud-based
- 9.6. Middle East & Africa Generative AI in Asset Management Market Analysis, Opportunity and Forecast, By Based On End-User, 2016-2032
- 9.6.1. Middle East & Africa Generative AI in Asset Management Market Analysis by Based On End-User: Introduction
- 9.6.2. Market Size Absolute $ Opportunity Analysis and Forecast, By Based On End-User, 2016-2032
- 9.6.3. Banks, Financial Institutions and Insurance Companies
- 9.6.4. Pension Funds and Retirement Funds
- 9.6.5. High-net-worth Individuals
- 9.6.6. Other Institutional Investors
- 9.7. Middle East & Africa Generative AI in Asset Management Market Analysis, Opportunity and Forecast, By Country , 2016-2032
- 9.7.1. Middle East & Africa Generative AI in Asset Management Market Analysis by Country : Introduction
- 9.7.2. Market Size Absolute $ Opportunity Analysis and Forecast, Country , 2016-2032
- 9.7.2.1. Algeria
- 9.7.2.2. Egypt
- 9.7.2.3. Israel
- 9.7.2.4. Kuwait
- 9.7.2.5. Nigeria
- 9.7.2.6. Saudi Arabia
- 9.7.2.7. South Africa
- 9.7.2.8. Turkey
- 9.7.2.9. The UAE
- 9.7.2.10. Rest of MEA
- 10. Global Generative AI in Asset Management Market Analysis, Opportunity and Forecast, By Region , 2016-2032
- 10.1. Global Generative AI in Asset Management Market Analysis by Region : Introduction
- 10.2. Market Size Absolute $ Opportunity Analysis and Forecast, By Region , 2016-2032
- 10.2.1. North America
- 10.2.2. Western Europe
- 10.2.3. Eastern Europe
- 10.2.4. APAC
- 10.2.5. Latin America
- 10.2.6. Middle East & Africa
- 11. Global Generative AI in Asset Management Market Competitive Landscape, Market Share Analysis, and Company Profiles
- 11.1. Market Share Analysis
- 11.2. Company Profiles
- 11.3. Vanguard Group
- 11.3.1. Company Overview
- 11.3.2. Financial Highlights
- 11.3.3. Product Portfolio
- 11.3.4. SWOT Analysis
- 11.3.5. Key Strategies and Developments
- 11.4. BlackRock
- 11.4.1. Company Overview
- 11.4.2. Financial Highlights
- 11.4.3. Product Portfolio
- 11.4.4. SWOT Analysis
- 11.4.5. Key Strategies and Developments
- 11.5. Aiera
- 11.5.1. Company Overview
- 11.5.2. Financial Highlights
- 11.5.3. Product Portfolio
- 11.5.4. SWOT Analysis
- 11.5.5. Key Strategies and Developments
- 11.6. State Street Corporation
- 11.6.1. Company Overview
- 11.6.2. Financial Highlights
- 11.6.3. Product Portfolio
- 11.6.4. SWOT Analysis
- 11.6.5. Key Strategies and Developments
- 11.7. Other Market Players
- 11.7.1. Company Overview
- 11.7.2. Financial Highlights
- 11.7.3. Product Portfolio
- 11.7.4. SWOT Analysis
- 11.7.5. Key Strategies and Developments
- 12. Assumptions and Acronyms
- 13. Research Methodology
- 14. Contact
- List of Figures
- Figure 1: Global Generative AI in Asset Management Market Revenue (US$ Mn) Market Share by Based On Application in 2022
- Figure 2: Global Generative AI in Asset Management Market Attractiveness Analysis by Based On Application , 2016-2032
- Figure 3: Global Generative AI in Asset Management Market Revenue (US$ Mn) Market Share by Based On Asset Classin 2022
- Figure 4: Global Generative AI in Asset Management Market Attractiveness Analysis by Based On Asset Class, 2016-2032
- Figure 5: Global Generative AI in Asset Management Market Revenue (US$ Mn) Market Share by Based On Deployment Modein 2022
- Figure 6: Global Generative AI in Asset Management Market Attractiveness Analysis by Based On Deployment Mode, 2016-2032
- Figure 7: Global Generative AI in Asset Management Market Revenue (US$ Mn) Market Share by Based On End-Userin 2022
- Figure 8: Global Generative AI in Asset Management Market Attractiveness Analysis by Based On End-User, 2016-2032
- Figure 9: Global Generative AI in Asset Management Market Revenue (US$ Mn) Market Share by Region in 2022
- Figure 10: Global Generative AI in Asset Management Market Attractiveness Analysis by Region, 2016-2032
- Figure 11: Global Generative AI in Asset Management Market Revenue (US$ Mn) (2016-2032)
- Figure 12: Global Generative AI in Asset Management Market Revenue (US$ Mn) Comparison by Region (2016-2032)
- Figure 13: Global Generative AI in Asset Management Market Revenue (US$ Mn) Comparison by Based On Application (2016-2032)
- Figure 14: Global Generative AI in Asset Management Market Revenue (US$ Mn) Comparison by Based On Asset Class (2016-2032)
- Figure 15: Global Generative AI in Asset Management Market Revenue (US$ Mn) Comparison by Based On Deployment Mode (2016-2032)
- Figure 16: Global Generative AI in Asset Management Market Revenue (US$ Mn) Comparison by Based On End-User (2016-2032)
- Figure 17: Global Generative AI in Asset Management Market Y-o-Y Growth Rate Comparison by Region (2016-2032)
- Figure 18: Global Generative AI in Asset Management Market Y-o-Y Growth Rate Comparison by Based On Application (2016-2032)
- Figure 19: Global Generative AI in Asset Management Market Y-o-Y Growth Rate Comparison by Based On Asset Class (2016-2032)
- Figure 20: Global Generative AI in Asset Management Market Y-o-Y Growth Rate Comparison by Based On Deployment Mode (2016-2032)
- Figure 21: Global Generative AI in Asset Management Market Y-o-Y Growth Rate Comparison by Based On End-User (2016-2032)
- Figure 22: Global Generative AI in Asset Management Market Share Comparison by Region (2016-2032)
- Figure 23: Global Generative AI in Asset Management Market Share Comparison by Based On Application (2016-2032)
- Figure 24: Global Generative AI in Asset Management Market Share Comparison by Based On Asset Class (2016-2032)
- Figure 25: Global Generative AI in Asset Management Market Share Comparison by Based On Deployment Mode (2016-2032)
- Figure 26: Global Generative AI in Asset Management Market Share Comparison by Based On End-User (2016-2032)
- Figure 27: North America Generative AI in Asset Management Market Revenue (US$ Mn) Market Share by Based On Application in 2022
- Figure 28: North America Generative AI in Asset Management Market Attractiveness Analysis by Based On Application , 2016-2032
- Figure 29: North America Generative AI in Asset Management Market Revenue (US$ Mn) Market Share by Based On Asset Classin 2022
- Figure 30: North America Generative AI in Asset Management Market Attractiveness Analysis by Based On Asset Class, 2016-2032
- Figure 31: North America Generative AI in Asset Management Market Revenue (US$ Mn) Market Share by Based On Deployment Modein 2022
- Figure 32: North America Generative AI in Asset Management Market Attractiveness Analysis by Based On Deployment Mode, 2016-2032
- Figure 33: North America Generative AI in Asset Management Market Revenue (US$ Mn) Market Share by Based On End-Userin 2022
- Figure 34: North America Generative AI in Asset Management Market Attractiveness Analysis by Based On End-User, 2016-2032
- Figure 35: North America Generative AI in Asset Management Market Revenue (US$ Mn) Market Share by Country in 2022
- Figure 36: North America Generative AI in Asset Management Market Attractiveness Analysis by Country, 2016-2032
- Figure 37: North America Generative AI in Asset Management Market Revenue (US$ Mn) (2016-2032)
- Figure 38: North America Generative AI in Asset Management Market Revenue (US$ Mn) Comparison by Country (2016-2032)
- Figure 39: North America Generative AI in Asset Management Market Revenue (US$ Mn) Comparison by Based On Application (2016-2032)
- Figure 40: North America Generative AI in Asset Management Market Revenue (US$ Mn) Comparison by Based On Asset Class (2016-2032)
- Figure 41: North America Generative AI in Asset Management Market Revenue (US$ Mn) Comparison by Based On Deployment Mode (2016-2032)
- Figure 42: North America Generative AI in Asset Management Market Revenue (US$ Mn) Comparison by Based On End-User (2016-2032)
- Figure 43: North America Generative AI in Asset Management Market Y-o-Y Growth Rate Comparison by Country (2016-2032)
- Figure 44: North America Generative AI in Asset Management Market Y-o-Y Growth Rate Comparison by Based On Application (2016-2032)
- Figure 45: North America Generative AI in Asset Management Market Y-o-Y Growth Rate Comparison by Based On Asset Class (2016-2032)
- Figure 46: North America Generative AI in Asset Management Market Y-o-Y Growth Rate Comparison by Based On Deployment Mode (2016-2032)
- Figure 47: North America Generative AI in Asset Management Market Y-o-Y Growth Rate Comparison by Based On End-User (2016-2032)
- Figure 48: North America Generative AI in Asset Management Market Share Comparison by Country (2016-2032)
- Figure 49: North America Generative AI in Asset Management Market Share Comparison by Based On Application (2016-2032)
- Figure 50: North America Generative AI in Asset Management Market Share Comparison by Based On Asset Class (2016-2032)
- Figure 51: North America Generative AI in Asset Management Market Share Comparison by Based On Deployment Mode (2016-2032)
- Figure 52: North America Generative AI in Asset Management Market Share Comparison by Based On End-User (2016-2032)
- Figure 53: Western Europe Generative AI in Asset Management Market Revenue (US$ Mn) Market Share by Based On Application in 2022
- Figure 54: Western Europe Generative AI in Asset Management Market Attractiveness Analysis by Based On Application , 2016-2032
- Figure 55: Western Europe Generative AI in Asset Management Market Revenue (US$ Mn) Market Share by Based On Asset Classin 2022
- Figure 56: Western Europe Generative AI in Asset Management Market Attractiveness Analysis by Based On Asset Class, 2016-2032
- Figure 57: Western Europe Generative AI in Asset Management Market Revenue (US$ Mn) Market Share by Based On Deployment Modein 2022
- Figure 58: Western Europe Generative AI in Asset Management Market Attractiveness Analysis by Based On Deployment Mode, 2016-2032
- Figure 59: Western Europe Generative AI in Asset Management Market Revenue (US$ Mn) Market Share by Based On End-Userin 2022
- Figure 60: Western Europe Generative AI in Asset Management Market Attractiveness Analysis by Based On End-User, 2016-2032
- Figure 61: Western Europe Generative AI in Asset Management Market Revenue (US$ Mn) Market Share by Country in 2022
- Figure 62: Western Europe Generative AI in Asset Management Market Attractiveness Analysis by Country, 2016-2032
- Figure 63: Western Europe Generative AI in Asset Management Market Revenue (US$ Mn) (2016-2032)
- Figure 64: Western Europe Generative AI in Asset Management Market Revenue (US$ Mn) Comparison by Country (2016-2032)
- Figure 65: Western Europe Generative AI in Asset Management Market Revenue (US$ Mn) Comparison by Based On Application (2016-2032)
- Figure 66: Western Europe Generative AI in Asset Management Market Revenue (US$ Mn) Comparison by Based On Asset Class (2016-2032)
- Figure 67: Western Europe Generative AI in Asset Management Market Revenue (US$ Mn) Comparison by Based On Deployment Mode (2016-2032)
- Figure 68: Western Europe Generative AI in Asset Management Market Revenue (US$ Mn) Comparison by Based On End-User (2016-2032)
- Figure 69: Western Europe Generative AI in Asset Management Market Y-o-Y Growth Rate Comparison by Country (2016-2032)
- Figure 70: Western Europe Generative AI in Asset Management Market Y-o-Y Growth Rate Comparison by Based On Application (2016-2032)
- Figure 71: Western Europe Generative AI in Asset Management Market Y-o-Y Growth Rate Comparison by Based On Asset Class (2016-2032)
- Figure 72: Western Europe Generative AI in Asset Management Market Y-o-Y Growth Rate Comparison by Based On Deployment Mode (2016-2032)
- Figure 73: Western Europe Generative AI in Asset Management Market Y-o-Y Growth Rate Comparison by Based On End-User (2016-2032)
- Figure 74: Western Europe Generative AI in Asset Management Market Share Comparison by Country (2016-2032)
- Figure 75: Western Europe Generative AI in Asset Management Market Share Comparison by Based On Application (2016-2032)
- Figure 76: Western Europe Generative AI in Asset Management Market Share Comparison by Based On Asset Class (2016-2032)
- Figure 77: Western Europe Generative AI in Asset Management Market Share Comparison by Based On Deployment Mode (2016-2032)
- Figure 78: Western Europe Generative AI in Asset Management Market Share Comparison by Based On End-User (2016-2032)
- Figure 79: Eastern Europe Generative AI in Asset Management Market Revenue (US$ Mn) Market Share by Based On Application in 2022
- Figure 80: Eastern Europe Generative AI in Asset Management Market Attractiveness Analysis by Based On Application , 2016-2032
- Figure 81: Eastern Europe Generative AI in Asset Management Market Revenue (US$ Mn) Market Share by Based On Asset Classin 2022
- Figure 82: Eastern Europe Generative AI in Asset Management Market Attractiveness Analysis by Based On Asset Class, 2016-2032
- Figure 83: Eastern Europe Generative AI in Asset Management Market Revenue (US$ Mn) Market Share by Based On Deployment Modein 2022
- Figure 84: Eastern Europe Generative AI in Asset Management Market Attractiveness Analysis by Based On Deployment Mode, 2016-2032
- Figure 85: Eastern Europe Generative AI in Asset Management Market Revenue (US$ Mn) Market Share by Based On End-Userin 2022
- Figure 86: Eastern Europe Generative AI in Asset Management Market Attractiveness Analysis by Based On End-User, 2016-2032
- Figure 87: Eastern Europe Generative AI in Asset Management Market Revenue (US$ Mn) Market Share by Country in 2022
- Figure 88: Eastern Europe Generative AI in Asset Management Market Attractiveness Analysis by Country, 2016-2032
- Figure 89: Eastern Europe Generative AI in Asset Management Market Revenue (US$ Mn) (2016-2032)
- Figure 90: Eastern Europe Generative AI in Asset Management Market Revenue (US$ Mn) Comparison by Country (2016-2032)
- Figure 91: Eastern Europe Generative AI in Asset Management Market Revenue (US$ Mn) Comparison by Based On Application (2016-2032)
- Figure 92: Eastern Europe Generative AI in Asset Management Market Revenue (US$ Mn) Comparison by Based On Asset Class (2016-2032)
- Figure 93: Eastern Europe Generative AI in Asset Management Market Revenue (US$ Mn) Comparison by Based On Deployment Mode (2016-2032)
- Figure 94: Eastern Europe Generative AI in Asset Management Market Revenue (US$ Mn) Comparison by Based On End-User (2016-2032)
- Figure 95: Eastern Europe Generative AI in Asset Management Market Y-o-Y Growth Rate Comparison by Country (2016-2032)
- Figure 96: Eastern Europe Generative AI in Asset Management Market Y-o-Y Growth Rate Comparison by Based On Application (2016-2032)
- Figure 97: Eastern Europe Generative AI in Asset Management Market Y-o-Y Growth Rate Comparison by Based On Asset Class (2016-2032)
- Figure 98: Eastern Europe Generative AI in Asset Management Market Y-o-Y Growth Rate Comparison by Based On Deployment Mode (2016-2032)
- Figure 99: Eastern Europe Generative AI in Asset Management Market Y-o-Y Growth Rate Comparison by Based On End-User (2016-2032)
- Figure 100: Eastern Europe Generative AI in Asset Management Market Share Comparison by Country (2016-2032)
- Figure 101: Eastern Europe Generative AI in Asset Management Market Share Comparison by Based On Application (2016-2032)
- Figure 102: Eastern Europe Generative AI in Asset Management Market Share Comparison by Based On Asset Class (2016-2032)
- Figure 103: Eastern Europe Generative AI in Asset Management Market Share Comparison by Based On Deployment Mode (2016-2032)
- Figure 104: Eastern Europe Generative AI in Asset Management Market Share Comparison by Based On End-User (2016-2032)
- Figure 105: APAC Generative AI in Asset Management Market Revenue (US$ Mn) Market Share by Based On Application in 2022
- Figure 106: APAC Generative AI in Asset Management Market Attractiveness Analysis by Based On Application , 2016-2032
- Figure 107: APAC Generative AI in Asset Management Market Revenue (US$ Mn) Market Share by Based On Asset Classin 2022
- Figure 108: APAC Generative AI in Asset Management Market Attractiveness Analysis by Based On Asset Class, 2016-2032
- Figure 109: APAC Generative AI in Asset Management Market Revenue (US$ Mn) Market Share by Based On Deployment Modein 2022
- Figure 110: APAC Generative AI in Asset Management Market Attractiveness Analysis by Based On Deployment Mode, 2016-2032
- Figure 111: APAC Generative AI in Asset Management Market Revenue (US$ Mn) Market Share by Based On End-Userin 2022
- Figure 112: APAC Generative AI in Asset Management Market Attractiveness Analysis by Based On End-User, 2016-2032
- Figure 113: APAC Generative AI in Asset Management Market Revenue (US$ Mn) Market Share by Country in 2022
- Figure 114: APAC Generative AI in Asset Management Market Attractiveness Analysis by Country, 2016-2032
- Figure 115: APAC Generative AI in Asset Management Market Revenue (US$ Mn) (2016-2032)
- Figure 116: APAC Generative AI in Asset Management Market Revenue (US$ Mn) Comparison by Country (2016-2032)
- Figure 117: APAC Generative AI in Asset Management Market Revenue (US$ Mn) Comparison by Based On Application (2016-2032)
- Figure 118: APAC Generative AI in Asset Management Market Revenue (US$ Mn) Comparison by Based On Asset Class (2016-2032)
- Figure 119: APAC Generative AI in Asset Management Market Revenue (US$ Mn) Comparison by Based On Deployment Mode (2016-2032)
- Figure 120: APAC Generative AI in Asset Management Market Revenue (US$ Mn) Comparison by Based On End-User (2016-2032)
- Figure 121: APAC Generative AI in Asset Management Market Y-o-Y Growth Rate Comparison by Country (2016-2032)
- Figure 122: APAC Generative AI in Asset Management Market Y-o-Y Growth Rate Comparison by Based On Application (2016-2032)
- Figure 123: APAC Generative AI in Asset Management Market Y-o-Y Growth Rate Comparison by Based On Asset Class (2016-2032)
- Figure 124: APAC Generative AI in Asset Management Market Y-o-Y Growth Rate Comparison by Based On Deployment Mode (2016-2032)
- Figure 125: APAC Generative AI in Asset Management Market Y-o-Y Growth Rate Comparison by Based On End-User (2016-2032)
- Figure 126: APAC Generative AI in Asset Management Market Share Comparison by Country (2016-2032)
- Figure 127: APAC Generative AI in Asset Management Market Share Comparison by Based On Application (2016-2032)
- Figure 128: APAC Generative AI in Asset Management Market Share Comparison by Based On Asset Class (2016-2032)
- Figure 129: APAC Generative AI in Asset Management Market Share Comparison by Based On Deployment Mode (2016-2032)
- Figure 130: APAC Generative AI in Asset Management Market Share Comparison by Based On End-User (2016-2032)
- Figure 131: Latin America Generative AI in Asset Management Market Revenue (US$ Mn) Market Share by Based On Application in 2022
- Figure 132: Latin America Generative AI in Asset Management Market Attractiveness Analysis by Based On Application , 2016-2032
- Figure 133: Latin America Generative AI in Asset Management Market Revenue (US$ Mn) Market Share by Based On Asset Classin 2022
- Figure 134: Latin America Generative AI in Asset Management Market Attractiveness Analysis by Based On Asset Class, 2016-2032
- Figure 135: Latin America Generative AI in Asset Management Market Revenue (US$ Mn) Market Share by Based On Deployment Modein 2022
- Figure 136: Latin America Generative AI in Asset Management Market Attractiveness Analysis by Based On Deployment Mode, 2016-2032
- Figure 137: Latin America Generative AI in Asset Management Market Revenue (US$ Mn) Market Share by Based On End-Userin 2022
- Figure 138: Latin America Generative AI in Asset Management Market Attractiveness Analysis by Based On End-User, 2016-2032
- Figure 139: Latin America Generative AI in Asset Management Market Revenue (US$ Mn) Market Share by Country in 2022
- Figure 140: Latin America Generative AI in Asset Management Market Attractiveness Analysis by Country, 2016-2032
- Figure 141: Latin America Generative AI in Asset Management Market Revenue (US$ Mn) (2016-2032)
- Figure 142: Latin America Generative AI in Asset Management Market Revenue (US$ Mn) Comparison by Country (2016-2032)
- Figure 143: Latin America Generative AI in Asset Management Market Revenue (US$ Mn) Comparison by Based On Application (2016-2032)
- Figure 144: Latin America Generative AI in Asset Management Market Revenue (US$ Mn) Comparison by Based On Asset Class (2016-2032)
- Figure 145: Latin America Generative AI in Asset Management Market Revenue (US$ Mn) Comparison by Based On Deployment Mode (2016-2032)
- Figure 146: Latin America Generative AI in Asset Management Market Revenue (US$ Mn) Comparison by Based On End-User (2016-2032)
- Figure 147: Latin America Generative AI in Asset Management Market Y-o-Y Growth Rate Comparison by Country (2016-2032)
- Figure 148: Latin America Generative AI in Asset Management Market Y-o-Y Growth Rate Comparison by Based On Application (2016-2032)
- Figure 149: Latin America Generative AI in Asset Management Market Y-o-Y Growth Rate Comparison by Based On Asset Class (2016-2032)
- Figure 150: Latin America Generative AI in Asset Management Market Y-o-Y Growth Rate Comparison by Based On Deployment Mode (2016-2032)
- Figure 151: Latin America Generative AI in Asset Management Market Y-o-Y Growth Rate Comparison by Based On End-User (2016-2032)
- Figure 152: Latin America Generative AI in Asset Management Market Share Comparison by Country (2016-2032)
- Figure 153: Latin America Generative AI in Asset Management Market Share Comparison by Based On Application (2016-2032)
- Figure 154: Latin America Generative AI in Asset Management Market Share Comparison by Based On Asset Class (2016-2032)
- Figure 155: Latin America Generative AI in Asset Management Market Share Comparison by Based On Deployment Mode (2016-2032)
- Figure 156: Latin America Generative AI in Asset Management Market Share Comparison by Based On End-User (2016-2032)
- Figure 157: Middle East & Africa Generative AI in Asset Management Market Revenue (US$ Mn) Market Share by Based On Application in 2022
- Figure 158: Middle East & Africa Generative AI in Asset Management Market Attractiveness Analysis by Based On Application , 2016-2032
- Figure 159: Middle East & Africa Generative AI in Asset Management Market Revenue (US$ Mn) Market Share by Based On Asset Classin 2022
- Figure 160: Middle East & Africa Generative AI in Asset Management Market Attractiveness Analysis by Based On Asset Class, 2016-2032
- Figure 161: Middle East & Africa Generative AI in Asset Management Market Revenue (US$ Mn) Market Share by Based On Deployment Modein 2022
- Figure 162: Middle East & Africa Generative AI in Asset Management Market Attractiveness Analysis by Based On Deployment Mode, 2016-2032
- Figure 163: Middle East & Africa Generative AI in Asset Management Market Revenue (US$ Mn) Market Share by Based On End-Userin 2022
- Figure 164: Middle East & Africa Generative AI in Asset Management Market Attractiveness Analysis by Based On End-User, 2016-2032
- Figure 165: Middle East & Africa Generative AI in Asset Management Market Revenue (US$ Mn) Market Share by Country in 2022
- Figure 166: Middle East & Africa Generative AI in Asset Management Market Attractiveness Analysis by Country, 2016-2032
- Figure 167: Middle East & Africa Generative AI in Asset Management Market Revenue (US$ Mn) (2016-2032)
- Figure 168: Middle East & Africa Generative AI in Asset Management Market Revenue (US$ Mn) Comparison by Country (2016-2032)
- Figure 169: Middle East & Africa Generative AI in Asset Management Market Revenue (US$ Mn) Comparison by Based On Application (2016-2032)
- Figure 170: Middle East & Africa Generative AI in Asset Management Market Revenue (US$ Mn) Comparison by Based On Asset Class (2016-2032)
- Figure 171: Middle East & Africa Generative AI in Asset Management Market Revenue (US$ Mn) Comparison by Based On Deployment Mode (2016-2032)
- Figure 172: Middle East & Africa Generative AI in Asset Management Market Revenue (US$ Mn) Comparison by Based On End-User (2016-2032)
- Figure 173: Middle East & Africa Generative AI in Asset Management Market Y-o-Y Growth Rate Comparison by Country (2016-2032)
- Figure 174: Middle East & Africa Generative AI in Asset Management Market Y-o-Y Growth Rate Comparison by Based On Application (2016-2032)
- Figure 175: Middle East & Africa Generative AI in Asset Management Market Y-o-Y Growth Rate Comparison by Based On Asset Class (2016-2032)
- Figure 176: Middle East & Africa Generative AI in Asset Management Market Y-o-Y Growth Rate Comparison by Based On Deployment Mode (2016-2032)
- Figure 177: Middle East & Africa Generative AI in Asset Management Market Y-o-Y Growth Rate Comparison by Based On End-User (2016-2032)
- Figure 178: Middle East & Africa Generative AI in Asset Management Market Share Comparison by Country (2016-2032)
- Figure 179: Middle East & Africa Generative AI in Asset Management Market Share Comparison by Based On Application (2016-2032)
- Figure 180: Middle East & Africa Generative AI in Asset Management Market Share Comparison by Based On Asset Class (2016-2032)
- Figure 181: Middle East & Africa Generative AI in Asset Management Market Share Comparison by Based On Deployment Mode (2016-2032)
- Figure 182: Middle East & Africa Generative AI in Asset Management Market Share Comparison by Based On End-User (2016-2032)
- List of Tables
- Table 1: Global Generative AI in Asset Management Market Comparison by Based On Application (2016-2032)
- Table 2: Global Generative AI in Asset Management Market Comparison by Based On Asset Class (2016-2032)
- Table 3: Global Generative AI in Asset Management Market Comparison by Based On Deployment Mode (2016-2032)
- Table 4: Global Generative AI in Asset Management Market Comparison by Based On End-User (2016-2032)
- Table 5: Global Generative AI in Asset Management Market Revenue (US$ Mn) Comparison by Region (2016-2032)
- Table 6: Global Generative AI in Asset Management Market Revenue (US$ Mn) (2016-2032)
- Table 7: Global Generative AI in Asset Management Market Revenue (US$ Mn) Comparison by Region (2016-2032)
- Table 8: Global Generative AI in Asset Management Market Revenue (US$ Mn) Comparison by Based On Application (2016-2032)
- Table 9: Global Generative AI in Asset Management Market Revenue (US$ Mn) Comparison by Based On Asset Class (2016-2032)
- Table 10: Global Generative AI in Asset Management Market Revenue (US$ Mn) Comparison by Based On Deployment Mode (2016-2032)
- Table 11: Global Generative AI in Asset Management Market Revenue (US$ Mn) Comparison by Based On End-User (2016-2032)
- Table 12: Global Generative AI in Asset Management Market Y-o-Y Growth Rate Comparison by Region (2016-2032)
- Table 13: Global Generative AI in Asset Management Market Y-o-Y Growth Rate Comparison by Based On Application (2016-2032)
- Table 14: Global Generative AI in Asset Management Market Y-o-Y Growth Rate Comparison by Based On Asset Class (2016-2032)
- Table 15: Global Generative AI in Asset Management Market Y-o-Y Growth Rate Comparison by Based On Deployment Mode (2016-2032)
- Table 16: Global Generative AI in Asset Management Market Y-o-Y Growth Rate Comparison by Based On End-User (2016-2032)
- Table 17: Global Generative AI in Asset Management Market Share Comparison by Region (2016-2032)
- Table 18: Global Generative AI in Asset Management Market Share Comparison by Based On Application (2016-2032)
- Table 19: Global Generative AI in Asset Management Market Share Comparison by Based On Asset Class (2016-2032)
- Table 20: Global Generative AI in Asset Management Market Share Comparison by Based On Deployment Mode (2016-2032)
- Table 21: Global Generative AI in Asset Management Market Share Comparison by Based On End-User (2016-2032)
- Table 22: North America Generative AI in Asset Management Market Comparison by Based On Asset Class (2016-2032)
- Table 23: North America Generative AI in Asset Management Market Comparison by Based On Deployment Mode (2016-2032)
- Table 24: North America Generative AI in Asset Management Market Comparison by Based On End-User (2016-2032)
- Table 25: North America Generative AI in Asset Management Market Revenue (US$ Mn) Comparison by Country (2016-2032)
- Table 26: North America Generative AI in Asset Management Market Revenue (US$ Mn) (2016-2032)
- Table 27: North America Generative AI in Asset Management Market Revenue (US$ Mn) Comparison by Country (2016-2032)
- Table 28: North America Generative AI in Asset Management Market Revenue (US$ Mn) Comparison by Based On Application (2016-2032)
- Table 29: North America Generative AI in Asset Management Market Revenue (US$ Mn) Comparison by Based On Asset Class (2016-2032)
- Table 30: North America Generative AI in Asset Management Market Revenue (US$ Mn) Comparison by Based On Deployment Mode (2016-2032)
- Table 31: North America Generative AI in Asset Management Market Revenue (US$ Mn) Comparison by Based On End-User (2016-2032)
- Table 32: North America Generative AI in Asset Management Market Y-o-Y Growth Rate Comparison by Country (2016-2032)
- Table 33: North America Generative AI in Asset Management Market Y-o-Y Growth Rate Comparison by Based On Application (2016-2032)
- Table 34: North America Generative AI in Asset Management Market Y-o-Y Growth Rate Comparison by Based On Asset Class (2016-2032)
- Table 35: North America Generative AI in Asset Management Market Y-o-Y Growth Rate Comparison by Based On Deployment Mode (2016-2032)
- Table 36: North America Generative AI in Asset Management Market Y-o-Y Growth Rate Comparison by Based On End-User (2016-2032)
- Table 37: North America Generative AI in Asset Management Market Share Comparison by Country (2016-2032)
- Table 38: North America Generative AI in Asset Management Market Share Comparison by Based On Application (2016-2032)
- Table 39: North America Generative AI in Asset Management Market Share Comparison by Based On Asset Class (2016-2032)
- Table 40: North America Generative AI in Asset Management Market Share Comparison by Based On Deployment Mode (2016-2032)
- Table 41: North America Generative AI in Asset Management Market Share Comparison by Based On End-User (2016-2032)
- Table 42: Western Europe Generative AI in Asset Management Market Comparison by Based On Application (2016-2032)
- Table 43: Western Europe Generative AI in Asset Management Market Comparison by Based On Asset Class (2016-2032)
- Table 44: Western Europe Generative AI in Asset Management Market Comparison by Based On Deployment Mode (2016-2032)
- Table 45: Western Europe Generative AI in Asset Management Market Comparison by Based On End-User (2016-2032)
- Table 46: Western Europe Generative AI in Asset Management Market Revenue (US$ Mn) Comparison by Country (2016-2032)
- Table 47: Western Europe Generative AI in Asset Management Market Revenue (US$ Mn) (2016-2032)
- Table 48: Western Europe Generative AI in Asset Management Market Revenue (US$ Mn) Comparison by Country (2016-2032)
- Table 49: Western Europe Generative AI in Asset Management Market Revenue (US$ Mn) Comparison by Based On Application (2016-2032)
- Table 50: Western Europe Generative AI in Asset Management Market Revenue (US$ Mn) Comparison by Based On Asset Class (2016-2032)
- Table 51: Western Europe Generative AI in Asset Management Market Revenue (US$ Mn) Comparison by Based On Deployment Mode (2016-2032)
- Table 52: Western Europe Generative AI in Asset Management Market Revenue (US$ Mn) Comparison by Based On End-User (2016-2032)
- Table 53: Western Europe Generative AI in Asset Management Market Y-o-Y Growth Rate Comparison by Country (2016-2032)
- Table 54: Western Europe Generative AI in Asset Management Market Y-o-Y Growth Rate Comparison by Based On Application (2016-2032)
- Table 55: Western Europe Generative AI in Asset Management Market Y-o-Y Growth Rate Comparison by Based On Asset Class (2016-2032)
- Table 56: Western Europe Generative AI in Asset Management Market Y-o-Y Growth Rate Comparison by Based On Deployment Mode (2016-2032)
- Table 57: Western Europe Generative AI in Asset Management Market Y-o-Y Growth Rate Comparison by Based On End-User (2016-2032)
- Table 58: Western Europe Generative AI in Asset Management Market Share Comparison by Country (2016-2032)
- Table 59: Western Europe Generative AI in Asset Management Market Share Comparison by Based On Application (2016-2032)
- Table 60: Western Europe Generative AI in Asset Management Market Share Comparison by Based On Asset Class (2016-2032)
- Table 61: Western Europe Generative AI in Asset Management Market Share Comparison by Based On Deployment Mode (2016-2032)
- Table 62: Western Europe Generative AI in Asset Management Market Share Comparison by Based On End-User (2016-2032)
- Table 63: Eastern Europe Generative AI in Asset Management Market Comparison by Based On Application (2016-2032)
- Table 64: Eastern Europe Generative AI in Asset Management Market Comparison by Based On Asset Class (2016-2032)
- Table 65: Eastern Europe Generative AI in Asset Management Market Comparison by Based On Deployment Mode (2016-2032)
- Table 66: Eastern Europe Generative AI in Asset Management Market Comparison by Based On End-User (2016-2032)
- Table 67: Eastern Europe Generative AI in Asset Management Market Revenue (US$ Mn) Comparison by Country (2016-2032)
- Table 68: Eastern Europe Generative AI in Asset Management Market Revenue (US$ Mn) (2016-2032)
- Table 69: Eastern Europe Generative AI in Asset Management Market Revenue (US$ Mn) Comparison by Country (2016-2032)
- Table 70: Eastern Europe Generative AI in Asset Management Market Revenue (US$ Mn) Comparison by Based On Application (2016-2032)
- Table 71: Eastern Europe Generative AI in Asset Management Market Revenue (US$ Mn) Comparison by Based On Asset Class (2016-2032)
- Table 72: Eastern Europe Generative AI in Asset Management Market Revenue (US$ Mn) Comparison by Based On Deployment Mode (2016-2032)
- Table 73: Eastern Europe Generative AI in Asset Management Market Revenue (US$ Mn) Comparison by Based On End-User (2016-2032)
- Table 74: Eastern Europe Generative AI in Asset Management Market Y-o-Y Growth Rate Comparison by Country (2016-2032)
- Table 75: Eastern Europe Generative AI in Asset Management Market Y-o-Y Growth Rate Comparison by Based On Application (2016-2032)
- Table 76: Eastern Europe Generative AI in Asset Management Market Y-o-Y Growth Rate Comparison by Based On Asset Class (2016-2032)
- Table 77: Eastern Europe Generative AI in Asset Management Market Y-o-Y Growth Rate Comparison by Based On Deployment Mode (2016-2032)
- Table 78: Eastern Europe Generative AI in Asset Management Market Y-o-Y Growth Rate Comparison by Based On End-User (2016-2032)
- Table 79: Eastern Europe Generative AI in Asset Management Market Share Comparison by Country (2016-2032)
- Table 80: Eastern Europe Generative AI in Asset Management Market Share Comparison by Based On Application (2016-2032)
- Table 81: Eastern Europe Generative AI in Asset Management Market Share Comparison by Based On Asset Class (2016-2032)
- Table 82: Eastern Europe Generative AI in Asset Management Market Share Comparison by Based On Deployment Mode (2016-2032)
- Table 83: Eastern Europe Generative AI in Asset Management Market Share Comparison by Based On End-User (2016-2032)
- Table 84: APAC Generative AI in Asset Management Market Comparison by Based On Application (2016-2032)
- Table 85: APAC Generative AI in Asset Management Market Comparison by Based On Asset Class (2016-2032)
- Table 86: APAC Generative AI in Asset Management Market Comparison by Based On Deployment Mode (2016-2032)
- Table 87: APAC Generative AI in Asset Management Market Comparison by Based On End-User (2016-2032)
- Table 88: APAC Generative AI in Asset Management Market Revenue (US$ Mn) Comparison by Country (2016-2032)
- Table 89: APAC Generative AI in Asset Management Market Revenue (US$ Mn) (2016-2032)
- Table 90: APAC Generative AI in Asset Management Market Revenue (US$ Mn) Comparison by Country (2016-2032)
- Table 91: APAC Generative AI in Asset Management Market Revenue (US$ Mn) Comparison by Based On Application (2016-2032)
- Table 92: APAC Generative AI in Asset Management Market Revenue (US$ Mn) Comparison by Based On Asset Class (2016-2032)
- Table 93: APAC Generative AI in Asset Management Market Revenue (US$ Mn) Comparison by Based On Deployment Mode (2016-2032)
- Table 94: APAC Generative AI in Asset Management Market Revenue (US$ Mn) Comparison by Based On End-User (2016-2032)
- Table 95: APAC Generative AI in Asset Management Market Y-o-Y Growth Rate Comparison by Country (2016-2032)
- Table 96: APAC Generative AI in Asset Management Market Y-o-Y Growth Rate Comparison by Based On Application (2016-2032)
- Table 97: APAC Generative AI in Asset Management Market Y-o-Y Growth Rate Comparison by Based On Asset Class (2016-2032)
- Table 98: APAC Generative AI in Asset Management Market Y-o-Y Growth Rate Comparison by Based On Deployment Mode (2016-2032)
- Table 99: APAC Generative AI in Asset Management Market Y-o-Y Growth Rate Comparison by Based On End-User (2016-2032)
- Table 100: APAC Generative AI in Asset Management Market Share Comparison by Country (2016-2032)
- Table 101: APAC Generative AI in Asset Management Market Share Comparison by Based On Application (2016-2032)
- Table 102: APAC Generative AI in Asset Management Market Share Comparison by Based On Asset Class (2016-2032)
- Table 103: APAC Generative AI in Asset Management Market Share Comparison by Based On Deployment Mode (2016-2032)
- Table 104: APAC Generative AI in Asset Management Market Share Comparison by Based On End-User (2016-2032)
- Table 105: Latin America Generative AI in Asset Management Market Comparison by Based On Application (2016-2032)
- Table 106: Latin America Generative AI in Asset Management Market Comparison by Based On Asset Class (2016-2032)
- Table 107: Latin America Generative AI in Asset Management Market Comparison by Based On Deployment Mode (2016-2032)
- Table 108: Latin America Generative AI in Asset Management Market Comparison by Based On End-User (2016-2032)
- Table 109: Latin America Generative AI in Asset Management Market Revenue (US$ Mn) Comparison by Country (2016-2032)
- Table 110: Latin America Generative AI in Asset Management Market Revenue (US$ Mn) (2016-2032)
- Table 111: Latin America Generative AI in Asset Management Market Revenue (US$ Mn) Comparison by Country (2016-2032)
- Table 112: Latin America Generative AI in Asset Management Market Revenue (US$ Mn) Comparison by Based On Application (2016-2032)
- Table 113: Latin America Generative AI in Asset Management Market Revenue (US$ Mn) Comparison by Based On Asset Class (2016-2032)
- Table 114: Latin America Generative AI in Asset Management Market Revenue (US$ Mn) Comparison by Based On Deployment Mode (2016-2032)
- Table 115: Latin America Generative AI in Asset Management Market Revenue (US$ Mn) Comparison by Based On End-User (2016-2032)
- Table 116: Latin America Generative AI in Asset Management Market Y-o-Y Growth Rate Comparison by Country (2016-2032)
- Table 117: Latin America Generative AI in Asset Management Market Y-o-Y Growth Rate Comparison by Based On Application (2016-2032)
- Table 118: Latin America Generative AI in Asset Management Market Y-o-Y Growth Rate Comparison by Based On Asset Class (2016-2032)
- Table 119: Latin America Generative AI in Asset Management Market Y-o-Y Growth Rate Comparison by Based On Deployment Mode (2016-2032)
- Table 120: Latin America Generative AI in Asset Management Market Y-o-Y Growth Rate Comparison by Based On End-User (2016-2032)
- Table 121: Latin America Generative AI in Asset Management Market Share Comparison by Country (2016-2032)
- Table 122: Latin America Generative AI in Asset Management Market Share Comparison by Based On Application (2016-2032)
- Table 123: Latin America Generative AI in Asset Management Market Share Comparison by Based On Asset Class (2016-2032)
- Table 124: Latin America Generative AI in Asset Management Market Share Comparison by Based On Deployment Mode (2016-2032)
- Table 125: Latin America Generative AI in Asset Management Market Share Comparison by Based On End-User (2016-2032)
- Table 126: Middle East & Africa Generative AI in Asset Management Market Comparison by Based On Application (2016-2032)
- Table 127: Middle East & Africa Generative AI in Asset Management Market Comparison by Based On Asset Class (2016-2032)
- Table 128: Middle East & Africa Generative AI in Asset Management Market Comparison by Based On Deployment Mode (2016-2032)
- Table 129: Middle East & Africa Generative AI in Asset Management Market Comparison by Based On End-User (2016-2032)
- Table 130: Middle East & Africa Generative AI in Asset Management Market Revenue (US$ Mn) Comparison by Country (2016-2032)
- Table 131: Middle East & Africa Generative AI in Asset Management Market Revenue (US$ Mn) (2016-2032)
- Table 132: Middle East & Africa Generative AI in Asset Management Market Revenue (US$ Mn) Comparison by Country (2016-2032)
- Table 133: Middle East & Africa Generative AI in Asset Management Market Revenue (US$ Mn) Comparison by Based On Application (2016-2032)
- Table 134: Middle East & Africa Generative AI in Asset Management Market Revenue (US$ Mn) Comparison by Based On Asset Class (2016-2032)
- Table 135: Middle East & Africa Generative AI in Asset Management Market Revenue (US$ Mn) Comparison by Based On Deployment Mode (2016-2032)
- Table 136: Middle East & Africa Generative AI in Asset Management Market Revenue (US$ Mn) Comparison by Based On End-User (2016-2032)
- Table 137: Middle East & Africa Generative AI in Asset Management Market Y-o-Y Growth Rate Comparison by Country (2016-2032)
- Table 138: Middle East & Africa Generative AI in Asset Management Market Y-o-Y Growth Rate Comparison by Based On Application (2016-2032)
- Table 139: Middle East & Africa Generative AI in Asset Management Market Y-o-Y Growth Rate Comparison by Based On Asset Class (2016-2032)
- Table 140: Middle East & Africa Generative AI in Asset Management Market Y-o-Y Growth Rate Comparison by Based On Deployment Mode (2016-2032)
- Table 141: Middle East & Africa Generative AI in Asset Management Market Y-o-Y Growth Rate Comparison by Based On End-User (2016-2032)
- Table 142: Middle East & Africa Generative AI in Asset Management Market Share Comparison by Country (2016-2032)
- Table 143: Middle East & Africa Generative AI in Asset Management Market Share Comparison by Based On Application (2016-2032)
- Table 144: Middle East & Africa Generative AI in Asset Management Market Share Comparison by Based On Asset Class (2016-2032)
- Table 145: Middle East & Africa Generative AI in Asset Management Market Share Comparison by Based On Deployment Mode (2016-2032)
- Table 146: Middle East & Africa Generative AI in Asset Management Market Share Comparison by Based On End-User (2016-2032)
- 1. Executive Summary
-
- Vanguard Group
- BlackRock
- Aiera
- State Street Corporation
- Other Market Players
Our Clients


View Our Licence Options
