
Gene Sequencing Market Report By Technology (Next-Generation Sequencing (NGS), Sanger Sequencing, Third-Generation Sequencing), By Product Type (Instruments, Sequencers, Sample Preparation Systems, Consumables and Reagents, Kits, Enzymes, Buffers, Software and Services, Data Analysis Software, Bioinformatics Services, Cloud-based Solutions), By Application, By End User, By Region and Companies - Industry Segment Outlook, Market Assessment, Competition Scenario, Trends and Forecast 2024-2033
-
47923
-
June 2024
-
324
-


-
This report was compiled by Trishita Deb Trishita Deb is an experienced market research and consulting professional with over 7 years of expertise across healthcare, consumer goods, and materials, contributing to over 400 healthcare-related reports. Correspondence Team Lead- Healthcare Linkedin | Detailed Market research Methodology Our methodology involves a mix of primary research, including interviews with leading mental health experts, and secondary research from reputable medical journals and databases. View Detailed Methodology Page
-
Quick Navigation
Report Overview
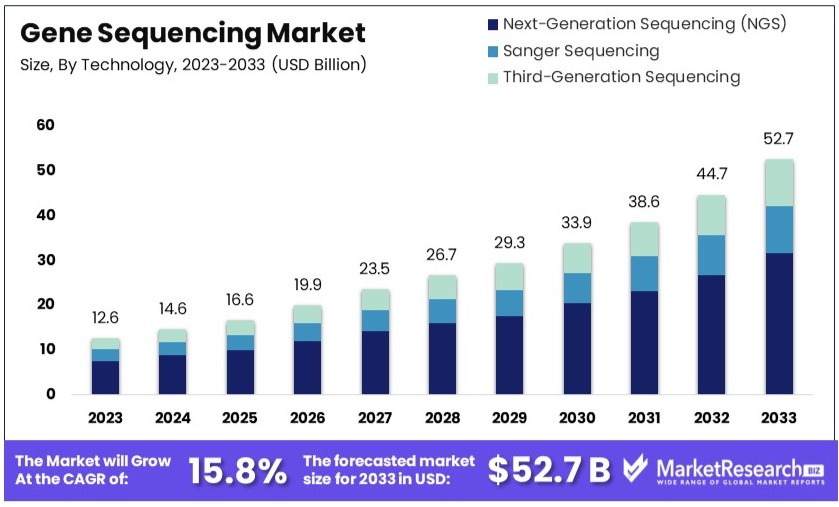
The Global Gene Sequencing Market size is expected to be worth around USD 52.7 Billion by 2033, from USD 12.6 Billion in 2023, growing at a CAGR of 15.8% during the forecast period from 2024 to 2033.
The gene sequencing market encompasses technologies and services that determine the order of nucleotides in DNA. This process is crucial for identifying genetic variations and is instrumental in advancing personalized medicine, agricultural sciences, and microbial genomics. Businesses in this sector provide sequencing machines, consumables, and data analysis services, catering to healthcare providers, research institutions, and pharmaceutical companies.
Growth in this market is driven by innovations in sequencing technologies that increase speed and reduce costs, expanding applications in clinical diagnostics and genetic research. Strategic investments and collaborations are key for companies aiming to lead in this rapidly evolving industry, offering significant opportunities in developing precision therapies and enhancing genetic understanding.
The Gene Sequencing Market is poised for significant expansion, driven by the increasing prevalence of genetic disorders and advancements in genomic technologies. With the World Health Organization reporting that 10 out of every 1,000 individuals are affected by genetic disorders, an estimated 70-80 million people globally are contending with single-gene disorders. This widespread incidence underscores the critical demand for robust gene sequencing solutions.
Furthermore, genetic anomalies contribute to health issues in approximately 65% of the population, as congenital genetic mutations present in varied forms. These statistics are compelling: about 1 in 50 people suffer from known single-gene disorders, and 1 in 263 from chromosomal disorders. Additionally, the classification of "rare" genetic disorders affects roughly 1 in 21 individuals. Such disorders, often underserved by traditional medical research, highlight a crucial area for the application of gene sequencing technologies.
The market's growth is catalyzed by the urgent need for accurate diagnostic tools that can effectively identify and understand these genetic variations. As technology in gene sequencing advances, the potential for personalized medicine becomes increasingly attainable, promising tailored therapies that can dramatically improve patient outcomes. The burgeoning demand for precision medicine, in turn, drives innovation and investment in the gene sequencing sector, marking it as a dynamic and rapidly evolving area of the healthcare industry.
Key Takeaways
- Report Overview: The Global Gene Sequencing Market was valued at USD 12.6 billion in 2023 and is projected to reach USD 52.7 billion by 2033, growing at a CAGR of 15.8%.
- Technology Analysis: Next-generation sequencing dominates with 75%, known for advanced capabilities and cost-effectiveness.
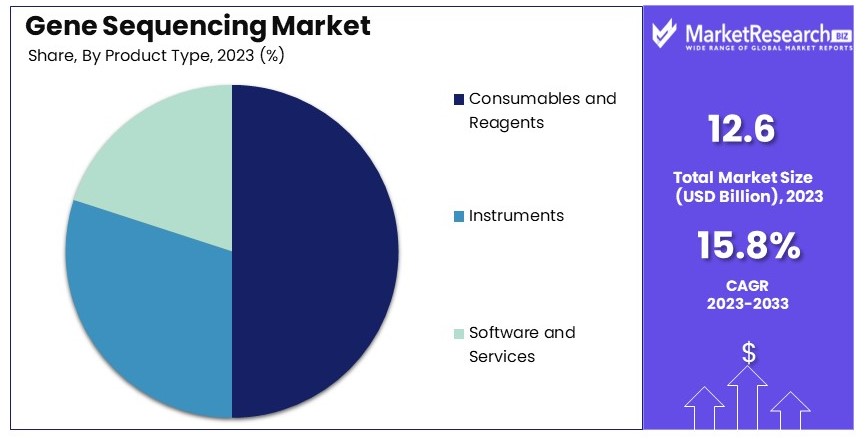
- Product Type Analysis: Consumables and Reagents hold a 51.2% share, crucial for their role in the operational throughput of gene sequencing technologies.
- Application Analysis: Clinical diagnostics leads with 50%, driven by the demand for personalized medicine and the high prevalence of genetic disorders.
- End User Analysis: Research institutes are the largest segment at 55%, due to their extensive involvement in genomic and genetic research.
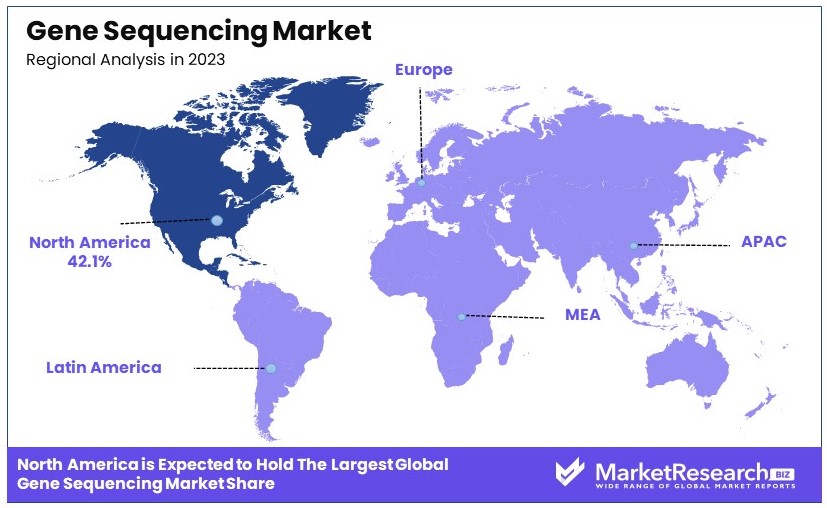
- Dominant Region: North America, with 42.1% of the market, benefits from advanced healthcare infrastructure and significant R&D investment.
- High Growth Region: Asia Pacific, growing at a CAGR of 16.5%, is driven by rising healthcare awareness and economic development.
- Analyst Viewpoint: The market is experiencing a surge due to the increasing need for personalized medicine and advancements in sequencing technologies. However, high costs and ethical concerns could temper growth.
- Growth Opportunities: Liquid biopsy and direct-to-consumer genetic testing present significant opportunities for market expansion due to their less invasive nature and increased consumer interest.
Driving Factors
Increasing Prevalence of Genetic Disorders and Chronic Diseases Drives Market Growth
The gene sequencing market is significantly propelled by the rising incidence of genetic disorders and chronic diseases such as cancer, cardiovascular diseases, and inherited conditions. This growing prevalence has heightened the need for advanced diagnostic methods, where gene sequencing plays a critical role. It allows for early diagnosis and the development of personalized medicine plans, enhancing patient outcomes.
For example, industry leaders like Illumina and Thermo Fisher Scientific are heavily invested in providing gene sequencing technologies specifically tailored for cancer research and diagnostics. The ability of gene sequencing to identify genetic mutations and tailor treatments accordingly is crucial in managing these diseases, thereby driving the demand for these technologies.
Advancements in Next-Generation Sequencing (NGS) Technologies Drives Market Growth
Next-Generation Sequencing (NGS) technologies have revolutionized the gene sequencing market by enhancing the accuracy, reducing costs, and speeding up the sequencing process. Technological innovations such as single-molecule sequencing and nanopore sequencing have expanded gene sequencing applications across various fields including genomics and personalized medicine. This has not only increased the capabilities of research institutions but also enhanced the diagnostic processes within clinical settings.
Companies like Oxford Nanopore Technologies and Pacific Biosciences are at the forefront, developing platforms that push the boundaries of what can be achieved with NGS. The continuous improvement of NGS technologies supports a broader adoption and deeper integration of gene sequencing in both existing and emerging market segments.
Increasing Demand for Personalized Medicine Drives Market Growth
Personalized medicine is becoming a cornerstone of modern healthcare, heavily influencing the gene sequencing market. The ability to tailor treatments based on individual genetic profiles has transformed therapeutic strategies, particularly in oncology and rare genetic disorders. Gene sequencing is integral to this shift, providing the necessary data to customize treatment plans.
Pharmaceutical companies are increasingly using gene sequencing to develop drugs that are more effective for specific genetic profiles, which not only improves patient outcomes but also enhances drug development efficiency. Services like those offered by Foundation Medicine, which provide comprehensive genomic profiling, are pivotal in advancing personalized medicine. The synergy between gene sequencing technology and the rising demand for customized healthcare solutions is a major driver for market expansion.
Restraining Factors
High Cost and Limited Reimbursement Coverage Restrains Market Growth
The substantial cost of gene sequencing technology, including the necessary equipment, reagents, and sophisticated data analysis tools, acts as a major barrier to market expansion. These high costs can be prohibitive for smaller research entities and healthcare providers, limiting the accessibility and adoption of gene sequencing in these environments.
Furthermore, the issue of limited reimbursement coverage by insurance companies exacerbates this problem. When gene sequencing tests are not adequately covered, it discourages their use in clinical settings, where cost-efficiency is often a priority. This lack of financial support from insurance providers not only restricts the utilization of gene sequencing in routine medical practice but also slows the integration of these advanced technologies into standard healthcare protocols, thus restraining market growth.
Ethical and Privacy Concerns Restrains Market Growth
Gene sequencing technology, while powerful, raises significant ethical and privacy concerns that act as a barrier to its broader adoption. Issues such as genetic discrimination, where individuals could be treated differently based on their genetic information, and privacy concerns regarding the handling and storage of sensitive genetic data are paramount.
The potential misuse of genetic information is a serious threat that could lead to social, ethical, and legal complications. Without comprehensive regulatory frameworks and stringent guidelines to govern the use and sharing of genetic data, these ethical challenges remain unresolved. This uncertainty can deter healthcare providers and patients from fully embracing gene sequencing technologies, limiting its market growth and application in potentially beneficial areas such as personalized medicine and genetic research.
Technology Analysis
Next-generation sequencing dominates with 75% due to its advanced capabilities and cost-effectiveness.
The gene sequencing market is extensively characterized by the evolution of technological paradigms, where Next-Generation Sequencing (NGS) emerges as the predominant technology, commanding a substantial share due to its revolutionary impact on genomics and molecular biology. NGS technology enables rapid sequencing of DNA diagnostics and RNA therapeutics much more quickly and cheaply than the traditional Sanger sequencing, thereby significantly driving down the cost of genetic research and increasing the speed and efficiency of biological and medical sciences.
Sanger Sequencing, though less dominant, continues to play a critical role, particularly in applications requiring high accuracy and longer read lengths. It is revered for its reliability and precision, often serving as a benchmark for validating NGS results. Meanwhile, Third-Generation Sequencing technologies, which provide real-time sequencing data and the ability to sequence longer DNA fragments, are gradually gaining traction. These technologies are particularly beneficial for complex genomic regions and structural variant identifications, contributing to their growing adoption in specific research contexts.
Product Type Analysis
Consumables and Reagents dominate with 51.2% due to their essential role in ongoing sequencing operations and the recurrent need for these products.
The gene sequencing market is prominently categorized by product type, with the "Consumables and Reagents" segment holding a significant share. This segment's dominance, accounting for 51.2% of the market, is primarily attributed to the essential nature of consumables and reagents in both academic research and clinical settings. These products are indispensable for the daily operations of gene sequencing, necessitating frequent replenishment and thus driving continuous demand.
Within the "Consumables and Reagents" segment, various sub-segments contribute to its substantial market share. The "Kits" sub-segment, comprising specialized kits for different types of sequencing procedures, plays a crucial role. These kits are designed to streamline the sequencing process, ensuring efficiency and reliability, which are vital in settings that demand high throughput and accuracy. Another critical sub-segment, "Enzymes", includes those necessary for the sequencing reactions themselves. Enzymes like DNA polymerases and ligases are core to the sequencing process, influencing the speed and fidelity of the results.
The "Buffers" sub-segment also supports the functioning of these enzymes and other components within the kits, maintaining the necessary chemical environment for optimal sequencing reactions. The consumables are not only pivotal due to their functional roles but also due to their repeated use, which ensures a steady market demand.
Application Analysis
Clinical diagnostics dominates with 50% due to the growing demand for personalized medicine and the rising prevalence of genetic disorders.
The application segment of the gene sequencing market is significantly led by clinical diagnostics, where gene sequencing is pivotal in detecting a wide array of genetic disorders, infectious diseases, and cancers. The dominance of this sub-segment is propelled by the critical need for accurate diagnosis, which directly influences therapeutic decisions and patient management strategies.
Research applications, including genomics, transcriptomics, and epigenomics, also contribute notably to the market, driven by the global emphasis on understanding genetic and epigenetic factors underlying various biological processes and diseases. Drug discovery and development, personalized medicine, agriculture and animal research, and forensics further diversify the applications of gene sequencing. These segments underscore the expanding scope of gene sequencing technologies beyond traditional boundaries, facilitating groundbreaking discoveries and innovations.
In essence, while clinical diagnostics lead due to direct impacts on patient care, other applications such as research and drug development are essential for driving forward the capabilities and utility of gene sequencing in broader scientific and medical domains.
End User Analysis
Research institutes dominate with 55% due to their extensive involvement in genomic and genetic research.
The end-user segment of the gene sequencing market is predominantly occupied by research institutes, which are instrumental in pushing the frontiers of genetic and genomic research. Their dominance is underpinned by substantial investments in R&D and their pivotal role in advancing scientific knowledge and applications in genetics.
Hospitals and clinics, though not as dominant, are crucial for the practical application of gene sequencing in clinical diagnostics and patient management. Pharmaceutical and biotechnology companies leverage gene sequencing for drug discovery and development, aligning with their strategic emphasis on innovation. Academic institutions and contract research organizations (CROs) further populate the landscape, each contributing uniquely to the development and application of gene sequencing technologies through specialized research, educational initiatives, and collaborative projects.
While research institutes take the lead due to their comprehensive engagement in genetic research, other end-users like hospitals and pharmaceutical companies play key roles in translating these advancements into clinical and therapeutic contexts.
Key Market Segments
By Technology
- Next-Generation Sequencing (NGS)
- Sanger Sequencing
- Third-Generation Sequencing
By Product Type
- Instruments
- Sequencers
- Sample Preparation Systems
- Consumables and Reagents
- Kits
- Enzymes
- Buffers
- Software and Services
- Data Analysis Software
- Bioinformatics Services
- Cloud-based Solutions
By Application
- Clinical Diagnostics
- Cancer
- Infectious Diseases
- Rare Genetic Disorders
- Research
- Genomics
- Transcriptomics
- Epigenomics
- Drug Discovery and Development
- Personalized Medicine
- Agriculture and Animal Research
- Forensics
- Others
By End User
- Hospitals and Clinics
- Research Institutes
- Pharmaceutical and Biotechnology Companies
- Academic Institutions
- Contract Research Organizations (CROs)
- Others
Growth Opportunities
Liquid Biopsy and Non-Invasive Diagnostics Offer Growth Opportunity
The advancement of liquid biopsy techniques marks a significant growth opportunity within the gene sequencing market. These techniques, which analyze circulating tumor DNA (ctDNA) and other biomarkers from bodily fluids, offer a less invasive alternative to traditional tissue biopsies.
Liquid biopsies are increasingly used in cancer diagnostics and monitoring, providing a dynamic view of tumor progression and response to treatment. The ability to conduct frequent and non-invasive tests is particularly appealing in clinical settings, enhancing patient comfort and compliance. As these methods become more refined and validated, their adoption is expected to increase, driving demand for gene sequencing technologies that can accurately and efficiently analyze these biomarkers.
Direct-to-Consumer (DTC) Genetic Testing Offers Growth Opportunity
Direct-to-Consumer (DTC) genetic testing has emerged as a dynamic sector within the gene sequencing market. Companies like 23andMe and AncestryDNA have popularized genetic testing among consumers by offering services that do not require a healthcare provider. These tests, which can analyze ancestry, health risks, and personal traits, have significantly broadened the consumer base for gene sequencing.
The accessibility of genetic information empowers individuals to make informed decisions about their health and heritage, stimulating continued interest and demand in the gene sequencing sector. As consumer awareness and interest in personal genetic information grow, the DTC genetic testing market is poised for further expansion, driving the broader adoption of gene sequencing technologies.
Trending Factors
Single-Cell Sequencing Are Trending Factors
Single-cell sequencing is rapidly gaining prominence in the gene sequencing market due to its ability to provide detailed insights at the cellular level. This technology enables the analysis of the genomic and transcriptomic profiles of individual cells, offering a deeper understanding of cellular heterogeneity within a sample.
It has pivotal applications in cancer research, developmental biology, and complex disease analysis, where understanding individual cell behavior is crucial. The insights gained from single-cell sequencing are invaluable in identifying new disease mechanisms and potential therapeutic targets, contributing significantly to the trend towards more precise and personalized medicine.
Long-Read Sequencing Are Trending Factors
Long-read sequencing technologies are trending in the gene sequencing market because they allow for the sequencing of longer DNA fragments, which is crucial for exploring complex genomic regions and structural variations. Technologies provided by companies like Pacific Biosciences and Oxford Nanopore Technologies enable more comprehensive and accurate genomic analysis.
This capability is particularly important for research involving complex genetic rearrangements and repetitive sequences, which are challenging to resolve with shorter reads. The enhanced accuracy and scope of genomic analysis offered by long-read sequencing make it a critical tool in advancing genomic research and clinical diagnostics, setting the stage for its continued growth and integration into various scientific and medical disciplines.
Regional Analysis
North America Dominates with 42.1% Market Share
North America's dominance in the gene sequencing market is driven by advanced healthcare infrastructure, significant investments in genomics research, and the presence of leading companies like Illumina and Thermo Fisher Scientific. Strong governmental support through funding and favorable policies also play a critical role. The region's robust biotechnology sector and high adoption rates of new technologies further enhance its market leadership.
The high concentration of top-tier research institutions and universities in North America fosters innovation and early adoption of cutting-edge gene sequencing technologies. The region's well-established regulatory framework ensures the safe and efficient implementation of these technologies. Additionally, strong collaborations between academia, industry, and government accelerate the development and commercialization of new sequencing applications.
North America's market presence is expected to remain strong, with a projected CAGR of 14.3% from 2023 to 2033. Continued investments in personalized medicine and precision oncology will drive further growth. The increasing focus on non-invasive diagnostics and the expanding application of gene sequencing in clinical settings are likely to sustain the region's leading position.
Regional Market Shares and Growth Rates
Europe: Europe holds 30.2% of the gene sequencing market. The region benefits from substantial research funding and strong collaboration among research institutions. The market is expected to grow at a CAGR of 13.8% from 2023 to 2033, driven by increasing demand for personalized medicine and advancements in sequencing technologies.
Asia Pacific: Asia Pacific accounts for 18.4% of the market. Rapid economic development, increasing healthcare expenditure, and growing awareness of genetic testing drive growth. The market is projected to expand at a CAGR of 16.5% from 2023 to 2033, making it the fastest-growing region.
Middle East & Africa: The Middle East & Africa region holds a smaller market share of 5.3%. Growth is driven by improving healthcare infrastructure and rising investment in medical research. The market is expected to grow at a CAGR of 12.1% from 2023 to 2033.
Latin America: Latin America represents 4.0% of the gene sequencing market. Increasing government initiatives and growing adoption of sequencing technologies in research and clinical diagnostics contribute to market growth. The region is forecasted to grow at a CAGR of 12.7% from 2023 to 2033.
Key Regions and Countries
- North America
- The US
- Canada
- Mexico
- Western Europe
- Germany
- France
- The UK
- Spain
- Italy
- Portugal
- Ireland
- Austria
- Switzerland
- Benelux
- Nordic
- Rest of Western Europe
- Eastern Europe
- Russia
- Poland
- The Czech Republic
- Greece
- Rest of Eastern Europe
- APAC
- China
- Japan
- South Korea
- India
- Australia & New Zealand
- Indonesia
- Malaysia
- Philippines
- Singapore
- Thailand
- Vietnam
- Rest of APAC
- Latin America
- Brazil
- Colombia
- Chile
- Argentina
- Costa Rica
- Rest of Latin America
- Middle East & Africa
- Algeria
- Egypt
- Israel
- Kuwait
- Nigeria
- Saudi Arabia
- South Africa
- Turkey
- United Arab Emirates
- Rest of MEA
Key Players Analysis
The gene sequencing market is dominated by several key players. Illumina, Inc. and Thermo Fisher Scientific Inc. lead the market with their advanced sequencing technologies and broad product portfolios. Their strong R&D capabilities and global reach ensure top positions.
BGI Group and Pacific Biosciences of California, Inc. are significant players known for their innovative sequencing solutions. Their focus on high-throughput and long-read sequencing technologies enhances their market influence.
Oxford Nanopore Technologies Ltd. stands out with its portable and real-time sequencing devices, making it a key innovator in the market. QIAGEN N.V. and Agilent Technologies, Inc. hold substantial market shares due to their comprehensive genomic solutions and strong customer bases.
Roche Holding AG and Bio-Rad Laboratories, Inc. leverage their extensive healthcare expertise and established brands to maintain competitive edges. Their robust sales networks and effective marketing strategies boost their market impact.
Genomic Health, Inc., now a subsidiary of Exact Sciences Corporation, specializes in genomic diagnostics, contributing significantly to the personalized medicine segment. Macrogen, Inc. and PerkinElmer, Inc. are noted for their strong presence in clinical and research sequencing services.
GENEWIZ, a subsidiary of Brooks Automation, focuses on providing high-quality sequencing services, enhancing its market position. Myriad Genetics, Inc. is recognized for its role in genetic testing and precision medicine, while 10x Genomics, Inc. is known for its single-cell sequencing innovations.
Overall, these key players shape the gene sequencing market with their advanced technologies, strong R&D, and strategic positioning. Their combined efforts drive market growth and innovation.
Market Key Players
- Illumina, Inc.
- Thermo Fisher Scientific Inc.
- BGI Group
- Pacific Biosciences of California, Inc.
- Oxford Nanopore Technologies Ltd.
- QIAGEN N.V.
- Agilent Technologies, Inc.
- Roche Holding AG
- Bio-Rad Laboratories, Inc.
- Genomic Health, Inc. (a subsidiary of Exact Sciences Corporation)
- Macrogen, Inc.
- PerkinElmer, Inc.
- GENEWIZ (a subsidiary of Brooks Automation)
- Myriad Genetics, Inc.
- 10x Genomics, Inc.
- Other Key Players
Recent Developments
- February 2024: The Indian government's Genome India initiative sequenced 10,000 healthy genomes, creating a comprehensive genetic map of India. This data can help identify disease-causing variants, resistance to certain drugs, and targets for diagnostics and therapies. The dataset will be stored at the Indian Biological Data Centre and made available as a digital public good for research.
- February 2024: Researchers generated the first complete chromosome sequences from non-human primates, revealing significant variations in Y chromosomes among species. These sequences provide insights into human evolution and primate genome structure. The Y chromosomes exhibit dynamic evolution, while the X chromosomes are more stable. The findings emphasize the rapid evolution of Y chromosomes and their implications for fertility and genetic diversity.
- April 2023: Researchers successfully decoded the genome of the pineapple mint (Mentha suaveolens), a herb valued for its aroma and medicinal properties. The genus Mentha contains strongly scented herbs with diverse components suitable for various applications. The pineapple mint is the cultivated variegated form of apple mint, widely used in medicine due to its therapeutic properties.
- March 2020: The Pan-Cancer Analysis of Whole Genomes (PCAWG) consortium analyzed over 2,600 cancer genomes, the largest whole-genome sequencing study in cancer to date. The study revealed new cancer genes, mutational signatures, and structural variations across 38 cancer types.
Report Scope
Report Features Description Market Value (2023) USD 12.6 Billion Forecast Revenue (2033) USD 52.7 Billion CAGR (2024-2033) 15.8% Base Year for Estimation 2023 Historic Period 2018-2023 Forecast Period 2024-2033 Report Coverage Revenue Forecast, Market Dynamics, Competitive Landscape, Recent Developments Segments Covered By Technology (Next-Generation Sequencing (NGS), Sanger Sequencing, Third-Generation Sequencing), By Product Type (Instruments, Sequencers, Sample Preparation Systems, Consumables and Reagents, Kits, Enzymes, Buffers, Software and Services, Data Analysis Software, Bioinformatics Services, Cloud-based Solutions), By Application (Clinical Diagnostics, Cancer, Infectious Diseases, Rare Genetic Disorders, Research, Genomics, Transcriptomics, Epigenomics, Drug Discovery and Development, Personalized Medicine, Agriculture and Animal Research, Forensics, Others), By End User (Hospitals and Clinics, Research Institutes, Pharmaceutical and Biotechnology Companies, Academic Institutions, Contract Research Organizations (CROs), Others) Regional Analysis North America - The US, Canada, & Mexico; Western Europe - Germany, France, The UK, Spain, Italy, Portugal, Ireland, Austria, Switzerland, Benelux, Nordic, & Rest of Western Europe; Eastern Europe - Russia, Poland, The Czech Republic, Greece, & Rest of Eastern Europe; APAC - China, Japan, South Korea, India, Australia & New Zealand, Indonesia, Malaysia, Philippines, Singapore, Thailand, Vietnam, & Rest of APAC; Latin America - Brazil, Colombia, Chile, Argentina, Costa Rica, & Rest of Latin America; Middle East & Africa - Algeria, Egypt, Israel, Kuwait, Nigeria, Saudi Arabia, South Africa, Turkey, United Arab Emirates, & Rest of MEA Competitive Landscape Illumina, Inc., Thermo Fisher Scientific Inc., BGI Group, Pacific Biosciences of California, Inc., Oxford Nanopore Technologies Ltd., QIAGEN N.V., Agilent Technologies, Inc., Roche Holding AG, Bio-Rad Laboratories, Inc., Genomic Health, Inc. (a subsidiary of Exact Sciences Corporation), Macrogen, Inc., PerkinElmer, Inc., GENEWIZ (a subsidiary of Brooks Automation), Myriad Genetics, Inc., 10x Genomics, Inc., Other Key Players Customization Scope Customization for segments, region/country-level will be provided. Moreover, additional customization can be done based on the requirements. Purchase Options We have three licenses to opt for: Single User License, Multi-User License (Up to 5 Users), Corporate Use License (Unlimited User and Printable PDF) -
- 1. Executive Summary
- 1.1. Definition
- 1.2. Taxonomy
- 1.3. Research Scope
- 1.4. Key Analysis
- 1.5. Key Findings by Major Segments
- 1.6. Top strategies by Major Players
- 2. Global Gene Sequencing Market Overview
- 2.1. Gene Sequencing Market Dynamics
- 2.1.1. Drivers
- 2.1.2. Opportunities
- 2.1.3. Restraints
- 2.1.4. Challenges
- 2.2. Macro-economic Factors
- 2.3. Regulatory Framework
- 2.4. Market Investment Feasibility Index
- 2.5. PEST Analysis
- 2.6. PORTER’S Five Force Analysis
- 2.7. Drivers & Restraints Impact Analysis
- 2.8. Industry Chain Analysis
- 2.9. Cost Structure Analysis
- 2.10. Marketing Strategy
- 2.11. Russia-Ukraine War Impact Analysis
- 2.12. Opportunity Map Analysis
- 2.13. Market Competition Scenario Analysis
- 2.14. Product Life Cycle Analysis
- 2.15. Opportunity Orbits
- 2.16. Manufacturer Intensity Map
- 2.17. Major Companies sales by Value & Volume
- 2.1. Gene Sequencing Market Dynamics
- 3. Global Gene Sequencing Market Analysis, Opportunity and Forecast, 2016-2032
- 3.1. Global Gene Sequencing Market Analysis, 2016-2021
- 3.2. Global Gene Sequencing Market Opportunity and Forecast, 2023-2032
- 3.3. Global Gene Sequencing Market Analysis, Opportunity and Forecast, By Technology, 2016-2032
- 3.3.1. Global Gene Sequencing Market Analysis by Technology: Introduction
- 3.3.2. Market Size Absolute $ Opportunity Analysis and Forecast, By Technology, 2016-2032
- 3.3.3. Next-Generation Sequencing (NGS)
- 3.3.4. Sanger Sequencing
- 3.3.5. Third-Generation Sequencing
- 3.4. Global Gene Sequencing Market Analysis, Opportunity and Forecast, By Product Type, 2016-2032
- 3.4.1. Global Gene Sequencing Market Analysis by Product Type: Introduction
- 3.4.2. Market Size Absolute $ Opportunity Analysis and Forecast, By Product Type, 2016-2032
- 3.4.3. Instruments
- 3.4.4. Consumables and Reagents
- 3.4.5. Software and Services
- 3.5. Global Gene Sequencing Market Analysis, Opportunity and Forecast, By Application, 2016-2032
- 3.5.1. Global Gene Sequencing Market Analysis by Application: Introduction
- 3.5.2. Market Size Absolute $ Opportunity Analysis and Forecast, By Application, 2016-2032
- 3.5.3. Clinical Diagnostics
- 3.5.4. Research
- 3.5.5. Drug Discovery and Development
- 3.5.6. Personalized Medicine
- 3.5.7. Agriculture and Animal Research
- 3.5.8. Forensics
- 3.5.9. Others
- 3.6. Global Gene Sequencing Market Analysis, Opportunity and Forecast, By End User, 2016-2032
- 3.6.1. Global Gene Sequencing Market Analysis by End User: Introduction
- 3.6.2. Market Size Absolute $ Opportunity Analysis and Forecast, By End User, 2016-2032
- 3.6.3. Hospitals and Clinics
- 3.6.4. Research Institutes
- 3.6.5. Pharmaceutical and Biotechnology Companies
- 3.6.6. Academic Institutions
- 3.6.7. Contract Research Organizations (CROs)
- 3.6.8. Others
- 4. North America Gene Sequencing Market Analysis, Opportunity and Forecast, 2016-2032
- 4.1. North America Gene Sequencing Market Analysis, 2016-2021
- 4.2. North America Gene Sequencing Market Opportunity and Forecast, 2023-2032
- 4.3. North America Gene Sequencing Market Analysis, Opportunity and Forecast, By Technology, 2016-2032
- 4.3.1. North America Gene Sequencing Market Analysis by Technology: Introduction
- 4.3.2. Market Size Absolute $ Opportunity Analysis and Forecast, By Technology, 2016-2032
- 4.3.3. Next-Generation Sequencing (NGS)
- 4.3.4. Sanger Sequencing
- 4.3.5. Third-Generation Sequencing
- 4.4. North America Gene Sequencing Market Analysis, Opportunity and Forecast, By Product Type, 2016-2032
- 4.4.1. North America Gene Sequencing Market Analysis by Product Type: Introduction
- 4.4.2. Market Size Absolute $ Opportunity Analysis and Forecast, By Product Type, 2016-2032
- 4.4.3. Instruments
- 4.4.4. Consumables and Reagents
- 4.4.5. Software and Services
- 4.5. North America Gene Sequencing Market Analysis, Opportunity and Forecast, By Application, 2016-2032
- 4.5.1. North America Gene Sequencing Market Analysis by Application: Introduction
- 4.5.2. Market Size Absolute $ Opportunity Analysis and Forecast, By Application, 2016-2032
- 4.5.3. Clinical Diagnostics
- 4.5.4. Research
- 4.5.5. Drug Discovery and Development
- 4.5.6. Personalized Medicine
- 4.5.7. Agriculture and Animal Research
- 4.5.8. Forensics
- 4.5.9. Others
- 4.6. North America Gene Sequencing Market Analysis, Opportunity and Forecast, By End User, 2016-2032
- 4.6.1. North America Gene Sequencing Market Analysis by End User: Introduction
- 4.6.2. Market Size Absolute $ Opportunity Analysis and Forecast, By End User, 2016-2032
- 4.6.3. Hospitals and Clinics
- 4.6.4. Research Institutes
- 4.6.5. Pharmaceutical and Biotechnology Companies
- 4.6.6. Academic Institutions
- 4.6.7. Contract Research Organizations (CROs)
- 4.6.8. Others
- 4.7. North America Gene Sequencing Market Analysis, Opportunity and Forecast, By Country , 2016-2032
- 4.7.1. North America Gene Sequencing Market Analysis by Country : Introduction
- 4.7.2. Market Size Absolute $ Opportunity Analysis and Forecast, Country , 2016-2032
- 4.7.2.1. The US
- 4.7.2.2. Canada
- 4.7.2.3. Mexico
- 5. Western Europe Gene Sequencing Market Analysis, Opportunity and Forecast, 2016-2032
- 5.1. Western Europe Gene Sequencing Market Analysis, 2016-2021
- 5.2. Western Europe Gene Sequencing Market Opportunity and Forecast, 2023-2032
- 5.3. Western Europe Gene Sequencing Market Analysis, Opportunity and Forecast, By Technology, 2016-2032
- 5.3.1. Western Europe Gene Sequencing Market Analysis by Technology: Introduction
- 5.3.2. Market Size Absolute $ Opportunity Analysis and Forecast, By Technology, 2016-2032
- 5.3.3. Next-Generation Sequencing (NGS)
- 5.3.4. Sanger Sequencing
- 5.3.5. Third-Generation Sequencing
- 5.4. Western Europe Gene Sequencing Market Analysis, Opportunity and Forecast, By Product Type, 2016-2032
- 5.4.1. Western Europe Gene Sequencing Market Analysis by Product Type: Introduction
- 5.4.2. Market Size Absolute $ Opportunity Analysis and Forecast, By Product Type, 2016-2032
- 5.4.3. Instruments
- 5.4.4. Consumables and Reagents
- 5.4.5. Software and Services
- 5.5. Western Europe Gene Sequencing Market Analysis, Opportunity and Forecast, By Application, 2016-2032
- 5.5.1. Western Europe Gene Sequencing Market Analysis by Application: Introduction
- 5.5.2. Market Size Absolute $ Opportunity Analysis and Forecast, By Application, 2016-2032
- 5.5.3. Clinical Diagnostics
- 5.5.4. Research
- 5.5.5. Drug Discovery and Development
- 5.5.6. Personalized Medicine
- 5.5.7. Agriculture and Animal Research
- 5.5.8. Forensics
- 5.5.9. Others
- 5.6. Western Europe Gene Sequencing Market Analysis, Opportunity and Forecast, By End User, 2016-2032
- 5.6.1. Western Europe Gene Sequencing Market Analysis by End User: Introduction
- 5.6.2. Market Size Absolute $ Opportunity Analysis and Forecast, By End User, 2016-2032
- 5.6.3. Hospitals and Clinics
- 5.6.4. Research Institutes
- 5.6.5. Pharmaceutical and Biotechnology Companies
- 5.6.6. Academic Institutions
- 5.6.7. Contract Research Organizations (CROs)
- 5.6.8. Others
- 5.7. Western Europe Gene Sequencing Market Analysis, Opportunity and Forecast, By Country , 2016-2032
- 5.7.1. Western Europe Gene Sequencing Market Analysis by Country : Introduction
- 5.7.2. Market Size Absolute $ Opportunity Analysis and Forecast, Country , 2016-2032
- 5.7.2.1. Germany
- 5.7.2.2. France
- 5.7.2.3. The UK
- 5.7.2.4. Spain
- 5.7.2.5. Italy
- 5.7.2.6. Portugal
- 5.7.2.7. Ireland
- 5.7.2.8. Austria
- 5.7.2.9. Switzerland
- 5.7.2.10. Benelux
- 5.7.2.11. Nordic
- 5.7.2.12. Rest of Western Europe
- 6. Eastern Europe Gene Sequencing Market Analysis, Opportunity and Forecast, 2016-2032
- 6.1. Eastern Europe Gene Sequencing Market Analysis, 2016-2021
- 6.2. Eastern Europe Gene Sequencing Market Opportunity and Forecast, 2023-2032
- 6.3. Eastern Europe Gene Sequencing Market Analysis, Opportunity and Forecast, By Technology, 2016-2032
- 6.3.1. Eastern Europe Gene Sequencing Market Analysis by Technology: Introduction
- 6.3.2. Market Size Absolute $ Opportunity Analysis and Forecast, By Technology, 2016-2032
- 6.3.3. Next-Generation Sequencing (NGS)
- 6.3.4. Sanger Sequencing
- 6.3.5. Third-Generation Sequencing
- 6.4. Eastern Europe Gene Sequencing Market Analysis, Opportunity and Forecast, By Product Type, 2016-2032
- 6.4.1. Eastern Europe Gene Sequencing Market Analysis by Product Type: Introduction
- 6.4.2. Market Size Absolute $ Opportunity Analysis and Forecast, By Product Type, 2016-2032
- 6.4.3. Instruments
- 6.4.4. Consumables and Reagents
- 6.4.5. Software and Services
- 6.5. Eastern Europe Gene Sequencing Market Analysis, Opportunity and Forecast, By Application, 2016-2032
- 6.5.1. Eastern Europe Gene Sequencing Market Analysis by Application: Introduction
- 6.5.2. Market Size Absolute $ Opportunity Analysis and Forecast, By Application, 2016-2032
- 6.5.3. Clinical Diagnostics
- 6.5.4. Research
- 6.5.5. Drug Discovery and Development
- 6.5.6. Personalized Medicine
- 6.5.7. Agriculture and Animal Research
- 6.5.8. Forensics
- 6.5.9. Others
- 6.6. Eastern Europe Gene Sequencing Market Analysis, Opportunity and Forecast, By End User, 2016-2032
- 6.6.1. Eastern Europe Gene Sequencing Market Analysis by End User: Introduction
- 6.6.2. Market Size Absolute $ Opportunity Analysis and Forecast, By End User, 2016-2032
- 6.6.3. Hospitals and Clinics
- 6.6.4. Research Institutes
- 6.6.5. Pharmaceutical and Biotechnology Companies
- 6.6.6. Academic Institutions
- 6.6.7. Contract Research Organizations (CROs)
- 6.6.8. Others
- 6.7. Eastern Europe Gene Sequencing Market Analysis, Opportunity and Forecast, By Country , 2016-2032
- 6.7.1. Eastern Europe Gene Sequencing Market Analysis by Country : Introduction
- 6.7.2. Market Size Absolute $ Opportunity Analysis and Forecast, Country , 2016-2032
- 6.7.2.1. Russia
- 6.7.2.2. Poland
- 6.7.2.3. The Czech Republic
- 6.7.2.4. Greece
- 6.7.2.5. Rest of Eastern Europe
- 7. APAC Gene Sequencing Market Analysis, Opportunity and Forecast, 2016-2032
- 7.1. APAC Gene Sequencing Market Analysis, 2016-2021
- 7.2. APAC Gene Sequencing Market Opportunity and Forecast, 2023-2032
- 7.3. APAC Gene Sequencing Market Analysis, Opportunity and Forecast, By Technology, 2016-2032
- 7.3.1. APAC Gene Sequencing Market Analysis by Technology: Introduction
- 7.3.2. Market Size Absolute $ Opportunity Analysis and Forecast, By Technology, 2016-2032
- 7.3.3. Next-Generation Sequencing (NGS)
- 7.3.4. Sanger Sequencing
- 7.3.5. Third-Generation Sequencing
- 7.4. APAC Gene Sequencing Market Analysis, Opportunity and Forecast, By Product Type, 2016-2032
- 7.4.1. APAC Gene Sequencing Market Analysis by Product Type: Introduction
- 7.4.2. Market Size Absolute $ Opportunity Analysis and Forecast, By Product Type, 2016-2032
- 7.4.3. Instruments
- 7.4.4. Consumables and Reagents
- 7.4.5. Software and Services
- 7.5. APAC Gene Sequencing Market Analysis, Opportunity and Forecast, By Application, 2016-2032
- 7.5.1. APAC Gene Sequencing Market Analysis by Application: Introduction
- 7.5.2. Market Size Absolute $ Opportunity Analysis and Forecast, By Application, 2016-2032
- 7.5.3. Clinical Diagnostics
- 7.5.4. Research
- 7.5.5. Drug Discovery and Development
- 7.5.6. Personalized Medicine
- 7.5.7. Agriculture and Animal Research
- 7.5.8. Forensics
- 7.5.9. Others
- 7.6. APAC Gene Sequencing Market Analysis, Opportunity and Forecast, By End User, 2016-2032
- 7.6.1. APAC Gene Sequencing Market Analysis by End User: Introduction
- 7.6.2. Market Size Absolute $ Opportunity Analysis and Forecast, By End User, 2016-2032
- 7.6.3. Hospitals and Clinics
- 7.6.4. Research Institutes
- 7.6.5. Pharmaceutical and Biotechnology Companies
- 7.6.6. Academic Institutions
- 7.6.7. Contract Research Organizations (CROs)
- 7.6.8. Others
- 7.7. APAC Gene Sequencing Market Analysis, Opportunity and Forecast, By Country , 2016-2032
- 7.7.1. APAC Gene Sequencing Market Analysis by Country : Introduction
- 7.7.2. Market Size Absolute $ Opportunity Analysis and Forecast, Country , 2016-2032
- 7.7.2.1. China
- 7.7.2.2. Japan
- 7.7.2.3. South Korea
- 7.7.2.4. India
- 7.7.2.5. Australia & New Zeland
- 7.7.2.6. Indonesia
- 7.7.2.7. Malaysia
- 7.7.2.8. Philippines
- 7.7.2.9. Singapore
- 7.7.2.10. Thailand
- 7.7.2.11. Vietnam
- 7.7.2.12. Rest of APAC
- 8. Latin America Gene Sequencing Market Analysis, Opportunity and Forecast, 2016-2032
- 8.1. Latin America Gene Sequencing Market Analysis, 2016-2021
- 8.2. Latin America Gene Sequencing Market Opportunity and Forecast, 2023-2032
- 8.3. Latin America Gene Sequencing Market Analysis, Opportunity and Forecast, By Technology, 2016-2032
- 8.3.1. Latin America Gene Sequencing Market Analysis by Technology: Introduction
- 8.3.2. Market Size Absolute $ Opportunity Analysis and Forecast, By Technology, 2016-2032
- 8.3.3. Next-Generation Sequencing (NGS)
- 8.3.4. Sanger Sequencing
- 8.3.5. Third-Generation Sequencing
- 8.4. Latin America Gene Sequencing Market Analysis, Opportunity and Forecast, By Product Type, 2016-2032
- 8.4.1. Latin America Gene Sequencing Market Analysis by Product Type: Introduction
- 8.4.2. Market Size Absolute $ Opportunity Analysis and Forecast, By Product Type, 2016-2032
- 8.4.3. Instruments
- 8.4.4. Consumables and Reagents
- 8.4.5. Software and Services
- 8.5. Latin America Gene Sequencing Market Analysis, Opportunity and Forecast, By Application, 2016-2032
- 8.5.1. Latin America Gene Sequencing Market Analysis by Application: Introduction
- 8.5.2. Market Size Absolute $ Opportunity Analysis and Forecast, By Application, 2016-2032
- 8.5.3. Clinical Diagnostics
- 8.5.4. Research
- 8.5.5. Drug Discovery and Development
- 8.5.6. Personalized Medicine
- 8.5.7. Agriculture and Animal Research
- 8.5.8. Forensics
- 8.5.9. Others
- 8.6. Latin America Gene Sequencing Market Analysis, Opportunity and Forecast, By End User, 2016-2032
- 8.6.1. Latin America Gene Sequencing Market Analysis by End User: Introduction
- 8.6.2. Market Size Absolute $ Opportunity Analysis and Forecast, By End User, 2016-2032
- 8.6.3. Hospitals and Clinics
- 8.6.4. Research Institutes
- 8.6.5. Pharmaceutical and Biotechnology Companies
- 8.6.6. Academic Institutions
- 8.6.7. Contract Research Organizations (CROs)
- 8.6.8. Others
- 8.7. Latin America Gene Sequencing Market Analysis, Opportunity and Forecast, By Country , 2016-2032
- 8.7.1. Latin America Gene Sequencing Market Analysis by Country : Introduction
- 8.7.2. Market Size Absolute $ Opportunity Analysis and Forecast, Country , 2016-2032
- 8.7.2.1. Brazil
- 8.7.2.2. Colombia
- 8.7.2.3. Chile
- 8.7.2.4. Argentina
- 8.7.2.5. Costa Rica
- 8.7.2.6. Rest of Latin America
- 9. Middle East & Africa Gene Sequencing Market Analysis, Opportunity and Forecast, 2016-2032
- 9.1. Middle East & Africa Gene Sequencing Market Analysis, 2016-2021
- 9.2. Middle East & Africa Gene Sequencing Market Opportunity and Forecast, 2023-2032
- 9.3. Middle East & Africa Gene Sequencing Market Analysis, Opportunity and Forecast, By Technology, 2016-2032
- 9.3.1. Middle East & Africa Gene Sequencing Market Analysis by Technology: Introduction
- 9.3.2. Market Size Absolute $ Opportunity Analysis and Forecast, By Technology, 2016-2032
- 9.3.3. Next-Generation Sequencing (NGS)
- 9.3.4. Sanger Sequencing
- 9.3.5. Third-Generation Sequencing
- 9.4. Middle East & Africa Gene Sequencing Market Analysis, Opportunity and Forecast, By Product Type, 2016-2032
- 9.4.1. Middle East & Africa Gene Sequencing Market Analysis by Product Type: Introduction
- 9.4.2. Market Size Absolute $ Opportunity Analysis and Forecast, By Product Type, 2016-2032
- 9.4.3. Instruments
- 9.4.4. Consumables and Reagents
- 9.4.5. Software and Services
- 9.5. Middle East & Africa Gene Sequencing Market Analysis, Opportunity and Forecast, By Application, 2016-2032
- 9.5.1. Middle East & Africa Gene Sequencing Market Analysis by Application: Introduction
- 9.5.2. Market Size Absolute $ Opportunity Analysis and Forecast, By Application, 2016-2032
- 9.5.3. Clinical Diagnostics
- 9.5.4. Research
- 9.5.5. Drug Discovery and Development
- 9.5.6. Personalized Medicine
- 9.5.7. Agriculture and Animal Research
- 9.5.8. Forensics
- 9.5.9. Others
- 9.6. Middle East & Africa Gene Sequencing Market Analysis, Opportunity and Forecast, By End User, 2016-2032
- 9.6.1. Middle East & Africa Gene Sequencing Market Analysis by End User: Introduction
- 9.6.2. Market Size Absolute $ Opportunity Analysis and Forecast, By End User, 2016-2032
- 9.6.3. Hospitals and Clinics
- 9.6.4. Research Institutes
- 9.6.5. Pharmaceutical and Biotechnology Companies
- 9.6.6. Academic Institutions
- 9.6.7. Contract Research Organizations (CROs)
- 9.6.8. Others
- 9.7. Middle East & Africa Gene Sequencing Market Analysis, Opportunity and Forecast, By Country , 2016-2032
- 9.7.1. Middle East & Africa Gene Sequencing Market Analysis by Country : Introduction
- 9.7.2. Market Size Absolute $ Opportunity Analysis and Forecast, Country , 2016-2032
- 9.7.2.1. Algeria
- 9.7.2.2. Egypt
- 9.7.2.3. Israel
- 9.7.2.4. Kuwait
- 9.7.2.5. Nigeria
- 9.7.2.6. Saudi Arabia
- 9.7.2.7. South Africa
- 9.7.2.8. Turkey
- 9.7.2.9. The UAE
- 9.7.2.10. Rest of MEA
- 10. Global Gene Sequencing Market Analysis, Opportunity and Forecast, By Region , 2016-2032
- 10.1. Global Gene Sequencing Market Analysis by Region : Introduction
- 10.2. Market Size Absolute $ Opportunity Analysis and Forecast, By Region , 2016-2032
- 10.2.1. North America
- 10.2.2. Western Europe
- 10.2.3. Eastern Europe
- 10.2.4. APAC
- 10.2.5. Latin America
- 10.2.6. Middle East & Africa
- 11. Global Gene Sequencing Market Competitive Landscape, Market Share Analysis, and Company Profiles
- 11.1. Market Share Analysis
- 11.2. Company Profiles
- 11.3. Illumina, Inc.
- 11.3.1. Company Overview
- 11.3.2. Financial Highlights
- 11.3.3. Product Portfolio
- 11.3.4. SWOT Analysis
- 11.3.5. Key Strategies and Developments
- 11.4. Thermo Fisher Scientific Inc.
- 11.4.1. Company Overview
- 11.4.2. Financial Highlights
- 11.4.3. Product Portfolio
- 11.4.4. SWOT Analysis
- 11.4.5. Key Strategies and Developments
- 11.5. BGI Group
- 11.5.1. Company Overview
- 11.5.2. Financial Highlights
- 11.5.3. Product Portfolio
- 11.5.4. SWOT Analysis
- 11.5.5. Key Strategies and Developments
- 11.6. Pacific Biosciences of California, Inc.
- 11.6.1. Company Overview
- 11.6.2. Financial Highlights
- 11.6.3. Product Portfolio
- 11.6.4. SWOT Analysis
- 11.6.5. Key Strategies and Developments
- 11.7. Oxford Nanopore Technologies Ltd.
- 11.7.1. Company Overview
- 11.7.2. Financial Highlights
- 11.7.3. Product Portfolio
- 11.7.4. SWOT Analysis
- 11.7.5. Key Strategies and Developments
- 11.8. QIAGEN N.V.
- 11.8.1. Company Overview
- 11.8.2. Financial Highlights
- 11.8.3. Product Portfolio
- 11.8.4. SWOT Analysis
- 11.8.5. Key Strategies and Developments
- 11.9. Agilent Technologies, Inc.
- 11.9.1. Company Overview
- 11.9.2. Financial Highlights
- 11.9.3. Product Portfolio
- 11.9.4. SWOT Analysis
- 11.9.5. Key Strategies and Developments
- 11.10. Roche Holding AG
- 11.10.1. Company Overview
- 11.10.2. Financial Highlights
- 11.10.3. Product Portfolio
- 11.10.4. SWOT Analysis
- 11.10.5. Key Strategies and Developments
- 11.11. Bio-Rad Laboratories, Inc.
- 11.11.1. Company Overview
- 11.11.2. Financial Highlights
- 11.11.3. Product Portfolio
- 11.11.4. SWOT Analysis
- 11.11.5. Key Strategies and Developments
- 11.12. Genomic Health, Inc.
- 11.12.1. Company Overview
- 11.12.2. Financial Highlights
- 11.12.3. Product Portfolio
- 11.12.4. SWOT Analysis
- 11.12.5. Key Strategies and Developments
- 11.13.1. Company Overview
- 11.13.2. Financial Highlights
- 11.13.3. Product Portfolio
- 11.13.4. SWOT Analysis
- 11.13.5. Key Strategies and Developments
- 11.14. Macrogen, Inc.
- 11.14.1. Company Overview
- 11.14.2. Financial Highlights
- 11.14.3. Product Portfolio
- 11.14.4. SWOT Analysis
- 11.14.5. Key Strategies and Developments
- 11.15. GENEWIZ
- 11.15.1. Company Overview
- 11.15.2. Financial Highlights
- 11.15.3. Product Portfolio
- 11.15.4. SWOT Analysis
- 11.15.5. Key Strategies and Developments
- 11.16. Myriad Genetics, Inc.
- 11.16.1. Company Overview
- 11.16.2. Financial Highlights
- 11.16.3. Product Portfolio
- 11.16.4. SWOT Analysis
- 11.16.5. Key Strategies and Developments
- 11.17. 10x Genomics, Inc.
- 11.17.1. Company Overview
- 11.17.2. Financial Highlights
- 11.17.3. Product Portfolio
- 11.17.4. SWOT Analysis
- 11.17.5. Key Strategies and Developments
- 11.18. Other Key Players
- 11.18.1. Company Overview
- 11.18.2. Financial Highlights
- 11.18.3. Product Portfolio
- 11.18.4. SWOT Analysis
- 11.18.5. Key Strategies and Developments
- 12. Assumptions and Acronyms
- 13. Research Methodology
- 14. Contact
- List of Figures
- Figure 1: Global Gene Sequencing Market Revenue (US$ Mn) Market Share by Technology in 2022
- Figure 2: Global Gene Sequencing Market Attractiveness Analysis by Technology, 2016-2032
- Figure 3: Global Gene Sequencing Market Revenue (US$ Mn) Market Share by Product Typein 2022
- Figure 4: Global Gene Sequencing Market Attractiveness Analysis by Product Type, 2016-2032
- Figure 5: Global Gene Sequencing Market Revenue (US$ Mn) Market Share by Applicationin 2022
- Figure 6: Global Gene Sequencing Market Attractiveness Analysis by Application, 2016-2032
- Figure 7: Global Gene Sequencing Market Revenue (US$ Mn) Market Share by End Userin 2022
- Figure 8: Global Gene Sequencing Market Attractiveness Analysis by End User, 2016-2032
- Figure 9: Global Gene Sequencing Market Revenue (US$ Mn) Market Share by Region in 2022
- Figure 10: Global Gene Sequencing Market Attractiveness Analysis by Region, 2016-2032
- Figure 11: Global Gene Sequencing Market Revenue (US$ Mn) (2016-2032)
- Figure 12: Global Gene Sequencing Market Revenue (US$ Mn) Comparison by Region (2016-2032)
- Figure 13: Global Gene Sequencing Market Revenue (US$ Mn) Comparison by Technology (2016-2032)
- Figure 14: Global Gene Sequencing Market Revenue (US$ Mn) Comparison by Product Type (2016-2032)
- Figure 15: Global Gene Sequencing Market Revenue (US$ Mn) Comparison by Application (2016-2032)
- Figure 16: Global Gene Sequencing Market Revenue (US$ Mn) Comparison by End User (2016-2032)
- Figure 17: Global Gene Sequencing Market Y-o-Y Growth Rate Comparison by Region (2016-2032)
- Figure 18: Global Gene Sequencing Market Y-o-Y Growth Rate Comparison by Technology (2016-2032)
- Figure 19: Global Gene Sequencing Market Y-o-Y Growth Rate Comparison by Product Type (2016-2032)
- Figure 20: Global Gene Sequencing Market Y-o-Y Growth Rate Comparison by Application (2016-2032)
- Figure 21: Global Gene Sequencing Market Y-o-Y Growth Rate Comparison by End User (2016-2032)
- Figure 22: Global Gene Sequencing Market Share Comparison by Region (2016-2032)
- Figure 23: Global Gene Sequencing Market Share Comparison by Technology (2016-2032)
- Figure 24: Global Gene Sequencing Market Share Comparison by Product Type (2016-2032)
- Figure 25: Global Gene Sequencing Market Share Comparison by Application (2016-2032)
- Figure 26: Global Gene Sequencing Market Share Comparison by End User (2016-2032)
- Figure 27: North America Gene Sequencing Market Revenue (US$ Mn) Market Share by Technologyin 2022
- Figure 28: North America Gene Sequencing Market Attractiveness Analysis by Technology, 2016-2032
- Figure 29: North America Gene Sequencing Market Revenue (US$ Mn) Market Share by Product Typein 2022
- Figure 30: North America Gene Sequencing Market Attractiveness Analysis by Product Type, 2016-2032
- Figure 31: North America Gene Sequencing Market Revenue (US$ Mn) Market Share by Applicationin 2022
- Figure 32: North America Gene Sequencing Market Attractiveness Analysis by Application, 2016-2032
- Figure 33: North America Gene Sequencing Market Revenue (US$ Mn) Market Share by End Userin 2022
- Figure 34: North America Gene Sequencing Market Attractiveness Analysis by End User, 2016-2032
- Figure 35: North America Gene Sequencing Market Revenue (US$ Mn) Market Share by Country in 2022
- Figure 36: North America Gene Sequencing Market Attractiveness Analysis by Country, 2016-2032
- Figure 37: North America Gene Sequencing Market Revenue (US$ Mn) (2016-2032)
- Figure 38: North America Gene Sequencing Market Revenue (US$ Mn) Comparison by Country (2016-2032)
- Figure 39: North America Gene Sequencing Market Revenue (US$ Mn) Comparison by Technology (2016-2032)
- Figure 40: North America Gene Sequencing Market Revenue (US$ Mn) Comparison by Product Type (2016-2032)
- Figure 41: North America Gene Sequencing Market Revenue (US$ Mn) Comparison by Application (2016-2032)
- Figure 42: North America Gene Sequencing Market Revenue (US$ Mn) Comparison by End User (2016-2032)
- Figure 43: North America Gene Sequencing Market Y-o-Y Growth Rate Comparison by Country (2016-2032)
- Figure 44: North America Gene Sequencing Market Y-o-Y Growth Rate Comparison by Technology (2016-2032)
- Figure 45: North America Gene Sequencing Market Y-o-Y Growth Rate Comparison by Product Type (2016-2032)
- Figure 46: North America Gene Sequencing Market Y-o-Y Growth Rate Comparison by Application (2016-2032)
- Figure 47: North America Gene Sequencing Market Y-o-Y Growth Rate Comparison by End User (2016-2032)
- Figure 48: North America Gene Sequencing Market Share Comparison by Country (2016-2032)
- Figure 49: North America Gene Sequencing Market Share Comparison by Technology (2016-2032)
- Figure 50: North America Gene Sequencing Market Share Comparison by Product Type (2016-2032)
- Figure 51: North America Gene Sequencing Market Share Comparison by Application (2016-2032)
- Figure 52: North America Gene Sequencing Market Share Comparison by End User (2016-2032)
- Figure 53: Western Europe Gene Sequencing Market Revenue (US$ Mn) Market Share by Technologyin 2022
- Figure 54: Western Europe Gene Sequencing Market Attractiveness Analysis by Technology, 2016-2032
- Figure 55: Western Europe Gene Sequencing Market Revenue (US$ Mn) Market Share by Product Typein 2022
- Figure 56: Western Europe Gene Sequencing Market Attractiveness Analysis by Product Type, 2016-2032
- Figure 57: Western Europe Gene Sequencing Market Revenue (US$ Mn) Market Share by Applicationin 2022
- Figure 58: Western Europe Gene Sequencing Market Attractiveness Analysis by Application, 2016-2032
- Figure 59: Western Europe Gene Sequencing Market Revenue (US$ Mn) Market Share by End Userin 2022
- Figure 60: Western Europe Gene Sequencing Market Attractiveness Analysis by End User, 2016-2032
- Figure 61: Western Europe Gene Sequencing Market Revenue (US$ Mn) Market Share by Country in 2022
- Figure 62: Western Europe Gene Sequencing Market Attractiveness Analysis by Country, 2016-2032
- Figure 63: Western Europe Gene Sequencing Market Revenue (US$ Mn) (2016-2032)
- Figure 64: Western Europe Gene Sequencing Market Revenue (US$ Mn) Comparison by Country (2016-2032)
- Figure 65: Western Europe Gene Sequencing Market Revenue (US$ Mn) Comparison by Technology (2016-2032)
- Figure 66: Western Europe Gene Sequencing Market Revenue (US$ Mn) Comparison by Product Type (2016-2032)
- Figure 67: Western Europe Gene Sequencing Market Revenue (US$ Mn) Comparison by Application (2016-2032)
- Figure 68: Western Europe Gene Sequencing Market Revenue (US$ Mn) Comparison by End User (2016-2032)
- Figure 69: Western Europe Gene Sequencing Market Y-o-Y Growth Rate Comparison by Country (2016-2032)
- Figure 70: Western Europe Gene Sequencing Market Y-o-Y Growth Rate Comparison by Technology (2016-2032)
- Figure 71: Western Europe Gene Sequencing Market Y-o-Y Growth Rate Comparison by Product Type (2016-2032)
- Figure 72: Western Europe Gene Sequencing Market Y-o-Y Growth Rate Comparison by Application (2016-2032)
- Figure 73: Western Europe Gene Sequencing Market Y-o-Y Growth Rate Comparison by End User (2016-2032)
- Figure 74: Western Europe Gene Sequencing Market Share Comparison by Country (2016-2032)
- Figure 75: Western Europe Gene Sequencing Market Share Comparison by Technology (2016-2032)
- Figure 76: Western Europe Gene Sequencing Market Share Comparison by Product Type (2016-2032)
- Figure 77: Western Europe Gene Sequencing Market Share Comparison by Application (2016-2032)
- Figure 78: Western Europe Gene Sequencing Market Share Comparison by End User (2016-2032)
- Figure 79: Eastern Europe Gene Sequencing Market Revenue (US$ Mn) Market Share by Technologyin 2022
- Figure 80: Eastern Europe Gene Sequencing Market Attractiveness Analysis by Technology, 2016-2032
- Figure 81: Eastern Europe Gene Sequencing Market Revenue (US$ Mn) Market Share by Product Typein 2022
- Figure 82: Eastern Europe Gene Sequencing Market Attractiveness Analysis by Product Type, 2016-2032
- Figure 83: Eastern Europe Gene Sequencing Market Revenue (US$ Mn) Market Share by Applicationin 2022
- Figure 84: Eastern Europe Gene Sequencing Market Attractiveness Analysis by Application, 2016-2032
- Figure 85: Eastern Europe Gene Sequencing Market Revenue (US$ Mn) Market Share by End Userin 2022
- Figure 86: Eastern Europe Gene Sequencing Market Attractiveness Analysis by End User, 2016-2032
- Figure 87: Eastern Europe Gene Sequencing Market Revenue (US$ Mn) Market Share by Country in 2022
- Figure 88: Eastern Europe Gene Sequencing Market Attractiveness Analysis by Country, 2016-2032
- Figure 89: Eastern Europe Gene Sequencing Market Revenue (US$ Mn) (2016-2032)
- Figure 90: Eastern Europe Gene Sequencing Market Revenue (US$ Mn) Comparison by Country (2016-2032)
- Figure 91: Eastern Europe Gene Sequencing Market Revenue (US$ Mn) Comparison by Technology (2016-2032)
- Figure 92: Eastern Europe Gene Sequencing Market Revenue (US$ Mn) Comparison by Product Type (2016-2032)
- Figure 93: Eastern Europe Gene Sequencing Market Revenue (US$ Mn) Comparison by Application (2016-2032)
- Figure 94: Eastern Europe Gene Sequencing Market Revenue (US$ Mn) Comparison by End User (2016-2032)
- Figure 95: Eastern Europe Gene Sequencing Market Y-o-Y Growth Rate Comparison by Country (2016-2032)
- Figure 96: Eastern Europe Gene Sequencing Market Y-o-Y Growth Rate Comparison by Technology (2016-2032)
- Figure 97: Eastern Europe Gene Sequencing Market Y-o-Y Growth Rate Comparison by Product Type (2016-2032)
- Figure 98: Eastern Europe Gene Sequencing Market Y-o-Y Growth Rate Comparison by Application (2016-2032)
- Figure 99: Eastern Europe Gene Sequencing Market Y-o-Y Growth Rate Comparison by End User (2016-2032)
- Figure 100: Eastern Europe Gene Sequencing Market Share Comparison by Country (2016-2032)
- Figure 101: Eastern Europe Gene Sequencing Market Share Comparison by Technology (2016-2032)
- Figure 102: Eastern Europe Gene Sequencing Market Share Comparison by Product Type (2016-2032)
- Figure 103: Eastern Europe Gene Sequencing Market Share Comparison by Application (2016-2032)
- Figure 104: Eastern Europe Gene Sequencing Market Share Comparison by End User (2016-2032)
- Figure 105: APAC Gene Sequencing Market Revenue (US$ Mn) Market Share by Technologyin 2022
- Figure 106: APAC Gene Sequencing Market Attractiveness Analysis by Technology, 2016-2032
- Figure 107: APAC Gene Sequencing Market Revenue (US$ Mn) Market Share by Product Typein 2022
- Figure 108: APAC Gene Sequencing Market Attractiveness Analysis by Product Type, 2016-2032
- Figure 109: APAC Gene Sequencing Market Revenue (US$ Mn) Market Share by Applicationin 2022
- Figure 110: APAC Gene Sequencing Market Attractiveness Analysis by Application, 2016-2032
- Figure 111: APAC Gene Sequencing Market Revenue (US$ Mn) Market Share by End Userin 2022
- Figure 112: APAC Gene Sequencing Market Attractiveness Analysis by End User, 2016-2032
- Figure 113: APAC Gene Sequencing Market Revenue (US$ Mn) Market Share by Country in 2022
- Figure 114: APAC Gene Sequencing Market Attractiveness Analysis by Country, 2016-2032
- Figure 115: APAC Gene Sequencing Market Revenue (US$ Mn) (2016-2032)
- Figure 116: APAC Gene Sequencing Market Revenue (US$ Mn) Comparison by Country (2016-2032)
- Figure 117: APAC Gene Sequencing Market Revenue (US$ Mn) Comparison by Technology (2016-2032)
- Figure 118: APAC Gene Sequencing Market Revenue (US$ Mn) Comparison by Product Type (2016-2032)
- Figure 119: APAC Gene Sequencing Market Revenue (US$ Mn) Comparison by Application (2016-2032)
- Figure 120: APAC Gene Sequencing Market Revenue (US$ Mn) Comparison by End User (2016-2032)
- Figure 121: APAC Gene Sequencing Market Y-o-Y Growth Rate Comparison by Country (2016-2032)
- Figure 122: APAC Gene Sequencing Market Y-o-Y Growth Rate Comparison by Technology (2016-2032)
- Figure 123: APAC Gene Sequencing Market Y-o-Y Growth Rate Comparison by Product Type (2016-2032)
- Figure 124: APAC Gene Sequencing Market Y-o-Y Growth Rate Comparison by Application (2016-2032)
- Figure 125: APAC Gene Sequencing Market Y-o-Y Growth Rate Comparison by End User (2016-2032)
- Figure 126: APAC Gene Sequencing Market Share Comparison by Country (2016-2032)
- Figure 127: APAC Gene Sequencing Market Share Comparison by Technology (2016-2032)
- Figure 128: APAC Gene Sequencing Market Share Comparison by Product Type (2016-2032)
- Figure 129: APAC Gene Sequencing Market Share Comparison by Application (2016-2032)
- Figure 130: APAC Gene Sequencing Market Share Comparison by End User (2016-2032)
- Figure 131: Latin America Gene Sequencing Market Revenue (US$ Mn) Market Share by Technologyin 2022
- Figure 132: Latin America Gene Sequencing Market Attractiveness Analysis by Technology, 2016-2032
- Figure 133: Latin America Gene Sequencing Market Revenue (US$ Mn) Market Share by Product Typein 2022
- Figure 134: Latin America Gene Sequencing Market Attractiveness Analysis by Product Type, 2016-2032
- Figure 135: Latin America Gene Sequencing Market Revenue (US$ Mn) Market Share by Applicationin 2022
- Figure 136: Latin America Gene Sequencing Market Attractiveness Analysis by Application, 2016-2032
- Figure 137: Latin America Gene Sequencing Market Revenue (US$ Mn) Market Share by End Userin 2022
- Figure 138: Latin America Gene Sequencing Market Attractiveness Analysis by End User, 2016-2032
- Figure 139: Latin America Gene Sequencing Market Revenue (US$ Mn) Market Share by Country in 2022
- Figure 140: Latin America Gene Sequencing Market Attractiveness Analysis by Country, 2016-2032
- Figure 141: Latin America Gene Sequencing Market Revenue (US$ Mn) (2016-2032)
- Figure 142: Latin America Gene Sequencing Market Revenue (US$ Mn) Comparison by Country (2016-2032)
- Figure 143: Latin America Gene Sequencing Market Revenue (US$ Mn) Comparison by Technology (2016-2032)
- Figure 144: Latin America Gene Sequencing Market Revenue (US$ Mn) Comparison by Product Type (2016-2032)
- Figure 145: Latin America Gene Sequencing Market Revenue (US$ Mn) Comparison by Application (2016-2032)
- Figure 146: Latin America Gene Sequencing Market Revenue (US$ Mn) Comparison by End User (2016-2032)
- Figure 147: Latin America Gene Sequencing Market Y-o-Y Growth Rate Comparison by Country (2016-2032)
- Figure 148: Latin America Gene Sequencing Market Y-o-Y Growth Rate Comparison by Technology (2016-2032)
- Figure 149: Latin America Gene Sequencing Market Y-o-Y Growth Rate Comparison by Product Type (2016-2032)
- Figure 150: Latin America Gene Sequencing Market Y-o-Y Growth Rate Comparison by Application (2016-2032)
- Figure 151: Latin America Gene Sequencing Market Y-o-Y Growth Rate Comparison by End User (2016-2032)
- Figure 152: Latin America Gene Sequencing Market Share Comparison by Country (2016-2032)
- Figure 153: Latin America Gene Sequencing Market Share Comparison by Technology (2016-2032)
- Figure 154: Latin America Gene Sequencing Market Share Comparison by Product Type (2016-2032)
- Figure 155: Latin America Gene Sequencing Market Share Comparison by Application (2016-2032)
- Figure 156: Latin America Gene Sequencing Market Share Comparison by End User (2016-2032)
- Figure 157: Middle East & Africa Gene Sequencing Market Revenue (US$ Mn) Market Share by Technologyin 2022
- Figure 158: Middle East & Africa Gene Sequencing Market Attractiveness Analysis by Technology, 2016-2032
- Figure 159: Middle East & Africa Gene Sequencing Market Revenue (US$ Mn) Market Share by Product Typein 2022
- Figure 160: Middle East & Africa Gene Sequencing Market Attractiveness Analysis by Product Type, 2016-2032
- Figure 161: Middle East & Africa Gene Sequencing Market Revenue (US$ Mn) Market Share by Applicationin 2022
- Figure 162: Middle East & Africa Gene Sequencing Market Attractiveness Analysis by Application, 2016-2032
- Figure 163: Middle East & Africa Gene Sequencing Market Revenue (US$ Mn) Market Share by End Userin 2022
- Figure 164: Middle East & Africa Gene Sequencing Market Attractiveness Analysis by End User, 2016-2032
- Figure 165: Middle East & Africa Gene Sequencing Market Revenue (US$ Mn) Market Share by Country in 2022
- Figure 166: Middle East & Africa Gene Sequencing Market Attractiveness Analysis by Country, 2016-2032
- Figure 167: Middle East & Africa Gene Sequencing Market Revenue (US$ Mn) (2016-2032)
- Figure 168: Middle East & Africa Gene Sequencing Market Revenue (US$ Mn) Comparison by Country (2016-2032)
- Figure 169: Middle East & Africa Gene Sequencing Market Revenue (US$ Mn) Comparison by Technology (2016-2032)
- Figure 170: Middle East & Africa Gene Sequencing Market Revenue (US$ Mn) Comparison by Product Type (2016-2032)
- Figure 171: Middle East & Africa Gene Sequencing Market Revenue (US$ Mn) Comparison by Application (2016-2032)
- Figure 172: Middle East & Africa Gene Sequencing Market Revenue (US$ Mn) Comparison by End User (2016-2032)
- Figure 173: Middle East & Africa Gene Sequencing Market Y-o-Y Growth Rate Comparison by Country (2016-2032)
- Figure 174: Middle East & Africa Gene Sequencing Market Y-o-Y Growth Rate Comparison by Technology (2016-2032)
- Figure 175: Middle East & Africa Gene Sequencing Market Y-o-Y Growth Rate Comparison by Product Type (2016-2032)
- Figure 176: Middle East & Africa Gene Sequencing Market Y-o-Y Growth Rate Comparison by Application (2016-2032)
- Figure 177: Middle East & Africa Gene Sequencing Market Y-o-Y Growth Rate Comparison by End User (2016-2032)
- Figure 178: Middle East & Africa Gene Sequencing Market Share Comparison by Country (2016-2032)
- Figure 179: Middle East & Africa Gene Sequencing Market Share Comparison by Technology (2016-2032)
- Figure 180: Middle East & Africa Gene Sequencing Market Share Comparison by Product Type (2016-2032)
- Figure 181: Middle East & Africa Gene Sequencing Market Share Comparison by Application (2016-2032)
- Figure 182: Middle East & Africa Gene Sequencing Market Share Comparison by End User (2016-2032)
- List of Tables
- Table 1: Global Gene Sequencing Market Comparison by Technology (2016-2032)
- Table 2: Global Gene Sequencing Market Comparison by Product Type (2016-2032)
- Table 3: Global Gene Sequencing Market Comparison by Application (2016-2032)
- Table 4: Global Gene Sequencing Market Comparison by End User (2016-2032)
- Table 5: Global Gene Sequencing Market Revenue (US$ Mn) Comparison by Region (2016-2032)
- Table 6: Global Gene Sequencing Market Revenue (US$ Mn) (2016-2032)
- Table 7: Global Gene Sequencing Market Revenue (US$ Mn) Comparison by Region (2016-2032)
- Table 8: Global Gene Sequencing Market Revenue (US$ Mn) Comparison by Technology (2016-2032)
- Table 9: Global Gene Sequencing Market Revenue (US$ Mn) Comparison by Product Type (2016-2032)
- Table 10: Global Gene Sequencing Market Revenue (US$ Mn) Comparison by Application (2016-2032)
- Table 11: Global Gene Sequencing Market Revenue (US$ Mn) Comparison by End User (2016-2032)
- Table 12: Global Gene Sequencing Market Y-o-Y Growth Rate Comparison by Region (2016-2032)
- Table 13: Global Gene Sequencing Market Y-o-Y Growth Rate Comparison by Technology (2016-2032)
- Table 14: Global Gene Sequencing Market Y-o-Y Growth Rate Comparison by Product Type (2016-2032)
- Table 15: Global Gene Sequencing Market Y-o-Y Growth Rate Comparison by Application (2016-2032)
- Table 16: Global Gene Sequencing Market Y-o-Y Growth Rate Comparison by End User (2016-2032)
- Table 17: Global Gene Sequencing Market Share Comparison by Region (2016-2032)
- Table 18: Global Gene Sequencing Market Share Comparison by Technology (2016-2032)
- Table 19: Global Gene Sequencing Market Share Comparison by Product Type (2016-2032)
- Table 20: Global Gene Sequencing Market Share Comparison by Application (2016-2032)
- Table 21: Global Gene Sequencing Market Share Comparison by End User (2016-2032)
- Table 22: North America Gene Sequencing Market Comparison by Product Type (2016-2032)
- Table 23: North America Gene Sequencing Market Comparison by Application (2016-2032)
- Table 24: North America Gene Sequencing Market Comparison by End User (2016-2032)
- Table 25: North America Gene Sequencing Market Revenue (US$ Mn) Comparison by Country (2016-2032)
- Table 26: North America Gene Sequencing Market Revenue (US$ Mn) (2016-2032)
- Table 27: North America Gene Sequencing Market Revenue (US$ Mn) Comparison by Country (2016-2032)
- Table 28: North America Gene Sequencing Market Revenue (US$ Mn) Comparison by Technology (2016-2032)
- Table 29: North America Gene Sequencing Market Revenue (US$ Mn) Comparison by Product Type (2016-2032)
- Table 30: North America Gene Sequencing Market Revenue (US$ Mn) Comparison by Application (2016-2032)
- Table 31: North America Gene Sequencing Market Revenue (US$ Mn) Comparison by End User (2016-2032)
- Table 32: North America Gene Sequencing Market Y-o-Y Growth Rate Comparison by Country (2016-2032)
- Table 33: North America Gene Sequencing Market Y-o-Y Growth Rate Comparison by Technology (2016-2032)
- Table 34: North America Gene Sequencing Market Y-o-Y Growth Rate Comparison by Product Type (2016-2032)
- Table 35: North America Gene Sequencing Market Y-o-Y Growth Rate Comparison by Application (2016-2032)
- Table 36: North America Gene Sequencing Market Y-o-Y Growth Rate Comparison by End User (2016-2032)
- Table 37: North America Gene Sequencing Market Share Comparison by Country (2016-2032)
- Table 38: North America Gene Sequencing Market Share Comparison by Technology (2016-2032)
- Table 39: North America Gene Sequencing Market Share Comparison by Product Type (2016-2032)
- Table 40: North America Gene Sequencing Market Share Comparison by Application (2016-2032)
- Table 41: North America Gene Sequencing Market Share Comparison by End User (2016-2032)
- Table 42: Western Europe Gene Sequencing Market Comparison by Technology (2016-2032)
- Table 43: Western Europe Gene Sequencing Market Comparison by Product Type (2016-2032)
- Table 44: Western Europe Gene Sequencing Market Comparison by Application (2016-2032)
- Table 45: Western Europe Gene Sequencing Market Comparison by End User (2016-2032)
- Table 46: Western Europe Gene Sequencing Market Revenue (US$ Mn) Comparison by Country (2016-2032)
- Table 47: Western Europe Gene Sequencing Market Revenue (US$ Mn) (2016-2032)
- Table 48: Western Europe Gene Sequencing Market Revenue (US$ Mn) Comparison by Country (2016-2032)
- Table 49: Western Europe Gene Sequencing Market Revenue (US$ Mn) Comparison by Technology (2016-2032)
- Table 50: Western Europe Gene Sequencing Market Revenue (US$ Mn) Comparison by Product Type (2016-2032)
- Table 51: Western Europe Gene Sequencing Market Revenue (US$ Mn) Comparison by Application (2016-2032)
- Table 52: Western Europe Gene Sequencing Market Revenue (US$ Mn) Comparison by End User (2016-2032)
- Table 53: Western Europe Gene Sequencing Market Y-o-Y Growth Rate Comparison by Country (2016-2032)
- Table 54: Western Europe Gene Sequencing Market Y-o-Y Growth Rate Comparison by Technology (2016-2032)
- Table 55: Western Europe Gene Sequencing Market Y-o-Y Growth Rate Comparison by Product Type (2016-2032)
- Table 56: Western Europe Gene Sequencing Market Y-o-Y Growth Rate Comparison by Application (2016-2032)
- Table 57: Western Europe Gene Sequencing Market Y-o-Y Growth Rate Comparison by End User (2016-2032)
- Table 58: Western Europe Gene Sequencing Market Share Comparison by Country (2016-2032)
- Table 59: Western Europe Gene Sequencing Market Share Comparison by Technology (2016-2032)
- Table 60: Western Europe Gene Sequencing Market Share Comparison by Product Type (2016-2032)
- Table 61: Western Europe Gene Sequencing Market Share Comparison by Application (2016-2032)
- Table 62: Western Europe Gene Sequencing Market Share Comparison by End User (2016-2032)
- Table 63: Eastern Europe Gene Sequencing Market Comparison by Technology (2016-2032)
- Table 64: Eastern Europe Gene Sequencing Market Comparison by Product Type (2016-2032)
- Table 65: Eastern Europe Gene Sequencing Market Comparison by Application (2016-2032)
- Table 66: Eastern Europe Gene Sequencing Market Comparison by End User (2016-2032)
- Table 67: Eastern Europe Gene Sequencing Market Revenue (US$ Mn) Comparison by Country (2016-2032)
- Table 68: Eastern Europe Gene Sequencing Market Revenue (US$ Mn) (2016-2032)
- Table 69: Eastern Europe Gene Sequencing Market Revenue (US$ Mn) Comparison by Country (2016-2032)
- Table 70: Eastern Europe Gene Sequencing Market Revenue (US$ Mn) Comparison by Technology (2016-2032)
- Table 71: Eastern Europe Gene Sequencing Market Revenue (US$ Mn) Comparison by Product Type (2016-2032)
- Table 72: Eastern Europe Gene Sequencing Market Revenue (US$ Mn) Comparison by Application (2016-2032)
- Table 73: Eastern Europe Gene Sequencing Market Revenue (US$ Mn) Comparison by End User (2016-2032)
- Table 74: Eastern Europe Gene Sequencing Market Y-o-Y Growth Rate Comparison by Country (2016-2032)
- Table 75: Eastern Europe Gene Sequencing Market Y-o-Y Growth Rate Comparison by Technology (2016-2032)
- Table 76: Eastern Europe Gene Sequencing Market Y-o-Y Growth Rate Comparison by Product Type (2016-2032)
- Table 77: Eastern Europe Gene Sequencing Market Y-o-Y Growth Rate Comparison by Application (2016-2032)
- Table 78: Eastern Europe Gene Sequencing Market Y-o-Y Growth Rate Comparison by End User (2016-2032)
- Table 79: Eastern Europe Gene Sequencing Market Share Comparison by Country (2016-2032)
- Table 80: Eastern Europe Gene Sequencing Market Share Comparison by Technology (2016-2032)
- Table 81: Eastern Europe Gene Sequencing Market Share Comparison by Product Type (2016-2032)
- Table 82: Eastern Europe Gene Sequencing Market Share Comparison by Application (2016-2032)
- Table 83: Eastern Europe Gene Sequencing Market Share Comparison by End User (2016-2032)
- Table 84: APAC Gene Sequencing Market Comparison by Technology (2016-2032)
- Table 85: APAC Gene Sequencing Market Comparison by Product Type (2016-2032)
- Table 86: APAC Gene Sequencing Market Comparison by Application (2016-2032)
- Table 87: APAC Gene Sequencing Market Comparison by End User (2016-2032)
- Table 88: APAC Gene Sequencing Market Revenue (US$ Mn) Comparison by Country (2016-2032)
- Table 89: APAC Gene Sequencing Market Revenue (US$ Mn) (2016-2032)
- Table 90: APAC Gene Sequencing Market Revenue (US$ Mn) Comparison by Country (2016-2032)
- Table 91: APAC Gene Sequencing Market Revenue (US$ Mn) Comparison by Technology (2016-2032)
- Table 92: APAC Gene Sequencing Market Revenue (US$ Mn) Comparison by Product Type (2016-2032)
- Table 93: APAC Gene Sequencing Market Revenue (US$ Mn) Comparison by Application (2016-2032)
- Table 94: APAC Gene Sequencing Market Revenue (US$ Mn) Comparison by End User (2016-2032)
- Table 95: APAC Gene Sequencing Market Y-o-Y Growth Rate Comparison by Country (2016-2032)
- Table 96: APAC Gene Sequencing Market Y-o-Y Growth Rate Comparison by Technology (2016-2032)
- Table 97: APAC Gene Sequencing Market Y-o-Y Growth Rate Comparison by Product Type (2016-2032)
- Table 98: APAC Gene Sequencing Market Y-o-Y Growth Rate Comparison by Application (2016-2032)
- Table 99: APAC Gene Sequencing Market Y-o-Y Growth Rate Comparison by End User (2016-2032)
- Table 100: APAC Gene Sequencing Market Share Comparison by Country (2016-2032)
- Table 101: APAC Gene Sequencing Market Share Comparison by Technology (2016-2032)
- Table 102: APAC Gene Sequencing Market Share Comparison by Product Type (2016-2032)
- Table 103: APAC Gene Sequencing Market Share Comparison by Application (2016-2032)
- Table 104: APAC Gene Sequencing Market Share Comparison by End User (2016-2032)
- Table 105: Latin America Gene Sequencing Market Comparison by Technology (2016-2032)
- Table 106: Latin America Gene Sequencing Market Comparison by Product Type (2016-2032)
- Table 107: Latin America Gene Sequencing Market Comparison by Application (2016-2032)
- Table 108: Latin America Gene Sequencing Market Comparison by End User (2016-2032)
- Table 109: Latin America Gene Sequencing Market Revenue (US$ Mn) Comparison by Country (2016-2032)
- Table 110: Latin America Gene Sequencing Market Revenue (US$ Mn) (2016-2032)
- Table 111: Latin America Gene Sequencing Market Revenue (US$ Mn) Comparison by Country (2016-2032)
- Table 112: Latin America Gene Sequencing Market Revenue (US$ Mn) Comparison by Technology (2016-2032)
- Table 113: Latin America Gene Sequencing Market Revenue (US$ Mn) Comparison by Product Type (2016-2032)
- Table 114: Latin America Gene Sequencing Market Revenue (US$ Mn) Comparison by Application (2016-2032)
- Table 115: Latin America Gene Sequencing Market Revenue (US$ Mn) Comparison by End User (2016-2032)
- Table 116: Latin America Gene Sequencing Market Y-o-Y Growth Rate Comparison by Country (2016-2032)
- Table 117: Latin America Gene Sequencing Market Y-o-Y Growth Rate Comparison by Technology (2016-2032)
- Table 118: Latin America Gene Sequencing Market Y-o-Y Growth Rate Comparison by Product Type (2016-2032)
- Table 119: Latin America Gene Sequencing Market Y-o-Y Growth Rate Comparison by Application (2016-2032)
- Table 120: Latin America Gene Sequencing Market Y-o-Y Growth Rate Comparison by End User (2016-2032)
- Table 121: Latin America Gene Sequencing Market Share Comparison by Country (2016-2032)
- Table 122: Latin America Gene Sequencing Market Share Comparison by Technology (2016-2032)
- Table 123: Latin America Gene Sequencing Market Share Comparison by Product Type (2016-2032)
- Table 124: Latin America Gene Sequencing Market Share Comparison by Application (2016-2032)
- Table 125: Latin America Gene Sequencing Market Share Comparison by End User (2016-2032)
- Table 126: Middle East & Africa Gene Sequencing Market Comparison by Technology (2016-2032)
- Table 127: Middle East & Africa Gene Sequencing Market Comparison by Product Type (2016-2032)
- Table 128: Middle East & Africa Gene Sequencing Market Comparison by Application (2016-2032)
- Table 129: Middle East & Africa Gene Sequencing Market Comparison by End User (2016-2032)
- Table 130: Middle East & Africa Gene Sequencing Market Revenue (US$ Mn) Comparison by Country (2016-2032)
- Table 131: Middle East & Africa Gene Sequencing Market Revenue (US$ Mn) (2016-2032)
- Table 132: Middle East & Africa Gene Sequencing Market Revenue (US$ Mn) Comparison by Country (2016-2032)
- Table 133: Middle East & Africa Gene Sequencing Market Revenue (US$ Mn) Comparison by Technology (2016-2032)
- Table 134: Middle East & Africa Gene Sequencing Market Revenue (US$ Mn) Comparison by Product Type (2016-2032)
- Table 135: Middle East & Africa Gene Sequencing Market Revenue (US$ Mn) Comparison by Application (2016-2032)
- Table 136: Middle East & Africa Gene Sequencing Market Revenue (US$ Mn) Comparison by End User (2016-2032)
- Table 137: Middle East & Africa Gene Sequencing Market Y-o-Y Growth Rate Comparison by Country (2016-2032)
- Table 138: Middle East & Africa Gene Sequencing Market Y-o-Y Growth Rate Comparison by Technology (2016-2032)
- Table 139: Middle East & Africa Gene Sequencing Market Y-o-Y Growth Rate Comparison by Product Type (2016-2032)
- Table 140: Middle East & Africa Gene Sequencing Market Y-o-Y Growth Rate Comparison by Application (2016-2032)
- Table 141: Middle East & Africa Gene Sequencing Market Y-o-Y Growth Rate Comparison by End User (2016-2032)
- Table 142: Middle East & Africa Gene Sequencing Market Share Comparison by Country (2016-2032)
- Table 143: Middle East & Africa Gene Sequencing Market Share Comparison by Technology (2016-2032)
- Table 144: Middle East & Africa Gene Sequencing Market Share Comparison by Product Type (2016-2032)
- Table 145: Middle East & Africa Gene Sequencing Market Share Comparison by Application (2016-2032)
- Table 146: Middle East & Africa Gene Sequencing Market Share Comparison by End User (2016-2032)
- 1. Executive Summary
-
- Illumina, Inc.
- Thermo Fisher Scientific Inc.
- BGI Group
- Pacific Biosciences of California, Inc.
- Oxford Nanopore Technologies Ltd.
- QIAGEN N.V.
- Agilent Technologies, Inc.
- Roche Holding AG
- Bio-Rad Laboratories, Inc.
- Genomic Health, Inc. (a subsidiary of Exact Sciences Corporation)
- Macrogen, Inc.
- PerkinElmer, Inc.
- GENEWIZ (a subsidiary of Brooks Automation)
- Myriad Genetics, Inc.
- 10x Genomics, Inc.
- Other Key Players
Our Clients


View Our Licence Options
