
Gastritis Market Report By Type (Acute Gastritis, Chronic Gastritis, Erosive Gastritis, Non-Erosive Gastritis), By Drug Type (Antacids, Antibiotics, Cytoprotective Agents, Prokinetics, Otheres), By Route of Administration (Oral, Parenteral), By End-User (Hospitals and Clinics, Specialty Centers, Homecare Settings), By Region and Companies - Industry Segment Outlook, Market Assessment, Competition Scenario, Trends and Forecast 2024-2033
-
37549
-
March 2024
-
137
-


-
This report was compiled by Trishita Deb Trishita Deb is an experienced market research and consulting professional with over 7 years of expertise across healthcare, consumer goods, and materials, contributing to over 400 healthcare-related reports. Correspondence Team Lead- Healthcare Linkedin | Detailed Market research Methodology Our methodology involves a mix of primary research, including interviews with leading mental health experts, and secondary research from reputable medical journals and databases. View Detailed Methodology Page
-
Quick Navigation
Report Overview
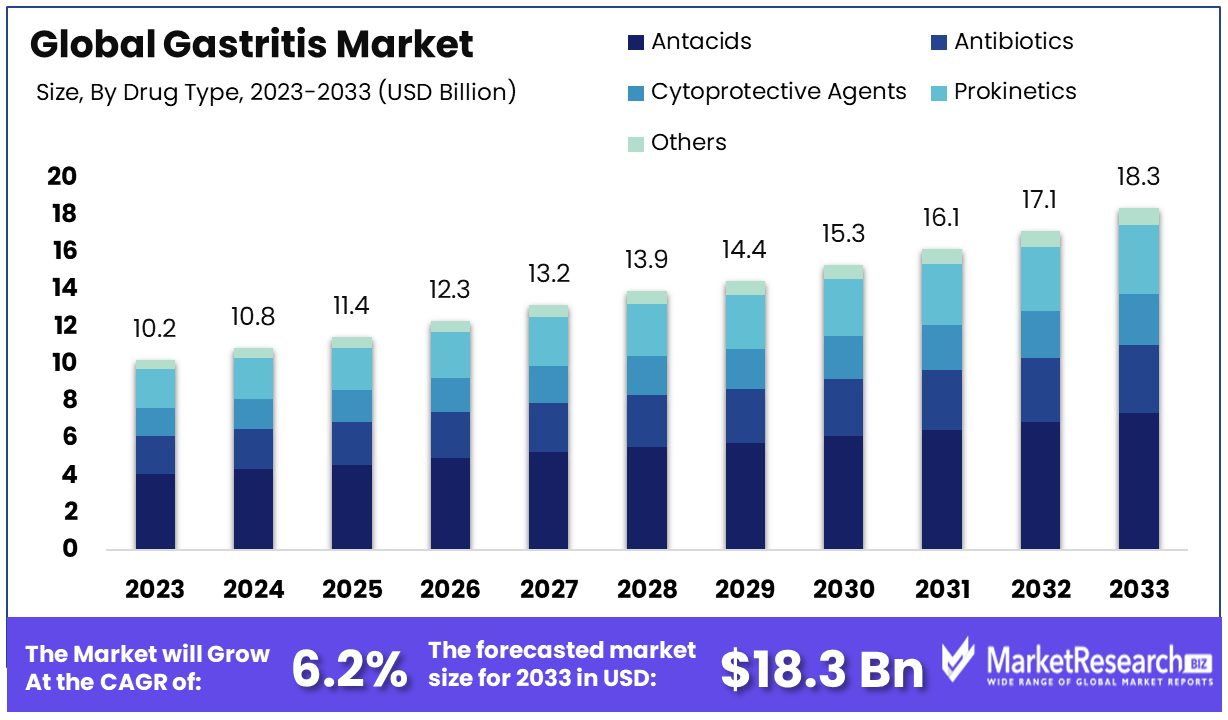
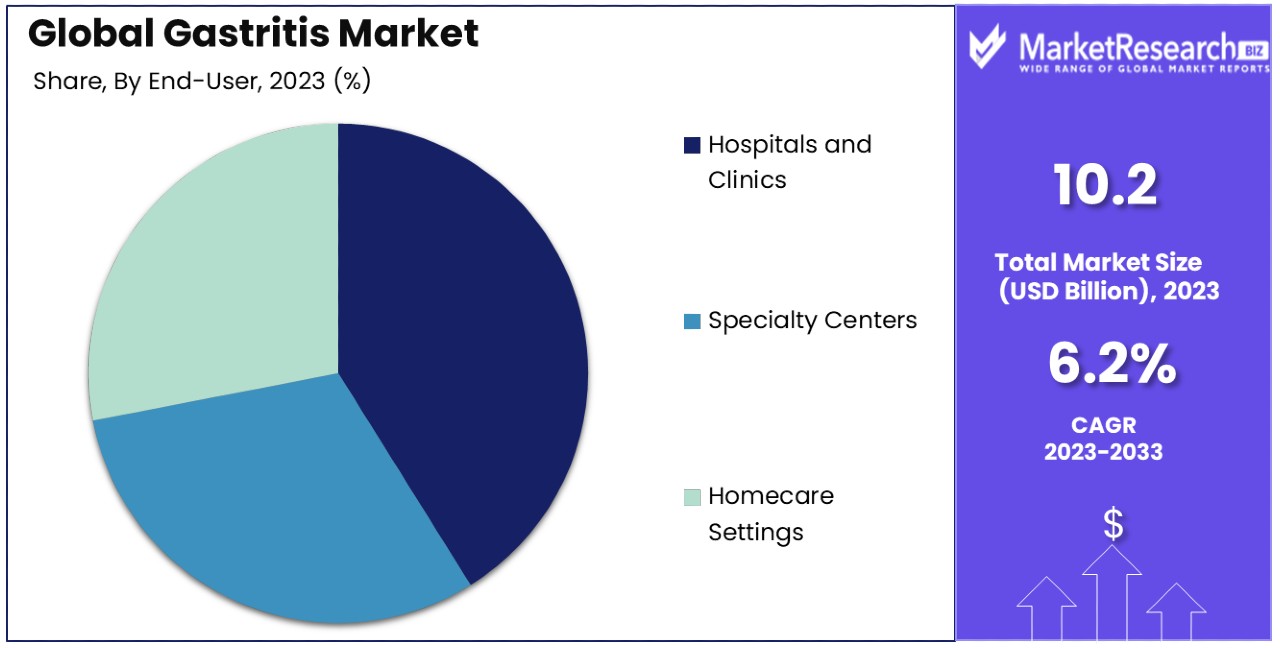
The Global Gastritis Market size is expected to be worth around USD 18.3 Billion by 2033, from USD 10.2 Billion in 2023, growing at a CAGR of 6.20% during the forecast period from 2024 to 2033.
The surge in demand for fast food globally, new advancement in the endoscopy devices and change in lifestyles are some of the main key driving factors for the gastritis market.
Gastritis is defined as the most common medical condition which is characterised by inflammation of the lining of the stomach. Such conditions can be acute by prevailing suddenly and lasting for a short duration and chronic, continuing for over a prolonged period.
The inflammation may be elicited by several reasons, by containing infections with Helicobacter pylori bacteria, huge amount of alcohol consumption, longer use of non-steroidal anti-inflammatory drugs (NSAIDs) or stress. The signs of the gastritis can be abdominal pain, nausea, bloating, Loss of appetite, vomiting and indigestions. Treatment and diagnosis generally consists of combination of past medical history, physical examination and tests like endoscopy and blood tests.
The treatments also include medications to minimize stomach acid production, antibiotics to eliminate H. pylori infection if detected, dietary change and lifestyle modifications. Some of the serious cases may also need hospitalization and blood fluids. Long term management aims on identifying underlying causes and avoid recurrence through lifestyle modifications and daily follow-up with healthcare providers.
According to an article Gastro Journal in September 2023, highlights that a global digestive disease study was conducted which covered 18 digestive disease all across 204 regions and territories. In 2019, there was 7.32 billion incidents and 2.86 billion occurrence cases of digestive disease that results in 8 million deaths and 277 million DALYs lost.
It was also observed that from 1990 to 2019 with 95,582 and 35,106 cases per 100,000 individuals in 2019 respectively. The age-standardized death was 102 per 100,000 individuals. Digestive diseases have been accounted for an important portions of the whole disease burden with more than ½ of occurrence cases having a digestive Etiology.
Gastritis can substantially effect lifestyle by causing discomfort by affecting eating habits and minimizing whole quality of life. Such treatment consists of maintaining a healthy lifestyle by avoiding spicy and acidic foods, restraining alcohol and caffeine intake and eliminating smoking. The medications such as proton pump inhibitors and antacids are generally prescribed to decrease stomach acid and improve symptoms.
A healthy lifestyle includes decreasing the stress methods and daily exercise that can also help to manage gastritis effectively. The demand for the gastritis will increase due to its high consumptions of the fast foods and digestive issues that will help in market expansion in the coming years.
Key Takeaways
- Market Value: The Global Gastritis Market is projected to reach USD 18.3 Billion by 2033, experiencing significant growth from its 2023 value, with a CAGR of 6.20% during the forecast period from 2024 to 2033.
- Dominant Segments:
- Acute Gastritis Analysis: Acute gastritis emerges as the dominant sub-segment due to its immediate and common manifestation, driven by factors such as NSAIDs use, alcohol consumption, and bacterial infections.
- Drug Type Analysis: Antacids lead the drug type category, offering immediate relief from gastritis symptoms with widespread availability, affordability, and minimal side effects.
- Route of Administration Analysis: Oral administration commands a significant 62% share due to its convenience and patient compliance, with antacids being the dominant oral medication.
- End-User Analysis: Hospitals and clinics hold 40% of the end-user market share, offering comprehensive care including diagnosis, treatment, and follow-up care.
- Regional Analysis: Europe dominates the market with a 36% share, followed by North America with approximately 29% market share, driven by high healthcare expenditure and advanced infrastructure.
- Analyst Viewpoint: The gastritis market's growth is fueled by factors such as the high incidence rate of acute gastritis, increasing awareness and diagnosis, advancements in treatment options, and the prevalence of chronic cases. The market's diversity in sub-segments and treatment modalities ensures comprehensive care and sustained growth opportunities.
- Market Key Players: Major players in the global gastritis market include Novartis AG, Pfizer Inc., Perrigo Pharmaceutical, Takeda Pharmaceutical Company Limited, and AbbVie Inc., among others. These companies offer a range of medications and treatment options, contributing to innovation and competition in the market.
Driving Factors
Increasing Prevalence of Gastritis Drives Market Growth
The escalating number of gastritis cases worldwide significantly propels the gastritis market forward. Approximately 8 million people in the United States are diagnosed with gastritis annually, a figure that underscores the widespread nature of the condition. This increase can be largely attributed to factors such as unhealthy eating habits, heightened stress levels, and the widespread occurrence of Helicobacter pylori infections. The direct correlation between the rising incidence of gastritis and market expansion is clear, as more individuals seeking diagnosis and treatment contribute to the demand for related healthcare services and products.
This trend not only highlights the immediate need for effective management strategies but also indicates a broader impact on the healthcare industry, including pharmaceuticals, diagnostic tools, and therapeutic procedures. The increasing prevalence of gastritis acts as a catalyst for enhanced research and development efforts, aiming to provide more effective and efficient treatment solutions, thereby further stimulating market growth.
Increasing Healthcare Expenditure Spurs Market Growth
The gastritis market is significantly bolstered by the global rise in healthcare expenditure. In 2022, the National Health Expenditure (NHE) in the United States alone grew by 4.1% to reach $4.5 trillion, with spending on prescription drugs rising by 8.4% to $405.9 billion. This trend is reflective of a broader global movement towards increased investment in healthcare infrastructure and services. As countries enhance their healthcare systems and expand access to medical services, there is a notable increase in the number of individuals seeking diagnosis and treatment for conditions like gastritis.
This is particularly evident in nations with growing economies, such as China, where rising disposable incomes are contributing to higher healthcare spending. The direct impact of this increased expenditure is a more robust gastritis market, characterized by greater demand for medical services, pharmaceuticals, and diagnostic tools. This influx of funding and resources into the healthcare sector not only facilitates the growth of the gastritis market but also contributes to the overall improvement of patient care and disease management strategies.
Technological Advancements in Diagnosis and Treatment Fuel Market Expansion
Technological innovations within the gastritis diagnosis and treatment landscape serve as a major impetus for market growth. The advent of endoscopic procedures, advanced imaging techniques, and personalized medicine has revolutionized the management of gastritis, offering more precise and less invasive options for patients.
Notably, the development of non-invasive diagnostic tests, such as breath tests for Helicobacter pylori detection, has significantly improved patient care by simplifying the diagnosis process and enhancing accuracy. These technological strides not only improve patient outcomes but also increase the efficiency of healthcare providers, thereby driving market growth. As these technologies continue to evolve and become more widely adopted, the gastritis market is expected to see sustained expansion, fueled by the combination of improved diagnostic and treatment methodologies and the ongoing need to address the high prevalence of the condition.
Restraining Factors
Side Effects of Medications Restrains Market Growth
The gastritis market is significantly hampered by the adverse effects associated with long-term use of common medications like proton pump inhibitors (PPIs). These drugs, while effective in managing symptoms, can lead to serious side effects including vitamin deficiencies, an increased risk of infections, and rebound acid hypersecretion upon sudden discontinuation.
For instance, extended PPI usage has been linked to a heightened risk of Clostridium difficile infection. These side effects present a considerable challenge for patient compliance and long-term treatment success, as they may deter individuals from continuing their medication regimen. Consequently, the market faces limitations in its expansion, as the potential risks of treatment might outweigh the benefits for some patients, leading to decreased demand for such medications and a search for alternative treatments with fewer side effects.
High Cost of Treatment Restrains Market Growth
The financial implications of diagnosing and managing gastritis serve as a major barrier to market growth. Diagnostic processes like endoscopic examinations, along with the costs associated with laboratory tests, prescription medications, and necessary follow-up consultations, compile a substantial financial burden.
This is particularly impactful in areas with limited healthcare coverage or significant out-of-pocket expenses, making access to quality care challenging for a vast segment of the global population. In regions with economic constraints, such as certain parts of Africa, the high cost of treatment can prevent individuals from seeking or continuing care for gastritis. This financial hurdle directly limits the expansion of the gastritis market, as the affordability and accessibility of treatment become crucial factors influencing patient engagement and overall market potential.
Type Analysis
Acute gastritis stands out as the dominant sub-segment within the gastritis market, primarily because it represents the most immediate and common manifestation of the condition. Triggered by factors such as nonsteroidal anti-inflammatory drugs (NSAIDs) use, excessive alcohol consumption, and bacterial infections, acute gastritis showcases a high incidence rate globally. The straightforward diagnosis process, coupled with a generally effective short-term treatment regimen, contributes significantly to its prominence in the market. Despite its dominance, the acute gastritis segment's growth is complemented by the roles of chronic, erosive, and non-erosive gastritis sub-segments.
Chronic gastritis, while not as immediately prevalent as its acute counterpart, plays a crucial role in the long-term health market. Its management often requires ongoing monitoring and treatment, contributing to steady revenue streams for healthcare providers and pharmaceutical companies. Erosive and non-erosive gastritis, although smaller in market size, address niche patient needs and treatment modalities. These sub-segments cater to specific patient demographics, offering tailored treatment options that underscore the market's diversity.
This diversity within the gastritis market allows for a broad range of therapeutic approaches and supports sustained growth by catering to a wide patient base. Research and development efforts, alongside technological advancements in diagnostic methods, continue to refine the understanding and treatment of all gastritis types, further shaping the market dynamics.
Drug Type Analysis
In the gastritis market, antacids emerge as the dominant sub-segment within the drug type category, primarily due to their effectiveness in providing immediate relief from the symptoms of gastritis. Antacids work by neutralizing stomach acid, offering quick relief from discomfort and pain associated with the condition.
Their widespread availability, over-the-counter status, and affordability contribute significantly to their leading position in the market. Additionally, the simplicity of their mechanism and the minimal risk of side effects make them a preferred choice for both patients and healthcare providers.
Other segments within the drug type category, including antibiotics, cytoprotective agents, and prokinetics, play crucial roles in the comprehensive management of gastritis. Antibiotics are essential for treating gastritis caused by H. pylori infection, directly addressing the root cause of a significant proportion of gastritis cases.
Cytoprotective agents help protect the stomach's lining from acid, thereby aiding in the healing process, while prokinetics are used to improve gastric motility, beneficial in cases where gastritis is accompanied by gastric emptying delays. Each of these drug types caters to specific needs within the gastritis treatment landscape, contributing to the overall growth of the market by offering a range of therapeutic options tailored to the diverse manifestations of gastritis.
Route of Administration Analysis
The oral route of administration holds a commanding 62% share in the gastritis market, underscoring its convenience and ease of use. Oral medications, including the dominant antacids, antibiotics, and cytoprotective agents, are preferred for their non-invasive nature, ease of administration, and patient compliance.
This route's predominance is facilitated by the widespread availability of oral formulations, which allows for self-administration and management of symptoms in a home setting, thereby enhancing patient comfort and adherence to treatment regimens.
Parenteral administration, while less common, is crucial in situations where oral administration is not feasible, such as severe nausea or vomiting, or when a rapid onset of action is required. This route plays a complementary role in the gastritis treatment landscape, ensuring that patients can receive effective treatment even under challenging circumstances.
End-User Analysis
Hospitals and clinics, accounting for 40% of the end-user market share, represent the primary care settings for gastritis treatment. This dominance is attributed to the comprehensive care these institutions provide, including diagnosis, treatment, and follow-up care.
Hospitals and clinics are equipped with the necessary facilities for endoscopic examinations and other diagnostic procedures, making them integral to the management of gastritis. The availability of a wide range of treatment options, including both medication and, if necessary, surgical intervention, further solidifies their position as the primary care providers for gastritis patients.
Specialty centers and homecare settings are also pivotal to the gastritis market's growth. Specialty centers offer focused care for more severe or complicated cases of gastritis, often employing multidisciplinary approaches that can include advanced diagnostic and treatment methods.
Homecare settings are increasingly becoming important as they support the ongoing management of chronic gastritis, emphasizing the role of lifestyle modifications and medication adherence in long-term disease management. Together, these segments ensure a holistic approach to gastritis treatment, catering to the needs of diverse patient populations and contributing to the overall expansion of the market.
Key Market Segments
By Type
- Acute Gastritis
- Chronic Gastritis
- Erosive Gastritis
- Non-Erosive Gastritis
By Drug Type
- Antacids
- Antibiotics
- Cytoprotective Agents
- Prokinetics
- Otheres
By Route of Administration
- Oral
- Parenteral
By End-User
- Hospitals and Clinics
- Specialty Centers
- Homecare Settings
Growth Opportunities
Personalized Medicine Offers Growth Opportunity
The shift towards personalized medicine is carving out substantial growth opportunities within the gastritis market. This approach leverages individual patient profiles, including genetic predispositions and lifestyle factors, to tailor treatments specifically to each person's needs. Personalized medicine has the potential to significantly improve treatment outcomes and patient satisfaction by offering more precise and effective management strategies for gastritis.
With the healthcare sector's growing focus on individualized care, investments in genetic testing and other technologies that support personalized treatment plans are becoming increasingly important. These advancements not only enhance patient care but also position companies at the forefront of the gastritis market. By providing tailored therapies, healthcare providers can better meet the diverse needs of patients, leading to improved health outcomes and a stronger demand for personalized healthcare solutions.
Digital Health Solutions Integration Offers Growth Opportunity
Integrating digital health solutions, especially telemedicine, is opening new avenues for growth in the gastritis market. Telemedicine services, which enable remote consultations with healthcare professionals, significantly improve access to care for patients with gastritis. This technological advancement supports more efficient patient care processes, from diagnosis through treatment and follow-up, by facilitating easier communication between patients and healthcare providers.
Additionally, digital health platforms can enhance treatment adherence and patient experience by offering convenient, timely, and personalized care options. The adoption of digital health technologies by companies within the gastritis market is poised to drive market expansion, as patients increasingly seek accessible and efficient healthcare services. This trend towards digital integration reflects a broader shift in healthcare towards more patient-centered and technologically enabled care models, providing a significant opportunity for growth in the management and treatment of gastritis.
Trending Factors
Natural Remedies Are Trending Factors
The increasing inclination towards natural and herbal remedies in managing gastritis signifies a burgeoning market segment. Recent data reveals a surge in demand for alternative therapies, with a significant portion of consumers favoring holistic approaches. Statistics indicate a notable uptick in sales of natural gastritis management products, reflecting consumers' growing trust in these remedies.
This trend presents a lucrative opportunity for companies specializing in natural supplements, herbal teas, and tailored dietary solutions. By catering to the preferences of health-conscious consumers, companies can expand their market reach and capitalize on the shift towards natural remedies. Moreover, this trend addresses concerns about the potential side effects associated with conventional medications, further bolstering its appeal.
Changing Lifestyles Are Trending Factors
Modern lifestyles characterized by erratic eating patterns and heightened stress levels are pivotal drivers behind the escalating prevalence of gastritis. Recent statistics underscore the profound impact of lifestyle choices on gastritis incidence rates, with a notable correlation between fast-paced living and digestive health issues.
This trend creates a fertile ground for market expansion, as consumers seek effective treatments and management options to alleviate gastritis symptoms. Companies can leverage this trend by developing tailored marketing strategies and innovative products that address the specific needs of individuals grappling with hectic lifestyles. By aligning offerings with consumer preferences and lifestyle demands, companies can position themselves for substantial growth within the gastritis market.
Regional Analysis
Europe Dominates with 36% Market Share
Europe's prominent position in the gastritis market, holding a 36% share, is a reflection of several key factors. The region's advanced healthcare infrastructure, high awareness regarding gastrointestinal health, and significant healthcare spending contribute to its dominance. Additionally, Europe's stringent regulatory environment ensures the availability of effective and safe treatment options, further driving market growth. The prevalence of Helicobacter pylori infection, coupled with lifestyle factors such as diet and stress, also plays a crucial role in the high incidence of gastritis across European countries. This situation is bolstered by robust research and development activities in the pharmaceutical and healthcare sectors, promoting innovation in gastritis diagnosis and treatment.
Market dynamics within Europe are influenced by its comprehensive healthcare systems, which ensure widespread access to medical services. This accessibility, along with a growing elderly population susceptible to gastrointestinal conditions, amplifies the demand for gastritis treatments. The region's emphasis on preventive healthcare and early diagnosis further strengthens the market.
Europe is expected to maintain its influence in the gastritis market. The ongoing investment in healthcare infrastructure and research, along with increasing awareness about the importance of gastrointestinal health, will likely sustain Europe's market share. The introduction of new and innovative treatments, supported by a strong regulatory framework, will continue to facilitate market growth.
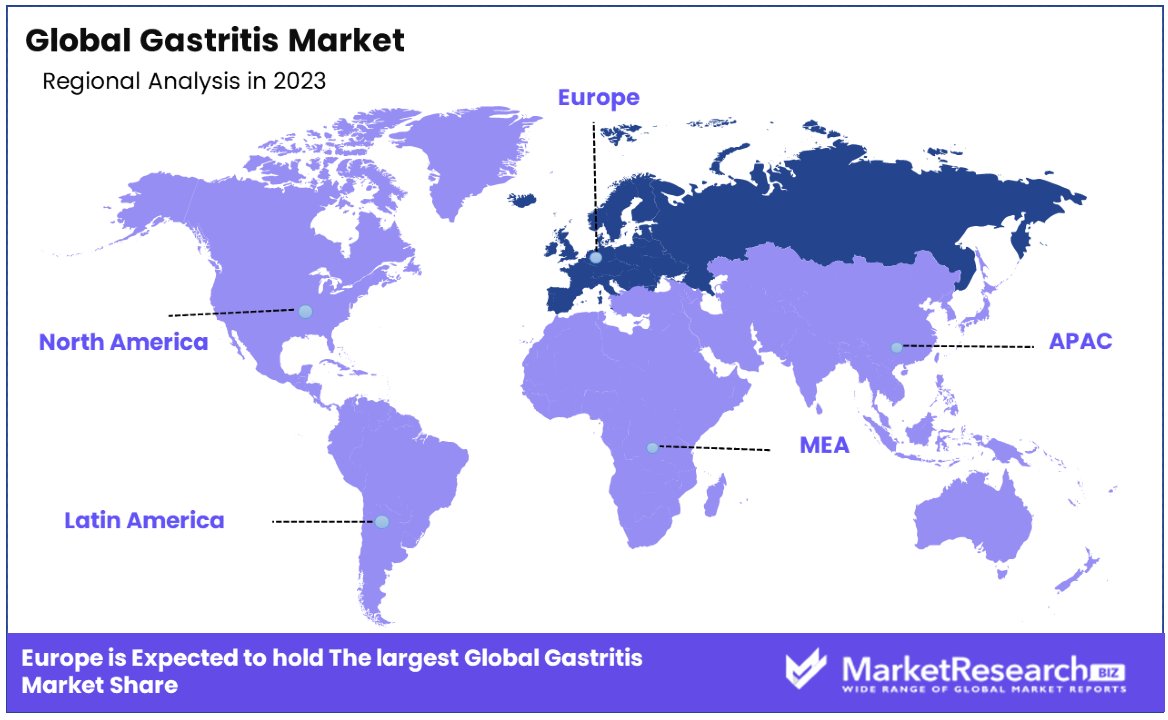
- North America: With a market share of approximately 29%, North America stands as a pivotal region in the gastritis market. High healthcare expenditure in the region supports advanced diagnostics and treatment options for gastritis, while its advanced medical technology and infrastructure facilitate efficient diagnosis and management.
- Asia Pacific: Asia Pacific holds an approximate market share of 20%, making it a significant player in the gastritis market. Rapidly increasing healthcare awareness among the population has led to early detection and management of gastritis. Improvements in healthcare infrastructure and services across the region have expanded access to quality diagnostics and treatment options.
- Middle East & Africa: With a market share of approximately 8%, the Middle East & Africa region plays a crucial role in the gastritis market. Gradual improvements in healthcare systems and infrastructure are enhancing access to diagnostics and treatment for gastritis.
- Latin America: Latin America holds around 7% of the market share, positioning it as an emerging player in the gastritis market. Improvements in healthcare systems and increased access to healthcare services are benefiting gastritis management and treatment in the region.
Key Regions and Countries
- North America
- The US
- Canada
- Mexico
- Western Europe
- Germany
- France
- The UK
- Spain
- Italy
- Portugal
- Ireland
- Austria
- Switzerland
- Benelux
- Nordic
- Rest of Western Europe
- Eastern Europe
- Russia
- Poland
- The Czech Republic
- Greece
- Rest of Eastern Europe
- APAC
- China
- Japan
- South Korea
- India
- Australia & New Zealand
- Indonesia
- Malaysia
- Philippines
- Singapore
- Thailand
- Vietnam
- Rest of APAC
- Latin America
- Brazil
- Colombia
- Chile
- Argentina
- Costa Rica
- Rest of Latin America
- Middle East & Africa
- Algeria
- Egypt
- Israel
- Kuwait
- Nigeria
- Saudi Arabia
- South Africa
- Turkey
- United Arab Emirates
- Rest of MEA
Key Players Analysis
In the Gastritis Market, key companies like Novartis AG, Pfizer Inc., and Takeda Pharmaceutical Company Limited hold significant influence and strategic positioning.
Their impact is evident in various aspects, including pharmaceutical interventions, product launches, and market entry strategies. For instance, Novartis AG's innovative pharmaceutical solutions cater to different Route of Administration preferences, ensuring widespread accessibility and efficacy.
Pfizer Inc. and Takeda Pharmaceutical Company Limited also play crucial roles, leveraging their extensive product portfolios and global reach to address gastritis-related concerns effectively.
These major market players continually invest in research and development to introduce new treatments and enhance existing ones. Their strategic pricing analysis and market entry strategies enable them to capture a significant portion of the market share, particularly in regions like North America and the United Kingdom.
Industry experts closely monitor their key developments, including advancements in pharmaceutical formulations and adaptations to changing dietary patterns. Overall, the Gastritis Market's largest market share is held by these major players, shaping the industry landscape and improving patient outcomes through innovative solutions.
Market Key Players
- Novartis AG
- Pfizer Inc.
- Perrigo Pharmaceutical
- Takeda Pharmaceutical Company Limited
- Lupin Ltd
- AbbVie Inc.
- Katsura Chemical
- SAURAV CHEMICALS
- Bio-Rad Laboratories
- SUN Pharmaceuticals Industries
- Johnson & Johnson
- Wuhan Senwayer Century
- Siemens Healthineers AG
Recent Developments
- On December 2023, Phathom Pharmaceuticals announced that the U.S. Food and Drug Administration (FDA) accepted for review its New Drug Application (NDA) for Voquenza as a daily treatment for adults with Non-Erosive Gastroesophageal Reflux Disease (GERD)
- On April 2023, Akums Drugs and Pharmaceuticals introduced a novel Combikit for the treatment of duodenal ulcer and H. pylori infection. The Combikit consists of a unique combination of Amoxicillin, Clarithromycin, and Esomeprazole.
- On August 2022, Daewoong Pharmaceuticals announced that its drug Fexuclue (Fexuprazan hydrochloride) received an adaptation certificate for improving gastric mucosal lesions of acute and chronic gastritis, securing additional indications within a month of its official launch in Korea.
Report Scope
Report Features Description Market Value (2023) USD 10.2 Billion Forecast Revenue (2033) USD 18.3 Billion CAGR (2024-2033) 6.20% Base Year for Estimation 2023 Historic Period 2018-2023 Forecast Period 2024-2033 Report Coverage Revenue Forecast, Market Dynamics, Competitive Landscape, Recent Developments Segments Covered By Type (Acute Gastritis, Chronic Gastritis, Erosive Gastritis, Non-Erosive Gastritis), By Drug Type (Antacids, Antibiotics, Cytoprotective Agents, Prokinetics, Otheres), By Route of Administration (Oral, Parenteral), By End-User (Hospitals and Clinics, Specialty Centers, Homecare Settings) Regional Analysis North America - The US, Canada, & Mexico; Western Europe - Germany, France, The UK, Spain, Italy, Portugal, Ireland, Austria, Switzerland, Benelux, Nordic, & Rest of Western Europe; Eastern Europe - Russia, Poland, The Czech Republic, Greece, & Rest of Eastern Europe; APAC - China, Japan, South Korea, India, Australia & New Zealand, Indonesia, Malaysia, Philippines, Singapore, Thailand, Vietnam, & Rest of APAC; Latin America - Brazil, Colombia, Chile, Argentina, Costa Rica, & Rest of Latin America; Middle East & Africa - Algeria, Egypt, Israel, Kuwait, Nigeria, Saudi Arabia, South Africa, Turkey, United Arab Emirates, & Rest of MEA Competitive Landscape Novartis AG, Pfizer Inc., Perrigo Pharmaceutical, Takeda Pharmaceutical Company Limited, Lupin Ltd, AbbVie Inc., Katsura Chemical, SAURAV CHEMICALS, Bio-Rad Laboratories, SUN Pharmaceuticals Industries, Johnson & Johnson, Wuhan Senwayer Century, Siemens Healthineers AG Customization Scope Customization for segments, region/country-level will be provided. Moreover, additional customization can be done based on the requirements. Purchase Options We have three licenses to opt for: Single User License, Multi-User License (Up to 5 Users), Corporate Use License (Unlimited User and Printable PDF) -
- 1. Executive Summary
- 1.1. Definition
- 1.2. Taxonomy
- 1.3. Research Scope
- 1.4. Key Analysis
- 1.5. Key Findings by Major Segments
- 1.6. Top strategies by Major Players
- 2. Global Gastritis Market Overview
- 2.1. Gastritis Market Dynamics
- 2.1.1. Drivers
- 2.1.2. Opportunities
- 2.1.3. Restraints
- 2.1.4. Challenges
- 2.2. Macro-economic Factors
- 2.3. Regulatory Framework
- 2.4. Market Investment Feasibility Index
- 2.5. PEST Analysis
- 2.6. PORTER’S Five Force Analysis
- 2.7. Drivers & Restraints Impact Analysis
- 2.8. Industry Chain Analysis
- 2.9. Cost Structure Analysis
- 2.10. Marketing Strategy
- 2.11. Russia-Ukraine War Impact Analysis
- 2.12. Opportunity Map Analysis
- 2.13. Market Competition Scenario Analysis
- 2.14. Product Life Cycle Analysis
- 2.15. Opportunity Orbits
- 2.16. Manufacturer Intensity Map
- 2.17. Major Companies sales by Value & Volume
- 2.1. Gastritis Market Dynamics
- 3. Global Gastritis Market Analysis, Opportunity and Forecast, 2016-2032
- 3.1. Global Gastritis Market Analysis, 2016-2021
- 3.2. Global Gastritis Market Opportunity and Forecast, 2023-2032
- 3.3. Global Gastritis Market Analysis, Opportunity and Forecast, By By Type, 2016-2032
- 3.3.1. Global Gastritis Market Analysis by By Type: Introduction
- 3.3.2. Market Size Absolute $ Opportunity Analysis and Forecast, By By Type, 2016-2032
- 3.3.3. Acute Gastritis
- 3.3.4. Chronic Gastritis
- 3.3.5. Erosive Gastritis
- 3.3.6. Non-Erosive Gastritis
- 3.4. Global Gastritis Market Analysis, Opportunity and Forecast, By By Drug Type, 2016-2032
- 3.4.1. Global Gastritis Market Analysis by By Drug Type: Introduction
- 3.4.2. Market Size Absolute $ Opportunity Analysis and Forecast, By By Drug Type, 2016-2032
- 3.4.3. Antacids
- 3.4.4. Antibiotics
- 3.4.5. Cytoprotective Agents
- 3.4.6. Prokinetics
- 3.4.7. Others
- 3.5. Global Gastritis Market Analysis, Opportunity and Forecast, By By Route of Administration, 2016-2032
- 3.5.1. Global Gastritis Market Analysis by By Route of Administration: Introduction
- 3.5.2. Market Size Absolute $ Opportunity Analysis and Forecast, By By Route of Administration, 2016-2032
- 3.5.3. Oral
- 3.5.4. Parenteral
- 3.6. Global Gastritis Market Analysis, Opportunity and Forecast, By By End-User, 2016-2032
- 3.6.1. Global Gastritis Market Analysis by By End-User: Introduction
- 3.6.2. Market Size Absolute $ Opportunity Analysis and Forecast, By By End-User, 2016-2032
- 3.6.3. Hospitals and Clinics
- 3.6.4. Specialty Centers
- 3.6.5. Homecare Settings
- 3.7. Global Gastritis Market Analysis, Opportunity and Forecast, By By Distribution Channel, 2016-2032
- 3.7.1. Global Gastritis Market Analysis by By Distribution Channel: Introduction
- 3.7.2. Market Size Absolute $ Opportunity Analysis and Forecast, By By Distribution Channel, 2016-2032
- 3.7.3. Hospital Pharmacy
- 3.7.4. Retail Pharmacy
- 3.7.5. Online Pharmacy
- 3.7.6. Others
- 4. North America Gastritis Market Analysis, Opportunity and Forecast, 2016-2032
- 4.1. North America Gastritis Market Analysis, 2016-2021
- 4.2. North America Gastritis Market Opportunity and Forecast, 2023-2032
- 4.3. North America Gastritis Market Analysis, Opportunity and Forecast, By By Type, 2016-2032
- 4.3.1. North America Gastritis Market Analysis by By Type: Introduction
- 4.3.2. Market Size Absolute $ Opportunity Analysis and Forecast, By By Type, 2016-2032
- 4.3.3. Acute Gastritis
- 4.3.4. Chronic Gastritis
- 4.3.5. Erosive Gastritis
- 4.3.6. Non-Erosive Gastritis
- 4.4. North America Gastritis Market Analysis, Opportunity and Forecast, By By Drug Type, 2016-2032
- 4.4.1. North America Gastritis Market Analysis by By Drug Type: Introduction
- 4.4.2. Market Size Absolute $ Opportunity Analysis and Forecast, By By Drug Type, 2016-2032
- 4.4.3. Antacids
- 4.4.4. Antibiotics
- 4.4.5. Cytoprotective Agents
- 4.4.6. Prokinetics
- 4.4.7. Others
- 4.5. North America Gastritis Market Analysis, Opportunity and Forecast, By By Route of Administration, 2016-2032
- 4.5.1. North America Gastritis Market Analysis by By Route of Administration: Introduction
- 4.5.2. Market Size Absolute $ Opportunity Analysis and Forecast, By By Route of Administration, 2016-2032
- 4.5.3. Oral
- 4.5.4. Parenteral
- 4.6. North America Gastritis Market Analysis, Opportunity and Forecast, By By End-User, 2016-2032
- 4.6.1. North America Gastritis Market Analysis by By End-User: Introduction
- 4.6.2. Market Size Absolute $ Opportunity Analysis and Forecast, By By End-User, 2016-2032
- 4.6.3. Hospitals and Clinics
- 4.6.4. Specialty Centers
- 4.6.5. Homecare Settings
- 4.7. North America Gastritis Market Analysis, Opportunity and Forecast, By By Distribution Channel, 2016-2032
- 4.7.1. North America Gastritis Market Analysis by By Distribution Channel: Introduction
- 4.7.2. Market Size Absolute $ Opportunity Analysis and Forecast, By By Distribution Channel, 2016-2032
- 4.7.3. Hospital Pharmacy
- 4.7.4. Retail Pharmacy
- 4.7.5. Online Pharmacy
- 4.7.6. Others
- 4.8. North America Gastritis Market Analysis, Opportunity and Forecast, By Country , 2016-2032
- 4.8.1. North America Gastritis Market Analysis by Country : Introduction
- 4.8.2. Market Size Absolute $ Opportunity Analysis and Forecast, Country , 2016-2032
- 4.8.2.1. The US
- 4.8.2.2. Canada
- 4.8.2.3. Mexico
- 5. Western Europe Gastritis Market Analysis, Opportunity and Forecast, 2016-2032
- 5.1. Western Europe Gastritis Market Analysis, 2016-2021
- 5.2. Western Europe Gastritis Market Opportunity and Forecast, 2023-2032
- 5.3. Western Europe Gastritis Market Analysis, Opportunity and Forecast, By By Type, 2016-2032
- 5.3.1. Western Europe Gastritis Market Analysis by By Type: Introduction
- 5.3.2. Market Size Absolute $ Opportunity Analysis and Forecast, By By Type, 2016-2032
- 5.3.3. Acute Gastritis
- 5.3.4. Chronic Gastritis
- 5.3.5. Erosive Gastritis
- 5.3.6. Non-Erosive Gastritis
- 5.4. Western Europe Gastritis Market Analysis, Opportunity and Forecast, By By Drug Type, 2016-2032
- 5.4.1. Western Europe Gastritis Market Analysis by By Drug Type: Introduction
- 5.4.2. Market Size Absolute $ Opportunity Analysis and Forecast, By By Drug Type, 2016-2032
- 5.4.3. Antacids
- 5.4.4. Antibiotics
- 5.4.5. Cytoprotective Agents
- 5.4.6. Prokinetics
- 5.4.7. Others
- 5.5. Western Europe Gastritis Market Analysis, Opportunity and Forecast, By By Route of Administration, 2016-2032
- 5.5.1. Western Europe Gastritis Market Analysis by By Route of Administration: Introduction
- 5.5.2. Market Size Absolute $ Opportunity Analysis and Forecast, By By Route of Administration, 2016-2032
- 5.5.3. Oral
- 5.5.4. Parenteral
- 5.6. Western Europe Gastritis Market Analysis, Opportunity and Forecast, By By End-User, 2016-2032
- 5.6.1. Western Europe Gastritis Market Analysis by By End-User: Introduction
- 5.6.2. Market Size Absolute $ Opportunity Analysis and Forecast, By By End-User, 2016-2032
- 5.6.3. Hospitals and Clinics
- 5.6.4. Specialty Centers
- 5.6.5. Homecare Settings
- 5.7. Western Europe Gastritis Market Analysis, Opportunity and Forecast, By By Distribution Channel, 2016-2032
- 5.7.1. Western Europe Gastritis Market Analysis by By Distribution Channel: Introduction
- 5.7.2. Market Size Absolute $ Opportunity Analysis and Forecast, By By Distribution Channel, 2016-2032
- 5.7.3. Hospital Pharmacy
- 5.7.4. Retail Pharmacy
- 5.7.5. Online Pharmacy
- 5.7.6. Others
- 5.8. Western Europe Gastritis Market Analysis, Opportunity and Forecast, By Country , 2016-2032
- 5.8.1. Western Europe Gastritis Market Analysis by Country : Introduction
- 5.8.2. Market Size Absolute $ Opportunity Analysis and Forecast, Country , 2016-2032
- 5.8.2.1. Germany
- 5.8.2.2. France
- 5.8.2.3. The UK
- 5.8.2.4. Spain
- 5.8.2.5. Italy
- 5.8.2.6. Portugal
- 5.8.2.7. Ireland
- 5.8.2.8. Austria
- 5.8.2.9. Switzerland
- 5.8.2.10. Benelux
- 5.8.2.11. Nordic
- 5.8.2.12. Rest of Western Europe
- 6. Eastern Europe Gastritis Market Analysis, Opportunity and Forecast, 2016-2032
- 6.1. Eastern Europe Gastritis Market Analysis, 2016-2021
- 6.2. Eastern Europe Gastritis Market Opportunity and Forecast, 2023-2032
- 6.3. Eastern Europe Gastritis Market Analysis, Opportunity and Forecast, By By Type, 2016-2032
- 6.3.1. Eastern Europe Gastritis Market Analysis by By Type: Introduction
- 6.3.2. Market Size Absolute $ Opportunity Analysis and Forecast, By By Type, 2016-2032
- 6.3.3. Acute Gastritis
- 6.3.4. Chronic Gastritis
- 6.3.5. Erosive Gastritis
- 6.3.6. Non-Erosive Gastritis
- 6.4. Eastern Europe Gastritis Market Analysis, Opportunity and Forecast, By By Drug Type, 2016-2032
- 6.4.1. Eastern Europe Gastritis Market Analysis by By Drug Type: Introduction
- 6.4.2. Market Size Absolute $ Opportunity Analysis and Forecast, By By Drug Type, 2016-2032
- 6.4.3. Antacids
- 6.4.4. Antibiotics
- 6.4.5. Cytoprotective Agents
- 6.4.6. Prokinetics
- 6.4.7. Others
- 6.5. Eastern Europe Gastritis Market Analysis, Opportunity and Forecast, By By Route of Administration, 2016-2032
- 6.5.1. Eastern Europe Gastritis Market Analysis by By Route of Administration: Introduction
- 6.5.2. Market Size Absolute $ Opportunity Analysis and Forecast, By By Route of Administration, 2016-2032
- 6.5.3. Oral
- 6.5.4. Parenteral
- 6.6. Eastern Europe Gastritis Market Analysis, Opportunity and Forecast, By By End-User, 2016-2032
- 6.6.1. Eastern Europe Gastritis Market Analysis by By End-User: Introduction
- 6.6.2. Market Size Absolute $ Opportunity Analysis and Forecast, By By End-User, 2016-2032
- 6.6.3. Hospitals and Clinics
- 6.6.4. Specialty Centers
- 6.6.5. Homecare Settings
- 6.7. Eastern Europe Gastritis Market Analysis, Opportunity and Forecast, By By Distribution Channel, 2016-2032
- 6.7.1. Eastern Europe Gastritis Market Analysis by By Distribution Channel: Introduction
- 6.7.2. Market Size Absolute $ Opportunity Analysis and Forecast, By By Distribution Channel, 2016-2032
- 6.7.3. Hospital Pharmacy
- 6.7.4. Retail Pharmacy
- 6.7.5. Online Pharmacy
- 6.7.6. Others
- 6.8. Eastern Europe Gastritis Market Analysis, Opportunity and Forecast, By Country , 2016-2032
- 6.8.1. Eastern Europe Gastritis Market Analysis by Country : Introduction
- 6.8.2. Market Size Absolute $ Opportunity Analysis and Forecast, Country , 2016-2032
- 6.8.2.1. Russia
- 6.8.2.2. Poland
- 6.8.2.3. The Czech Republic
- 6.8.2.4. Greece
- 6.8.2.5. Rest of Eastern Europe
- 7. APAC Gastritis Market Analysis, Opportunity and Forecast, 2016-2032
- 7.1. APAC Gastritis Market Analysis, 2016-2021
- 7.2. APAC Gastritis Market Opportunity and Forecast, 2023-2032
- 7.3. APAC Gastritis Market Analysis, Opportunity and Forecast, By By Type, 2016-2032
- 7.3.1. APAC Gastritis Market Analysis by By Type: Introduction
- 7.3.2. Market Size Absolute $ Opportunity Analysis and Forecast, By By Type, 2016-2032
- 7.3.3. Acute Gastritis
- 7.3.4. Chronic Gastritis
- 7.3.5. Erosive Gastritis
- 7.3.6. Non-Erosive Gastritis
- 7.4. APAC Gastritis Market Analysis, Opportunity and Forecast, By By Drug Type, 2016-2032
- 7.4.1. APAC Gastritis Market Analysis by By Drug Type: Introduction
- 7.4.2. Market Size Absolute $ Opportunity Analysis and Forecast, By By Drug Type, 2016-2032
- 7.4.3. Antacids
- 7.4.4. Antibiotics
- 7.4.5. Cytoprotective Agents
- 7.4.6. Prokinetics
- 7.4.7. Others
- 7.5. APAC Gastritis Market Analysis, Opportunity and Forecast, By By Route of Administration, 2016-2032
- 7.5.1. APAC Gastritis Market Analysis by By Route of Administration: Introduction
- 7.5.2. Market Size Absolute $ Opportunity Analysis and Forecast, By By Route of Administration, 2016-2032
- 7.5.3. Oral
- 7.5.4. Parenteral
- 7.6. APAC Gastritis Market Analysis, Opportunity and Forecast, By By End-User, 2016-2032
- 7.6.1. APAC Gastritis Market Analysis by By End-User: Introduction
- 7.6.2. Market Size Absolute $ Opportunity Analysis and Forecast, By By End-User, 2016-2032
- 7.6.3. Hospitals and Clinics
- 7.6.4. Specialty Centers
- 7.6.5. Homecare Settings
- 7.7. APAC Gastritis Market Analysis, Opportunity and Forecast, By By Distribution Channel, 2016-2032
- 7.7.1. APAC Gastritis Market Analysis by By Distribution Channel: Introduction
- 7.7.2. Market Size Absolute $ Opportunity Analysis and Forecast, By By Distribution Channel, 2016-2032
- 7.7.3. Hospital Pharmacy
- 7.7.4. Retail Pharmacy
- 7.7.5. Online Pharmacy
- 7.7.6. Others
- 7.8. APAC Gastritis Market Analysis, Opportunity and Forecast, By Country , 2016-2032
- 7.8.1. APAC Gastritis Market Analysis by Country : Introduction
- 7.8.2. Market Size Absolute $ Opportunity Analysis and Forecast, Country , 2016-2032
- 7.8.2.1. China
- 7.8.2.2. Japan
- 7.8.2.3. South Korea
- 7.8.2.4. India
- 7.8.2.5. Australia & New Zeland
- 7.8.2.6. Indonesia
- 7.8.2.7. Malaysia
- 7.8.2.8. Philippines
- 7.8.2.9. Singapore
- 7.8.2.10. Thailand
- 7.8.2.11. Vietnam
- 7.8.2.12. Rest of APAC
- 8. Latin America Gastritis Market Analysis, Opportunity and Forecast, 2016-2032
- 8.1. Latin America Gastritis Market Analysis, 2016-2021
- 8.2. Latin America Gastritis Market Opportunity and Forecast, 2023-2032
- 8.3. Latin America Gastritis Market Analysis, Opportunity and Forecast, By By Type, 2016-2032
- 8.3.1. Latin America Gastritis Market Analysis by By Type: Introduction
- 8.3.2. Market Size Absolute $ Opportunity Analysis and Forecast, By By Type, 2016-2032
- 8.3.3. Acute Gastritis
- 8.3.4. Chronic Gastritis
- 8.3.5. Erosive Gastritis
- 8.3.6. Non-Erosive Gastritis
- 8.4. Latin America Gastritis Market Analysis, Opportunity and Forecast, By By Drug Type, 2016-2032
- 8.4.1. Latin America Gastritis Market Analysis by By Drug Type: Introduction
- 8.4.2. Market Size Absolute $ Opportunity Analysis and Forecast, By By Drug Type, 2016-2032
- 8.4.3. Antacids
- 8.4.4. Antibiotics
- 8.4.5. Cytoprotective Agents
- 8.4.6. Prokinetics
- 8.4.7. Others
- 8.5. Latin America Gastritis Market Analysis, Opportunity and Forecast, By By Route of Administration, 2016-2032
- 8.5.1. Latin America Gastritis Market Analysis by By Route of Administration: Introduction
- 8.5.2. Market Size Absolute $ Opportunity Analysis and Forecast, By By Route of Administration, 2016-2032
- 8.5.3. Oral
- 8.5.4. Parenteral
- 8.6. Latin America Gastritis Market Analysis, Opportunity and Forecast, By By End-User, 2016-2032
- 8.6.1. Latin America Gastritis Market Analysis by By End-User: Introduction
- 8.6.2. Market Size Absolute $ Opportunity Analysis and Forecast, By By End-User, 2016-2032
- 8.6.3. Hospitals and Clinics
- 8.6.4. Specialty Centers
- 8.6.5. Homecare Settings
- 8.7. Latin America Gastritis Market Analysis, Opportunity and Forecast, By By Distribution Channel, 2016-2032
- 8.7.1. Latin America Gastritis Market Analysis by By Distribution Channel: Introduction
- 8.7.2. Market Size Absolute $ Opportunity Analysis and Forecast, By By Distribution Channel, 2016-2032
- 8.7.3. Hospital Pharmacy
- 8.7.4. Retail Pharmacy
- 8.7.5. Online Pharmacy
- 8.7.6. Others
- 8.8. Latin America Gastritis Market Analysis, Opportunity and Forecast, By Country , 2016-2032
- 8.8.1. Latin America Gastritis Market Analysis by Country : Introduction
- 8.8.2. Market Size Absolute $ Opportunity Analysis and Forecast, Country , 2016-2032
- 8.8.2.1. Brazil
- 8.8.2.2. Colombia
- 8.8.2.3. Chile
- 8.8.2.4. Argentina
- 8.8.2.5. Costa Rica
- 8.8.2.6. Rest of Latin America
- 9. Middle East & Africa Gastritis Market Analysis, Opportunity and Forecast, 2016-2032
- 9.1. Middle East & Africa Gastritis Market Analysis, 2016-2021
- 9.2. Middle East & Africa Gastritis Market Opportunity and Forecast, 2023-2032
- 9.3. Middle East & Africa Gastritis Market Analysis, Opportunity and Forecast, By By Type, 2016-2032
- 9.3.1. Middle East & Africa Gastritis Market Analysis by By Type: Introduction
- 9.3.2. Market Size Absolute $ Opportunity Analysis and Forecast, By By Type, 2016-2032
- 9.3.3. Acute Gastritis
- 9.3.4. Chronic Gastritis
- 9.3.5. Erosive Gastritis
- 9.3.6. Non-Erosive Gastritis
- 9.4. Middle East & Africa Gastritis Market Analysis, Opportunity and Forecast, By By Drug Type, 2016-2032
- 9.4.1. Middle East & Africa Gastritis Market Analysis by By Drug Type: Introduction
- 9.4.2. Market Size Absolute $ Opportunity Analysis and Forecast, By By Drug Type, 2016-2032
- 9.4.3. Antacids
- 9.4.4. Antibiotics
- 9.4.5. Cytoprotective Agents
- 9.4.6. Prokinetics
- 9.4.7. Others
- 9.5. Middle East & Africa Gastritis Market Analysis, Opportunity and Forecast, By By Route of Administration, 2016-2032
- 9.5.1. Middle East & Africa Gastritis Market Analysis by By Route of Administration: Introduction
- 9.5.2. Market Size Absolute $ Opportunity Analysis and Forecast, By By Route of Administration, 2016-2032
- 9.5.3. Oral
- 9.5.4. Parenteral
- 9.6. Middle East & Africa Gastritis Market Analysis, Opportunity and Forecast, By By End-User, 2016-2032
- 9.6.1. Middle East & Africa Gastritis Market Analysis by By End-User: Introduction
- 9.6.2. Market Size Absolute $ Opportunity Analysis and Forecast, By By End-User, 2016-2032
- 9.6.3. Hospitals and Clinics
- 9.6.4. Specialty Centers
- 9.6.5. Homecare Settings
- 9.7. Middle East & Africa Gastritis Market Analysis, Opportunity and Forecast, By By Distribution Channel, 2016-2032
- 9.7.1. Middle East & Africa Gastritis Market Analysis by By Distribution Channel: Introduction
- 9.7.2. Market Size Absolute $ Opportunity Analysis and Forecast, By By Distribution Channel, 2016-2032
- 9.7.3. Hospital Pharmacy
- 9.7.4. Retail Pharmacy
- 9.7.5. Online Pharmacy
- 9.7.6. Others
- 9.8. Middle East & Africa Gastritis Market Analysis, Opportunity and Forecast, By Country , 2016-2032
- 9.8.1. Middle East & Africa Gastritis Market Analysis by Country : Introduction
- 9.8.2. Market Size Absolute $ Opportunity Analysis and Forecast, Country , 2016-2032
- 9.8.2.1. Algeria
- 9.8.2.2. Egypt
- 9.8.2.3. Israel
- 9.8.2.4. Kuwait
- 9.8.2.5. Nigeria
- 9.8.2.6. Saudi Arabia
- 9.8.2.7. South Africa
- 9.8.2.8. Turkey
- 9.8.2.9. The UAE
- 9.8.2.10. Rest of MEA
- 10. Global Gastritis Market Analysis, Opportunity and Forecast, By Region , 2016-2032
- 10.1. Global Gastritis Market Analysis by Region : Introduction
- 10.2. Market Size Absolute $ Opportunity Analysis and Forecast, By Region , 2016-2032
- 10.2.1. North America
- 10.2.2. Western Europe
- 10.2.3. Eastern Europe
- 10.2.4. APAC
- 10.2.5. Latin America
- 10.2.6. Middle East & Africa
- 11. Global Gastritis Market Competitive Landscape, Market Share Analysis, and Company Profiles
- 11.1. Market Share Analysis
- 11.2. Company Profiles
- 11.3. AstraZeneca PLC
- 11.3.1. Company Overview
- 11.3.2. Financial Highlights
- 11.3.3. Product Portfolio
- 11.3.4. SWOT Analysis
- 11.3.5. Key Strategies and Developments
- 11.4. Takeda Pharmaceutical Company Limited
- 11.4.1. Company Overview
- 11.4.2. Financial Highlights
- 11.4.3. Product Portfolio
- 11.4.4. SWOT Analysis
- 11.4.5. Key Strategies and Developments
- 11.5. Pfizer Inc.
- 11.5.1. Company Overview
- 11.5.2. Financial Highlights
- 11.5.3. Product Portfolio
- 11.5.4. SWOT Analysis
- 11.5.5. Key Strategies and Developments
- 11.6. AbbVie Inc.
- 11.6.1. Company Overview
- 11.6.2. Financial Highlights
- 11.6.3. Product Portfolio
- 11.6.4. SWOT Analysis
- 11.6.5. Key Strategies and Developments
- 11.7. Bayer AG
- 11.7.1. Company Overview
- 11.7.2. Financial Highlights
- 11.7.3. Product Portfolio
- 11.7.4. SWOT Analysis
- 11.7.5. Key Strategies and Developments
- 11.8. Eli Lilly and Company
- 11.8.1. Company Overview
- 11.8.2. Financial Highlights
- 11.8.3. Product Portfolio
- 11.8.4. SWOT Analysis
- 11.8.5. Key Strategies and Developments
- 11.9. Novartis AG
- 11.9.1. Company Overview
- 11.9.2. Financial Highlights
- 11.9.3. Product Portfolio
- 11.9.4. SWOT Analysis
- 11.9.5. Key Strategies and Developments
- 11.10. Merck & Co.
- 11.10.1. Company Overview
- 11.10.2. Financial Highlights
- 11.10.3. Product Portfolio
- 11.10.4. SWOT Analysis
- 11.10.5. Key Strategies and Developments
- 11.11. Inc.
- 11.11.1. Company Overview
- 11.11.2. Financial Highlights
- 11.11.3. Product Portfolio
- 11.11.4. SWOT Analysis
- 11.11.5. Key Strategies and Developments
- 11.12. Sanofi S.A.
- 11.12.1. Company Overview
- 11.12.2. Financial Highlights
- 11.12.3. Product Portfolio
- 11.12.4. SWOT Analysis
- 11.12.5. Key Strategies and Developments
- 11.13. Johnson & Johnson
- 11.13.1. Company Overview
- 11.13.2. Financial Highlights
- 11.13.3. Product Portfolio
- 11.13.4. SWOT Analysis
- 11.13.5. Key Strategies and Developments
- 11.14. Bio-Rad Laboratories
- 11.14.1. Company Overview
- 11.14.2. Financial Highlights
- 11.14.3. Product Portfolio
- 11.14.4. SWOT Analysis
- 11.14.5. Key Strategies and Developments
- 11.15. Inc.
- 11.15.1. Company Overview
- 11.15.2. Financial Highlights
- 11.15.3. Product Portfolio
- 11.15.4. SWOT Analysis
- 11.15.5. Key Strategies and Developments
- 11.16. F. Hoffmann-La Roche Ltd
- 11.16.1. Company Overview
- 11.16.2. Financial Highlights
- 11.16.3. Product Portfolio
- 11.16.4. SWOT Analysis
- 11.16.5. Key Strategies and Developments
- 11.17. Siemens Healthineers AG
- 11.17.1. Company Overview
- 11.17.2. Financial Highlights
- 11.17.3. Product Portfolio
- 11.17.4. SWOT Analysis
- 11.17.5. Key Strategies and Developments
- 11.18. Other Key Players
- 11.18.1. Company Overview
- 11.18.2. Financial Highlights
- 11.18.3. Product Portfolio
- 11.18.4. SWOT Analysis
- 11.18.5. Key Strategies and Developments
- 12. Assumptions and Acronyms
- 13. Research Methodology
- 14. Contact
- List of Figures
- Figure 1: Global Gastritis Market Revenue (US$ Mn) Market Share by By Type in 2022
- Figure 2: Global Gastritis Market Attractiveness Analysis by By Type, 2016-2032
- Figure 3: Global Gastritis Market Revenue (US$ Mn) Market Share by By Drug Typein 2022
- Figure 4: Global Gastritis Market Attractiveness Analysis by By Drug Type, 2016-2032
- Figure 5: Global Gastritis Market Revenue (US$ Mn) Market Share by By Route of Administrationin 2022
- Figure 6: Global Gastritis Market Attractiveness Analysis by By Route of Administration, 2016-2032
- Figure 7: Global Gastritis Market Revenue (US$ Mn) Market Share by By End-Userin 2022
- Figure 8: Global Gastritis Market Attractiveness Analysis by By End-User, 2016-2032
- Figure 9: Global Gastritis Market Revenue (US$ Mn) Market Share by By Distribution Channelin 2022
- Figure 10: Global Gastritis Market Attractiveness Analysis by By Distribution Channel, 2016-2032
- Figure 11: Global Gastritis Market Revenue (US$ Mn) Market Share by Region in 2022
- Figure 12: Global Gastritis Market Attractiveness Analysis by Region, 2016-2032
- Figure 13: Global Gastritis Market Revenue (US$ Mn) (2016-2032)
- Figure 14: Global Gastritis Market Revenue (US$ Mn) Comparison by Region (2016-2032)
- Figure 15: Global Gastritis Market Revenue (US$ Mn) Comparison by By Type (2016-2032)
- Figure 16: Global Gastritis Market Revenue (US$ Mn) Comparison by By Drug Type (2016-2032)
- Figure 17: Global Gastritis Market Revenue (US$ Mn) Comparison by By Route of Administration (2016-2032)
- Figure 18: Global Gastritis Market Revenue (US$ Mn) Comparison by By End-User (2016-2032)
- Figure 19: Global Gastritis Market Revenue (US$ Mn) Comparison by By Distribution Channel (2016-2032)
- Figure 20: Global Gastritis Market Y-o-Y Growth Rate Comparison by Region (2016-2032)
- Figure 21: Global Gastritis Market Y-o-Y Growth Rate Comparison by By Type (2016-2032)
- Figure 22: Global Gastritis Market Y-o-Y Growth Rate Comparison by By Drug Type (2016-2032)
- Figure 23: Global Gastritis Market Y-o-Y Growth Rate Comparison by By Route of Administration (2016-2032)
- Figure 24: Global Gastritis Market Y-o-Y Growth Rate Comparison by By End-User (2016-2032)
- Figure 25: Global Gastritis Market Y-o-Y Growth Rate Comparison by By Distribution Channel (2016-2032)
- Figure 26: Global Gastritis Market Share Comparison by Region (2016-2032)
- Figure 27: Global Gastritis Market Share Comparison by By Type (2016-2032)
- Figure 28: Global Gastritis Market Share Comparison by By Drug Type (2016-2032)
- Figure 29: Global Gastritis Market Share Comparison by By Route of Administration (2016-2032)
- Figure 30: Global Gastritis Market Share Comparison by By End-User (2016-2032)
- Figure 31: Global Gastritis Market Share Comparison by By Distribution Channel (2016-2032)
- Figure 32: North America Gastritis Market Revenue (US$ Mn) Market Share by By Typein 2022
- Figure 33: North America Gastritis Market Attractiveness Analysis by By Type, 2016-2032
- Figure 34: North America Gastritis Market Revenue (US$ Mn) Market Share by By Drug Typein 2022
- Figure 35: North America Gastritis Market Attractiveness Analysis by By Drug Type, 2016-2032
- Figure 36: North America Gastritis Market Revenue (US$ Mn) Market Share by By Route of Administrationin 2022
- Figure 37: North America Gastritis Market Attractiveness Analysis by By Route of Administration, 2016-2032
- Figure 38: North America Gastritis Market Revenue (US$ Mn) Market Share by By End-Userin 2022
- Figure 39: North America Gastritis Market Attractiveness Analysis by By End-User, 2016-2032
- Figure 40: North America Gastritis Market Revenue (US$ Mn) Market Share by By Distribution Channelin 2022
- Figure 41: North America Gastritis Market Attractiveness Analysis by By Distribution Channel, 2016-2032
- Figure 42: North America Gastritis Market Revenue (US$ Mn) Market Share by Country in 2022
- Figure 43: North America Gastritis Market Attractiveness Analysis by Country, 2016-2032
- Figure 44: North America Gastritis Market Revenue (US$ Mn) (2016-2032)
- Figure 45: North America Gastritis Market Revenue (US$ Mn) Comparison by Country (2016-2032)
- Figure 46: North America Gastritis Market Revenue (US$ Mn) Comparison by By Type (2016-2032)
- Figure 47: North America Gastritis Market Revenue (US$ Mn) Comparison by By Drug Type (2016-2032)
- Figure 48: North America Gastritis Market Revenue (US$ Mn) Comparison by By Route of Administration (2016-2032)
- Figure 49: North America Gastritis Market Revenue (US$ Mn) Comparison by By End-User (2016-2032)
- Figure 50: North America Gastritis Market Revenue (US$ Mn) Comparison by By Distribution Channel (2016-2032)
- Figure 51: North America Gastritis Market Y-o-Y Growth Rate Comparison by Country (2016-2032)
- Figure 52: North America Gastritis Market Y-o-Y Growth Rate Comparison by By Type (2016-2032)
- Figure 53: North America Gastritis Market Y-o-Y Growth Rate Comparison by By Drug Type (2016-2032)
- Figure 54: North America Gastritis Market Y-o-Y Growth Rate Comparison by By Route of Administration (2016-2032)
- Figure 55: North America Gastritis Market Y-o-Y Growth Rate Comparison by By End-User (2016-2032)
- Figure 56: North America Gastritis Market Y-o-Y Growth Rate Comparison by By Distribution Channel (2016-2032)
- Figure 57: North America Gastritis Market Share Comparison by Country (2016-2032)
- Figure 58: North America Gastritis Market Share Comparison by By Type (2016-2032)
- Figure 59: North America Gastritis Market Share Comparison by By Drug Type (2016-2032)
- Figure 60: North America Gastritis Market Share Comparison by By Route of Administration (2016-2032)
- Figure 61: North America Gastritis Market Share Comparison by By End-User (2016-2032)
- Figure 62: North America Gastritis Market Share Comparison by By Distribution Channel (2016-2032)
- Figure 63: Western Europe Gastritis Market Revenue (US$ Mn) Market Share by By Typein 2022
- Figure 64: Western Europe Gastritis Market Attractiveness Analysis by By Type, 2016-2032
- Figure 65: Western Europe Gastritis Market Revenue (US$ Mn) Market Share by By Drug Typein 2022
- Figure 66: Western Europe Gastritis Market Attractiveness Analysis by By Drug Type, 2016-2032
- Figure 67: Western Europe Gastritis Market Revenue (US$ Mn) Market Share by By Route of Administrationin 2022
- Figure 68: Western Europe Gastritis Market Attractiveness Analysis by By Route of Administration, 2016-2032
- Figure 69: Western Europe Gastritis Market Revenue (US$ Mn) Market Share by By End-Userin 2022
- Figure 70: Western Europe Gastritis Market Attractiveness Analysis by By End-User, 2016-2032
- Figure 71: Western Europe Gastritis Market Revenue (US$ Mn) Market Share by By Distribution Channelin 2022
- Figure 72: Western Europe Gastritis Market Attractiveness Analysis by By Distribution Channel, 2016-2032
- Figure 73: Western Europe Gastritis Market Revenue (US$ Mn) Market Share by Country in 2022
- Figure 74: Western Europe Gastritis Market Attractiveness Analysis by Country, 2016-2032
- Figure 75: Western Europe Gastritis Market Revenue (US$ Mn) (2016-2032)
- Figure 76: Western Europe Gastritis Market Revenue (US$ Mn) Comparison by Country (2016-2032)
- Figure 77: Western Europe Gastritis Market Revenue (US$ Mn) Comparison by By Type (2016-2032)
- Figure 78: Western Europe Gastritis Market Revenue (US$ Mn) Comparison by By Drug Type (2016-2032)
- Figure 79: Western Europe Gastritis Market Revenue (US$ Mn) Comparison by By Route of Administration (2016-2032)
- Figure 80: Western Europe Gastritis Market Revenue (US$ Mn) Comparison by By End-User (2016-2032)
- Figure 81: Western Europe Gastritis Market Revenue (US$ Mn) Comparison by By Distribution Channel (2016-2032)
- Figure 82: Western Europe Gastritis Market Y-o-Y Growth Rate Comparison by Country (2016-2032)
- Figure 83: Western Europe Gastritis Market Y-o-Y Growth Rate Comparison by By Type (2016-2032)
- Figure 84: Western Europe Gastritis Market Y-o-Y Growth Rate Comparison by By Drug Type (2016-2032)
- Figure 85: Western Europe Gastritis Market Y-o-Y Growth Rate Comparison by By Route of Administration (2016-2032)
- Figure 86: Western Europe Gastritis Market Y-o-Y Growth Rate Comparison by By End-User (2016-2032)
- Figure 87: Western Europe Gastritis Market Y-o-Y Growth Rate Comparison by By Distribution Channel (2016-2032)
- Figure 88: Western Europe Gastritis Market Share Comparison by Country (2016-2032)
- Figure 89: Western Europe Gastritis Market Share Comparison by By Type (2016-2032)
- Figure 90: Western Europe Gastritis Market Share Comparison by By Drug Type (2016-2032)
- Figure 91: Western Europe Gastritis Market Share Comparison by By Route of Administration (2016-2032)
- Figure 92: Western Europe Gastritis Market Share Comparison by By End-User (2016-2032)
- Figure 93: Western Europe Gastritis Market Share Comparison by By Distribution Channel (2016-2032)
- Figure 94: Eastern Europe Gastritis Market Revenue (US$ Mn) Market Share by By Typein 2022
- Figure 95: Eastern Europe Gastritis Market Attractiveness Analysis by By Type, 2016-2032
- Figure 96: Eastern Europe Gastritis Market Revenue (US$ Mn) Market Share by By Drug Typein 2022
- Figure 97: Eastern Europe Gastritis Market Attractiveness Analysis by By Drug Type, 2016-2032
- Figure 98: Eastern Europe Gastritis Market Revenue (US$ Mn) Market Share by By Route of Administrationin 2022
- Figure 99: Eastern Europe Gastritis Market Attractiveness Analysis by By Route of Administration, 2016-2032
- Figure 100: Eastern Europe Gastritis Market Revenue (US$ Mn) Market Share by By End-Userin 2022
- Figure 101: Eastern Europe Gastritis Market Attractiveness Analysis by By End-User, 2016-2032
- Figure 102: Eastern Europe Gastritis Market Revenue (US$ Mn) Market Share by By Distribution Channelin 2022
- Figure 103: Eastern Europe Gastritis Market Attractiveness Analysis by By Distribution Channel, 2016-2032
- Figure 104: Eastern Europe Gastritis Market Revenue (US$ Mn) Market Share by Country in 2022
- Figure 105: Eastern Europe Gastritis Market Attractiveness Analysis by Country, 2016-2032
- Figure 106: Eastern Europe Gastritis Market Revenue (US$ Mn) (2016-2032)
- Figure 107: Eastern Europe Gastritis Market Revenue (US$ Mn) Comparison by Country (2016-2032)
- Figure 108: Eastern Europe Gastritis Market Revenue (US$ Mn) Comparison by By Type (2016-2032)
- Figure 109: Eastern Europe Gastritis Market Revenue (US$ Mn) Comparison by By Drug Type (2016-2032)
- Figure 110: Eastern Europe Gastritis Market Revenue (US$ Mn) Comparison by By Route of Administration (2016-2032)
- Figure 111: Eastern Europe Gastritis Market Revenue (US$ Mn) Comparison by By End-User (2016-2032)
- Figure 112: Eastern Europe Gastritis Market Revenue (US$ Mn) Comparison by By Distribution Channel (2016-2032)
- Figure 113: Eastern Europe Gastritis Market Y-o-Y Growth Rate Comparison by Country (2016-2032)
- Figure 114: Eastern Europe Gastritis Market Y-o-Y Growth Rate Comparison by By Type (2016-2032)
- Figure 115: Eastern Europe Gastritis Market Y-o-Y Growth Rate Comparison by By Drug Type (2016-2032)
- Figure 116: Eastern Europe Gastritis Market Y-o-Y Growth Rate Comparison by By Route of Administration (2016-2032)
- Figure 117: Eastern Europe Gastritis Market Y-o-Y Growth Rate Comparison by By End-User (2016-2032)
- Figure 118: Eastern Europe Gastritis Market Y-o-Y Growth Rate Comparison by By Distribution Channel (2016-2032)
- Figure 119: Eastern Europe Gastritis Market Share Comparison by Country (2016-2032)
- Figure 120: Eastern Europe Gastritis Market Share Comparison by By Type (2016-2032)
- Figure 121: Eastern Europe Gastritis Market Share Comparison by By Drug Type (2016-2032)
- Figure 122: Eastern Europe Gastritis Market Share Comparison by By Route of Administration (2016-2032)
- Figure 123: Eastern Europe Gastritis Market Share Comparison by By End-User (2016-2032)
- Figure 124: Eastern Europe Gastritis Market Share Comparison by By Distribution Channel (2016-2032)
- Figure 125: APAC Gastritis Market Revenue (US$ Mn) Market Share by By Typein 2022
- Figure 126: APAC Gastritis Market Attractiveness Analysis by By Type, 2016-2032
- Figure 127: APAC Gastritis Market Revenue (US$ Mn) Market Share by By Drug Typein 2022
- Figure 128: APAC Gastritis Market Attractiveness Analysis by By Drug Type, 2016-2032
- Figure 129: APAC Gastritis Market Revenue (US$ Mn) Market Share by By Route of Administrationin 2022
- Figure 130: APAC Gastritis Market Attractiveness Analysis by By Route of Administration, 2016-2032
- Figure 131: APAC Gastritis Market Revenue (US$ Mn) Market Share by By End-Userin 2022
- Figure 132: APAC Gastritis Market Attractiveness Analysis by By End-User, 2016-2032
- Figure 133: APAC Gastritis Market Revenue (US$ Mn) Market Share by By Distribution Channelin 2022
- Figure 134: APAC Gastritis Market Attractiveness Analysis by By Distribution Channel, 2016-2032
- Figure 135: APAC Gastritis Market Revenue (US$ Mn) Market Share by Country in 2022
- Figure 136: APAC Gastritis Market Attractiveness Analysis by Country, 2016-2032
- Figure 137: APAC Gastritis Market Revenue (US$ Mn) (2016-2032)
- Figure 138: APAC Gastritis Market Revenue (US$ Mn) Comparison by Country (2016-2032)
- Figure 139: APAC Gastritis Market Revenue (US$ Mn) Comparison by By Type (2016-2032)
- Figure 140: APAC Gastritis Market Revenue (US$ Mn) Comparison by By Drug Type (2016-2032)
- Figure 141: APAC Gastritis Market Revenue (US$ Mn) Comparison by By Route of Administration (2016-2032)
- Figure 142: APAC Gastritis Market Revenue (US$ Mn) Comparison by By End-User (2016-2032)
- Figure 143: APAC Gastritis Market Revenue (US$ Mn) Comparison by By Distribution Channel (2016-2032)
- Figure 144: APAC Gastritis Market Y-o-Y Growth Rate Comparison by Country (2016-2032)
- Figure 145: APAC Gastritis Market Y-o-Y Growth Rate Comparison by By Type (2016-2032)
- Figure 146: APAC Gastritis Market Y-o-Y Growth Rate Comparison by By Drug Type (2016-2032)
- Figure 147: APAC Gastritis Market Y-o-Y Growth Rate Comparison by By Route of Administration (2016-2032)
- Figure 148: APAC Gastritis Market Y-o-Y Growth Rate Comparison by By End-User (2016-2032)
- Figure 149: APAC Gastritis Market Y-o-Y Growth Rate Comparison by By Distribution Channel (2016-2032)
- Figure 150: APAC Gastritis Market Share Comparison by Country (2016-2032)
- Figure 151: APAC Gastritis Market Share Comparison by By Type (2016-2032)
- Figure 152: APAC Gastritis Market Share Comparison by By Drug Type (2016-2032)
- Figure 153: APAC Gastritis Market Share Comparison by By Route of Administration (2016-2032)
- Figure 154: APAC Gastritis Market Share Comparison by By End-User (2016-2032)
- Figure 155: APAC Gastritis Market Share Comparison by By Distribution Channel (2016-2032)
- Figure 156: Latin America Gastritis Market Revenue (US$ Mn) Market Share by By Typein 2022
- Figure 157: Latin America Gastritis Market Attractiveness Analysis by By Type, 2016-2032
- Figure 158: Latin America Gastritis Market Revenue (US$ Mn) Market Share by By Drug Typein 2022
- Figure 159: Latin America Gastritis Market Attractiveness Analysis by By Drug Type, 2016-2032
- Figure 160: Latin America Gastritis Market Revenue (US$ Mn) Market Share by By Route of Administrationin 2022
- Figure 161: Latin America Gastritis Market Attractiveness Analysis by By Route of Administration, 2016-2032
- Figure 162: Latin America Gastritis Market Revenue (US$ Mn) Market Share by By End-Userin 2022
- Figure 163: Latin America Gastritis Market Attractiveness Analysis by By End-User, 2016-2032
- Figure 164: Latin America Gastritis Market Revenue (US$ Mn) Market Share by By Distribution Channelin 2022
- Figure 165: Latin America Gastritis Market Attractiveness Analysis by By Distribution Channel, 2016-2032
- Figure 166: Latin America Gastritis Market Revenue (US$ Mn) Market Share by Country in 2022
- Figure 167: Latin America Gastritis Market Attractiveness Analysis by Country, 2016-2032
- Figure 168: Latin America Gastritis Market Revenue (US$ Mn) (2016-2032)
- Figure 169: Latin America Gastritis Market Revenue (US$ Mn) Comparison by Country (2016-2032)
- Figure 170: Latin America Gastritis Market Revenue (US$ Mn) Comparison by By Type (2016-2032)
- Figure 171: Latin America Gastritis Market Revenue (US$ Mn) Comparison by By Drug Type (2016-2032)
- Figure 172: Latin America Gastritis Market Revenue (US$ Mn) Comparison by By Route of Administration (2016-2032)
- Figure 173: Latin America Gastritis Market Revenue (US$ Mn) Comparison by By End-User (2016-2032)
- Figure 174: Latin America Gastritis Market Revenue (US$ Mn) Comparison by By Distribution Channel (2016-2032)
- Figure 175: Latin America Gastritis Market Y-o-Y Growth Rate Comparison by Country (2016-2032)
- Figure 176: Latin America Gastritis Market Y-o-Y Growth Rate Comparison by By Type (2016-2032)
- Figure 177: Latin America Gastritis Market Y-o-Y Growth Rate Comparison by By Drug Type (2016-2032)
- Figure 178: Latin America Gastritis Market Y-o-Y Growth Rate Comparison by By Route of Administration (2016-2032)
- Figure 179: Latin America Gastritis Market Y-o-Y Growth Rate Comparison by By End-User (2016-2032)
- Figure 180: Latin America Gastritis Market Y-o-Y Growth Rate Comparison by By Distribution Channel (2016-2032)
- Figure 181: Latin America Gastritis Market Share Comparison by Country (2016-2032)
- Figure 182: Latin America Gastritis Market Share Comparison by By Type (2016-2032)
- Figure 183: Latin America Gastritis Market Share Comparison by By Drug Type (2016-2032)
- Figure 184: Latin America Gastritis Market Share Comparison by By Route of Administration (2016-2032)
- Figure 185: Latin America Gastritis Market Share Comparison by By End-User (2016-2032)
- Figure 186: Latin America Gastritis Market Share Comparison by By Distribution Channel (2016-2032)
- Figure 187: Middle East & Africa Gastritis Market Revenue (US$ Mn) Market Share by By Typein 2022
- Figure 188: Middle East & Africa Gastritis Market Attractiveness Analysis by By Type, 2016-2032
- Figure 189: Middle East & Africa Gastritis Market Revenue (US$ Mn) Market Share by By Drug Typein 2022
- Figure 190: Middle East & Africa Gastritis Market Attractiveness Analysis by By Drug Type, 2016-2032
- Figure 191: Middle East & Africa Gastritis Market Revenue (US$ Mn) Market Share by By Route of Administrationin 2022
- Figure 192: Middle East & Africa Gastritis Market Attractiveness Analysis by By Route of Administration, 2016-2032
- Figure 193: Middle East & Africa Gastritis Market Revenue (US$ Mn) Market Share by By End-Userin 2022
- Figure 194: Middle East & Africa Gastritis Market Attractiveness Analysis by By End-User, 2016-2032
- Figure 195: Middle East & Africa Gastritis Market Revenue (US$ Mn) Market Share by By Distribution Channelin 2022
- Figure 196: Middle East & Africa Gastritis Market Attractiveness Analysis by By Distribution Channel, 2016-2032
- Figure 197: Middle East & Africa Gastritis Market Revenue (US$ Mn) Market Share by Country in 2022
- Figure 198: Middle East & Africa Gastritis Market Attractiveness Analysis by Country, 2016-2032
- Figure 199: Middle East & Africa Gastritis Market Revenue (US$ Mn) (2016-2032)
- Figure 200: Middle East & Africa Gastritis Market Revenue (US$ Mn) Comparison by Country (2016-2032)
- Figure 201: Middle East & Africa Gastritis Market Revenue (US$ Mn) Comparison by By Type (2016-2032)
- Figure 202: Middle East & Africa Gastritis Market Revenue (US$ Mn) Comparison by By Drug Type (2016-2032)
- Figure 203: Middle East & Africa Gastritis Market Revenue (US$ Mn) Comparison by By Route of Administration (2016-2032)
- Figure 204: Middle East & Africa Gastritis Market Revenue (US$ Mn) Comparison by By End-User (2016-2032)
- Figure 205: Middle East & Africa Gastritis Market Revenue (US$ Mn) Comparison by By Distribution Channel (2016-2032)
- Figure 206: Middle East & Africa Gastritis Market Y-o-Y Growth Rate Comparison by Country (2016-2032)
- Figure 207: Middle East & Africa Gastritis Market Y-o-Y Growth Rate Comparison by By Type (2016-2032)
- Figure 208: Middle East & Africa Gastritis Market Y-o-Y Growth Rate Comparison by By Drug Type (2016-2032)
- Figure 209: Middle East & Africa Gastritis Market Y-o-Y Growth Rate Comparison by By Route of Administration (2016-2032)
- Figure 210: Middle East & Africa Gastritis Market Y-o-Y Growth Rate Comparison by By End-User (2016-2032)
- Figure 211: Middle East & Africa Gastritis Market Y-o-Y Growth Rate Comparison by By Distribution Channel (2016-2032)
- Figure 212: Middle East & Africa Gastritis Market Share Comparison by Country (2016-2032)
- Figure 213: Middle East & Africa Gastritis Market Share Comparison by By Type (2016-2032)
- Figure 214: Middle East & Africa Gastritis Market Share Comparison by By Drug Type (2016-2032)
- Figure 215: Middle East & Africa Gastritis Market Share Comparison by By Route of Administration (2016-2032)
- Figure 216: Middle East & Africa Gastritis Market Share Comparison by By End-User (2016-2032)
- Figure 217: Middle East & Africa Gastritis Market Share Comparison by By Distribution Channel (2016-2032)
- List of Tables
- Table 1: Global Gastritis Market Comparison by By Type (2016-2032)
- Table 2: Global Gastritis Market Comparison by By Drug Type (2016-2032)
- Table 3: Global Gastritis Market Comparison by By Route of Administration (2016-2032)
- Table 4: Global Gastritis Market Comparison by By End-User (2016-2032)
- Table 5: Global Gastritis Market Comparison by By Distribution Channel (2016-2032)
- Table 6: Global Gastritis Market Revenue (US$ Mn) Comparison by Region (2016-2032)
- Table 7: Global Gastritis Market Revenue (US$ Mn) (2016-2032)
- Table 8: Global Gastritis Market Revenue (US$ Mn) Comparison by Region (2016-2032)
- Table 9: Global Gastritis Market Revenue (US$ Mn) Comparison by By Type (2016-2032)
- Table 10: Global Gastritis Market Revenue (US$ Mn) Comparison by By Drug Type (2016-2032)
- Table 11: Global Gastritis Market Revenue (US$ Mn) Comparison by By Route of Administration (2016-2032)
- Table 12: Global Gastritis Market Revenue (US$ Mn) Comparison by By End-User (2016-2032)
- Table 13: Global Gastritis Market Revenue (US$ Mn) Comparison by By Distribution Channel (2016-2032)
- Table 14: Global Gastritis Market Y-o-Y Growth Rate Comparison by Region (2016-2032)
- Table 15: Global Gastritis Market Y-o-Y Growth Rate Comparison by By Type (2016-2032)
- Table 16: Global Gastritis Market Y-o-Y Growth Rate Comparison by By Drug Type (2016-2032)
- Table 17: Global Gastritis Market Y-o-Y Growth Rate Comparison by By Route of Administration (2016-2032)
- Table 18: Global Gastritis Market Y-o-Y Growth Rate Comparison by By End-User (2016-2032)
- Table 19: Global Gastritis Market Y-o-Y Growth Rate Comparison by By Distribution Channel (2016-2032)
- Table 20: Global Gastritis Market Share Comparison by Region (2016-2032)
- Table 21: Global Gastritis Market Share Comparison by By Type (2016-2032)
- Table 22: Global Gastritis Market Share Comparison by By Drug Type (2016-2032)
- Table 23: Global Gastritis Market Share Comparison by By Route of Administration (2016-2032)
- Table 24: Global Gastritis Market Share Comparison by By End-User (2016-2032)
- Table 25: Global Gastritis Market Share Comparison by By Distribution Channel (2016-2032)
- Table 26: North America Gastritis Market Comparison by By Drug Type (2016-2032)
- Table 27: North America Gastritis Market Comparison by By Route of Administration (2016-2032)
- Table 28: North America Gastritis Market Comparison by By End-User (2016-2032)
- Table 29: North America Gastritis Market Comparison by By Distribution Channel (2016-2032)
- Table 30: North America Gastritis Market Revenue (US$ Mn) Comparison by Country (2016-2032)
- Table 31: North America Gastritis Market Revenue (US$ Mn) (2016-2032)
- Table 32: North America Gastritis Market Revenue (US$ Mn) Comparison by Country (2016-2032)
- Table 33: North America Gastritis Market Revenue (US$ Mn) Comparison by By Type (2016-2032)
- Table 34: North America Gastritis Market Revenue (US$ Mn) Comparison by By Drug Type (2016-2032)
- Table 35: North America Gastritis Market Revenue (US$ Mn) Comparison by By Route of Administration (2016-2032)
- Table 36: North America Gastritis Market Revenue (US$ Mn) Comparison by By End-User (2016-2032)
- Table 37: North America Gastritis Market Revenue (US$ Mn) Comparison by By Distribution Channel (2016-2032)
- Table 38: North America Gastritis Market Y-o-Y Growth Rate Comparison by Country (2016-2032)
- Table 39: North America Gastritis Market Y-o-Y Growth Rate Comparison by By Type (2016-2032)
- Table 40: North America Gastritis Market Y-o-Y Growth Rate Comparison by By Drug Type (2016-2032)
- Table 41: North America Gastritis Market Y-o-Y Growth Rate Comparison by By Route of Administration (2016-2032)
- Table 42: North America Gastritis Market Y-o-Y Growth Rate Comparison by By End-User (2016-2032)
- Table 43: North America Gastritis Market Y-o-Y Growth Rate Comparison by By Distribution Channel (2016-2032)
- Table 44: North America Gastritis Market Share Comparison by Country (2016-2032)
- Table 45: North America Gastritis Market Share Comparison by By Type (2016-2032)
- Table 46: North America Gastritis Market Share Comparison by By Drug Type (2016-2032)
- Table 47: North America Gastritis Market Share Comparison by By Route of Administration (2016-2032)
- Table 48: North America Gastritis Market Share Comparison by By End-User (2016-2032)
- Table 49: North America Gastritis Market Share Comparison by By Distribution Channel (2016-2032)
- Table 50: Western Europe Gastritis Market Comparison by By Type (2016-2032)
- Table 51: Western Europe Gastritis Market Comparison by By Drug Type (2016-2032)
- Table 52: Western Europe Gastritis Market Comparison by By Route of Administration (2016-2032)
- Table 53: Western Europe Gastritis Market Comparison by By End-User (2016-2032)
- Table 54: Western Europe Gastritis Market Comparison by By Distribution Channel (2016-2032)
- Table 55: Western Europe Gastritis Market Revenue (US$ Mn) Comparison by Country (2016-2032)
- Table 56: Western Europe Gastritis Market Revenue (US$ Mn) (2016-2032)
- Table 57: Western Europe Gastritis Market Revenue (US$ Mn) Comparison by Country (2016-2032)
- Table 58: Western Europe Gastritis Market Revenue (US$ Mn) Comparison by By Type (2016-2032)
- Table 59: Western Europe Gastritis Market Revenue (US$ Mn) Comparison by By Drug Type (2016-2032)
- Table 60: Western Europe Gastritis Market Revenue (US$ Mn) Comparison by By Route of Administration (2016-2032)
- Table 61: Western Europe Gastritis Market Revenue (US$ Mn) Comparison by By End-User (2016-2032)
- Table 62: Western Europe Gastritis Market Revenue (US$ Mn) Comparison by By Distribution Channel (2016-2032)
- Table 63: Western Europe Gastritis Market Y-o-Y Growth Rate Comparison by Country (2016-2032)
- Table 64: Western Europe Gastritis Market Y-o-Y Growth Rate Comparison by By Type (2016-2032)
- Table 65: Western Europe Gastritis Market Y-o-Y Growth Rate Comparison by By Drug Type (2016-2032)
- Table 66: Western Europe Gastritis Market Y-o-Y Growth Rate Comparison by By Route of Administration (2016-2032)
- Table 67: Western Europe Gastritis Market Y-o-Y Growth Rate Comparison by By End-User (2016-2032)
- Table 68: Western Europe Gastritis Market Y-o-Y Growth Rate Comparison by By Distribution Channel (2016-2032)
- Table 69: Western Europe Gastritis Market Share Comparison by Country (2016-2032)
- Table 70: Western Europe Gastritis Market Share Comparison by By Type (2016-2032)
- Table 71: Western Europe Gastritis Market Share Comparison by By Drug Type (2016-2032)
- Table 72: Western Europe Gastritis Market Share Comparison by By Route of Administration (2016-2032)
- Table 73: Western Europe Gastritis Market Share Comparison by By End-User (2016-2032)
- Table 74: Western Europe Gastritis Market Share Comparison by By Distribution Channel (2016-2032)
- Table 75: Eastern Europe Gastritis Market Comparison by By Type (2016-2032)
- Table 76: Eastern Europe Gastritis Market Comparison by By Drug Type (2016-2032)
- Table 77: Eastern Europe Gastritis Market Comparison by By Route of Administration (2016-2032)
- Table 78: Eastern Europe Gastritis Market Comparison by By End-User (2016-2032)
- Table 79: Eastern Europe Gastritis Market Comparison by By Distribution Channel (2016-2032)
- Table 80: Eastern Europe Gastritis Market Revenue (US$ Mn) Comparison by Country (2016-2032)
- Table 81: Eastern Europe Gastritis Market Revenue (US$ Mn) (2016-2032)
- Table 82: Eastern Europe Gastritis Market Revenue (US$ Mn) Comparison by Country (2016-2032)
- Table 83: Eastern Europe Gastritis Market Revenue (US$ Mn) Comparison by By Type (2016-2032)
- Table 84: Eastern Europe Gastritis Market Revenue (US$ Mn) Comparison by By Drug Type (2016-2032)
- Table 85: Eastern Europe Gastritis Market Revenue (US$ Mn) Comparison by By Route of Administration (2016-2032)
- Table 86: Eastern Europe Gastritis Market Revenue (US$ Mn) Comparison by By End-User (2016-2032)
- Table 87: Eastern Europe Gastritis Market Revenue (US$ Mn) Comparison by By Distribution Channel (2016-2032)
- Table 88: Eastern Europe Gastritis Market Y-o-Y Growth Rate Comparison by Country (2016-2032)
- Table 89: Eastern Europe Gastritis Market Y-o-Y Growth Rate Comparison by By Type (2016-2032)
- Table 90: Eastern Europe Gastritis Market Y-o-Y Growth Rate Comparison by By Drug Type (2016-2032)
- Table 91: Eastern Europe Gastritis Market Y-o-Y Growth Rate Comparison by By Route of Administration (2016-2032)
- Table 92: Eastern Europe Gastritis Market Y-o-Y Growth Rate Comparison by By End-User (2016-2032)
- Table 93: Eastern Europe Gastritis Market Y-o-Y Growth Rate Comparison by By Distribution Channel (2016-2032)
- Table 94: Eastern Europe Gastritis Market Share Comparison by Country (2016-2032)
- Table 95: Eastern Europe Gastritis Market Share Comparison by By Type (2016-2032)
- Table 96: Eastern Europe Gastritis Market Share Comparison by By Drug Type (2016-2032)
- Table 97: Eastern Europe Gastritis Market Share Comparison by By Route of Administration (2016-2032)
- Table 98: Eastern Europe Gastritis Market Share Comparison by By End-User (2016-2032)
- Table 99: Eastern Europe Gastritis Market Share Comparison by By Distribution Channel (2016-2032)
- Table 100: APAC Gastritis Market Comparison by By Type (2016-2032)
- Table 101: APAC Gastritis Market Comparison by By Drug Type (2016-2032)
- Table 102: APAC Gastritis Market Comparison by By Route of Administration (2016-2032)
- Table 103: APAC Gastritis Market Comparison by By End-User (2016-2032)
- Table 104: APAC Gastritis Market Comparison by By Distribution Channel (2016-2032)
- Table 105: APAC Gastritis Market Revenue (US$ Mn) Comparison by Country (2016-2032)
- Table 106: APAC Gastritis Market Revenue (US$ Mn) (2016-2032)
- Table 107: APAC Gastritis Market Revenue (US$ Mn) Comparison by Country (2016-2032)
- Table 108: APAC Gastritis Market Revenue (US$ Mn) Comparison by By Type (2016-2032)
- Table 109: APAC Gastritis Market Revenue (US$ Mn) Comparison by By Drug Type (2016-2032)
- Table 110: APAC Gastritis Market Revenue (US$ Mn) Comparison by By Route of Administration (2016-2032)
- Table 111: APAC Gastritis Market Revenue (US$ Mn) Comparison by By End-User (2016-2032)
- Table 112: APAC Gastritis Market Revenue (US$ Mn) Comparison by By Distribution Channel (2016-2032)
- Table 113: APAC Gastritis Market Y-o-Y Growth Rate Comparison by Country (2016-2032)
- Table 114: APAC Gastritis Market Y-o-Y Growth Rate Comparison by By Type (2016-2032)
- Table 115: APAC Gastritis Market Y-o-Y Growth Rate Comparison by By Drug Type (2016-2032)
- Table 116: APAC Gastritis Market Y-o-Y Growth Rate Comparison by By Route of Administration (2016-2032)
- Table 117: APAC Gastritis Market Y-o-Y Growth Rate Comparison by By End-User (2016-2032)
- Table 118: APAC Gastritis Market Y-o-Y Growth Rate Comparison by By Distribution Channel (2016-2032)
- Table 119: APAC Gastritis Market Share Comparison by Country (2016-2032)
- Table 120: APAC Gastritis Market Share Comparison by By Type (2016-2032)
- Table 121: APAC Gastritis Market Share Comparison by By Drug Type (2016-2032)
- Table 122: APAC Gastritis Market Share Comparison by By Route of Administration (2016-2032)
- Table 123: APAC Gastritis Market Share Comparison by By End-User (2016-2032)
- Table 124: APAC Gastritis Market Share Comparison by By Distribution Channel (2016-2032)
- Table 125: Latin America Gastritis Market Comparison by By Type (2016-2032)
- Table 126: Latin America Gastritis Market Comparison by By Drug Type (2016-2032)
- Table 127: Latin America Gastritis Market Comparison by By Route of Administration (2016-2032)
- Table 128: Latin America Gastritis Market Comparison by By End-User (2016-2032)
- Table 129: Latin America Gastritis Market Comparison by By Distribution Channel (2016-2032)
- Table 130: Latin America Gastritis Market Revenue (US$ Mn) Comparison by Country (2016-2032)
- Table 131: Latin America Gastritis Market Revenue (US$ Mn) (2016-2032)
- Table 132: Latin America Gastritis Market Revenue (US$ Mn) Comparison by Country (2016-2032)
- Table 133: Latin America Gastritis Market Revenue (US$ Mn) Comparison by By Type (2016-2032)
- Table 134: Latin America Gastritis Market Revenue (US$ Mn) Comparison by By Drug Type (2016-2032)
- Table 135: Latin America Gastritis Market Revenue (US$ Mn) Comparison by By Route of Administration (2016-2032)
- Table 136: Latin America Gastritis Market Revenue (US$ Mn) Comparison by By End-User (2016-2032)
- Table 137: Latin America Gastritis Market Revenue (US$ Mn) Comparison by By Distribution Channel (2016-2032)
- Table 138: Latin America Gastritis Market Y-o-Y Growth Rate Comparison by Country (2016-2032)
- Table 139: Latin America Gastritis Market Y-o-Y Growth Rate Comparison by By Type (2016-2032)
- Table 140: Latin America Gastritis Market Y-o-Y Growth Rate Comparison by By Drug Type (2016-2032)
- Table 141: Latin America Gastritis Market Y-o-Y Growth Rate Comparison by By Route of Administration (2016-2032)
- Table 142: Latin America Gastritis Market Y-o-Y Growth Rate Comparison by By End-User (2016-2032)
- Table 143: Latin America Gastritis Market Y-o-Y Growth Rate Comparison by By Distribution Channel (2016-2032)
- Table 144: Latin America Gastritis Market Share Comparison by Country (2016-2032)
- Table 145: Latin America Gastritis Market Share Comparison by By Type (2016-2032)
- Table 146: Latin America Gastritis Market Share Comparison by By Drug Type (2016-2032)
- Table 147: Latin America Gastritis Market Share Comparison by By Route of Administration (2016-2032)
- Table 148: Latin America Gastritis Market Share Comparison by By End-User (2016-2032)
- Table 149: Latin America Gastritis Market Share Comparison by By Distribution Channel (2016-2032)
- Table 150: Middle East & Africa Gastritis Market Comparison by By Type (2016-2032)
- Table 151: Middle East & Africa Gastritis Market Comparison by By Drug Type (2016-2032)
- Table 152: Middle East & Africa Gastritis Market Comparison by By Route of Administration (2016-2032)
- Table 153: Middle East & Africa Gastritis Market Comparison by By End-User (2016-2032)
- Table 154: Middle East & Africa Gastritis Market Comparison by By Distribution Channel (2016-2032)
- Table 155: Middle East & Africa Gastritis Market Revenue (US$ Mn) Comparison by Country (2016-2032)
- Table 156: Middle East & Africa Gastritis Market Revenue (US$ Mn) (2016-2032)
- Table 157: Middle East & Africa Gastritis Market Revenue (US$ Mn) Comparison by Country (2016-2032)
- Table 158: Middle East & Africa Gastritis Market Revenue (US$ Mn) Comparison by By Type (2016-2032)
- Table 159: Middle East & Africa Gastritis Market Revenue (US$ Mn) Comparison by By Drug Type (2016-2032)
- Table 160: Middle East & Africa Gastritis Market Revenue (US$ Mn) Comparison by By Route of Administration (2016-2032)
- Table 161: Middle East & Africa Gastritis Market Revenue (US$ Mn) Comparison by By End-User (2016-2032)
- Table 162: Middle East & Africa Gastritis Market Revenue (US$ Mn) Comparison by By Distribution Channel (2016-2032)
- Table 163: Middle East & Africa Gastritis Market Y-o-Y Growth Rate Comparison by Country (2016-2032)
- Table 164: Middle East & Africa Gastritis Market Y-o-Y Growth Rate Comparison by By Type (2016-2032)
- Table 165: Middle East & Africa Gastritis Market Y-o-Y Growth Rate Comparison by By Drug Type (2016-2032)
- Table 166: Middle East & Africa Gastritis Market Y-o-Y Growth Rate Comparison by By Route of Administration (2016-2032)
- Table 167: Middle East & Africa Gastritis Market Y-o-Y Growth Rate Comparison by By End-User (2016-2032)
- Table 168: Middle East & Africa Gastritis Market Y-o-Y Growth Rate Comparison by By Distribution Channel (2016-2032)
- Table 169: Middle East & Africa Gastritis Market Share Comparison by Country (2016-2032)
- Table 170: Middle East & Africa Gastritis Market Share Comparison by By Type (2016-2032)
- Table 171: Middle East & Africa Gastritis Market Share Comparison by By Drug Type (2016-2032)
- Table 172: Middle East & Africa Gastritis Market Share Comparison by By Route of Administration (2016-2032)
- Table 173: Middle East & Africa Gastritis Market Share Comparison by By End-User (2016-2032)
- Table 174: Middle East & Africa Gastritis Market Share Comparison by By Distribution Channel (2016-2032)
- 1. Executive Summary
-
- AstraZeneca PLC
- Takeda Pharmaceutical Company Limited
- Pfizer Inc.
- AbbVie Inc.
- Bayer AG
- Eli Lilly and Company
- Novartis AG
- Merck & Co., Inc.
- Sanofi S.A.
- Johnson & Johnson
- Bio-Rad Laboratories, Inc.
- F. Hoffmann-La Roche Ltd
- Siemens Healthineers AG
- Other Key Players
Our Clients


View Our Licence Options
