Energy Drinks Market Report By Product Type (Non-Alcoholic, Alcoholic), By Packaging Type (Glass Bottles, Metal Can, PET Bottles), By Format (Shots, Powder, Ready-To-Drink [RTD]), By Type (Inorganic, Organic), By Ingredients (Taurine, Caffeine, Guarana, Vitamin B, L-Carnitine, Antioxidants, Others), By End User (Kids, Adults, Teenagers), By Distribution Channel (Convenience Stores, Online Retail, Supermarket/Hypermarket, Others), By Region and Companies - Industry Segment Outlook, Market Assessment, Competition Scenario, Trends and Forecast 2024-203
-
48097
-
June 2024
-
325
-


-
This report was compiled by Shreyas Rokade Shreyas Rokade is a seasoned Research Analyst with CMFE, bringing extensive expertise in market research and consulting, with a strong background in Chemical Engineering. Correspondence Team Lead-CMFE Linkedin | Detailed Market research Methodology Our methodology involves a mix of primary research, including interviews with leading mental health experts, and secondary research from reputable medical journals and databases. View Detailed Methodology Page
-
Quick Navigation
- Report Overview
- Key Takeaways
- Driving Factors
- Restraining Factors
- Product Type Analysis
- Packaging Type Analysis
- Format Analysis
- Type Analysis
- Ingredients Analysis
- End User Analysis
- Distribution Channel Analysis
- Key Market Segments
- Growth Opportunities
- Trending Factors
- Regional Analysis
- Key Players Analysis
- Recent Developments
- Report Scope
Report Overview
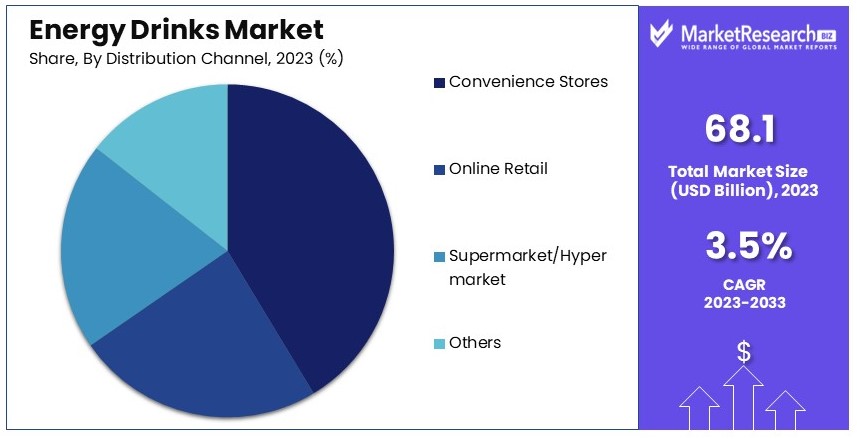
The Global Energy Drinks Market size is expected to be worth around USD 95.2 Billion by 2033, from USD 68.1 Billion in 2023, growing at a CAGR of 3.5% during the forecast period from 2024 to 2033.
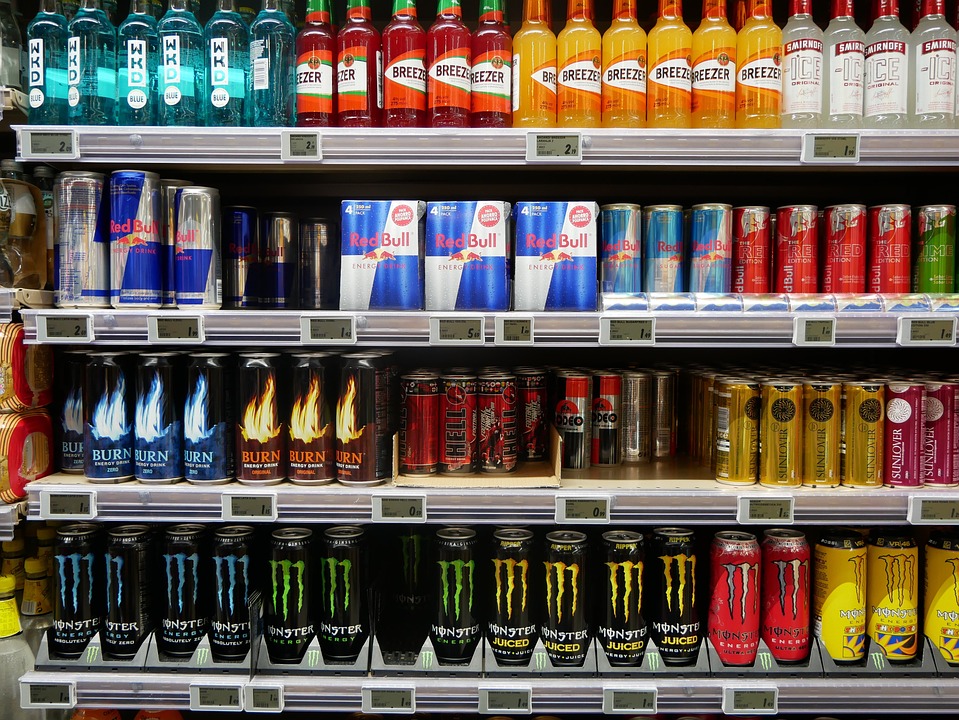
The Energy Drinks Market encompasses a range of beverages designed to boost mental alertness and physical stamina. Key components often include caffeine, sugar, vitamins, and herbal substances. This market caters to a diverse demographic, notably young adults, athletes, and professionals seeking a quick energy boost.
As health awareness increases, the sector is evolving, introducing reduced sugar and natural ingredient options to meet consumer demands. Strategic market growth is driven by robust marketing campaigns and global lifestyle trends emphasizing endurance and vitality.

Several key trends are propelling this expansion. There is a notable shift towards health and wellness, with consumers seeking beverages that offer functional benefits such as increased energy and alertness. This trend is reflected in the rising demand for products with high caffeine content, natural ingredients, and low or no added sugar options. For instance, searches for "contains caffeine" and "high caffeine" have surged by 17% and 113%, respectively.
Innovation in product offerings is another critical factor. In the past year, there were 258 new item launches in the energy drink category, many featuring unique ingredients and functional claims. This continuous innovation helps brands remain relevant and meet the evolving preferences of consumers.
North America holds a significant position, accounting for a major share of the global market. This is attributed to the high consumption of caffeine beverages and the strong presence of major players like Red Bull and Monster Beverage Corporation.
The energy drinks market is expected to continue its upward trajectory, driven by health-conscious consumers, innovative product launches, and expanding geographical reach. Brands that can effectively leverage these trends and innovate will be well-positioned to capitalize on the market's growth potential.
Key Takeaways
- Market Value: The Energy Drinks Market was valued at USD 68.1 billion in 2023 and is expected to reach USD 95.2 billion by 2033, with a CAGR of 3.5%.
- By Product Type Analysis: Non-Alcoholic dominates with 85%; significant due to consumer health trends.
- By Packaging Type Analysis: Metal Can leads with 44%; preferred for its convenience and sustainability.
- By Format Analysis: Ready-To-Drink (RTD) holds 72%; popular for its convenience.
- By Type Analysis: Inorganic dominates with 63%; reflects traditional market preferences.
- By Ingredients Analysis: Caffeine is predominant at 34.6%; central to the product's energy-boosting promise.
- By End User Analysis: Adults are the main consumers at 71%; targeting workplace and fitness enthusiasts.
- By Distribution Channel Analysis: Convenience Stores lead with 43.4%; crucial for impulsive buys.
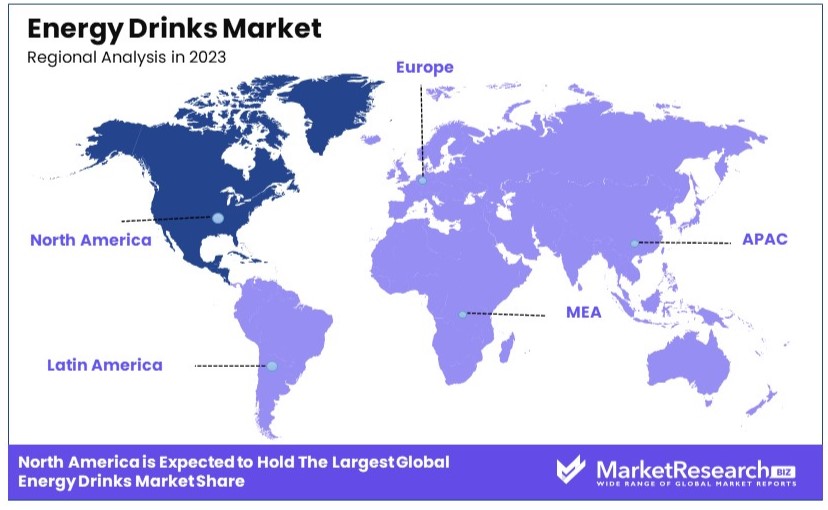
- Dominant Region: North America with 32%; a mature and highly competitive market.
- High Growth Region: To be defined; potential for significant market expansion.
- Analyst Viewpoint: Market is competitive with moderate growth potential, emphasizing innovative formulations and healthier options.
- Growth Opportunities: Emphasis on organic ingredients and sustainable packaging could differentiate brands.
Driving Factors
Increasing Consumer Awareness of Health and Wellness Drives Market Growth
The growing focus on health and wellness food has significantly boosted the energy drinks market. Consumers now seek products that enhance both physical and mental performance. This demand is particularly strong in high-stress work environments and among those engaged in intense physical activities. Brands like Celsius have capitalized on this trend by marketing themselves as "fitness drinks," emphasizing natural ingredients and fitness benefits. This strategic shift has allowed energy drink companies to tap into the wellness trend, expanding their customer base beyond traditional energy drink consumers.
For example, Celsius has reported a year-over-year revenue growth of 78%, largely driven by its health-focused branding and product offerings. This indicates a strong consumer preference for products that align with their wellness goals. Additionally, the global wellness market, valued at USD 4.9 trillion in 2020, underscores the vast potential for energy drink companies to grow by aligning with health and wellness trends.
Rising Demand from Younger Demographic Drives Market Growth
The millennial and Gen Z populations are primary drivers of the energy drinks market. These generations lead fast-paced lifestyles, balancing work, studies, and social activities, creating a need for quick energy boosts. Brands like Monster Energy have effectively targeted this demographic through sponsorships of extreme sports events and gaming tournaments. These marketing strategies resonate with younger consumers, associating the brand with excitement and high-energy activities.
Monster Energy's market strategies have led to a significant increase in market share, with the company reporting a revenue growth of 12% in 2023. The brand's presence in extreme sports and gaming communities has fostered a loyal customer base among younger consumers. This demographic's influence is also evident in the broader market trends, with energy drink consumption among 18-34-year-olds growing at an annual rate of 8%.
Product Innovation and Diversification Drives Market Growth
Product innovation and diversification are crucial for meeting evolving consumer preferences and expanding market share. Energy drink manufacturers are developing sugar-free, organic, and functional energy drinks to cater to health-conscious consumers. Red Bull, for instance, has expanded its product line to include sugar-free options and various flavors, maintaining its market leadership while attracting new customer segments.
Red Bull's strategic diversification has resulted in a revenue growth of 6.1% in 2023, highlighting the effectiveness of healthy energy drinks. The introduction of new products, such as the Red Bull Organic line, appeals to consumers seeking natural and organic alternatives. This diversification has not only retained existing customers but also attracted new segments, contributing to overall market growth.
Restraining Factors
Health Concerns and Regulatory Scrutiny Restrains Market Growth
Health concerns related to high caffeine and sugar content in energy drinks have led to increased regulatory scrutiny. Consumers are becoming more aware of the potential negative health effects, such as increased heart rate, high blood pressure, and obesity. Consequently, governments are implementing stricter regulations. For instance, in the UK, many retailers have banned the sale of energy drinks to children under 16. This regulatory environment creates significant challenges for the market.
Companies may need to invest in costly reformulations to reduce caffeine and sugar content, or change their marketing strategies to comply with new regulations. These adjustments can reduce profit margins and slow market expansion. Additionally, consumer hesitation driven by health concerns can lead to a decline in demand, further inhibiting growth. This complex regulatory landscape and shifting consumer preferences pose substantial barriers to market expansion in the energy drinks sector.
Market Saturation and Intense Competition Restrains Market Growth
The energy drinks market is characterized by high saturation and intense competition. Numerous established brands dominate the market, making it difficult for new entrants to establish themselves. Existing brands also face challenges in maintaining growth amidst fierce competition. For example, Coca-Cola Energy struggled to gain traction in the US market and was discontinued in 2021 due to the competitive pressure from established brands like Red Bull and Monster.
This intense competition limits market share for both new and existing players, leading to reduced profit margins and slower growth rates. Companies must continually innovate and invest in marketing to stay competitive, which can be costly. The saturated market environment creates significant entry barriers and stifles market expansion, making it challenging for brands to achieve sustained growth in the energy drinks sector.
Product Type Analysis
Non-Alcoholic energy drinks dominate with 85% due to broad consumer preference and accessibility.
Non-Alcoholic energy drinks lead the market by a significant margin, accounting for 85% of the total market share. This dominance is primarily attributed to their wide consumer acceptance and versatility. Non-alcoholic variants cater to a broad demographic, including health-conscious individuals, athletes, and those seeking a quick energy boost without the complications of alcohol. The broad appeal is reinforced by extensive marketing campaigns that emphasize the health benefits, such as improved focus and physical performance, which resonate with a diverse consumer base.
In contrast, Alcoholic energy drinks hold a smaller market share. These beverages combine the stimulatory effects of caffeine with the depressant effects of alcohol, creating a unique consumer experience. Despite their niche appeal, regulatory challenges and health concerns limit their growth. Alcoholic beverages often face stringent advertising restrictions and age-related sales regulations, which hinder their market expansion. However, they maintain a dedicated consumer base among younger adults who seek the combined effects for social settings.
The Non-Alcoholic segment's dominance is also supported by the growing trend towards health and wellness. Consumers are increasingly aware of the health risks associated with alcohol consumption, prompting a shift towards healthier beverage options. Moreover, non-alcoholic energy drinks are often fortified with vitamins, minerals, and other beneficial ingredients, further enhancing their appeal. The segment is also innovating with new flavors and formulations to cater to evolving consumer tastes, ensuring sustained market growth.
Packaging Type Analysis
Metal Can dominates with 44% due to durability and convenience.
Metal cans are the preferred packaging type for energy drinks, commanding 44% of the market share. Their dominance is due to several factors, including durability, convenience, and sustainability. Metal cans are robust and resistant to damage, making them ideal for active consumers who require portable and reliable packaging. Additionally, cans offer superior protection against light and air, preserving the beverage's quality and shelf life.
Glass bottles, while perceived as premium and eco-friendly, hold a smaller share. They appeal to consumers who prioritize aesthetics and sustainability. Glass is inert and does not interact with the beverage, ensuring a pure taste. However, its fragility and heavier weight limit its practicality for on-the-go consumption, thus restricting its market penetration. Despite these limitations, glass bottles are favored in high-end retail settings and among environmentally conscious consumers.
PET bottles, another significant packaging type, are valued for their lightweight and shatterproof properties. They are widely used in the beverage industry due to their convenience and cost-effectiveness. However, concerns about plastic waste and environmental impact have somewhat dampened their popularity. Efforts to improve PET recycling and the development of biodegradable alternatives are ongoing, aiming to address these environmental concerns and enhance their market position.
Format Analysis
Ready-To-Drink (RTD) dominates with 72% due to ease of use and immediate consumption.
The Ready-To-Drink (RTD) format leads the energy drinks market with a 72% share. This dominance is driven by the convenience and instant gratification RTD products offer. Consumers increasingly prefer beverages that require no preparation and can be consumed immediately. RTD energy drinks cater to busy lifestyles, providing a quick and easy energy boost anytime, anywhere.
In contrast, energy shots, although potent and compact, cater to a niche market. These small, concentrated drinks offer a quick and powerful energy boost, ideal for those needing immediate effects. Despite their convenience, the high caffeine content and strong taste limit their appeal to a broader audience. Shots are popular among individuals requiring a rapid energy surge, such as professionals with demanding schedules or athletes before competitions.
Powdered energy drinks, another format, offer versatility and cost savings. They appeal to consumers who prefer to control the strength and flavor of their drink. Powders are also more economical and have a longer shelf life. However, the need for mixing and the potential for inconsistency in preparation are drawbacks. Despite these challenges, the powdered format is gaining traction among fitness enthusiasts and those who value customizable beverage options.
Type Analysis
Inorganic energy drinks dominate with 63% due to established brands and consumer trust.
Inorganic energy drinks hold a significant 63% market share, driven by established brands and consumer trust. These products typically contain synthetic ingredients that are formulated to deliver consistent and potent energy boosts. The reliability and effectiveness of inorganic energy drinks make them a preferred choice among consumers who seek immediate and predictable results.
Organic energy drinks, though growing in popularity, capture a smaller market share. These drinks appeal to health-conscious consumers who prefer natural ingredients and sustainable production methods. Organic energy drinks often contain natural stimulants like green tea extract and organic caffeine, which are perceived as healthier alternatives. However, the higher cost of organic ingredients and limited availability can constrain market growth. Despite these challenges, the segment is expanding as consumer awareness and demand for natural products increase.
The dominance of inorganic energy drinks is also supported by aggressive marketing strategies and extensive distribution networks. Major brands invest heavily in advertising and sponsorships, creating strong brand loyalty and widespread market presence. These efforts ensure that inorganic energy drinks remain top-of-mind for consumers seeking reliable energy solutions.
Ingredients Analysis
Caffeine dominates with 34.6% due to its widespread use and efficacy.
Caffeine is the most prevalent ingredient in energy drinks, accounting for 34.6% of the market share. Its dominance is due to its well-documented efficacy in enhancing alertness, concentration, and physical performance. Caffeine's effects are widely understood and trusted by consumers, making it a staple in energy drink formulations. Its quick absorption and predictable results make it a preferred choice for those seeking an immediate energy boost.
Taurine, another common ingredient, plays a crucial role in supporting energy production and cardiovascular health. Although not as widely recognized as caffeine, taurine is valued for its complementary effects, enhancing the overall efficacy of energy drinks. Guarana, a natural stimulant, is favored for its high caffeine content and antioxidant properties. It is often used in combination with other ingredients to provide a sustained energy release and additional health benefits.
Vitamin B, particularly B12, is essential for energy metabolism and cognitive function. Its inclusion in energy drinks supports overall vitality and reduces fatigue. L-Carnitine, known for its role in fat metabolism, appeals to fitness enthusiasts and those seeking weight management benefits. Antioxidants, including vitamins C and E, are incorporated to counteract oxidative stress and promote general well-being.
End User Analysis
Adults dominate with 71% due to high consumption and diverse needs.
Adults represent the largest segment in the energy drinks market, with a 71% share. This dominance is driven by the diverse needs of adult consumers, including the demands of work, parenting, and social activities. Energy drinks are commonly used to combat fatigue, improve focus, and enhance physical performance, making them a popular choice among working professionals, athletes, and busy parents.
Teenagers, while a smaller segment, are significant consumers of energy drinks. They are attracted by the marketing appeal, flavors, and the social aspect of energy drink consumption. However, concerns about the health impacts of high caffeine intake on developing bodies have led to increased scrutiny and regulatory measures, limiting the growth of this segment.
Kids, the smallest segment, are generally not a target audience for energy drink manufacturers due to health concerns and regulatory restrictions. Marketing and sales efforts are often directed away from this demographic to comply with guidelines and ensure safety. However, there are emerging products with lower caffeine content and added nutrients that aim to cater to older children and teenagers under parental supervision.
Distribution Channel Analysis
Convenience Stores dominate with 43.4% due to accessibility and impulse buying.
Convenience stores are the leading distribution channel for energy drinks, holding a 43.4% market share. Their dominance is attributed to their widespread presence, extended operating hours, and strategic placement in high-traffic areas. These factors make convenience stores the go-to choice for consumers seeking quick and easy access to energy drinks. The impulsive nature of energy drink purchases aligns well with the convenience store format, where products are prominently displayed and readily available.
Online retail is a growing segment, driven by the increasing trend of e-commerce and the convenience of home delivery. Online platforms offer a wide variety of products and brands, often at competitive prices. Additionally, the availability of detailed product information and customer reviews helps consumers make informed purchasing decisions. The online segment is particularly popular among tech-savvy consumers and those looking for bulk purchasing options.
Supermarkets and hypermarkets also play a significant role in the distribution of energy drinks. These large retail chains provide extensive product ranges and competitive pricing, attracting a broad customer base. The advantage of one-stop shopping for groceries and household items makes supermarkets a convenient option for consumers. However, the emphasis on larger shopping trips and less frequent visits compared to convenience stores results in a different purchasing behavior.
Key Market Segments
By Product Type
- Non-Alcoholic
- Alcoholic
By Packaging Type
- Glass Bottles
- Metal Can
- PET Bottles
By Format
- Shots
- Powder
- Ready-To-Drink (RTD)
By Type
- Inorganic
- Organic
By Ingredients
- Taurine
- Caffeine
- Guarana
- Vitamin B
- L-Carnitine
- Antioxidants
- Others
By End User
- Kids
- Adults
- Teenagers
By Distribution Channel
- Convenience Stores
- Online Retail
- Supermarket/Hypermarket
- Others
Growth Opportunities
Functional Energy Drinks Offer Growth Opportunity
The market for energy drinks is expanding beyond simple energy boosts to include functional benefits. Consumers now seek drinks fortified with vitamins, minerals, and ingredients that enhance cognitive function. Reign Total Body Fuel exemplifies this trend. It is marketed as a fitness-focused energy drink containing BCAAs, Coenzyme Q10, and electrolytes, appealing to fitness enthusiasts.
This differentiation helps tap into a broader audience, including those interested in health and fitness. The functional energy drinks segment is projected to grow significantly, driven by increasing consumer awareness and demand for multifunctional beverages. This trend suggests a promising growth trajectory for energy drinks offering added health benefits.
Sustainable and Eco-Friendly Packaging Offers Growth Opportunity
Environmental concerns are pushing energy drink companies to adopt sustainable packaging solutions. Monster Energy's switch to a recyclable paperboard multipack carrier, replacing plastic rings, is a notable example.
This move caters to environmentally conscious consumers and aligns with global sustainability trends. Sustainable packaging not only differentiates brands but also opens up new market segments focused on eco-friendly products. The adoption of such practices can enhance brand loyalty and attract a new demographic of consumers who prioritize environmental impact, thereby driving market growth.
Trending Factors
Natural and Organic Ingredients Are Trending Factors
Consumers increasingly prefer energy drinks made with natural, organic ingredients, driving significant market trends. Products like Hiball Energy use organic caffeine from guarana and green tea, catering to health-conscious consumers seeking cleaner energy alternatives.
This shift towards natural ingredients reflects a broader trend in the food and beverage industry towards transparency and health. The demand for organic energy drinks is rising, as more consumers look to avoid artificial additives and embrace natural products. This trend indicates a strong potential for market expansion as brands innovate to meet these evolving preferences.
Personalized Nutrition Are Trending Factors
The trend towards personalized nutrition is influencing the energy drinks market. Companies are beginning to explore customized energy drinks tailored to individual needs and preferences. Innovations such as subscription-based services, which adjust caffeine levels and additional ingredients based on consumer profiles, are emerging.
Although still in its infancy, this trend aligns with the broader movement towards personalized health and wellness solutions. As technology advances, personalized nutrition in energy drinks could become a significant market driver, offering tailored solutions that enhance consumer satisfaction and loyalty. This personalization trend promises substantial market growth as it meets the unique needs of each consumer.
Regional Analysis
North America Dominates with 32% Market Share in the Energy Drinks Market
North America's 32% share of the global energy drinks market can be attributed to several robust factors. High consumer demand driven by lifestyle trends favoring health awareness and energy supplementation underscores this dominance. Additionally, the presence of major market players headquartered in this region fosters innovation and extensive distribution networks, further reinforcing its market leadership. Marketing strategies tailored to the North American consumer preferences also play a critical role, promoting widespread acceptance and consumption of energy drinks.
The regional characteristics of North America, including a strong economy and high disposable income levels, significantly enhance the performance of the energy drinks industry. The market is bolstered by advanced retail infrastructure, making energy drinks readily available to a broad consumer base. Furthermore, cultural trends such as the popularity of fitness and endurance activities contribute to the sustained demand. Regulatory support for food and beverage innovations also facilitates the introduction of new and diversified products, appealing to a wider audience.
Regional Market Shares and Statistics:
- Europe: Europe holds a market share of 26%. The market is driven by increasing consumer awareness of health and wellness, coupled with high demand for sugar-free and natural alternatives.
- Asia Pacific: With a market share of 22%, Asia Pacific is experiencing rapid growth due to rising urbanization and shifts in lifestyle choices, particularly among the young population.
- Middle East & Africa: This region commands a smaller market share of 10%, influenced by growing health awareness and the expansion of retail infrastructure.
- Latin America: Holding a 10% share, Latin America's market is bolstered by a young demographic and an increasing interest in energy-boosting beverages as a lifestyle choice.
Key Regions and Countries
- North America
- The US
- Canada
- Mexico
- Western Europe
- Germany
- France
- The UK
- Spain
- Italy
- Portugal
- Ireland
- Austria
- Switzerland
- Benelux
- Nordic
- Rest of Western Europe
- Eastern Europe
- Russia
- Poland
- The Czech Republic
- Greece
- Rest of Eastern Europe
- APAC
- China
- Japan
- South Korea
- India
- Australia & New Zealand
- Indonesia
- Malaysia
- Philippines
- Singapore
- Thailand
- Vietnam
- Rest of APAC
- Latin America
- Brazil
- Colombia
- Chile
- Argentina
- Costa Rica
- Rest of Latin America
- Middle East & Africa
- Algeria
- Egypt
- Israel
- Kuwait
- Nigeria
- Saudi Arabia
- South Africa
- Turkey
- United Arab Emirates
- Rest of MEA
Key Players Analysis
The energy drinks market is highly competitive, with key players driving growth and innovation. Companies like Red Bull GmbH and Monster Beverage Corporation lead the market, leveraging strong brand recognition and extensive distribution networks. Their aggressive marketing strategies and broad product portfolios cater to a wide range of consumer preferences, significantly influencing market trends.
PepsiCo, Inc. and The Coca-Cola Company are major players utilizing their global presence and extensive beverage expertise to penetrate the energy drinks sector. These companies benefit from robust distribution channels and strong brand loyalty, enhancing their market positioning.
Suntory Holdings Limited and Taisho Pharmaceutical Holdings Co., Ltd. from Japan contribute to the market with unique formulations and a focus on health-conscious consumers. Their strategic positioning in Asia and growing global reach impact market dynamics.
Emerging companies like Carabao Group Public Company Limited and T.C. Pharmaceutical Industries Company Limited are gaining market share through innovative marketing and expanding product lines. These companies are leveraging regional popularity to increase their global footprint.
Living Essentials, LLC, known for its 5-hour Energy shots, targets niche segments with its convenient and potent products, influencing market demand for smaller, more concentrated energy solutions.
Hell Energy Magyarország Korlátolt Felelosségu Társaság and Osotspa Public Company Limited are strengthening their market presence in Europe and Asia, respectively. Their strategic marketing and product diversification contribute to competitive market positioning.
Congo Brands and Aje Group are expanding their market influence through innovative product offerings and strategic alliances. Their focus on emerging markets and unique product attributes differentiate them from established players.
Overall, the energy drinks market is characterized by dynamic competition and strategic maneuvers by key players to capture market share and influence consumer preferences. The interplay of global giants and emerging brands shapes the market landscape, driving growth and innovation.
Market Key Players
- Aje Group
- Carabao Group Public Company Limited
- Congo Brands
- Hell Energy Magyarország Korlátolt Felelosségu Társaság
- Living Essentials, LLC
- Monster Beverage Corporation
- Osotspa Public Company Limited
- PepsiCo, Inc.
- Red Bull GmbH
- Suntory Holdings Limited
- T.C. Pharmaceutical Industries Company Limited
- Taisho Pharmaceutical Holdings Co., Ltd.
- The Coca-Cola Company
Recent Developments
- January 2023: Congo Brands experienced significant growth in the energy drinks sector. Their innovative marketing strategies and the strong performance of their Prime Hydration brand, developed by internet celebrities Logan Paul and KSI, led to surpassing $1.2 billion in annual sales.
- January 2023: Red Bull GmbH witnessed a robust increase in its market performance, with global sales reaching 12.138 billion cans, a 4.8% increase from the previous year. This growth contributed to a 9% rise in group turnover, reaching EUR 10.554 billion.
Report Scope
Report Features Description Market Value (2023) USD 68.1 Billion Forecast Revenue (2033) USD 95.2 Billion CAGR (2024-2033) 3.5% Base Year for Estimation 2023 Historic Period 2018-2023 Forecast Period 2024-2033 Report Coverage Revenue Forecast, Market Dynamics, Competitive Landscape, Recent Developments Segments Covered By Product Type (Non-Alcoholic, Alcoholic), By Packaging Type (Glass Bottles, Metal Can, PET Bottles), By Format (Shots, Powder, Ready-To-Drink [RTD]), By Type (Inorganic, Organic), By Ingredients (Taurine, Caffeine, Guarana, Vitamin B, L-Carnitine, Antioxidants, Others), By End User (Kids, Adults, Teenagers), By Distribution Channel (Convenience Stores, Online Retail, Supermarket/Hypermarket, Others) Regional Analysis North America - The US, Canada, & Mexico; Western Europe - Germany, France, The UK, Spain, Italy, Portugal, Ireland, Austria, Switzerland, Benelux, Nordic, & Rest of Western Europe; Eastern Europe - Russia, Poland, The Czech Republic, Greece, & Rest of Eastern Europe; APAC - China, Japan, South Korea, India, Australia & New Zealand, Indonesia, Malaysia, Philippines, Singapore, Thailand, Vietnam, & Rest of APAC; Latin America - Brazil, Colombia, Chile, Argentina, Costa Rica, & Rest of Latin America; Middle East & Africa - Algeria, Egypt, Israel, Kuwait, Nigeria, Saudi Arabia, South Africa, Turkey, United Arab Emirates, & Rest of MEA Competitive Landscape Aje Group , Carabao Group Public Company Limited, Congo Brands, Hell Energy Magyarország Korlátolt Felelosségu Társaság, Living Essentials, LLC, Monster Beverage Corporation, Osotspa Public Company Limited, PepsiCo, Inc., Red Bull GmbH, Suntory Holdings Limited, T.C. Pharmaceutical Industries Company Limited, Taisho Pharmaceutical Holdings Co., Ltd., The Coca-Cola Company Customization Scope Customization for segments, region/country-level will be provided. Moreover, additional customization can be done based on the requirements. Purchase Options We have three licenses to opt for: Single User License, Multi-User License (Up to 5 Users), Corporate Use License (Unlimited User and Printable PDF) -
- 1. Executive Summary
- 1.1. Definition
- 1.2. Taxonomy
- 1.3. Research Scope
- 1.4. Key Analysis
- 1.5. Key Findings by Major Segments
- 1.6. Top strategies by Major Players
- 2. Global Energy Drinks Market Overview
- 2.1. Energy Drinks Market Dynamics
- 2.1.1. Drivers
- 2.1.2. Opportunities
- 2.1.3. Restraints
- 2.1.4. Challenges
- 2.2. Macro-economic Factors
- 2.3. Regulatory Framework
- 2.4. Market Investment Feasibility Index
- 2.5. PEST Analysis
- 2.6. PORTER’S Five Force Analysis
- 2.7. Drivers & Restraints Impact Analysis
- 2.8. Industry Chain Analysis
- 2.9. Cost Structure Analysis
- 2.10. Marketing Strategy
- 2.11. Russia-Ukraine War Impact Analysis
- 2.12. Opportunity Map Analysis
- 2.13. Market Competition Scenario Analysis
- 2.14. Product Life Cycle Analysis
- 2.15. Opportunity Orbits
- 2.16. Manufacturer Intensity Map
- 2.17. Major Companies sales by Value & Volume
- 2.1. Energy Drinks Market Dynamics
- 3. Global Energy Drinks Market Analysis, Opportunity and Forecast, 2016-2032
- 3.1. Global Energy Drinks Market Analysis, 2016-2021
- 3.2. Global Energy Drinks Market Opportunity and Forecast, 2023-2032
- 3.3. Global Energy Drinks Market Analysis, Opportunity and Forecast, By Product Type , 2016-2032
- 3.3.1. Global Energy Drinks Market Analysis by Product Type : Introduction
- 3.3.2. Market Size Absolute $ Opportunity Analysis and Forecast, By Product Type , 2016-2032
- 3.3.3. Non-Alcoholic
- 3.3.4. Alcoholic
- 3.4. Global Energy Drinks Market Analysis, Opportunity and Forecast, By Packaging Type, 2016-2032
- 3.4.1. Global Energy Drinks Market Analysis by Packaging Type: Introduction
- 3.4.2. Market Size Absolute $ Opportunity Analysis and Forecast, By Packaging Type, 2016-2032
- 3.4.3. Glass Bottles
- 3.4.4. Metal Can
- 3.4.5. PET Bottles
- 3.5. Global Energy Drinks Market Analysis, Opportunity and Forecast, By Format, 2016-2032
- 3.5.1. Global Energy Drinks Market Analysis by Format: Introduction
- 3.5.2. Market Size Absolute $ Opportunity Analysis and Forecast, By Format, 2016-2032
- 3.5.3. Shots
- 3.5.4. Powder
- 3.5.5. Ready-To-Drink (RTD)
- 3.6. Global Energy Drinks Market Analysis, Opportunity and Forecast, By Type , 2016-2032
- 3.6.1. Global Energy Drinks Market Analysis by Type : Introduction
- 3.6.2. Market Size Absolute $ Opportunity Analysis and Forecast, By Type , 2016-2032
- 3.6.3. Inorganic
- 3.6.4. Organic
- 3.7. Global Energy Drinks Market Analysis, Opportunity and Forecast, By Ingredients , 2016-2032
- 3.7.1. Global Energy Drinks Market Analysis by Ingredients : Introduction
- 3.7.2. Market Size Absolute $ Opportunity Analysis and Forecast, By Ingredients , 2016-2032
- 3.7.3. Taurine
- 3.7.4. Caffeine
- 3.7.5. Guarana
- 3.7.6. Vitamin B
- 3.7.7. L-Carnitine
- 3.7.8. Antioxidants
- 3.7.9. Others
- 3.8. Global Energy Drinks Market Analysis, Opportunity and Forecast, By Distribution Channel, 2016-2032
- 3.8.1. Global Energy Drinks Market Analysis by Distribution Channel: Introduction
- 3.8.2. Market Size Absolute $ Opportunity Analysis and Forecast, By Distribution Channel, 2016-2032
- 3.8.3. Convenience Stores
- 3.8.4. Online Retail
- 3.8.5. Supermarket/Hypermarket
- 3.8.6. Others
- 4. North America Energy Drinks Market Analysis, Opportunity and Forecast, 2016-2032
- 4.1. North America Energy Drinks Market Analysis, 2016-2021
- 4.2. North America Energy Drinks Market Opportunity and Forecast, 2023-2032
- 4.3. North America Energy Drinks Market Analysis, Opportunity and Forecast, By Product Type , 2016-2032
- 4.3.1. North America Energy Drinks Market Analysis by Product Type : Introduction
- 4.3.2. Market Size Absolute $ Opportunity Analysis and Forecast, By Product Type , 2016-2032
- 4.3.3. Non-Alcoholic
- 4.3.4. Alcoholic
- 4.4. North America Energy Drinks Market Analysis, Opportunity and Forecast, By Packaging Type, 2016-2032
- 4.4.1. North America Energy Drinks Market Analysis by Packaging Type: Introduction
- 4.4.2. Market Size Absolute $ Opportunity Analysis and Forecast, By Packaging Type, 2016-2032
- 4.4.3. Glass Bottles
- 4.4.4. Metal Can
- 4.4.5. PET Bottles
- 4.5. North America Energy Drinks Market Analysis, Opportunity and Forecast, By Format, 2016-2032
- 4.5.1. North America Energy Drinks Market Analysis by Format: Introduction
- 4.5.2. Market Size Absolute $ Opportunity Analysis and Forecast, By Format, 2016-2032
- 4.5.3. Shots
- 4.5.4. Powder
- 4.5.5. Ready-To-Drink (RTD)
- 4.6. North America Energy Drinks Market Analysis, Opportunity and Forecast, By Type , 2016-2032
- 4.6.1. North America Energy Drinks Market Analysis by Type : Introduction
- 4.6.2. Market Size Absolute $ Opportunity Analysis and Forecast, By Type , 2016-2032
- 4.6.3. Inorganic
- 4.6.4. Organic
- 4.7. North America Energy Drinks Market Analysis, Opportunity and Forecast, By Ingredients , 2016-2032
- 4.7.1. North America Energy Drinks Market Analysis by Ingredients : Introduction
- 4.7.2. Market Size Absolute $ Opportunity Analysis and Forecast, By Ingredients , 2016-2032
- 4.7.3. Taurine
- 4.7.4. Caffeine
- 4.7.5. Guarana
- 4.7.6. Vitamin B
- 4.7.7. L-Carnitine
- 4.7.8. Antioxidants
- 4.7.9. Others
- 4.8. North America Energy Drinks Market Analysis, Opportunity and Forecast, By Distribution Channel, 2016-2032
- 4.8.1. North America Energy Drinks Market Analysis by Distribution Channel: Introduction
- 4.8.2. Market Size Absolute $ Opportunity Analysis and Forecast, By Distribution Channel, 2016-2032
- 4.8.3. Convenience Stores
- 4.8.4. Online Retail
- 4.8.5. Supermarket/Hypermarket
- 4.8.6. Others
- 4.9. North America Energy Drinks Market Analysis, Opportunity and Forecast, By Country , 2016-2032
- 4.9.1. North America Energy Drinks Market Analysis by Country : Introduction
- 4.9.2. Market Size Absolute $ Opportunity Analysis and Forecast, Country , 2016-2032
- 4.9.2.1. The US
- 4.9.2.2. Canada
- 4.9.2.3. Mexico
- 5. Western Europe Energy Drinks Market Analysis, Opportunity and Forecast, 2016-2032
- 5.1. Western Europe Energy Drinks Market Analysis, 2016-2021
- 5.2. Western Europe Energy Drinks Market Opportunity and Forecast, 2023-2032
- 5.3. Western Europe Energy Drinks Market Analysis, Opportunity and Forecast, By Product Type , 2016-2032
- 5.3.1. Western Europe Energy Drinks Market Analysis by Product Type : Introduction
- 5.3.2. Market Size Absolute $ Opportunity Analysis and Forecast, By Product Type , 2016-2032
- 5.3.3. Non-Alcoholic
- 5.3.4. Alcoholic
- 5.4. Western Europe Energy Drinks Market Analysis, Opportunity and Forecast, By Packaging Type, 2016-2032
- 5.4.1. Western Europe Energy Drinks Market Analysis by Packaging Type: Introduction
- 5.4.2. Market Size Absolute $ Opportunity Analysis and Forecast, By Packaging Type, 2016-2032
- 5.4.3. Glass Bottles
- 5.4.4. Metal Can
- 5.4.5. PET Bottles
- 5.5. Western Europe Energy Drinks Market Analysis, Opportunity and Forecast, By Format, 2016-2032
- 5.5.1. Western Europe Energy Drinks Market Analysis by Format: Introduction
- 5.5.2. Market Size Absolute $ Opportunity Analysis and Forecast, By Format, 2016-2032
- 5.5.3. Shots
- 5.5.4. Powder
- 5.5.5. Ready-To-Drink (RTD)
- 5.6. Western Europe Energy Drinks Market Analysis, Opportunity and Forecast, By Type , 2016-2032
- 5.6.1. Western Europe Energy Drinks Market Analysis by Type : Introduction
- 5.6.2. Market Size Absolute $ Opportunity Analysis and Forecast, By Type , 2016-2032
- 5.6.3. Inorganic
- 5.6.4. Organic
- 5.7. Western Europe Energy Drinks Market Analysis, Opportunity and Forecast, By Ingredients , 2016-2032
- 5.7.1. Western Europe Energy Drinks Market Analysis by Ingredients : Introduction
- 5.7.2. Market Size Absolute $ Opportunity Analysis and Forecast, By Ingredients , 2016-2032
- 5.7.3. Taurine
- 5.7.4. Caffeine
- 5.7.5. Guarana
- 5.7.6. Vitamin B
- 5.7.7. L-Carnitine
- 5.7.8. Antioxidants
- 5.7.9. Others
- 5.8. Western Europe Energy Drinks Market Analysis, Opportunity and Forecast, By Distribution Channel, 2016-2032
- 5.8.1. Western Europe Energy Drinks Market Analysis by Distribution Channel: Introduction
- 5.8.2. Market Size Absolute $ Opportunity Analysis and Forecast, By Distribution Channel, 2016-2032
- 5.8.3. Convenience Stores
- 5.8.4. Online Retail
- 5.8.5. Supermarket/Hypermarket
- 5.8.6. Others
- 5.9. Western Europe Energy Drinks Market Analysis, Opportunity and Forecast, By Country , 2016-2032
- 5.9.1. Western Europe Energy Drinks Market Analysis by Country : Introduction
- 5.9.2. Market Size Absolute $ Opportunity Analysis and Forecast, Country , 2016-2032
- 5.9.2.1. Germany
- 5.9.2.2. France
- 5.9.2.3. The UK
- 5.9.2.4. Spain
- 5.9.2.5. Italy
- 5.9.2.6. Portugal
- 5.9.2.7. Ireland
- 5.9.2.8. Austria
- 5.9.2.9. Switzerland
- 5.9.2.10. Benelux
- 5.9.2.11. Nordic
- 5.9.2.12. Rest of Western Europe
- 6. Eastern Europe Energy Drinks Market Analysis, Opportunity and Forecast, 2016-2032
- 6.1. Eastern Europe Energy Drinks Market Analysis, 2016-2021
- 6.2. Eastern Europe Energy Drinks Market Opportunity and Forecast, 2023-2032
- 6.3. Eastern Europe Energy Drinks Market Analysis, Opportunity and Forecast, By Product Type , 2016-2032
- 6.3.1. Eastern Europe Energy Drinks Market Analysis by Product Type : Introduction
- 6.3.2. Market Size Absolute $ Opportunity Analysis and Forecast, By Product Type , 2016-2032
- 6.3.3. Non-Alcoholic
- 6.3.4. Alcoholic
- 6.4. Eastern Europe Energy Drinks Market Analysis, Opportunity and Forecast, By Packaging Type, 2016-2032
- 6.4.1. Eastern Europe Energy Drinks Market Analysis by Packaging Type: Introduction
- 6.4.2. Market Size Absolute $ Opportunity Analysis and Forecast, By Packaging Type, 2016-2032
- 6.4.3. Glass Bottles
- 6.4.4. Metal Can
- 6.4.5. PET Bottles
- 6.5. Eastern Europe Energy Drinks Market Analysis, Opportunity and Forecast, By Format, 2016-2032
- 6.5.1. Eastern Europe Energy Drinks Market Analysis by Format: Introduction
- 6.5.2. Market Size Absolute $ Opportunity Analysis and Forecast, By Format, 2016-2032
- 6.5.3. Shots
- 6.5.4. Powder
- 6.5.5. Ready-To-Drink (RTD)
- 6.6. Eastern Europe Energy Drinks Market Analysis, Opportunity and Forecast, By Type , 2016-2032
- 6.6.1. Eastern Europe Energy Drinks Market Analysis by Type : Introduction
- 6.6.2. Market Size Absolute $ Opportunity Analysis and Forecast, By Type , 2016-2032
- 6.6.3. Inorganic
- 6.6.4. Organic
- 6.7. Eastern Europe Energy Drinks Market Analysis, Opportunity and Forecast, By Ingredients , 2016-2032
- 6.7.1. Eastern Europe Energy Drinks Market Analysis by Ingredients : Introduction
- 6.7.2. Market Size Absolute $ Opportunity Analysis and Forecast, By Ingredients , 2016-2032
- 6.7.3. Taurine
- 6.7.4. Caffeine
- 6.7.5. Guarana
- 6.7.6. Vitamin B
- 6.7.7. L-Carnitine
- 6.7.8. Antioxidants
- 6.7.9. Others
- 6.8. Eastern Europe Energy Drinks Market Analysis, Opportunity and Forecast, By Distribution Channel, 2016-2032
- 6.8.1. Eastern Europe Energy Drinks Market Analysis by Distribution Channel: Introduction
- 6.8.2. Market Size Absolute $ Opportunity Analysis and Forecast, By Distribution Channel, 2016-2032
- 6.8.3. Convenience Stores
- 6.8.4. Online Retail
- 6.8.5. Supermarket/Hypermarket
- 6.8.6. Others
- 6.9. Eastern Europe Energy Drinks Market Analysis, Opportunity and Forecast, By Country , 2016-2032
- 6.9.1. Eastern Europe Energy Drinks Market Analysis by Country : Introduction
- 6.9.2. Market Size Absolute $ Opportunity Analysis and Forecast, Country , 2016-2032
- 6.9.2.1. Russia
- 6.9.2.2. Poland
- 6.9.2.3. The Czech Republic
- 6.9.2.4. Greece
- 6.9.2.5. Rest of Eastern Europe
- 7. APAC Energy Drinks Market Analysis, Opportunity and Forecast, 2016-2032
- 7.1. APAC Energy Drinks Market Analysis, 2016-2021
- 7.2. APAC Energy Drinks Market Opportunity and Forecast, 2023-2032
- 7.3. APAC Energy Drinks Market Analysis, Opportunity and Forecast, By Product Type , 2016-2032
- 7.3.1. APAC Energy Drinks Market Analysis by Product Type : Introduction
- 7.3.2. Market Size Absolute $ Opportunity Analysis and Forecast, By Product Type , 2016-2032
- 7.3.3. Non-Alcoholic
- 7.3.4. Alcoholic
- 7.4. APAC Energy Drinks Market Analysis, Opportunity and Forecast, By Packaging Type, 2016-2032
- 7.4.1. APAC Energy Drinks Market Analysis by Packaging Type: Introduction
- 7.4.2. Market Size Absolute $ Opportunity Analysis and Forecast, By Packaging Type, 2016-2032
- 7.4.3. Glass Bottles
- 7.4.4. Metal Can
- 7.4.5. PET Bottles
- 7.5. APAC Energy Drinks Market Analysis, Opportunity and Forecast, By Format, 2016-2032
- 7.5.1. APAC Energy Drinks Market Analysis by Format: Introduction
- 7.5.2. Market Size Absolute $ Opportunity Analysis and Forecast, By Format, 2016-2032
- 7.5.3. Shots
- 7.5.4. Powder
- 7.5.5. Ready-To-Drink (RTD)
- 7.6. APAC Energy Drinks Market Analysis, Opportunity and Forecast, By Type , 2016-2032
- 7.6.1. APAC Energy Drinks Market Analysis by Type : Introduction
- 7.6.2. Market Size Absolute $ Opportunity Analysis and Forecast, By Type , 2016-2032
- 7.6.3. Inorganic
- 7.6.4. Organic
- 7.7. APAC Energy Drinks Market Analysis, Opportunity and Forecast, By Ingredients , 2016-2032
- 7.7.1. APAC Energy Drinks Market Analysis by Ingredients : Introduction
- 7.7.2. Market Size Absolute $ Opportunity Analysis and Forecast, By Ingredients , 2016-2032
- 7.7.3. Taurine
- 7.7.4. Caffeine
- 7.7.5. Guarana
- 7.7.6. Vitamin B
- 7.7.7. L-Carnitine
- 7.7.8. Antioxidants
- 7.7.9. Others
- 7.8. APAC Energy Drinks Market Analysis, Opportunity and Forecast, By Distribution Channel, 2016-2032
- 7.8.1. APAC Energy Drinks Market Analysis by Distribution Channel: Introduction
- 7.8.2. Market Size Absolute $ Opportunity Analysis and Forecast, By Distribution Channel, 2016-2032
- 7.8.3. Convenience Stores
- 7.8.4. Online Retail
- 7.8.5. Supermarket/Hypermarket
- 7.8.6. Others
- 7.9. APAC Energy Drinks Market Analysis, Opportunity and Forecast, By Country , 2016-2032
- 7.9.1. APAC Energy Drinks Market Analysis by Country : Introduction
- 7.9.2. Market Size Absolute $ Opportunity Analysis and Forecast, Country , 2016-2032
- 7.9.2.1. China
- 7.9.2.2. Japan
- 7.9.2.3. South Korea
- 7.9.2.4. India
- 7.9.2.5. Australia & New Zeland
- 7.9.2.6. Indonesia
- 7.9.2.7. Malaysia
- 7.9.2.8. Philippines
- 7.9.2.9. Singapore
- 7.9.2.10. Thailand
- 7.9.2.11. Vietnam
- 7.9.2.12. Rest of APAC
- 8. Latin America Energy Drinks Market Analysis, Opportunity and Forecast, 2016-2032
- 8.1. Latin America Energy Drinks Market Analysis, 2016-2021
- 8.2. Latin America Energy Drinks Market Opportunity and Forecast, 2023-2032
- 8.3. Latin America Energy Drinks Market Analysis, Opportunity and Forecast, By Product Type , 2016-2032
- 8.3.1. Latin America Energy Drinks Market Analysis by Product Type : Introduction
- 8.3.2. Market Size Absolute $ Opportunity Analysis and Forecast, By Product Type , 2016-2032
- 8.3.3. Non-Alcoholic
- 8.3.4. Alcoholic
- 8.4. Latin America Energy Drinks Market Analysis, Opportunity and Forecast, By Packaging Type, 2016-2032
- 8.4.1. Latin America Energy Drinks Market Analysis by Packaging Type: Introduction
- 8.4.2. Market Size Absolute $ Opportunity Analysis and Forecast, By Packaging Type, 2016-2032
- 8.4.3. Glass Bottles
- 8.4.4. Metal Can
- 8.4.5. PET Bottles
- 8.5. Latin America Energy Drinks Market Analysis, Opportunity and Forecast, By Format, 2016-2032
- 8.5.1. Latin America Energy Drinks Market Analysis by Format: Introduction
- 8.5.2. Market Size Absolute $ Opportunity Analysis and Forecast, By Format, 2016-2032
- 8.5.3. Shots
- 8.5.4. Powder
- 8.5.5. Ready-To-Drink (RTD)
- 8.6. Latin America Energy Drinks Market Analysis, Opportunity and Forecast, By Type , 2016-2032
- 8.6.1. Latin America Energy Drinks Market Analysis by Type : Introduction
- 8.6.2. Market Size Absolute $ Opportunity Analysis and Forecast, By Type , 2016-2032
- 8.6.3. Inorganic
- 8.6.4. Organic
- 8.7. Latin America Energy Drinks Market Analysis, Opportunity and Forecast, By Ingredients , 2016-2032
- 8.7.1. Latin America Energy Drinks Market Analysis by Ingredients : Introduction
- 8.7.2. Market Size Absolute $ Opportunity Analysis and Forecast, By Ingredients , 2016-2032
- 8.7.3. Taurine
- 8.7.4. Caffeine
- 8.7.5. Guarana
- 8.7.6. Vitamin B
- 8.7.7. L-Carnitine
- 8.7.8. Antioxidants
- 8.7.9. Others
- 8.8. Latin America Energy Drinks Market Analysis, Opportunity and Forecast, By Distribution Channel, 2016-2032
- 8.8.1. Latin America Energy Drinks Market Analysis by Distribution Channel: Introduction
- 8.8.2. Market Size Absolute $ Opportunity Analysis and Forecast, By Distribution Channel, 2016-2032
- 8.8.3. Convenience Stores
- 8.8.4. Online Retail
- 8.8.5. Supermarket/Hypermarket
- 8.8.6. Others
- 8.9. Latin America Energy Drinks Market Analysis, Opportunity and Forecast, By Country , 2016-2032
- 8.9.1. Latin America Energy Drinks Market Analysis by Country : Introduction
- 8.9.2. Market Size Absolute $ Opportunity Analysis and Forecast, Country , 2016-2032
- 8.9.2.1. Brazil
- 8.9.2.2. Colombia
- 8.9.2.3. Chile
- 8.9.2.4. Argentina
- 8.9.2.5. Costa Rica
- 8.9.2.6. Rest of Latin America
- 9. Middle East & Africa Energy Drinks Market Analysis, Opportunity and Forecast, 2016-2032
- 9.1. Middle East & Africa Energy Drinks Market Analysis, 2016-2021
- 9.2. Middle East & Africa Energy Drinks Market Opportunity and Forecast, 2023-2032
- 9.3. Middle East & Africa Energy Drinks Market Analysis, Opportunity and Forecast, By Product Type , 2016-2032
- 9.3.1. Middle East & Africa Energy Drinks Market Analysis by Product Type : Introduction
- 9.3.2. Market Size Absolute $ Opportunity Analysis and Forecast, By Product Type , 2016-2032
- 9.3.3. Non-Alcoholic
- 9.3.4. Alcoholic
- 9.4. Middle East & Africa Energy Drinks Market Analysis, Opportunity and Forecast, By Packaging Type, 2016-2032
- 9.4.1. Middle East & Africa Energy Drinks Market Analysis by Packaging Type: Introduction
- 9.4.2. Market Size Absolute $ Opportunity Analysis and Forecast, By Packaging Type, 2016-2032
- 9.4.3. Glass Bottles
- 9.4.4. Metal Can
- 9.4.5. PET Bottles
- 9.5. Middle East & Africa Energy Drinks Market Analysis, Opportunity and Forecast, By Format, 2016-2032
- 9.5.1. Middle East & Africa Energy Drinks Market Analysis by Format: Introduction
- 9.5.2. Market Size Absolute $ Opportunity Analysis and Forecast, By Format, 2016-2032
- 9.5.3. Shots
- 9.5.4. Powder
- 9.5.5. Ready-To-Drink (RTD)
- 9.6. Middle East & Africa Energy Drinks Market Analysis, Opportunity and Forecast, By Type , 2016-2032
- 9.6.1. Middle East & Africa Energy Drinks Market Analysis by Type : Introduction
- 9.6.2. Market Size Absolute $ Opportunity Analysis and Forecast, By Type , 2016-2032
- 9.6.3. Inorganic
- 9.6.4. Organic
- 9.7. Middle East & Africa Energy Drinks Market Analysis, Opportunity and Forecast, By Ingredients , 2016-2032
- 9.7.1. Middle East & Africa Energy Drinks Market Analysis by Ingredients : Introduction
- 9.7.2. Market Size Absolute $ Opportunity Analysis and Forecast, By Ingredients , 2016-2032
- 9.7.3. Taurine
- 9.7.4. Caffeine
- 9.7.5. Guarana
- 9.7.6. Vitamin B
- 9.7.7. L-Carnitine
- 9.7.8. Antioxidants
- 9.7.9. Others
- 9.8. Middle East & Africa Energy Drinks Market Analysis, Opportunity and Forecast, By Distribution Channel, 2016-2032
- 9.8.1. Middle East & Africa Energy Drinks Market Analysis by Distribution Channel: Introduction
- 9.8.2. Market Size Absolute $ Opportunity Analysis and Forecast, By Distribution Channel, 2016-2032
- 9.8.3. Convenience Stores
- 9.8.4. Online Retail
- 9.8.5. Supermarket/Hypermarket
- 9.8.6. Others
- 9.9. Middle East & Africa Energy Drinks Market Analysis, Opportunity and Forecast, By Country , 2016-2032
- 9.9.1. Middle East & Africa Energy Drinks Market Analysis by Country : Introduction
- 9.9.2. Market Size Absolute $ Opportunity Analysis and Forecast, Country , 2016-2032
- 9.9.2.1. Algeria
- 9.9.2.2. Egypt
- 9.9.2.3. Israel
- 9.9.2.4. Kuwait
- 9.9.2.5. Nigeria
- 9.9.2.6. Saudi Arabia
- 9.9.2.7. South Africa
- 9.9.2.8. Turkey
- 9.9.2.9. The UAE
- 9.9.2.10. Rest of MEA
- 10. Global Energy Drinks Market Analysis, Opportunity and Forecast, By Region , 2016-2032
- 10.1. Global Energy Drinks Market Analysis by Region : Introduction
- 10.2. Market Size Absolute $ Opportunity Analysis and Forecast, By Region , 2016-2032
- 10.2.1. North America
- 10.2.2. Western Europe
- 10.2.3. Eastern Europe
- 10.2.4. APAC
- 10.2.5. Latin America
- 10.2.6. Middle East & Africa
- 11. Global Energy Drinks Market Competitive Landscape, Market Share Analysis, and Company Profiles
- 11.1. Market Share Analysis
- 11.2. Company Profiles
- 11.3. Aje Group
- 11.3.1. Company Overview
- 11.3.2. Financial Highlights
- 11.3.3. Product Portfolio
- 11.3.4. SWOT Analysis
- 11.3.5. Key Strategies and Developments
- 11.4. Carabao Group Public Company Limited
- 11.4.1. Company Overview
- 11.4.2. Financial Highlights
- 11.4.3. Product Portfolio
- 11.4.4. SWOT Analysis
- 11.4.5. Key Strategies and Developments
- 11.5. Congo Brands
- 11.5.1. Company Overview
- 11.5.2. Financial Highlights
- 11.5.3. Product Portfolio
- 11.5.4. SWOT Analysis
- 11.5.5. Key Strategies and Developments
- 11.6. Hell Energy Magyarország Korlátolt Felelosségu Társaság
- 11.6.1. Company Overview
- 11.6.2. Financial Highlights
- 11.6.3. Product Portfolio
- 11.6.4. SWOT Analysis
- 11.6.5. Key Strategies and Developments
- 11.7. Living Essentials, LLC
- 11.7.1. Company Overview
- 11.7.2. Financial Highlights
- 11.7.3. Product Portfolio
- 11.7.4. SWOT Analysis
- 11.7.5. Key Strategies and Developments
- 11.8. Monster Beverage Corporation
- 11.8.1. Company Overview
- 11.8.2. Financial Highlights
- 11.8.3. Product Portfolio
- 11.8.4. SWOT Analysis
- 11.8.5. Key Strategies and Developments
- 11.9. Osotspa Public Company Limited
- 11.9.1. Company Overview
- 11.9.2. Financial Highlights
- 11.9.3. Product Portfolio
- 11.9.4. SWOT Analysis
- 11.9.5. Key Strategies and Developments
- 11.10. PepsiCo, Inc.
- 11.10.1. Company Overview
- 11.10.2. Financial Highlights
- 11.10.3. Product Portfolio
- 11.10.4. SWOT Analysis
- 11.10.5. Key Strategies and Developments
- 11.11. Red Bull GmbH
- 11.11.1. Company Overview
- 11.11.2. Financial Highlights
- 11.11.3. Product Portfolio
- 11.11.4. SWOT Analysis
- 11.11.5. Key Strategies and Developments
- 11.12. Suntory Holdings Limited
- 11.12.1. Company Overview
- 11.12.2. Financial Highlights
- 11.12.3. Product Portfolio
- 11.12.4. SWOT Analysis
- 11.12.5. Key Strategies and Developments
- 11.13.1. Company Overview
- 11.13.2. Financial Highlights
- 11.13.3. Product Portfolio
- 11.13.4. SWOT Analysis
- 11.13.5. Key Strategies and Developments
- 11.14. T.C. Pharmaceutical Industries Company Limited
- 11.14.1. Company Overview
- 11.14.2. Financial Highlights
- 11.14.3. Product Portfolio
- 11.14.4. SWOT Analysis
- 11.14.5. Key Strategies and Developments
- 11.15. The Coca-Cola Company
- 11.15.1. Company Overview
- 11.15.2. Financial Highlights
- 11.15.3. Product Portfolio
- 11.15.4. SWOT Analysis
- 11.15.5. Key Strategies and Developments
- 12. Assumptions and Acronyms
- 13. Research Methodology
- 14. Contact
- List of Figures
- Figure 1: Global Energy Drinks Market Revenue (US$ Mn) Market Share by Product Type in 2022
- Figure 2: Global Energy Drinks Market Attractiveness Analysis by Product Type , 2016-2032
- Figure 3: Global Energy Drinks Market Revenue (US$ Mn) Market Share by Packaging Typein 2022
- Figure 4: Global Energy Drinks Market Attractiveness Analysis by Packaging Type, 2016-2032
- Figure 5: Global Energy Drinks Market Revenue (US$ Mn) Market Share by Formatin 2022
- Figure 6: Global Energy Drinks Market Attractiveness Analysis by Format, 2016-2032
- Figure 7: Global Energy Drinks Market Revenue (US$ Mn) Market Share by Type in 2022
- Figure 8: Global Energy Drinks Market Attractiveness Analysis by Type , 2016-2032
- Figure 9: Global Energy Drinks Market Revenue (US$ Mn) Market Share by Ingredients in 2022
- Figure 10: Global Energy Drinks Market Attractiveness Analysis by Ingredients , 2016-2032
- Figure 11: Global Energy Drinks Market Revenue (US$ Mn) Market Share by Distribution Channelin 2022
- Figure 12: Global Energy Drinks Market Attractiveness Analysis by Distribution Channel, 2016-2032
- Figure 13: Global Energy Drinks Market Revenue (US$ Mn) Market Share by Region in 2022
- Figure 14: Global Energy Drinks Market Attractiveness Analysis by Region, 2016-2032
- Figure 15: Global Energy Drinks Market Revenue (US$ Mn) (2016-2032)
- Figure 16: Global Energy Drinks Market Revenue (US$ Mn) Comparison by Region (2016-2032)
- Figure 17: Global Energy Drinks Market Revenue (US$ Mn) Comparison by Product Type (2016-2032)
- Figure 18: Global Energy Drinks Market Revenue (US$ Mn) Comparison by Packaging Type (2016-2032)
- Figure 19: Global Energy Drinks Market Revenue (US$ Mn) Comparison by Format (2016-2032)
- Figure 20: Global Energy Drinks Market Revenue (US$ Mn) Comparison by Type (2016-2032)
- Figure 21: Global Energy Drinks Market Revenue (US$ Mn) Comparison by Ingredients (2016-2032)
- Figure 22: Global Energy Drinks Market Revenue (US$ Mn) Comparison by Distribution Channel (2016-2032)
- Figure 23: Global Energy Drinks Market Y-o-Y Growth Rate Comparison by Region (2016-2032)
- Figure 24: Global Energy Drinks Market Y-o-Y Growth Rate Comparison by Product Type (2016-2032)
- Figure 25: Global Energy Drinks Market Y-o-Y Growth Rate Comparison by Packaging Type (2016-2032)
- Figure 26: Global Energy Drinks Market Y-o-Y Growth Rate Comparison by Format (2016-2032)
- Figure 27: Global Energy Drinks Market Y-o-Y Growth Rate Comparison by Type (2016-2032)
- Figure 28: Global Energy Drinks Market Y-o-Y Growth Rate Comparison by Ingredients (2016-2032)
- Figure 29: Global Energy Drinks Market Y-o-Y Growth Rate Comparison by Distribution Channel (2016-2032)
- Figure 30: Global Energy Drinks Market Share Comparison by Region (2016-2032)
- Figure 31: Global Energy Drinks Market Share Comparison by Product Type (2016-2032)
- Figure 32: Global Energy Drinks Market Share Comparison by Packaging Type (2016-2032)
- Figure 33: Global Energy Drinks Market Share Comparison by Format (2016-2032)
- Figure 34: Global Energy Drinks Market Share Comparison by Type (2016-2032)
- Figure 35: Global Energy Drinks Market Share Comparison by Ingredients (2016-2032)
- Figure 36: Global Energy Drinks Market Share Comparison by Distribution Channel (2016-2032)
- Figure 37: North America Energy Drinks Market Revenue (US$ Mn) Market Share by Product Type in 2022
- Figure 38: North America Energy Drinks Market Attractiveness Analysis by Product Type , 2016-2032
- Figure 39: North America Energy Drinks Market Revenue (US$ Mn) Market Share by Packaging Typein 2022
- Figure 40: North America Energy Drinks Market Attractiveness Analysis by Packaging Type, 2016-2032
- Figure 41: North America Energy Drinks Market Revenue (US$ Mn) Market Share by Formatin 2022
- Figure 42: North America Energy Drinks Market Attractiveness Analysis by Format, 2016-2032
- Figure 43: North America Energy Drinks Market Revenue (US$ Mn) Market Share by Type in 2022
- Figure 44: North America Energy Drinks Market Attractiveness Analysis by Type , 2016-2032
- Figure 45: North America Energy Drinks Market Revenue (US$ Mn) Market Share by Ingredients in 2022
- Figure 46: North America Energy Drinks Market Attractiveness Analysis by Ingredients , 2016-2032
- Figure 47: North America Energy Drinks Market Revenue (US$ Mn) Market Share by Distribution Channelin 2022
- Figure 48: North America Energy Drinks Market Attractiveness Analysis by Distribution Channel, 2016-2032
- Figure 49: North America Energy Drinks Market Revenue (US$ Mn) Market Share by Country in 2022
- Figure 50: North America Energy Drinks Market Attractiveness Analysis by Country, 2016-2032
- Figure 51: North America Energy Drinks Market Revenue (US$ Mn) (2016-2032)
- Figure 52: North America Energy Drinks Market Revenue (US$ Mn) Comparison by Country (2016-2032)
- Figure 53: North America Energy Drinks Market Revenue (US$ Mn) Comparison by Product Type (2016-2032)
- Figure 54: North America Energy Drinks Market Revenue (US$ Mn) Comparison by Packaging Type (2016-2032)
- Figure 55: North America Energy Drinks Market Revenue (US$ Mn) Comparison by Format (2016-2032)
- Figure 56: North America Energy Drinks Market Revenue (US$ Mn) Comparison by Type (2016-2032)
- Figure 57: North America Energy Drinks Market Revenue (US$ Mn) Comparison by Ingredients (2016-2032)
- Figure 58: North America Energy Drinks Market Revenue (US$ Mn) Comparison by Distribution Channel (2016-2032)
- Figure 59: North America Energy Drinks Market Y-o-Y Growth Rate Comparison by Country (2016-2032)
- Figure 60: North America Energy Drinks Market Y-o-Y Growth Rate Comparison by Product Type (2016-2032)
- Figure 61: North America Energy Drinks Market Y-o-Y Growth Rate Comparison by Packaging Type (2016-2032)
- Figure 62: North America Energy Drinks Market Y-o-Y Growth Rate Comparison by Format (2016-2032)
- Figure 63: North America Energy Drinks Market Y-o-Y Growth Rate Comparison by Type (2016-2032)
- Figure 64: North America Energy Drinks Market Y-o-Y Growth Rate Comparison by Ingredients (2016-2032)
- Figure 65: North America Energy Drinks Market Y-o-Y Growth Rate Comparison by Distribution Channel (2016-2032)
- Figure 66: North America Energy Drinks Market Share Comparison by Country (2016-2032)
- Figure 67: North America Energy Drinks Market Share Comparison by Product Type (2016-2032)
- Figure 68: North America Energy Drinks Market Share Comparison by Packaging Type (2016-2032)
- Figure 69: North America Energy Drinks Market Share Comparison by Format (2016-2032)
- Figure 70: North America Energy Drinks Market Share Comparison by Type (2016-2032)
- Figure 71: North America Energy Drinks Market Share Comparison by Ingredients (2016-2032)
- Figure 72: North America Energy Drinks Market Share Comparison by Distribution Channel (2016-2032)
- Figure 73: Western Europe Energy Drinks Market Revenue (US$ Mn) Market Share by Product Type in 2022
- Figure 74: Western Europe Energy Drinks Market Attractiveness Analysis by Product Type , 2016-2032
- Figure 75: Western Europe Energy Drinks Market Revenue (US$ Mn) Market Share by Packaging Typein 2022
- Figure 76: Western Europe Energy Drinks Market Attractiveness Analysis by Packaging Type, 2016-2032
- Figure 77: Western Europe Energy Drinks Market Revenue (US$ Mn) Market Share by Formatin 2022
- Figure 78: Western Europe Energy Drinks Market Attractiveness Analysis by Format, 2016-2032
- Figure 79: Western Europe Energy Drinks Market Revenue (US$ Mn) Market Share by Type in 2022
- Figure 80: Western Europe Energy Drinks Market Attractiveness Analysis by Type , 2016-2032
- Figure 81: Western Europe Energy Drinks Market Revenue (US$ Mn) Market Share by Ingredients in 2022
- Figure 82: Western Europe Energy Drinks Market Attractiveness Analysis by Ingredients , 2016-2032
- Figure 83: Western Europe Energy Drinks Market Revenue (US$ Mn) Market Share by Distribution Channelin 2022
- Figure 84: Western Europe Energy Drinks Market Attractiveness Analysis by Distribution Channel, 2016-2032
- Figure 85: Western Europe Energy Drinks Market Revenue (US$ Mn) Market Share by Country in 2022
- Figure 86: Western Europe Energy Drinks Market Attractiveness Analysis by Country, 2016-2032
- Figure 87: Western Europe Energy Drinks Market Revenue (US$ Mn) (2016-2032)
- Figure 88: Western Europe Energy Drinks Market Revenue (US$ Mn) Comparison by Country (2016-2032)
- Figure 89: Western Europe Energy Drinks Market Revenue (US$ Mn) Comparison by Product Type (2016-2032)
- Figure 90: Western Europe Energy Drinks Market Revenue (US$ Mn) Comparison by Packaging Type (2016-2032)
- Figure 91: Western Europe Energy Drinks Market Revenue (US$ Mn) Comparison by Format (2016-2032)
- Figure 92: Western Europe Energy Drinks Market Revenue (US$ Mn) Comparison by Type (2016-2032)
- Figure 93: Western Europe Energy Drinks Market Revenue (US$ Mn) Comparison by Ingredients (2016-2032)
- Figure 94: Western Europe Energy Drinks Market Revenue (US$ Mn) Comparison by Distribution Channel (2016-2032)
- Figure 95: Western Europe Energy Drinks Market Y-o-Y Growth Rate Comparison by Country (2016-2032)
- Figure 96: Western Europe Energy Drinks Market Y-o-Y Growth Rate Comparison by Product Type (2016-2032)
- Figure 97: Western Europe Energy Drinks Market Y-o-Y Growth Rate Comparison by Packaging Type (2016-2032)
- Figure 98: Western Europe Energy Drinks Market Y-o-Y Growth Rate Comparison by Format (2016-2032)
- Figure 99: Western Europe Energy Drinks Market Y-o-Y Growth Rate Comparison by Type (2016-2032)
- Figure 100: Western Europe Energy Drinks Market Y-o-Y Growth Rate Comparison by Ingredients (2016-2032)
- Figure 101: Western Europe Energy Drinks Market Y-o-Y Growth Rate Comparison by Distribution Channel (2016-2032)
- Figure 102: Western Europe Energy Drinks Market Share Comparison by Country (2016-2032)
- Figure 103: Western Europe Energy Drinks Market Share Comparison by Product Type (2016-2032)
- Figure 104: Western Europe Energy Drinks Market Share Comparison by Packaging Type (2016-2032)
- Figure 105: Western Europe Energy Drinks Market Share Comparison by Format (2016-2032)
- Figure 106: Western Europe Energy Drinks Market Share Comparison by Type (2016-2032)
- Figure 107: Western Europe Energy Drinks Market Share Comparison by Ingredients (2016-2032)
- Figure 108: Western Europe Energy Drinks Market Share Comparison by Distribution Channel (2016-2032)
- Figure 109: Eastern Europe Energy Drinks Market Revenue (US$ Mn) Market Share by Product Type in 2022
- Figure 110: Eastern Europe Energy Drinks Market Attractiveness Analysis by Product Type , 2016-2032
- Figure 111: Eastern Europe Energy Drinks Market Revenue (US$ Mn) Market Share by Packaging Typein 2022
- Figure 112: Eastern Europe Energy Drinks Market Attractiveness Analysis by Packaging Type, 2016-2032
- Figure 113: Eastern Europe Energy Drinks Market Revenue (US$ Mn) Market Share by Formatin 2022
- Figure 114: Eastern Europe Energy Drinks Market Attractiveness Analysis by Format, 2016-2032
- Figure 115: Eastern Europe Energy Drinks Market Revenue (US$ Mn) Market Share by Type in 2022
- Figure 116: Eastern Europe Energy Drinks Market Attractiveness Analysis by Type , 2016-2032
- Figure 117: Eastern Europe Energy Drinks Market Revenue (US$ Mn) Market Share by Ingredients in 2022
- Figure 118: Eastern Europe Energy Drinks Market Attractiveness Analysis by Ingredients , 2016-2032
- Figure 119: Eastern Europe Energy Drinks Market Revenue (US$ Mn) Market Share by Distribution Channelin 2022
- Figure 120: Eastern Europe Energy Drinks Market Attractiveness Analysis by Distribution Channel, 2016-2032
- Figure 121: Eastern Europe Energy Drinks Market Revenue (US$ Mn) Market Share by Country in 2022
- Figure 122: Eastern Europe Energy Drinks Market Attractiveness Analysis by Country, 2016-2032
- Figure 123: Eastern Europe Energy Drinks Market Revenue (US$ Mn) (2016-2032)
- Figure 124: Eastern Europe Energy Drinks Market Revenue (US$ Mn) Comparison by Country (2016-2032)
- Figure 125: Eastern Europe Energy Drinks Market Revenue (US$ Mn) Comparison by Product Type (2016-2032)
- Figure 126: Eastern Europe Energy Drinks Market Revenue (US$ Mn) Comparison by Packaging Type (2016-2032)
- Figure 127: Eastern Europe Energy Drinks Market Revenue (US$ Mn) Comparison by Format (2016-2032)
- Figure 128: Eastern Europe Energy Drinks Market Revenue (US$ Mn) Comparison by Type (2016-2032)
- Figure 129: Eastern Europe Energy Drinks Market Revenue (US$ Mn) Comparison by Ingredients (2016-2032)
- Figure 130: Eastern Europe Energy Drinks Market Revenue (US$ Mn) Comparison by Distribution Channel (2016-2032)
- Figure 131: Eastern Europe Energy Drinks Market Y-o-Y Growth Rate Comparison by Country (2016-2032)
- Figure 132: Eastern Europe Energy Drinks Market Y-o-Y Growth Rate Comparison by Product Type (2016-2032)
- Figure 133: Eastern Europe Energy Drinks Market Y-o-Y Growth Rate Comparison by Packaging Type (2016-2032)
- Figure 134: Eastern Europe Energy Drinks Market Y-o-Y Growth Rate Comparison by Format (2016-2032)
- Figure 135: Eastern Europe Energy Drinks Market Y-o-Y Growth Rate Comparison by Type (2016-2032)
- Figure 136: Eastern Europe Energy Drinks Market Y-o-Y Growth Rate Comparison by Ingredients (2016-2032)
- Figure 137: Eastern Europe Energy Drinks Market Y-o-Y Growth Rate Comparison by Distribution Channel (2016-2032)
- Figure 138: Eastern Europe Energy Drinks Market Share Comparison by Country (2016-2032)
- Figure 139: Eastern Europe Energy Drinks Market Share Comparison by Product Type (2016-2032)
- Figure 140: Eastern Europe Energy Drinks Market Share Comparison by Packaging Type (2016-2032)
- Figure 141: Eastern Europe Energy Drinks Market Share Comparison by Format (2016-2032)
- Figure 142: Eastern Europe Energy Drinks Market Share Comparison by Type (2016-2032)
- Figure 143: Eastern Europe Energy Drinks Market Share Comparison by Ingredients (2016-2032)
- Figure 144: Eastern Europe Energy Drinks Market Share Comparison by Distribution Channel (2016-2032)
- Figure 145: APAC Energy Drinks Market Revenue (US$ Mn) Market Share by Product Type in 2022
- Figure 146: APAC Energy Drinks Market Attractiveness Analysis by Product Type , 2016-2032
- Figure 147: APAC Energy Drinks Market Revenue (US$ Mn) Market Share by Packaging Typein 2022
- Figure 148: APAC Energy Drinks Market Attractiveness Analysis by Packaging Type, 2016-2032
- Figure 149: APAC Energy Drinks Market Revenue (US$ Mn) Market Share by Formatin 2022
- Figure 150: APAC Energy Drinks Market Attractiveness Analysis by Format, 2016-2032
- Figure 151: APAC Energy Drinks Market Revenue (US$ Mn) Market Share by Type in 2022
- Figure 152: APAC Energy Drinks Market Attractiveness Analysis by Type , 2016-2032
- Figure 153: APAC Energy Drinks Market Revenue (US$ Mn) Market Share by Ingredients in 2022
- Figure 154: APAC Energy Drinks Market Attractiveness Analysis by Ingredients , 2016-2032
- Figure 155: APAC Energy Drinks Market Revenue (US$ Mn) Market Share by Distribution Channelin 2022
- Figure 156: APAC Energy Drinks Market Attractiveness Analysis by Distribution Channel, 2016-2032
- Figure 157: APAC Energy Drinks Market Revenue (US$ Mn) Market Share by Country in 2022
- Figure 158: APAC Energy Drinks Market Attractiveness Analysis by Country, 2016-2032
- Figure 159: APAC Energy Drinks Market Revenue (US$ Mn) (2016-2032)
- Figure 160: APAC Energy Drinks Market Revenue (US$ Mn) Comparison by Country (2016-2032)
- Figure 161: APAC Energy Drinks Market Revenue (US$ Mn) Comparison by Product Type (2016-2032)
- Figure 162: APAC Energy Drinks Market Revenue (US$ Mn) Comparison by Packaging Type (2016-2032)
- Figure 163: APAC Energy Drinks Market Revenue (US$ Mn) Comparison by Format (2016-2032)
- Figure 164: APAC Energy Drinks Market Revenue (US$ Mn) Comparison by Type (2016-2032)
- Figure 165: APAC Energy Drinks Market Revenue (US$ Mn) Comparison by Ingredients (2016-2032)
- Figure 166: APAC Energy Drinks Market Revenue (US$ Mn) Comparison by Distribution Channel (2016-2032)
- Figure 167: APAC Energy Drinks Market Y-o-Y Growth Rate Comparison by Country (2016-2032)
- Figure 168: APAC Energy Drinks Market Y-o-Y Growth Rate Comparison by Product Type (2016-2032)
- Figure 169: APAC Energy Drinks Market Y-o-Y Growth Rate Comparison by Packaging Type (2016-2032)
- Figure 170: APAC Energy Drinks Market Y-o-Y Growth Rate Comparison by Format (2016-2032)
- Figure 171: APAC Energy Drinks Market Y-o-Y Growth Rate Comparison by Type (2016-2032)
- Figure 172: APAC Energy Drinks Market Y-o-Y Growth Rate Comparison by Ingredients (2016-2032)
- Figure 173: APAC Energy Drinks Market Y-o-Y Growth Rate Comparison by Distribution Channel (2016-2032)
- Figure 174: APAC Energy Drinks Market Share Comparison by Country (2016-2032)
- Figure 175: APAC Energy Drinks Market Share Comparison by Product Type (2016-2032)
- Figure 176: APAC Energy Drinks Market Share Comparison by Packaging Type (2016-2032)
- Figure 177: APAC Energy Drinks Market Share Comparison by Format (2016-2032)
- Figure 178: APAC Energy Drinks Market Share Comparison by Type (2016-2032)
- Figure 179: APAC Energy Drinks Market Share Comparison by Ingredients (2016-2032)
- Figure 180: APAC Energy Drinks Market Share Comparison by Distribution Channel (2016-2032)
- Figure 181: Latin America Energy Drinks Market Revenue (US$ Mn) Market Share by Product Type in 2022
- Figure 182: Latin America Energy Drinks Market Attractiveness Analysis by Product Type , 2016-2032
- Figure 183: Latin America Energy Drinks Market Revenue (US$ Mn) Market Share by Packaging Typein 2022
- Figure 184: Latin America Energy Drinks Market Attractiveness Analysis by Packaging Type, 2016-2032
- Figure 185: Latin America Energy Drinks Market Revenue (US$ Mn) Market Share by Formatin 2022
- Figure 186: Latin America Energy Drinks Market Attractiveness Analysis by Format, 2016-2032
- Figure 187: Latin America Energy Drinks Market Revenue (US$ Mn) Market Share by Type in 2022
- Figure 188: Latin America Energy Drinks Market Attractiveness Analysis by Type , 2016-2032
- Figure 189: Latin America Energy Drinks Market Revenue (US$ Mn) Market Share by Ingredients in 2022
- Figure 190: Latin America Energy Drinks Market Attractiveness Analysis by Ingredients , 2016-2032
- Figure 191: Latin America Energy Drinks Market Revenue (US$ Mn) Market Share by Distribution Channelin 2022
- Figure 192: Latin America Energy Drinks Market Attractiveness Analysis by Distribution Channel, 2016-2032
- Figure 193: Latin America Energy Drinks Market Revenue (US$ Mn) Market Share by Country in 2022
- Figure 194: Latin America Energy Drinks Market Attractiveness Analysis by Country, 2016-2032
- Figure 195: Latin America Energy Drinks Market Revenue (US$ Mn) (2016-2032)
- Figure 196: Latin America Energy Drinks Market Revenue (US$ Mn) Comparison by Country (2016-2032)
- Figure 197: Latin America Energy Drinks Market Revenue (US$ Mn) Comparison by Product Type (2016-2032)
- Figure 198: Latin America Energy Drinks Market Revenue (US$ Mn) Comparison by Packaging Type (2016-2032)
- Figure 199: Latin America Energy Drinks Market Revenue (US$ Mn) Comparison by Format (2016-2032)
- Figure 200: Latin America Energy Drinks Market Revenue (US$ Mn) Comparison by Type (2016-2032)
- Figure 201: Latin America Energy Drinks Market Revenue (US$ Mn) Comparison by Ingredients (2016-2032)
- Figure 202: Latin America Energy Drinks Market Revenue (US$ Mn) Comparison by Distribution Channel (2016-2032)
- Figure 203: Latin America Energy Drinks Market Y-o-Y Growth Rate Comparison by Country (2016-2032)
- Figure 204: Latin America Energy Drinks Market Y-o-Y Growth Rate Comparison by Product Type (2016-2032)
- Figure 205: Latin America Energy Drinks Market Y-o-Y Growth Rate Comparison by Packaging Type (2016-2032)
- Figure 206: Latin America Energy Drinks Market Y-o-Y Growth Rate Comparison by Format (2016-2032)
- Figure 207: Latin America Energy Drinks Market Y-o-Y Growth Rate Comparison by Type (2016-2032)
- Figure 208: Latin America Energy Drinks Market Y-o-Y Growth Rate Comparison by Ingredients (2016-2032)
- Figure 209: Latin America Energy Drinks Market Y-o-Y Growth Rate Comparison by Distribution Channel (2016-2032)
- Figure 210: Latin America Energy Drinks Market Share Comparison by Country (2016-2032)
- Figure 211: Latin America Energy Drinks Market Share Comparison by Product Type (2016-2032)
- Figure 212: Latin America Energy Drinks Market Share Comparison by Packaging Type (2016-2032)
- Figure 213: Latin America Energy Drinks Market Share Comparison by Format (2016-2032)
- Figure 214: Latin America Energy Drinks Market Share Comparison by Type (2016-2032)
- Figure 215: Latin America Energy Drinks Market Share Comparison by Ingredients (2016-2032)
- Figure 216: Latin America Energy Drinks Market Share Comparison by Distribution Channel (2016-2032)
- Figure 217: Middle East & Africa Energy Drinks Market Revenue (US$ Mn) Market Share by Product Type in 2022
- Figure 218: Middle East & Africa Energy Drinks Market Attractiveness Analysis by Product Type , 2016-2032
- Figure 219: Middle East & Africa Energy Drinks Market Revenue (US$ Mn) Market Share by Packaging Typein 2022
- Figure 220: Middle East & Africa Energy Drinks Market Attractiveness Analysis by Packaging Type, 2016-2032
- Figure 221: Middle East & Africa Energy Drinks Market Revenue (US$ Mn) Market Share by Formatin 2022
- Figure 222: Middle East & Africa Energy Drinks Market Attractiveness Analysis by Format, 2016-2032
- Figure 223: Middle East & Africa Energy Drinks Market Revenue (US$ Mn) Market Share by Type in 2022
- Figure 224: Middle East & Africa Energy Drinks Market Attractiveness Analysis by Type , 2016-2032
- Figure 225: Middle East & Africa Energy Drinks Market Revenue (US$ Mn) Market Share by Ingredients in 2022
- Figure 226: Middle East & Africa Energy Drinks Market Attractiveness Analysis by Ingredients , 2016-2032
- Figure 227: Middle East & Africa Energy Drinks Market Revenue (US$ Mn) Market Share by Distribution Channelin 2022
- Figure 228: Middle East & Africa Energy Drinks Market Attractiveness Analysis by Distribution Channel, 2016-2032
- Figure 229: Middle East & Africa Energy Drinks Market Revenue (US$ Mn) Market Share by Country in 2022
- Figure 230: Middle East & Africa Energy Drinks Market Attractiveness Analysis by Country, 2016-2032
- Figure 231: Middle East & Africa Energy Drinks Market Revenue (US$ Mn) (2016-2032)
- Figure 232: Middle East & Africa Energy Drinks Market Revenue (US$ Mn) Comparison by Country (2016-2032)
- Figure 233: Middle East & Africa Energy Drinks Market Revenue (US$ Mn) Comparison by Product Type (2016-2032)
- Figure 234: Middle East & Africa Energy Drinks Market Revenue (US$ Mn) Comparison by Packaging Type (2016-2032)
- Figure 235: Middle East & Africa Energy Drinks Market Revenue (US$ Mn) Comparison by Format (2016-2032)
- Figure 236: Middle East & Africa Energy Drinks Market Revenue (US$ Mn) Comparison by Type (2016-2032)
- Figure 237: Middle East & Africa Energy Drinks Market Revenue (US$ Mn) Comparison by Ingredients (2016-2032)
- Figure 238: Middle East & Africa Energy Drinks Market Revenue (US$ Mn) Comparison by Distribution Channel (2016-2032)
- Figure 239: Middle East & Africa Energy Drinks Market Y-o-Y Growth Rate Comparison by Country (2016-2032)
- Figure 240: Middle East & Africa Energy Drinks Market Y-o-Y Growth Rate Comparison by Product Type (2016-2032)
- Figure 241: Middle East & Africa Energy Drinks Market Y-o-Y Growth Rate Comparison by Packaging Type (2016-2032)
- Figure 242: Middle East & Africa Energy Drinks Market Y-o-Y Growth Rate Comparison by Format (2016-2032)
- Figure 243: Middle East & Africa Energy Drinks Market Y-o-Y Growth Rate Comparison by Type (2016-2032)
- Figure 244: Middle East & Africa Energy Drinks Market Y-o-Y Growth Rate Comparison by Ingredients (2016-2032)
- Figure 245: Middle East & Africa Energy Drinks Market Y-o-Y Growth Rate Comparison by Distribution Channel (2016-2032)
- Figure 246: Middle East & Africa Energy Drinks Market Share Comparison by Country (2016-2032)
- Figure 247: Middle East & Africa Energy Drinks Market Share Comparison by Product Type (2016-2032)
- Figure 248: Middle East & Africa Energy Drinks Market Share Comparison by Packaging Type (2016-2032)
- Figure 249: Middle East & Africa Energy Drinks Market Share Comparison by Format (2016-2032)
- Figure 250: Middle East & Africa Energy Drinks Market Share Comparison by Type (2016-2032)
- Figure 251: Middle East & Africa Energy Drinks Market Share Comparison by Ingredients (2016-2032)
- Figure 252: Middle East & Africa Energy Drinks Market Share Comparison by Distribution Channel (2016-2032)
- List of Tables
- Table 1: Global Energy Drinks Market Comparison by Product Type (2016-2032)
- Table 2: Global Energy Drinks Market Comparison by Packaging Type (2016-2032)
- Table 3: Global Energy Drinks Market Comparison by Format (2016-2032)
- Table 4: Global Energy Drinks Market Comparison by Type (2016-2032)
- Table 5: Global Energy Drinks Market Comparison by Ingredients (2016-2032)
- Table 6: Global Energy Drinks Market Comparison by Distribution Channel (2016-2032)
- Table 7: Global Energy Drinks Market Revenue (US$ Mn) Comparison by Region (2016-2032)
- Table 8: Global Energy Drinks Market Revenue (US$ Mn) (2016-2032)
- Table 9: Global Energy Drinks Market Revenue (US$ Mn) Comparison by Region (2016-2032)
- Table 10: Global Energy Drinks Market Revenue (US$ Mn) Comparison by Product Type (2016-2032)
- Table 11: Global Energy Drinks Market Revenue (US$ Mn) Comparison by Packaging Type (2016-2032)
- Table 12: Global Energy Drinks Market Revenue (US$ Mn) Comparison by Format (2016-2032)
- Table 13: Global Energy Drinks Market Revenue (US$ Mn) Comparison by Type (2016-2032)
- Table 14: Global Energy Drinks Market Revenue (US$ Mn) Comparison by Ingredients (2016-2032)
- Table 15: Global Energy Drinks Market Revenue (US$ Mn) Comparison by Distribution Channel (2016-2032)
- Table 16: Global Energy Drinks Market Y-o-Y Growth Rate Comparison by Region (2016-2032)
- Table 17: Global Energy Drinks Market Y-o-Y Growth Rate Comparison by Product Type (2016-2032)
- Table 18: Global Energy Drinks Market Y-o-Y Growth Rate Comparison by Packaging Type (2016-2032)
- Table 19: Global Energy Drinks Market Y-o-Y Growth Rate Comparison by Format (2016-2032)
- Table 20: Global Energy Drinks Market Y-o-Y Growth Rate Comparison by Type (2016-2032)
- Table 21: Global Energy Drinks Market Y-o-Y Growth Rate Comparison by Ingredients (2016-2032)
- Table 22: Global Energy Drinks Market Y-o-Y Growth Rate Comparison by Distribution Channel (2016-2032)
- Table 23: Global Energy Drinks Market Share Comparison by Region (2016-2032)
- Table 24: Global Energy Drinks Market Share Comparison by Product Type (2016-2032)
- Table 25: Global Energy Drinks Market Share Comparison by Packaging Type (2016-2032)
- Table 26: Global Energy Drinks Market Share Comparison by Format (2016-2032)
- Table 27: Global Energy Drinks Market Share Comparison by Type (2016-2032)
- Table 28: Global Energy Drinks Market Share Comparison by Ingredients (2016-2032)
- Table 29: Global Energy Drinks Market Share Comparison by Distribution Channel (2016-2032)
- Table 30: North America Energy Drinks Market Comparison by Packaging Type (2016-2032)
- Table 31: North America Energy Drinks Market Comparison by Format (2016-2032)
- Table 32: North America Energy Drinks Market Comparison by Type (2016-2032)
- Table 33: North America Energy Drinks Market Comparison by Ingredients (2016-2032)
- Table 34: North America Energy Drinks Market Comparison by Distribution Channel (2016-2032)
- Table 35: North America Energy Drinks Market Revenue (US$ Mn) Comparison by Country (2016-2032)
- Table 36: North America Energy Drinks Market Revenue (US$ Mn) (2016-2032)
- Table 37: North America Energy Drinks Market Revenue (US$ Mn) Comparison by Country (2016-2032)
- Table 38: North America Energy Drinks Market Revenue (US$ Mn) Comparison by Product Type (2016-2032)
- Table 39: North America Energy Drinks Market Revenue (US$ Mn) Comparison by Packaging Type (2016-2032)
- Table 40: North America Energy Drinks Market Revenue (US$ Mn) Comparison by Format (2016-2032)
- Table 41: North America Energy Drinks Market Revenue (US$ Mn) Comparison by Type (2016-2032)
- Table 42: North America Energy Drinks Market Revenue (US$ Mn) Comparison by Ingredients (2016-2032)
- Table 43: North America Energy Drinks Market Revenue (US$ Mn) Comparison by Distribution Channel (2016-2032)
- Table 44: North America Energy Drinks Market Y-o-Y Growth Rate Comparison by Country (2016-2032)
- Table 45: North America Energy Drinks Market Y-o-Y Growth Rate Comparison by Product Type (2016-2032)
- Table 46: North America Energy Drinks Market Y-o-Y Growth Rate Comparison by Packaging Type (2016-2032)
- Table 47: North America Energy Drinks Market Y-o-Y Growth Rate Comparison by Format (2016-2032)
- Table 48: North America Energy Drinks Market Y-o-Y Growth Rate Comparison by Type (2016-2032)
- Table 49: North America Energy Drinks Market Y-o-Y Growth Rate Comparison by Ingredients (2016-2032)
- Table 50: North America Energy Drinks Market Y-o-Y Growth Rate Comparison by Distribution Channel (2016-2032)
- Table 51: North America Energy Drinks Market Share Comparison by Country (2016-2032)
- Table 52: North America Energy Drinks Market Share Comparison by Product Type (2016-2032)
- Table 53: North America Energy Drinks Market Share Comparison by Packaging Type (2016-2032)
- Table 54: North America Energy Drinks Market Share Comparison by Format (2016-2032)
- Table 55: North America Energy Drinks Market Share Comparison by Type (2016-2032)
- Table 56: North America Energy Drinks Market Share Comparison by Ingredients (2016-2032)
- Table 57: North America Energy Drinks Market Share Comparison by Distribution Channel (2016-2032)
- Table 58: Western Europe Energy Drinks Market Comparison by Product Type (2016-2032)
- Table 59: Western Europe Energy Drinks Market Comparison by Packaging Type (2016-2032)
- Table 60: Western Europe Energy Drinks Market Comparison by Format (2016-2032)
- Table 61: Western Europe Energy Drinks Market Comparison by Type (2016-2032)
- Table 62: Western Europe Energy Drinks Market Comparison by Ingredients (2016-2032)
- Table 63: Western Europe Energy Drinks Market Comparison by Distribution Channel (2016-2032)
- Table 64: Western Europe Energy Drinks Market Revenue (US$ Mn) Comparison by Country (2016-2032)
- Table 65: Western Europe Energy Drinks Market Revenue (US$ Mn) (2016-2032)
- Table 66: Western Europe Energy Drinks Market Revenue (US$ Mn) Comparison by Country (2016-2032)
- Table 67: Western Europe Energy Drinks Market Revenue (US$ Mn) Comparison by Product Type (2016-2032)
- Table 68: Western Europe Energy Drinks Market Revenue (US$ Mn) Comparison by Packaging Type (2016-2032)
- Table 69: Western Europe Energy Drinks Market Revenue (US$ Mn) Comparison by Format (2016-2032)
- Table 70: Western Europe Energy Drinks Market Revenue (US$ Mn) Comparison by Type (2016-2032)
- Table 71: Western Europe Energy Drinks Market Revenue (US$ Mn) Comparison by Ingredients (2016-2032)
- Table 72: Western Europe Energy Drinks Market Revenue (US$ Mn) Comparison by Distribution Channel (2016-2032)
- Table 73: Western Europe Energy Drinks Market Y-o-Y Growth Rate Comparison by Country (2016-2032)
- Table 74: Western Europe Energy Drinks Market Y-o-Y Growth Rate Comparison by Product Type (2016-2032)
- Table 75: Western Europe Energy Drinks Market Y-o-Y Growth Rate Comparison by Packaging Type (2016-2032)
- Table 76: Western Europe Energy Drinks Market Y-o-Y Growth Rate Comparison by Format (2016-2032)
- Table 77: Western Europe Energy Drinks Market Y-o-Y Growth Rate Comparison by Type (2016-2032)
- Table 78: Western Europe Energy Drinks Market Y-o-Y Growth Rate Comparison by Ingredients (2016-2032)
- Table 79: Western Europe Energy Drinks Market Y-o-Y Growth Rate Comparison by Distribution Channel (2016-2032)
- Table 80: Western Europe Energy Drinks Market Share Comparison by Country (2016-2032)
- Table 81: Western Europe Energy Drinks Market Share Comparison by Product Type (2016-2032)
- Table 82: Western Europe Energy Drinks Market Share Comparison by Packaging Type (2016-2032)
- Table 83: Western Europe Energy Drinks Market Share Comparison by Format (2016-2032)
- Table 84: Western Europe Energy Drinks Market Share Comparison by Type (2016-2032)
- Table 85: Western Europe Energy Drinks Market Share Comparison by Ingredients (2016-2032)
- Table 86: Western Europe Energy Drinks Market Share Comparison by Distribution Channel (2016-2032)
- Table 87: Eastern Europe Energy Drinks Market Comparison by Product Type (2016-2032)
- Table 88: Eastern Europe Energy Drinks Market Comparison by Packaging Type (2016-2032)
- Table 89: Eastern Europe Energy Drinks Market Comparison by Format (2016-2032)
- Table 90: Eastern Europe Energy Drinks Market Comparison by Type (2016-2032)
- Table 91: Eastern Europe Energy Drinks Market Comparison by Ingredients (2016-2032)
- Table 92: Eastern Europe Energy Drinks Market Comparison by Distribution Channel (2016-2032)
- Table 93: Eastern Europe Energy Drinks Market Revenue (US$ Mn) Comparison by Country (2016-2032)
- Table 94: Eastern Europe Energy Drinks Market Revenue (US$ Mn) (2016-2032)
- Table 95: Eastern Europe Energy Drinks Market Revenue (US$ Mn) Comparison by Country (2016-2032)
- Table 96: Eastern Europe Energy Drinks Market Revenue (US$ Mn) Comparison by Product Type (2016-2032)
- Table 97: Eastern Europe Energy Drinks Market Revenue (US$ Mn) Comparison by Packaging Type (2016-2032)
- Table 98: Eastern Europe Energy Drinks Market Revenue (US$ Mn) Comparison by Format (2016-2032)
- Table 99: Eastern Europe Energy Drinks Market Revenue (US$ Mn) Comparison by Type (2016-2032)
- Table 100: Eastern Europe Energy Drinks Market Revenue (US$ Mn) Comparison by Ingredients (2016-2032)
- Table 101: Eastern Europe Energy Drinks Market Revenue (US$ Mn) Comparison by Distribution Channel (2016-2032)
- Table 102: Eastern Europe Energy Drinks Market Y-o-Y Growth Rate Comparison by Country (2016-2032)
- Table 103: Eastern Europe Energy Drinks Market Y-o-Y Growth Rate Comparison by Product Type (2016-2032)
- Table 104: Eastern Europe Energy Drinks Market Y-o-Y Growth Rate Comparison by Packaging Type (2016-2032)
- Table 105: Eastern Europe Energy Drinks Market Y-o-Y Growth Rate Comparison by Format (2016-2032)
- Table 106: Eastern Europe Energy Drinks Market Y-o-Y Growth Rate Comparison by Type (2016-2032)
- Table 107: Eastern Europe Energy Drinks Market Y-o-Y Growth Rate Comparison by Ingredients (2016-2032)
- Table 108: Eastern Europe Energy Drinks Market Y-o-Y Growth Rate Comparison by Distribution Channel (2016-2032)
- Table 109: Eastern Europe Energy Drinks Market Share Comparison by Country (2016-2032)
- Table 110: Eastern Europe Energy Drinks Market Share Comparison by Product Type (2016-2032)
- Table 111: Eastern Europe Energy Drinks Market Share Comparison by Packaging Type (2016-2032)
- Table 112: Eastern Europe Energy Drinks Market Share Comparison by Format (2016-2032)
- Table 113: Eastern Europe Energy Drinks Market Share Comparison by Type (2016-2032)
- Table 114: Eastern Europe Energy Drinks Market Share Comparison by Ingredients (2016-2032)
- Table 115: Eastern Europe Energy Drinks Market Share Comparison by Distribution Channel (2016-2032)
- Table 116: APAC Energy Drinks Market Comparison by Product Type (2016-2032)
- Table 117: APAC Energy Drinks Market Comparison by Packaging Type (2016-2032)
- Table 118: APAC Energy Drinks Market Comparison by Format (2016-2032)
- Table 119: APAC Energy Drinks Market Comparison by Type (2016-2032)
- Table 120: APAC Energy Drinks Market Comparison by Ingredients (2016-2032)
- Table 121: APAC Energy Drinks Market Comparison by Distribution Channel (2016-2032)
- Table 122: APAC Energy Drinks Market Revenue (US$ Mn) Comparison by Country (2016-2032)
- Table 123: APAC Energy Drinks Market Revenue (US$ Mn) (2016-2032)
- Table 124: APAC Energy Drinks Market Revenue (US$ Mn) Comparison by Country (2016-2032)
- Table 125: APAC Energy Drinks Market Revenue (US$ Mn) Comparison by Product Type (2016-2032)
- Table 126: APAC Energy Drinks Market Revenue (US$ Mn) Comparison by Packaging Type (2016-2032)
- Table 127: APAC Energy Drinks Market Revenue (US$ Mn) Comparison by Format (2016-2032)
- Table 128: APAC Energy Drinks Market Revenue (US$ Mn) Comparison by Type (2016-2032)
- Table 129: APAC Energy Drinks Market Revenue (US$ Mn) Comparison by Ingredients (2016-2032)
- Table 130: APAC Energy Drinks Market Revenue (US$ Mn) Comparison by Distribution Channel (2016-2032)
- Table 131: APAC Energy Drinks Market Y-o-Y Growth Rate Comparison by Country (2016-2032)
- Table 132: APAC Energy Drinks Market Y-o-Y Growth Rate Comparison by Product Type (2016-2032)
- Table 133: APAC Energy Drinks Market Y-o-Y Growth Rate Comparison by Packaging Type (2016-2032)
- Table 134: APAC Energy Drinks Market Y-o-Y Growth Rate Comparison by Format (2016-2032)
- Table 135: APAC Energy Drinks Market Y-o-Y Growth Rate Comparison by Type (2016-2032)
- Table 136: APAC Energy Drinks Market Y-o-Y Growth Rate Comparison by Ingredients (2016-2032)
- Table 137: APAC Energy Drinks Market Y-o-Y Growth Rate Comparison by Distribution Channel (2016-2032)
- Table 138: APAC Energy Drinks Market Share Comparison by Country (2016-2032)
- Table 139: APAC Energy Drinks Market Share Comparison by Product Type (2016-2032)
- Table 140: APAC Energy Drinks Market Share Comparison by Packaging Type (2016-2032)
- Table 141: APAC Energy Drinks Market Share Comparison by Format (2016-2032)
- Table 142: APAC Energy Drinks Market Share Comparison by Type (2016-2032)
- Table 143: APAC Energy Drinks Market Share Comparison by Ingredients (2016-2032)
- Table 144: APAC Energy Drinks Market Share Comparison by Distribution Channel (2016-2032)
- Table 145: Latin America Energy Drinks Market Comparison by Product Type (2016-2032)
- Table 146: Latin America Energy Drinks Market Comparison by Packaging Type (2016-2032)
- Table 147: Latin America Energy Drinks Market Comparison by Format (2016-2032)
- Table 148: Latin America Energy Drinks Market Comparison by Type (2016-2032)
- Table 149: Latin America Energy Drinks Market Comparison by Ingredients (2016-2032)
- Table 150: Latin America Energy Drinks Market Comparison by Distribution Channel (2016-2032)
- Table 151: Latin America Energy Drinks Market Revenue (US$ Mn) Comparison by Country (2016-2032)
- Table 152: Latin America Energy Drinks Market Revenue (US$ Mn) (2016-2032)
- Table 153: Latin America Energy Drinks Market Revenue (US$ Mn) Comparison by Country (2016-2032)
- Table 154: Latin America Energy Drinks Market Revenue (US$ Mn) Comparison by Product Type (2016-2032)
- Table 155: Latin America Energy Drinks Market Revenue (US$ Mn) Comparison by Packaging Type (2016-2032)
- Table 156: Latin America Energy Drinks Market Revenue (US$ Mn) Comparison by Format (2016-2032)
- Table 157: Latin America Energy Drinks Market Revenue (US$ Mn) Comparison by Type (2016-2032)
- Table 158: Latin America Energy Drinks Market Revenue (US$ Mn) Comparison by Ingredients (2016-2032)
- Table 159: Latin America Energy Drinks Market Revenue (US$ Mn) Comparison by Distribution Channel (2016-2032)
- Table 160: Latin America Energy Drinks Market Y-o-Y Growth Rate Comparison by Country (2016-2032)
- Table 161: Latin America Energy Drinks Market Y-o-Y Growth Rate Comparison by Product Type (2016-2032)
- Table 162: Latin America Energy Drinks Market Y-o-Y Growth Rate Comparison by Packaging Type (2016-2032)
- Table 163: Latin America Energy Drinks Market Y-o-Y Growth Rate Comparison by Format (2016-2032)
- Table 164: Latin America Energy Drinks Market Y-o-Y Growth Rate Comparison by Type (2016-2032)
- Table 165: Latin America Energy Drinks Market Y-o-Y Growth Rate Comparison by Ingredients (2016-2032)
- Table 166: Latin America Energy Drinks Market Y-o-Y Growth Rate Comparison by Distribution Channel (2016-2032)
- Table 167: Latin America Energy Drinks Market Share Comparison by Country (2016-2032)
- Table 168: Latin America Energy Drinks Market Share Comparison by Product Type (2016-2032)
- Table 169: Latin America Energy Drinks Market Share Comparison by Packaging Type (2016-2032)
- Table 170: Latin America Energy Drinks Market Share Comparison by Format (2016-2032)
- Table 171: Latin America Energy Drinks Market Share Comparison by Type (2016-2032)
- Table 172: Latin America Energy Drinks Market Share Comparison by Ingredients (2016-2032)
- Table 173: Latin America Energy Drinks Market Share Comparison by Distribution Channel (2016-2032)
- Table 174: Middle East & Africa Energy Drinks Market Comparison by Product Type (2016-2032)
- Table 175: Middle East & Africa Energy Drinks Market Comparison by Packaging Type (2016-2032)
- Table 176: Middle East & Africa Energy Drinks Market Comparison by Format (2016-2032)
- Table 177: Middle East & Africa Energy Drinks Market Comparison by Type (2016-2032)
- Table 178: Middle East & Africa Energy Drinks Market Comparison by Ingredients (2016-2032)
- Table 179: Middle East & Africa Energy Drinks Market Comparison by Distribution Channel (2016-2032)
- Table 180: Middle East & Africa Energy Drinks Market Revenue (US$ Mn) Comparison by Country (2016-2032)
- Table 181: Middle East & Africa Energy Drinks Market Revenue (US$ Mn) (2016-2032)
- Table 182: Middle East & Africa Energy Drinks Market Revenue (US$ Mn) Comparison by Country (2016-2032)
- Table 183: Middle East & Africa Energy Drinks Market Revenue (US$ Mn) Comparison by Product Type (2016-2032)
- Table 184: Middle East & Africa Energy Drinks Market Revenue (US$ Mn) Comparison by Packaging Type (2016-2032)
- Table 185: Middle East & Africa Energy Drinks Market Revenue (US$ Mn) Comparison by Format (2016-2032)
- Table 186: Middle East & Africa Energy Drinks Market Revenue (US$ Mn) Comparison by Type (2016-2032)
- Table 187: Middle East & Africa Energy Drinks Market Revenue (US$ Mn) Comparison by Ingredients (2016-2032)
- Table 188: Middle East & Africa Energy Drinks Market Revenue (US$ Mn) Comparison by Distribution Channel (2016-2032)
- Table 189: Middle East & Africa Energy Drinks Market Y-o-Y Growth Rate Comparison by Country (2016-2032)
- Table 190: Middle East & Africa Energy Drinks Market Y-o-Y Growth Rate Comparison by Product Type (2016-2032)
- Table 191: Middle East & Africa Energy Drinks Market Y-o-Y Growth Rate Comparison by Packaging Type (2016-2032)
- Table 192: Middle East & Africa Energy Drinks Market Y-o-Y Growth Rate Comparison by Format (2016-2032)
- Table 193: Middle East & Africa Energy Drinks Market Y-o-Y Growth Rate Comparison by Type (2016-2032)
- Table 194: Middle East & Africa Energy Drinks Market Y-o-Y Growth Rate Comparison by Ingredients (2016-2032)
- Table 195: Middle East & Africa Energy Drinks Market Y-o-Y Growth Rate Comparison by Distribution Channel (2016-2032)
- Table 196: Middle East & Africa Energy Drinks Market Share Comparison by Country (2016-2032)
- Table 197: Middle East & Africa Energy Drinks Market Share Comparison by Product Type (2016-2032)
- Table 198: Middle East & Africa Energy Drinks Market Share Comparison by Packaging Type (2016-2032)
- Table 199: Middle East & Africa Energy Drinks Market Share Comparison by Format (2016-2032)
- Table 200: Middle East & Africa Energy Drinks Market Share Comparison by Type (2016-2032)
- Table 201: Middle East & Africa Energy Drinks Market Share Comparison by Ingredients (2016-2032)
- Table 202: Middle East & Africa Energy Drinks Market Share Comparison by Distribution Channel (2016-2032)
- 1. Executive Summary
-
- Aje Group
- Carabao Group Public Company Limited
- Congo Brands
- Hell Energy Magyarország Korlátolt Felelosségu Társaság
- Living Essentials, LLC
- Monster Beverage Corporation
- Osotspa Public Company Limited
- PepsiCo, Inc.
- Red Bull GmbH
- Suntory Holdings Limited
- T.C. Pharmaceutical Industries Company Limited
- Taisho Pharmaceutical Holdings Co., Ltd.
- The Coca-Cola Company
Our Clients


View Our Licence Options
